Article

3D-Printed Conductive Polymers as Alternative for Bioelectrochemical Systems Electrodes: Abiotic Study and Biotic Start-Up

by
Alberto Mur-Gorgas
1,
Susana Martínez-Pellitero
2,
Tamara Joglar
1,
Adrián Escapa
1,3 and
Raúl Mateos
1,*
1
Chemical and Environmental Bioprocess Engineering Group, I4 Institute, University of León, 24071 León, Spain
2
Area of Manufacturing Engineering, University of León, 24071 León, Spain
3
Department of Electrical Engineering and Automatic Systems, University of León, 24071 León, Spain
*
Author to whom correspondence should be addressed.
Appl. Sci. 2024, 14(16), 7199; https://doi.org/10.3390/app14167199
Submission received: 24 July 2024 / Revised: 12 August 2024 / Accepted: 14 August 2024 / Published: 15 August 2024
(This article belongs to the Section Additive Manufacturing Technologies)

Abstract

:
Despite over two decades of intense research into bioelectrochemical systems (BESs), their practical implementation remains unrealized, partly due to the low performance of bioelectrodes. With the introduction of additive manufacturing techniques, the development of a new generation of bioelectrodes with custom-shaped geometries using conductive composites has become feasible. This study examines the potential of using two conductive composites, Poly-lactic acid (PLA) and thermoplastic polyurethane (TPU), for 3D-printed electrodes. Electrochemical characterization reveals that TPU has a charge transfer resistance approximately two orders of magnitude higher than PLA, rendering it unsuitable for bioelectrodes. The presence of triangular patterns enhances the performance of planar electrodes, with optimal results observed for PLA-based electrodes with surface pattern depths between 0.6 and 1.4 mm. Additionally, electrodeposition (ED) of graphene oxide (GO) further improves performance across all cases. During the subsequent biotic start-up, patterned PLA electrodes with a depth of 1.4 mm exhibit higher current. However, these 3D-printed electrodes exhibit degradation after 56 days of operation.

1. Introduction

The term bioelectrochemical systems (BESs) encompasses a group of technologies that have aroused a great interest in both industrial and academic spheres in recent years [1]. BESs, which can be seen as a combination of electrochemical and biological processes, hold significant potential for practical application across different industrial sectors, spanning energy production and storage, wastewater treatment, biosynthesis and biosensing, among others [2,3,4]. However, BESs have not yet been developed to a practical scale. One of the biggest challenges is related to their scalability [1], as the performance of the electrodes worsens rapidly with size [5,6]. In this regard, an efficient BES design requires electrodes capable of delivering large current densities (to minimize the size of the electrode) at low overpotentials (to optimize energy usage) [7]. Both current density and overpotential depend on many factors, the most important ones being perhaps the microbial activity and metabolism of the electroactive biofilm, the interaction between the biofilm and the electrode (i.e., a transfer of electrons) and the electrode material [8,9]. Several strategies have been adopted to optimize these factors, including the use of different sources of inoculum, [10] optimization of the electrode potential, [11] electrode surface modifications [12] and the use of different electrode materials [13]. The latter has been a hot topic in recent years, [14] and the latest advances include the incorporation of common nanomaterials, Mxenes (two-dimensional inorganic compounds along with atomically thin layers of transition metal compounds), metal–organic frameworks or conductive composites, all of which have the aim of improving conductivity and the active surface area of the electrode [13]. The use of conductive polymers (in combination with additive manufacturing techniques) as a matrix for the development of bio-electrodes in BESs is becoming increasingly common [15]. Poly-lactic acid (PLA)-based conductive composites represent a suitable alternative thanks to their relatively low cost, biocompatibility and capacity to produce custom-shaped electrode geometries [16,17,18,19,20,21]. Nevertheless, the electrochemical performance of PLA-based bioelectrodes is not always acceptable [22] because of the presence of non-conductive polymer layers on the surface of the electrode. To address this issue, surface modification techniques [23] are needed to remove part of those non-conductive layers.
In this paper, we explore the potential to enhance the performance of 3D-printed conductive planar monolithic electrodes made of PLA and TPU (thermoplastic polyurethane). Our approach involves modifying the microtopography of the electrode surfaces by creating a triangular pattern with varying depths. This modification aims to achieve two main objectives: first, to improve current production by increasing the total surface area of the electrode, and second, to promote the development and adhesion of an electroactive biofilm. Additionally, we aim to further enhance the electrochemical performance of the PLA-based electrodes by boosting surface conductivity through the electrodeposition of graphene oxide.

2. Materials and Methods

2.1. Electrode Design and Fabrication

The electrodes were designed using 3D design software. Autodesk Fusion 360 was used for the preliminary design, then an STL format was created for the use of CuraUltimaker 5.1.1, in which the printing parameters were set, and a GCode file was generated for subsequent printing on a Creality CR10-SE printer. Two materials, PLA/carbon black (Protopasta) with a reported resistance of 15 Ω·cm and TPU (Fili conductive) with a reported resistance of 27.44 Ω·cm, were used for the printing of the electrodes. For electrodeposition, a 4 mg L−1 suspension of graphene oxide (GO) in H2O (SIGMA-ALDRICH Chemie GmbH, Taufkirchen, Germany) was used as the raw material, diluting this original solution in 150mM NaCl to a final concentration of 0.5 mg mL−1. The solution was then neutralized with 0.5 M KOH and sonicated for 15 min. Subsequently, cyclic voltammetry was used for the electrodeposition (ED) from 0.8 V to −1.5 V, at a rate of 20 mV s−1 with 16 repetitions. A 3-electrode configuration was used, with the electrodeposited electrode being the working electrode. A platinum wire mesh (2 cm × 2 cm, Goodfellow, UK) was used as a counter electrode and as a reference Ag/AgCl 3M KCl, with all this in an oxygen-free atmosphere by means of nitrogen bubbling [24].
The electrode dimensions were 3 cm long × 2 cm wide × 3 mm thick. We decided to use 2 mm isosceles triangles (Figure 1) as the pattern as a compromise between the optimization of the electroactive surface and the fluid shear response. The electrodes were printed with six different pattern depths in millimeters: no pattern (NP), 0.2, 0.6, 1, 1.4 and through hole (TH). Thus, 6 different depths were used for each material. Prior to ED and characterization, the electrodes were pre-treated with pure acetone for 30 s to ensure their activation [25].

2.2. Analytical Techniques

Once the electrodes were manufactured, they were characterized by cyclovoltammetry (CV) and electrochemical impedance spectroscopy (EIS) in a 0.1 M KCl solution in which 1 mM hexanocyanoferrate (II) and 1 mM hexanocyanoferrate (III) were introduced as a redox pair. CVs were performed at a rate of 2.5 mV s−1 from 1.25 V to −1 V and was repeated three times, since different tests elucidated that these parameters gave the clearest and most complete results. For the measurement of the oxidation and reduction peaks appearing in the CVs, the anodic and cathodic decay measurements, respectively, were used as a baseline [26]. The EISs were performed from 200,000 kHz to 100 mHz with one repetition. A platinum wire of 2 cm and a 1 mm diameter (SIGMA-ALDRICH Chemie GmbH, Germany) was used as a counter electrode and as a reference Ag/AgCl 3M KCl, in single-chamber 500 mL glass bottles (SIMAX, Prague, Czech Republic). For chronoamperometry (CA) and electrochemical impedance spectroscopy (EIS), a VSP biological potentiostat was used with EC-Lab v.11.31 software. In order to try to understand how the different electrodes behave, equivalent circuits were made to obtain comparable parameters between the different elements that make up the electrical system. These equivalent circuits were made using the EC-lab program, looking for the one that best adapted to the results obtained for the EIS.

2.3. Biological Activation of Electrodes

Subsequently, the electrodes previously electrodeposited with GO were biologically activated to check their biological viability. The 3 PLA electrodes selected (0.2, 0.6 and 1.4) were placed in the same chamber to ensure that the conditions were the same for all of them. For this purpose, an inoculation was performed with a 50:30:20 ratio of river sediments, a bioanode output previously grubbed with mature biofilm and a synthetic medium, respectively. The sediments were obtained from a nearby river (Torío river, León, Spain), and the synthetic medium was composed of 2.14 g K2HPO4, 1.06 g KH2PO4, 0.02 g CaCl2, 0.015 g NaHCO3, 0.5 g NaCl, 10 mL mineral solution and 1 mL vitamin solution per liter as described in other experiments of our group [27]. The cell was fed with a total of 0.9 g of sodium acetate per cycle in 3 takes when the current was falling. These experiments were performed in 500 mL glass bottles (SIMAX, Czech Republic) with a platinum wire as a counter electrode and Ag/AgCl as a reference as explained above in Section 2.2. The working potential was set at 0.1 V vs. Ag/AgCl. After inoculation, the cells were flushed with nitrogen for 30 min to remove oxygen.
After 3 batch inoculation cycles (21 days), the current stabilized at around 7 mA and the inoculation phase was concluded. Next, the operation process was started in which 7-day batch cycles were carried out, at which time the complete medium was changed, and in which the bioanode was fed with sodium acetate every 3–4 days. Thirteen cycles (91 days) were performed. During the medium change, parameters such as dissolved oxygen, conductivity (Hach, HQ40d—two-channel digit multimeter, Hach Lange Spain, Barcelona, Spain) and pH (pH-Meter BASIC 20 +, Crison, Hach Lange Spain, Barcelona, Spain) were measured to study the evolution of the cell. Samples were also taken at the end of each cycle to measure the total organic carbon (TOC), inorganic carbon (IC) and total nitrogen (TN) using an analyzer (multi N/C 3100, Analytik, Jena, Germany). Finally, thermogravimetry was performed to check whether electrode degradation had occurred using a thermogravimetric analyzer (SDT650, TA instruments, New Castle, DE, USA). The thermogravimetry was carried out using a temperature ramp of 10 °C min−1, with a starting temperature of 25 °C and an end temperature of 900 °C in a nitrogen atmosphere. In order to be able to compare the sediment in the cells, thermogravimetry was also carried out for the GO and the PLA/carbon black filament separately. The used cell samples were collected at the end of cycle 9, and after centrifugation and drying were analyzed.

3. Results and Discussion

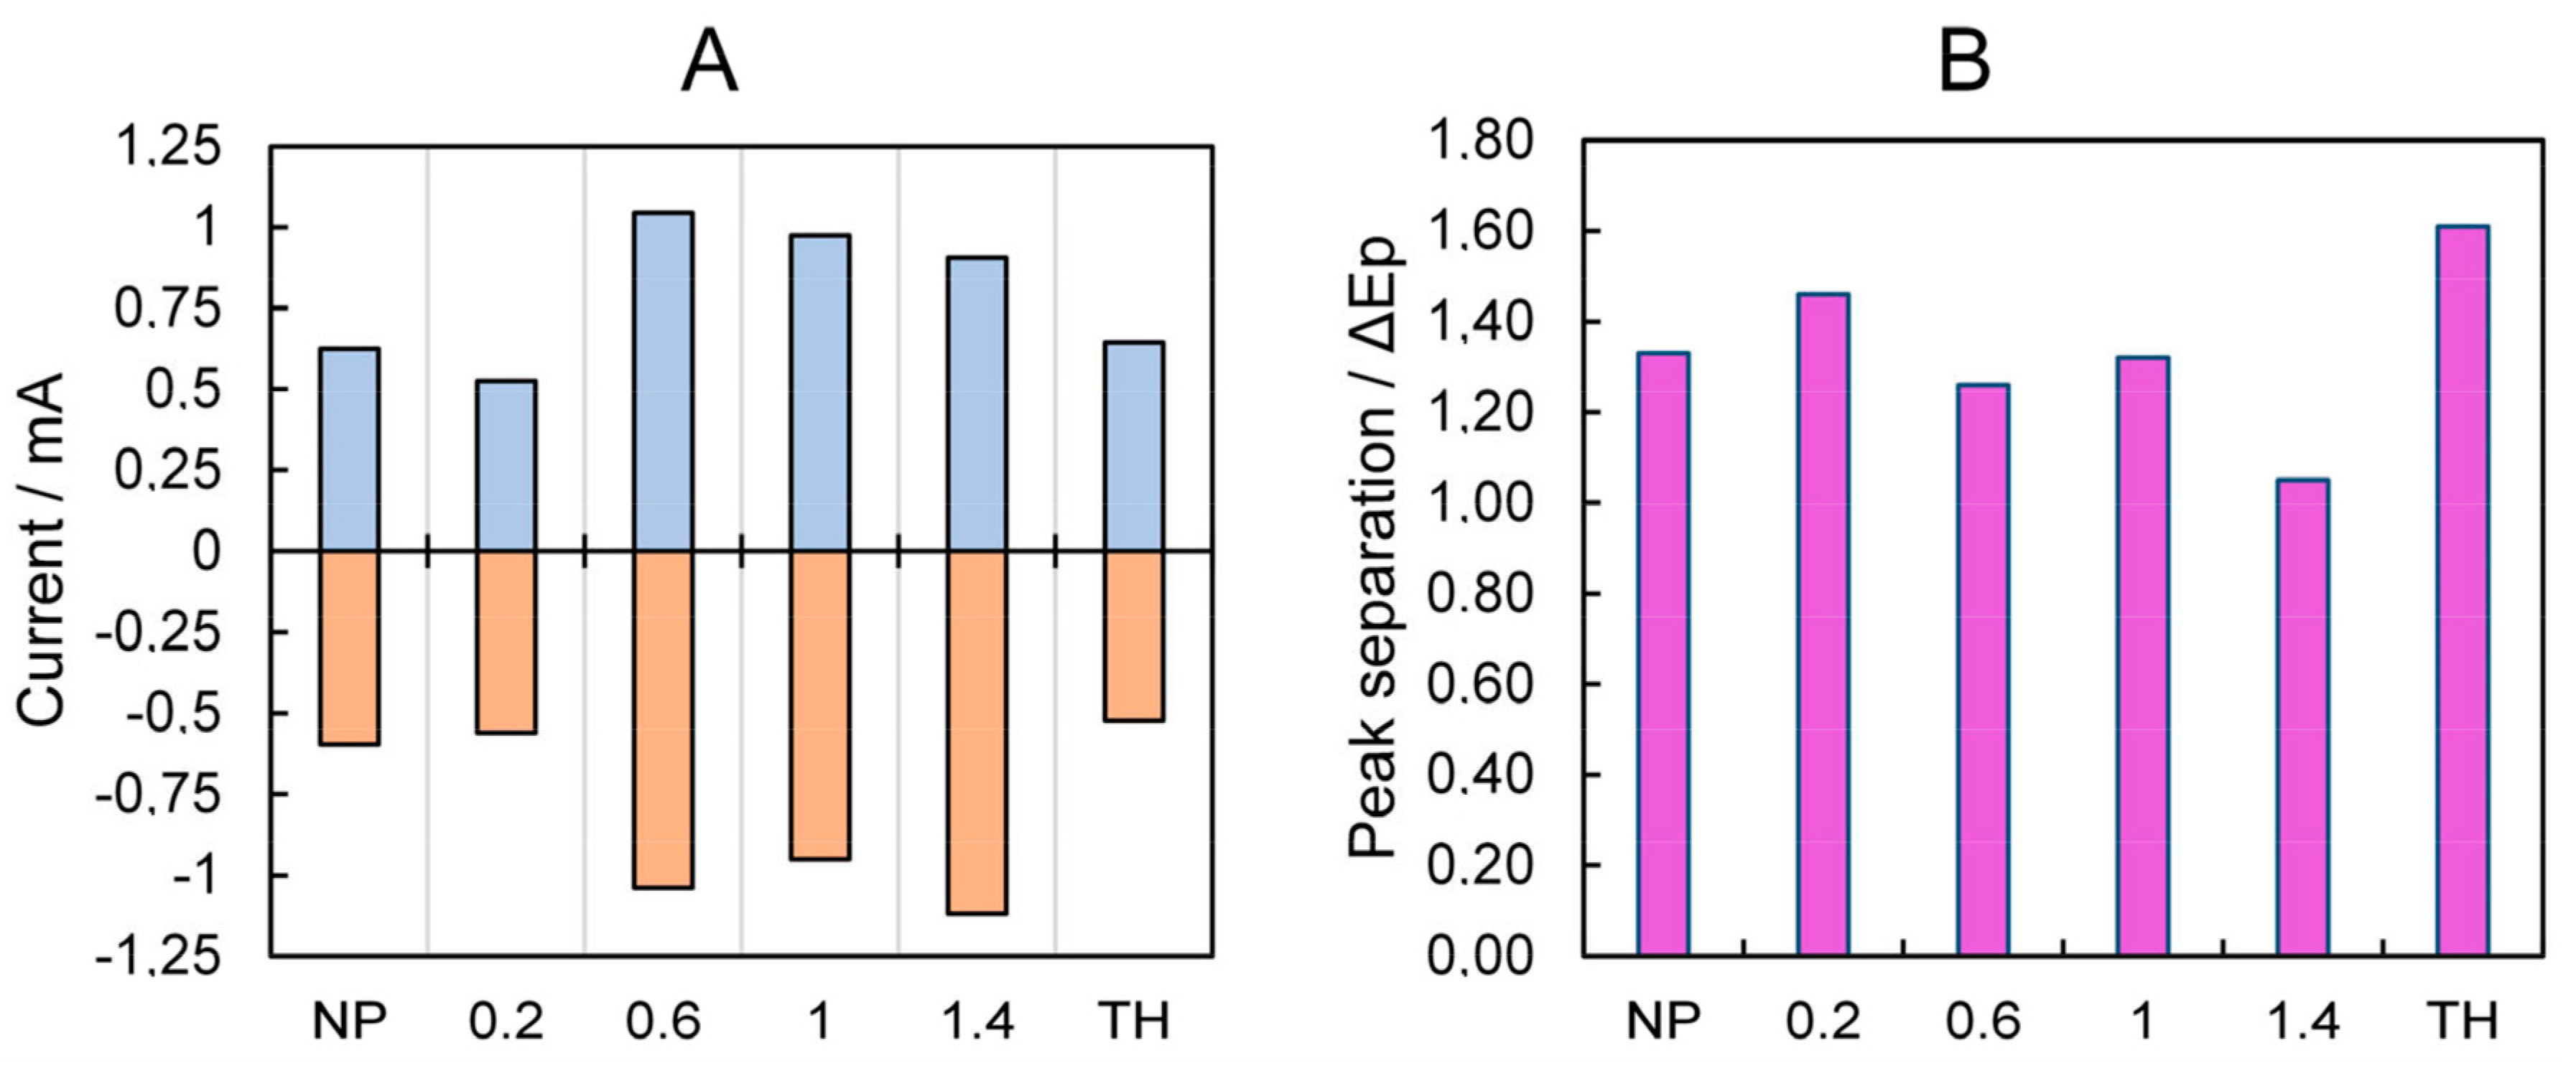
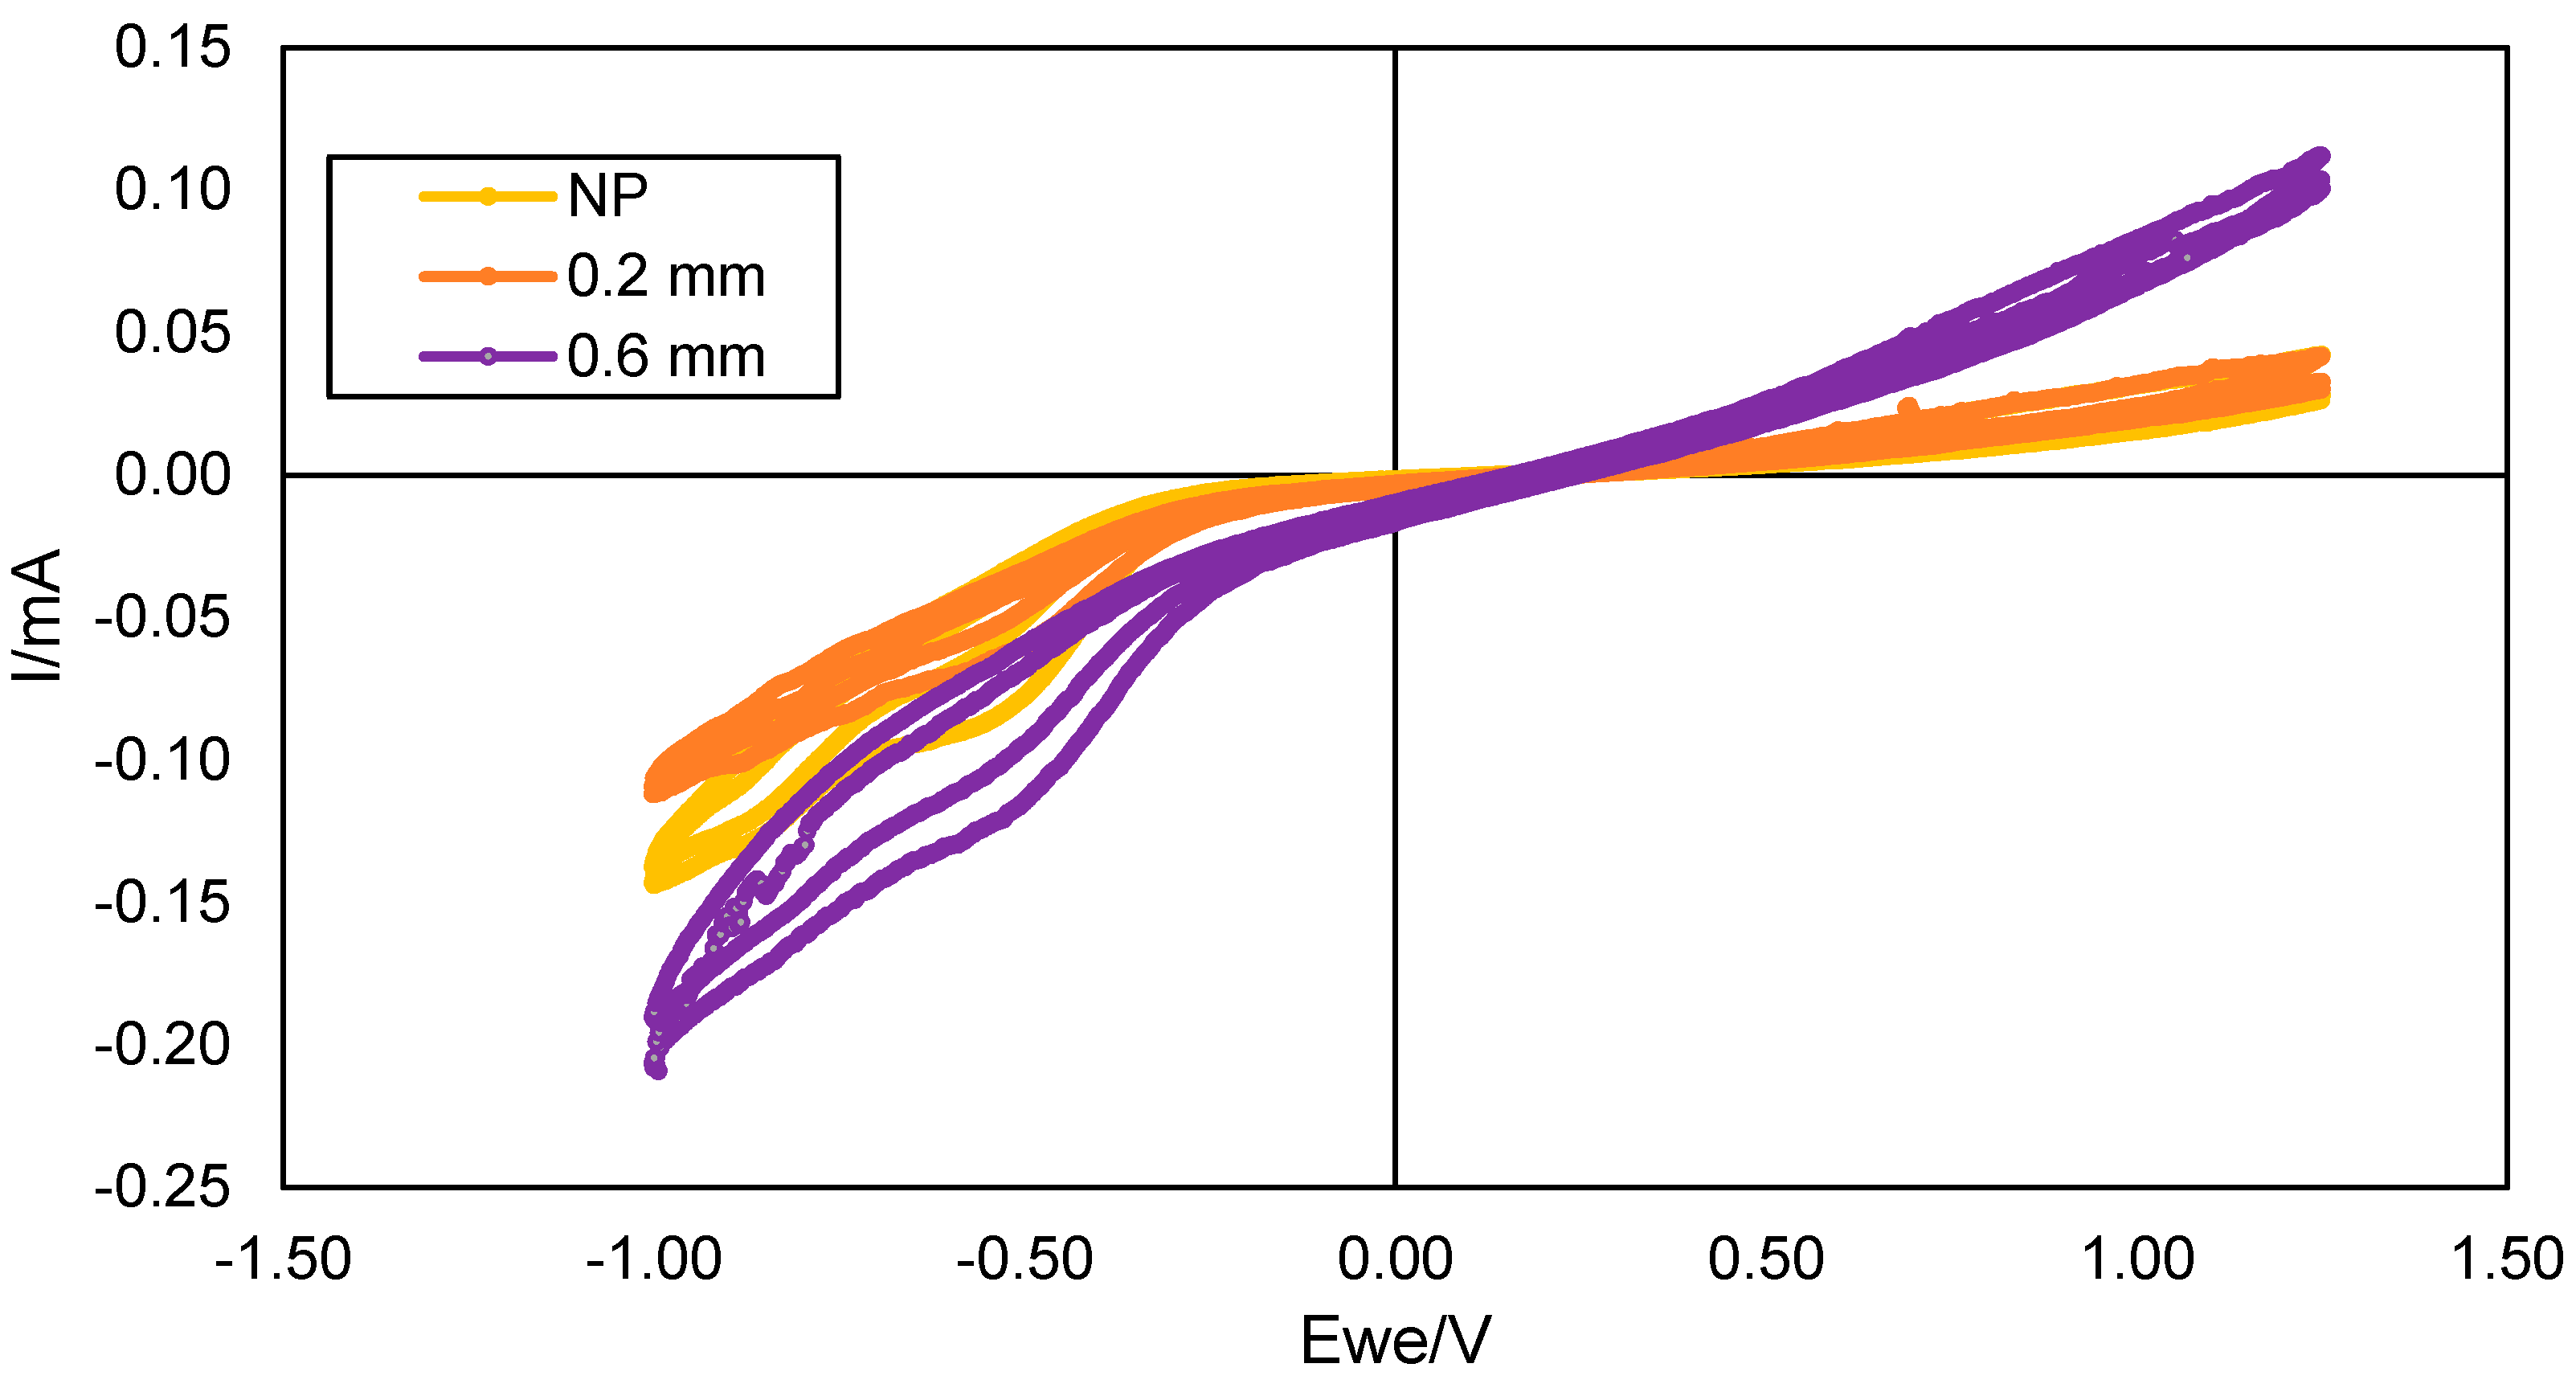
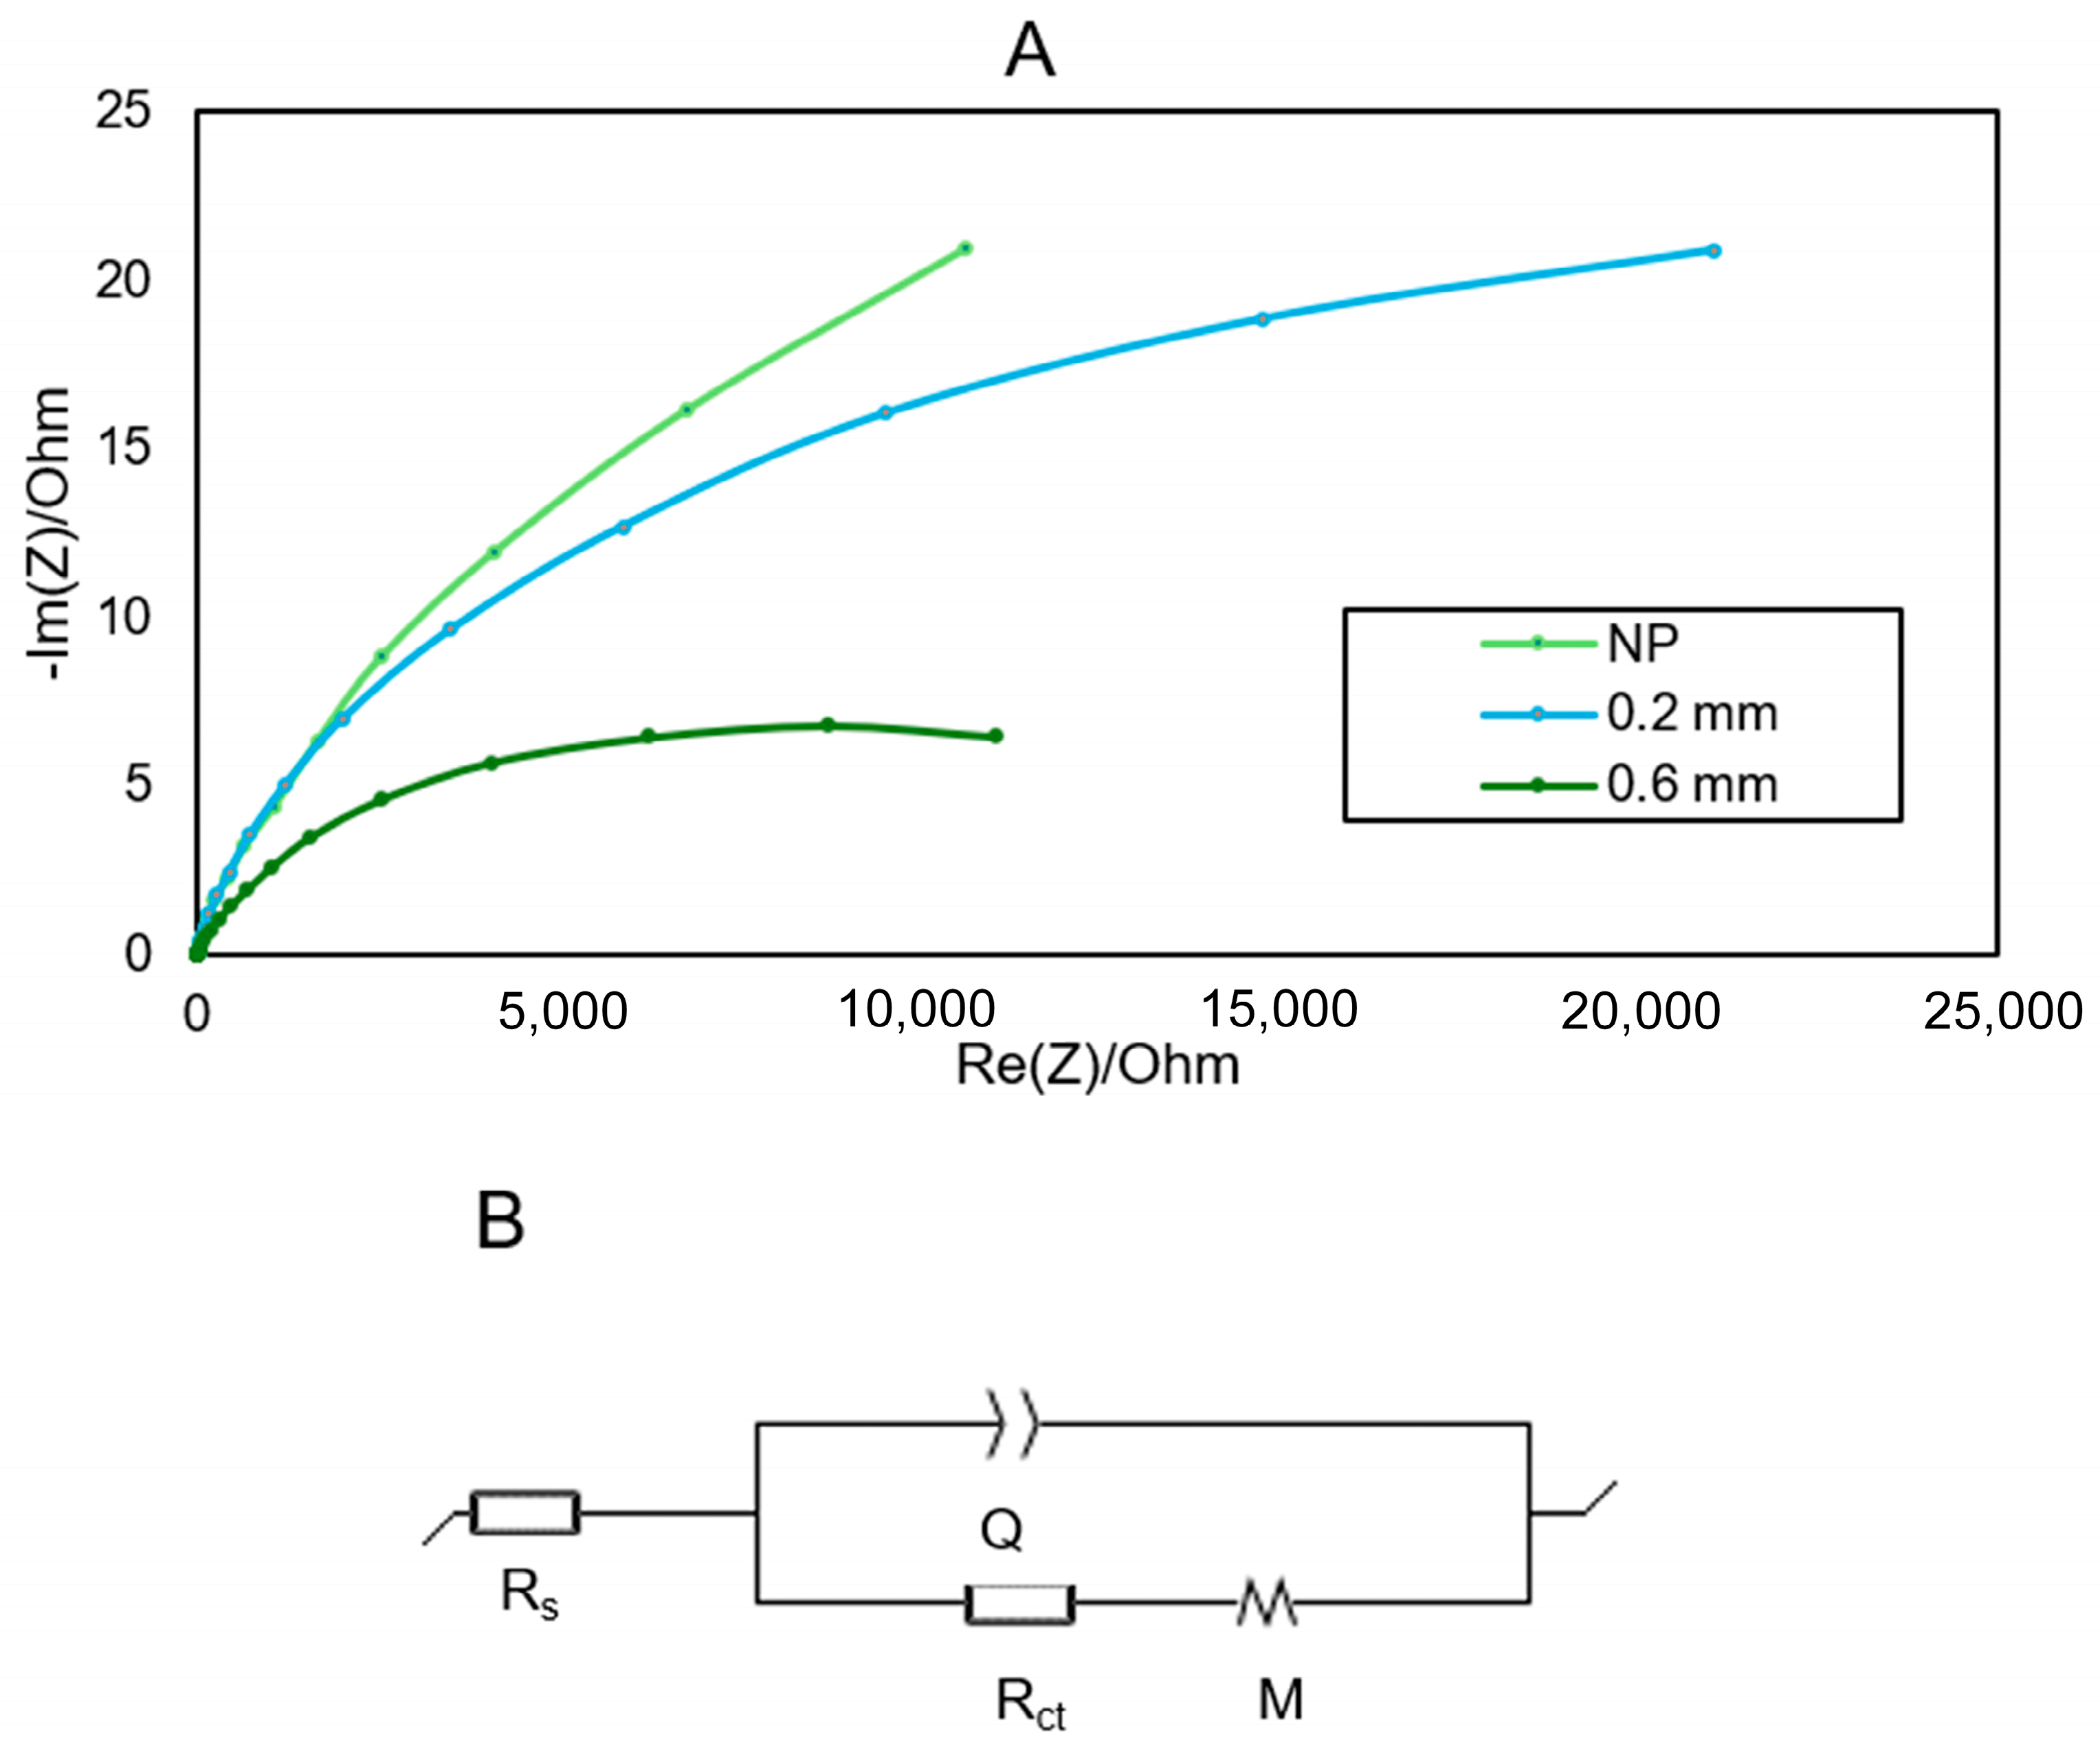
3.1. Electrochemical Characterization of the PLA Electrodes

The 3D-printed electrodes were electrochemically characterized in abiotic conditions by means of cyclic voltammetry (CV) and electrochemical impedance spectroscopy (EIS) techniques. Different depths of the triangular surface pattern (see Section 2.1) were tested to investigate the impact of electrode surface microtopography on the electrochemical performance of the electrode. CV results showed that the depth of the pattern influences the anodic and cathodic peak currents, obtaining the largest peak currents at depths of the pattern between 0.6 and 1.4 mm. Peak separation (ΔEp) indicates the reversibility of the electrochemical reaction, with smaller peak separation signifying a more reversible reaction. Although there is a slight dependence of ΔEp with the depth of the pattern (Figure 2B), the results seem to indicate that the best performance (i.e., smaller ΔEp) occurs, again, at depths of the pattern between 0.6 and 1.4 mm. In any case, the mean value of ΔEp is approximately 1.3 V, which is similar to the values reported for traditional carbon felt electrodes [28].
The CV results were complemented with EIS analyses (Figure 3), and the resulting data were fitted to a modified Randle’s equivalent electrical circuit (EEC) model (Figure 3B) consisting of an ohmic resistance (Rs) that comprises the sum of the ohmic resistances of the electrolyte, electrode and the contact resistance between the electrode and the current collector; the charge transfer resistance (Rct) that mainly covers the resistance of the electron transfer between phases; a capacitor (C) that models the biofilm and double-layer capacitance; and a generic impedance (M) representative of linear restricted diffusion [29]. This generic impedance becomes more apparent at low frequencies and is characterized by two parameters: the diffusion time constant (td1 in Table 1) and the resistance (Rd1 in Table 1) associated with the restricted linear diffusion mechanism. The corresponding model parameters are given in Table 1. Overall, the lowest Rct and Rd1 values were found for the electrodes with depths of the pattern between 0.6 and 1.4 mm which is consistent with the CV results. It seems then that these depths are favoring both charge and mass transfer. Interestingly, when increasing the depth pattern to TH, both Rct and Rd sharply increased, which indicates that the passing-through holes are limiting the electrochemical performance.

3.2. Electrochemical Characterization of the TPU Electrodes

The electrochemical characterization of the TPU electrodes revealed clearly worse performance when compared to PLA. On the one hand, the CV tests did not show any well-defined oxidation or reduction peaks (Figure 4). On the other hand, the EIS analyses showed relatively large values of charge and mass transfer resistances. The resistance associated with the electrodes is in the order of 100 times higher than that modeled for PLA electrodes. Moreover, the data fitting of the EIS experiment showed that PLA electrodes presented a pure capacitor in the place that TPU electrodes revealed a constant phase element modeling the double layer as an imperfect capacitor (Figure 5). Diffusion resistance is also higher, in the order of 100 times, except for the 0.6 electrode, and there is a higher diffusion time constant (Table 2). On the other hand, the resistance associated with the electrode and the current collector (Rs) have similar values in both materials, which seems to associate the low performance of the TPU to the double-layer phenomena and the charge transfer resistance (Rct).

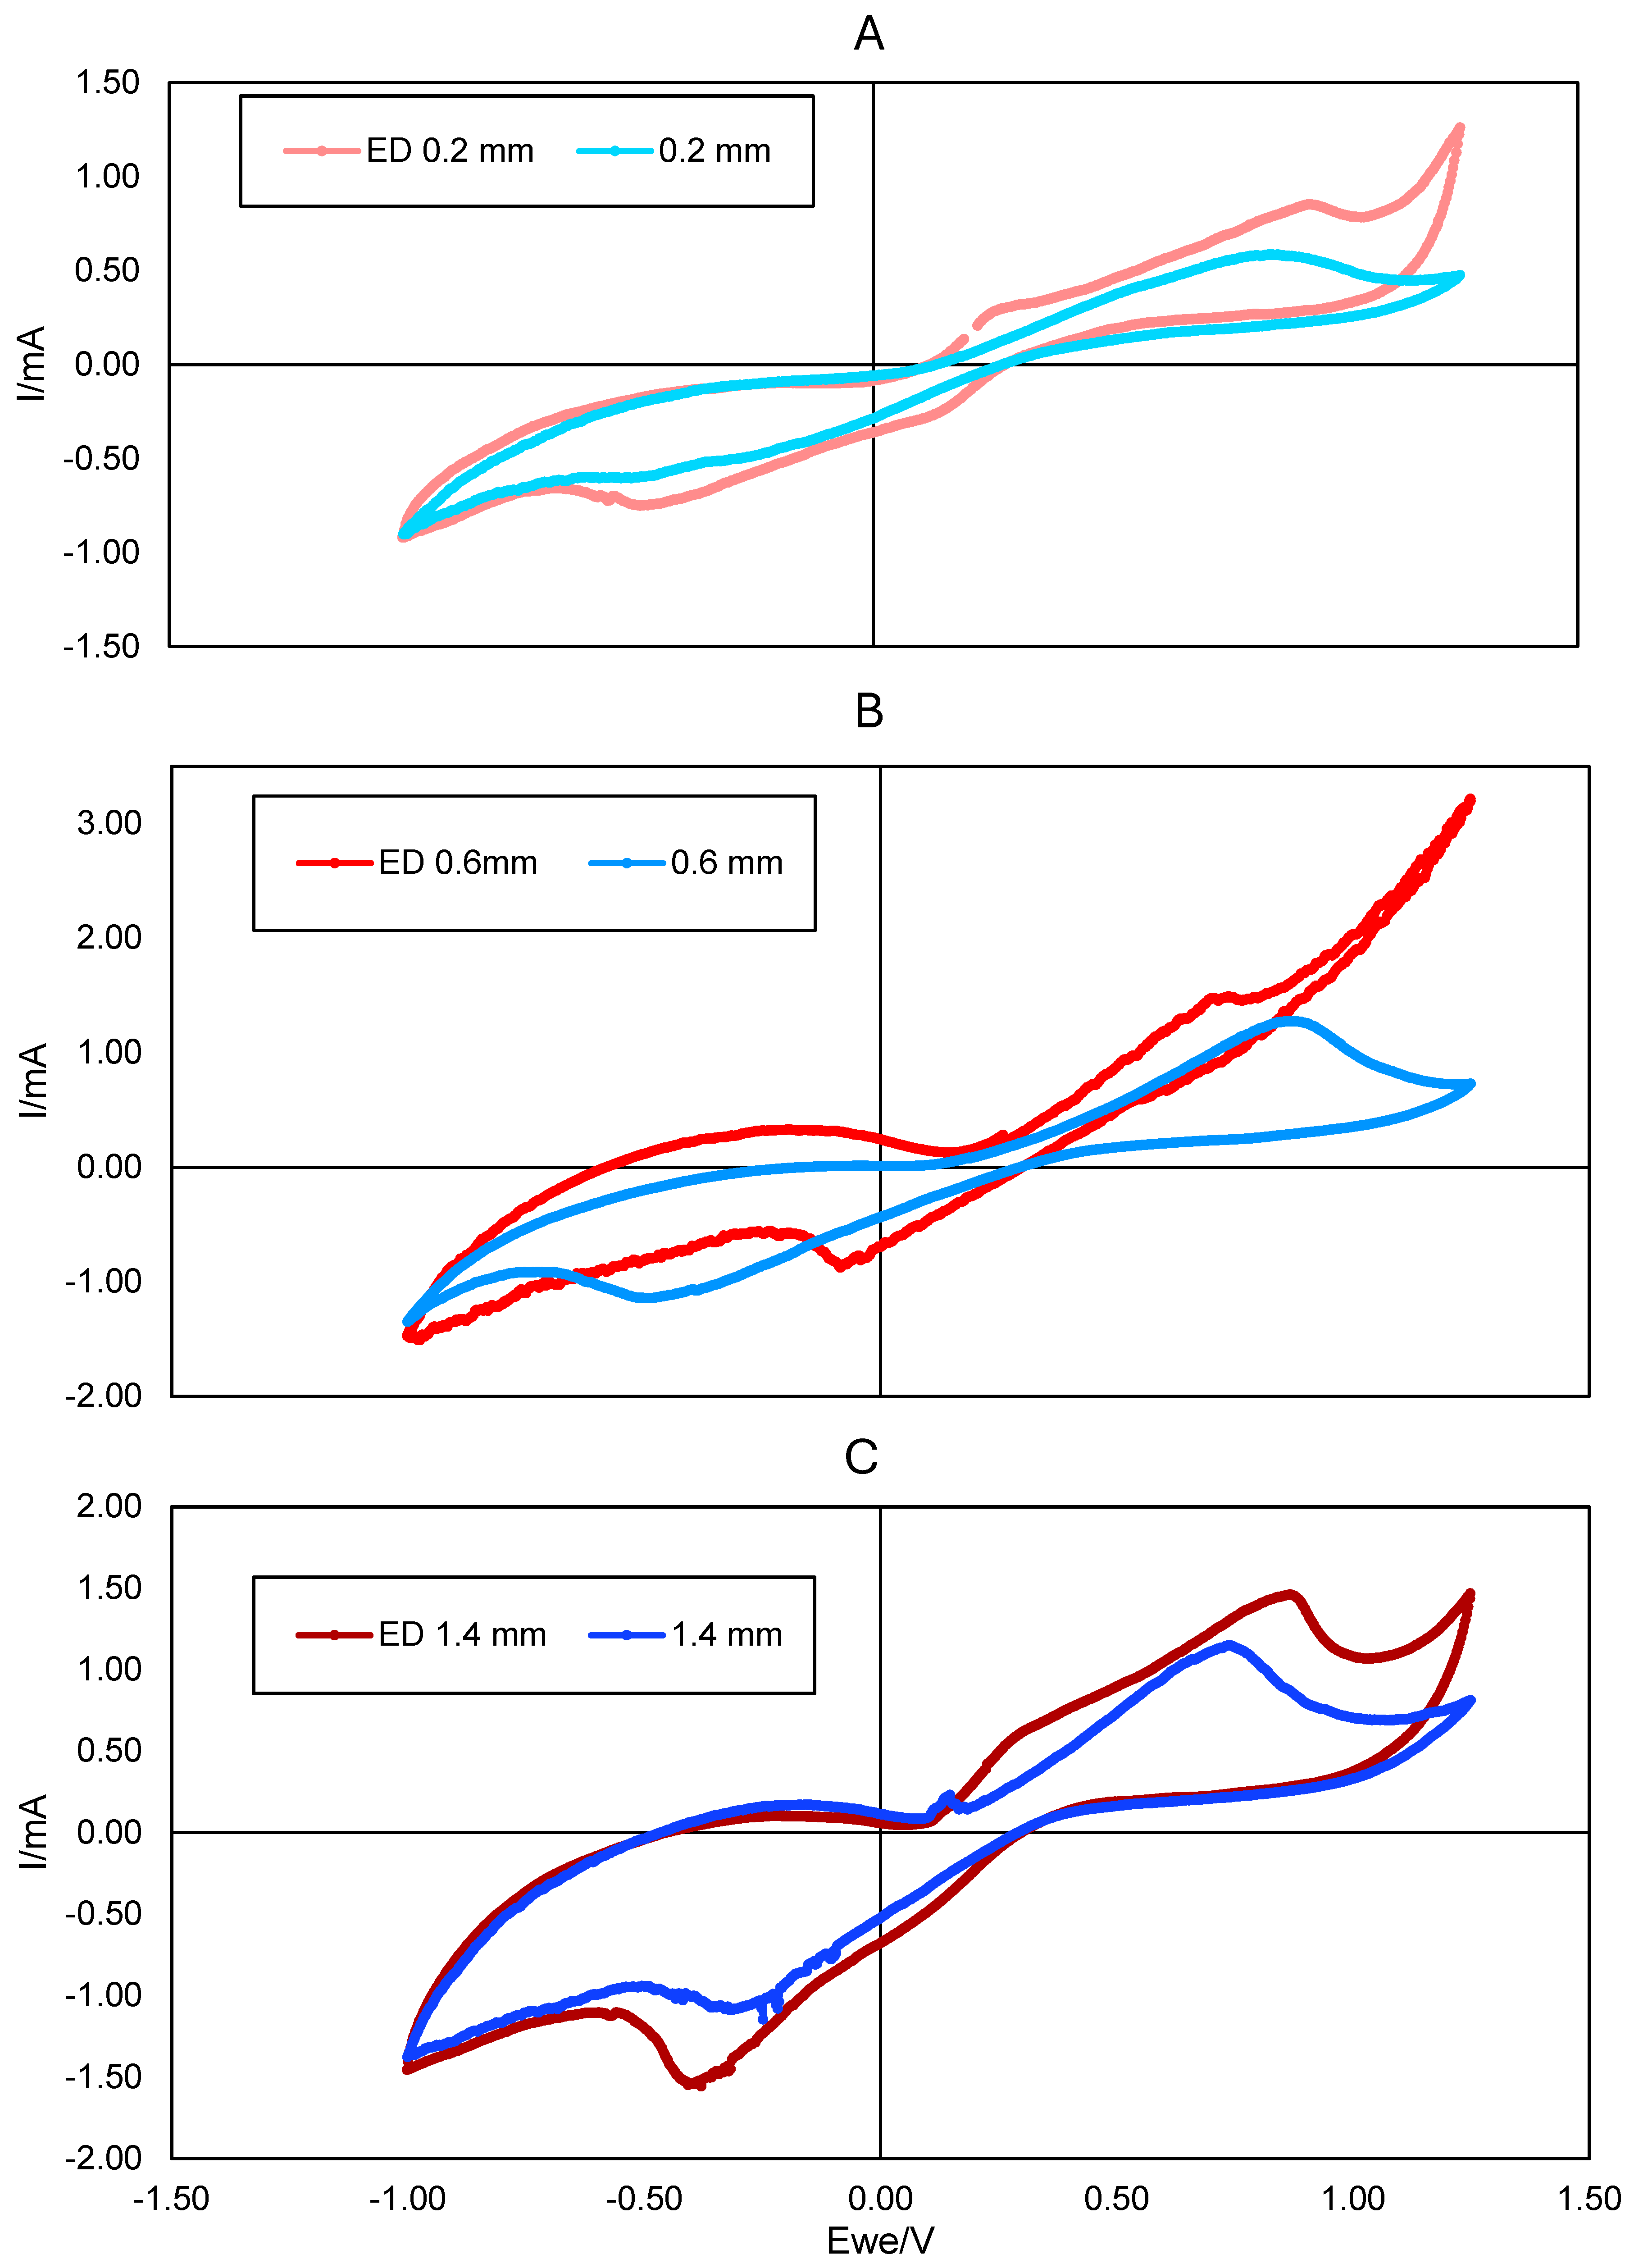
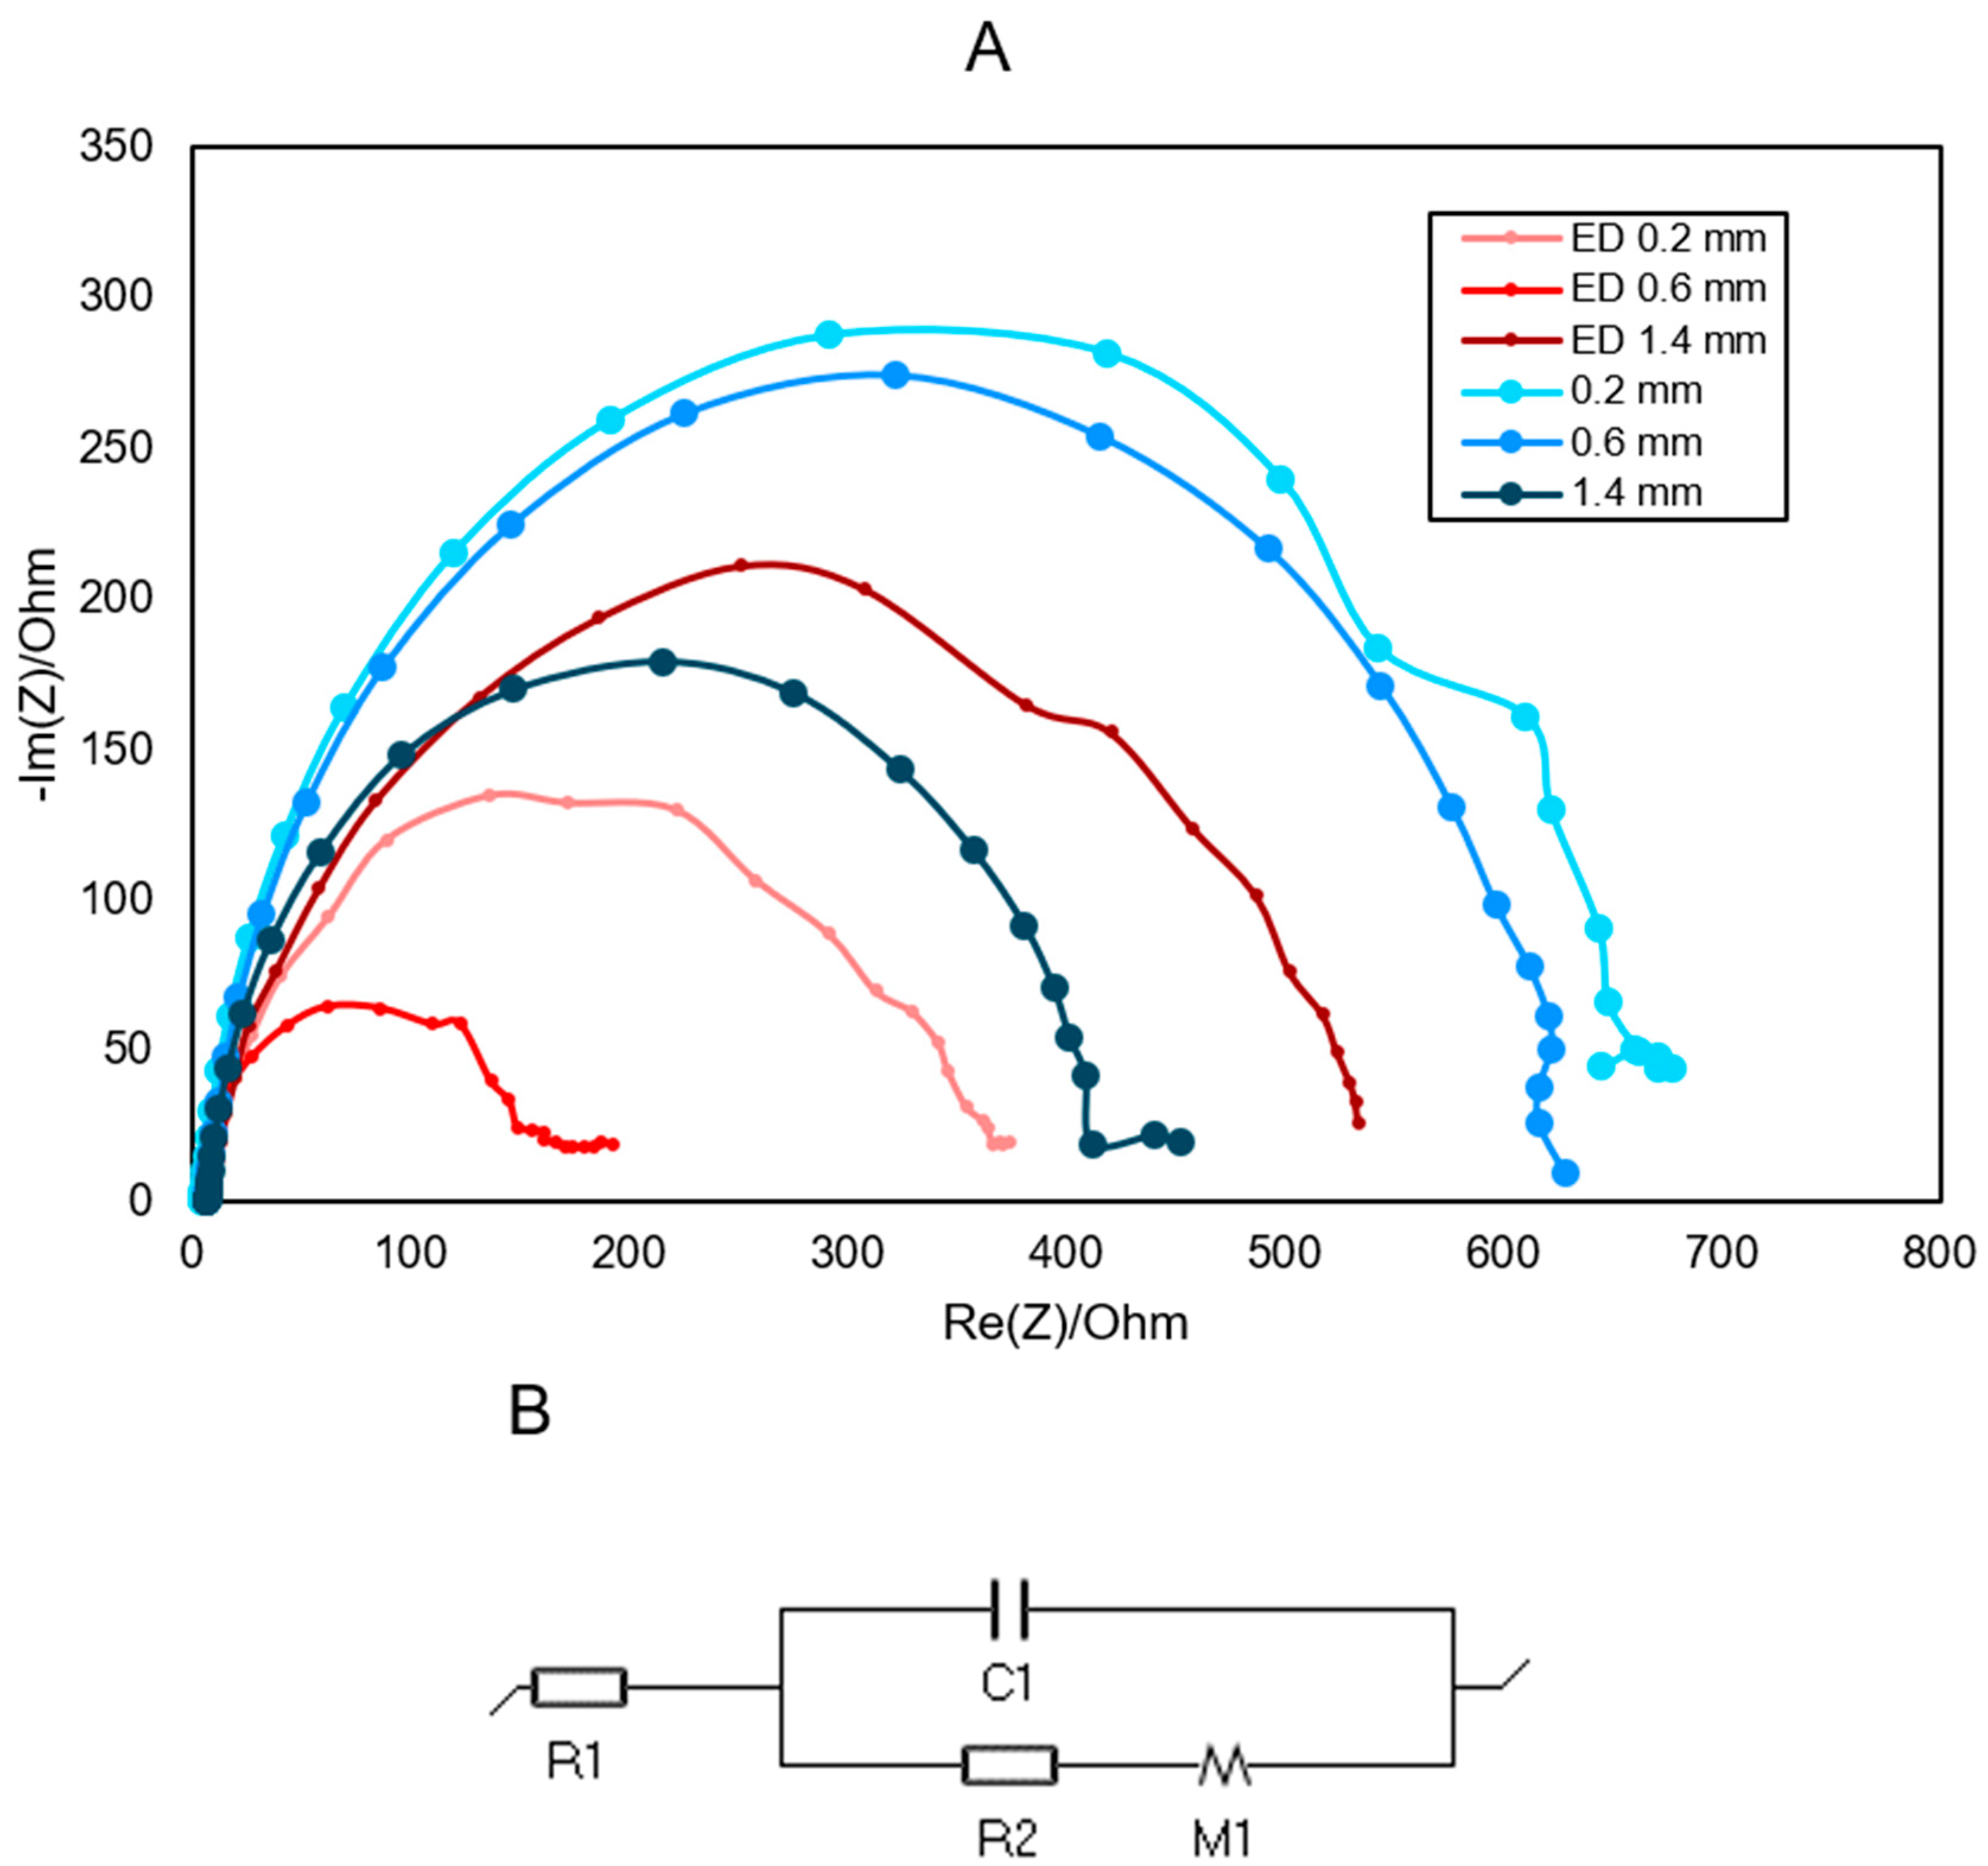
3.3. Electrochemical Characterization of the PLA Electrodes Electrodeposited with Graphene Oxide

With the intention of improving the overall electrochemical performance of the electrodes, their surface was modified using graphene oxide as described in Section 2.1. The electrochemical performance of the electrodes thus modified was characterized using identical techniques. Three different electrodes were tested with differing results in the bare-electrode tests, ranging from poor results to the one that showed the best result (depth of the pattern of 0.2, 0.6 and 1.4 mm).
The graphene electrodeposition led to a significant improvement in the performance of the electrodes for the three selected depths (Figure 6), which corroborates previous studies with graphene oxide that showed an improvement in the electrochemical performance of the electrode [24,30]. The CVs of the ED electrodes showed larger oxidation–reduction peaks compared to that of the bare electrodes, which reveals an improvement of the kinetics of the electrochemical reaction. This improvement is most clearly visible in the 1.4 mm depth. As for the EIS, the result showed a significant improvement for both the 0.2 mm and 0.6 mm electrodes (Figure 7). In fact, the latter is the one with the best results. For 0.2 mm, oxidation and reduction peaks became visible and showed a slight increase in current (thickening of the curve). In the case of 0.6 mm, we see a decrease in the distance between peaks and a considerable increase, almost double, of the oxidative part of the curve. Interestingly, in the case of the 1.4 mm pattern, there is a worsening of the results obtained without ED observing an increase in resistance and a decrease in capacitance (Table 3). This could be due to the arrangement of the GO on the electrode surface since there is a substantial worsening of the diffusion-associated resistance as well as charge transfer. Another explanation may be due to capacitance loss, i.e., graphene could increase the electron current through the electrode and decrease its accumulation.
Finally, it is important to note that the results here provided could not be directly extrapolated to a biological system. The positive influence of the depths of the pattern between 0.6 and 1.4 mm must be corroborated in biological tests, as the presence of a biofilm might affect not only charge transfer but also mass transfer resistance. In this regard, although a deeper pattern is expected to promote the formation of a more robust biofilm, resilient to the shearing stress caused by hydrodynamic forces, it might also give way to a thicker biofilm that limits mass transfer.

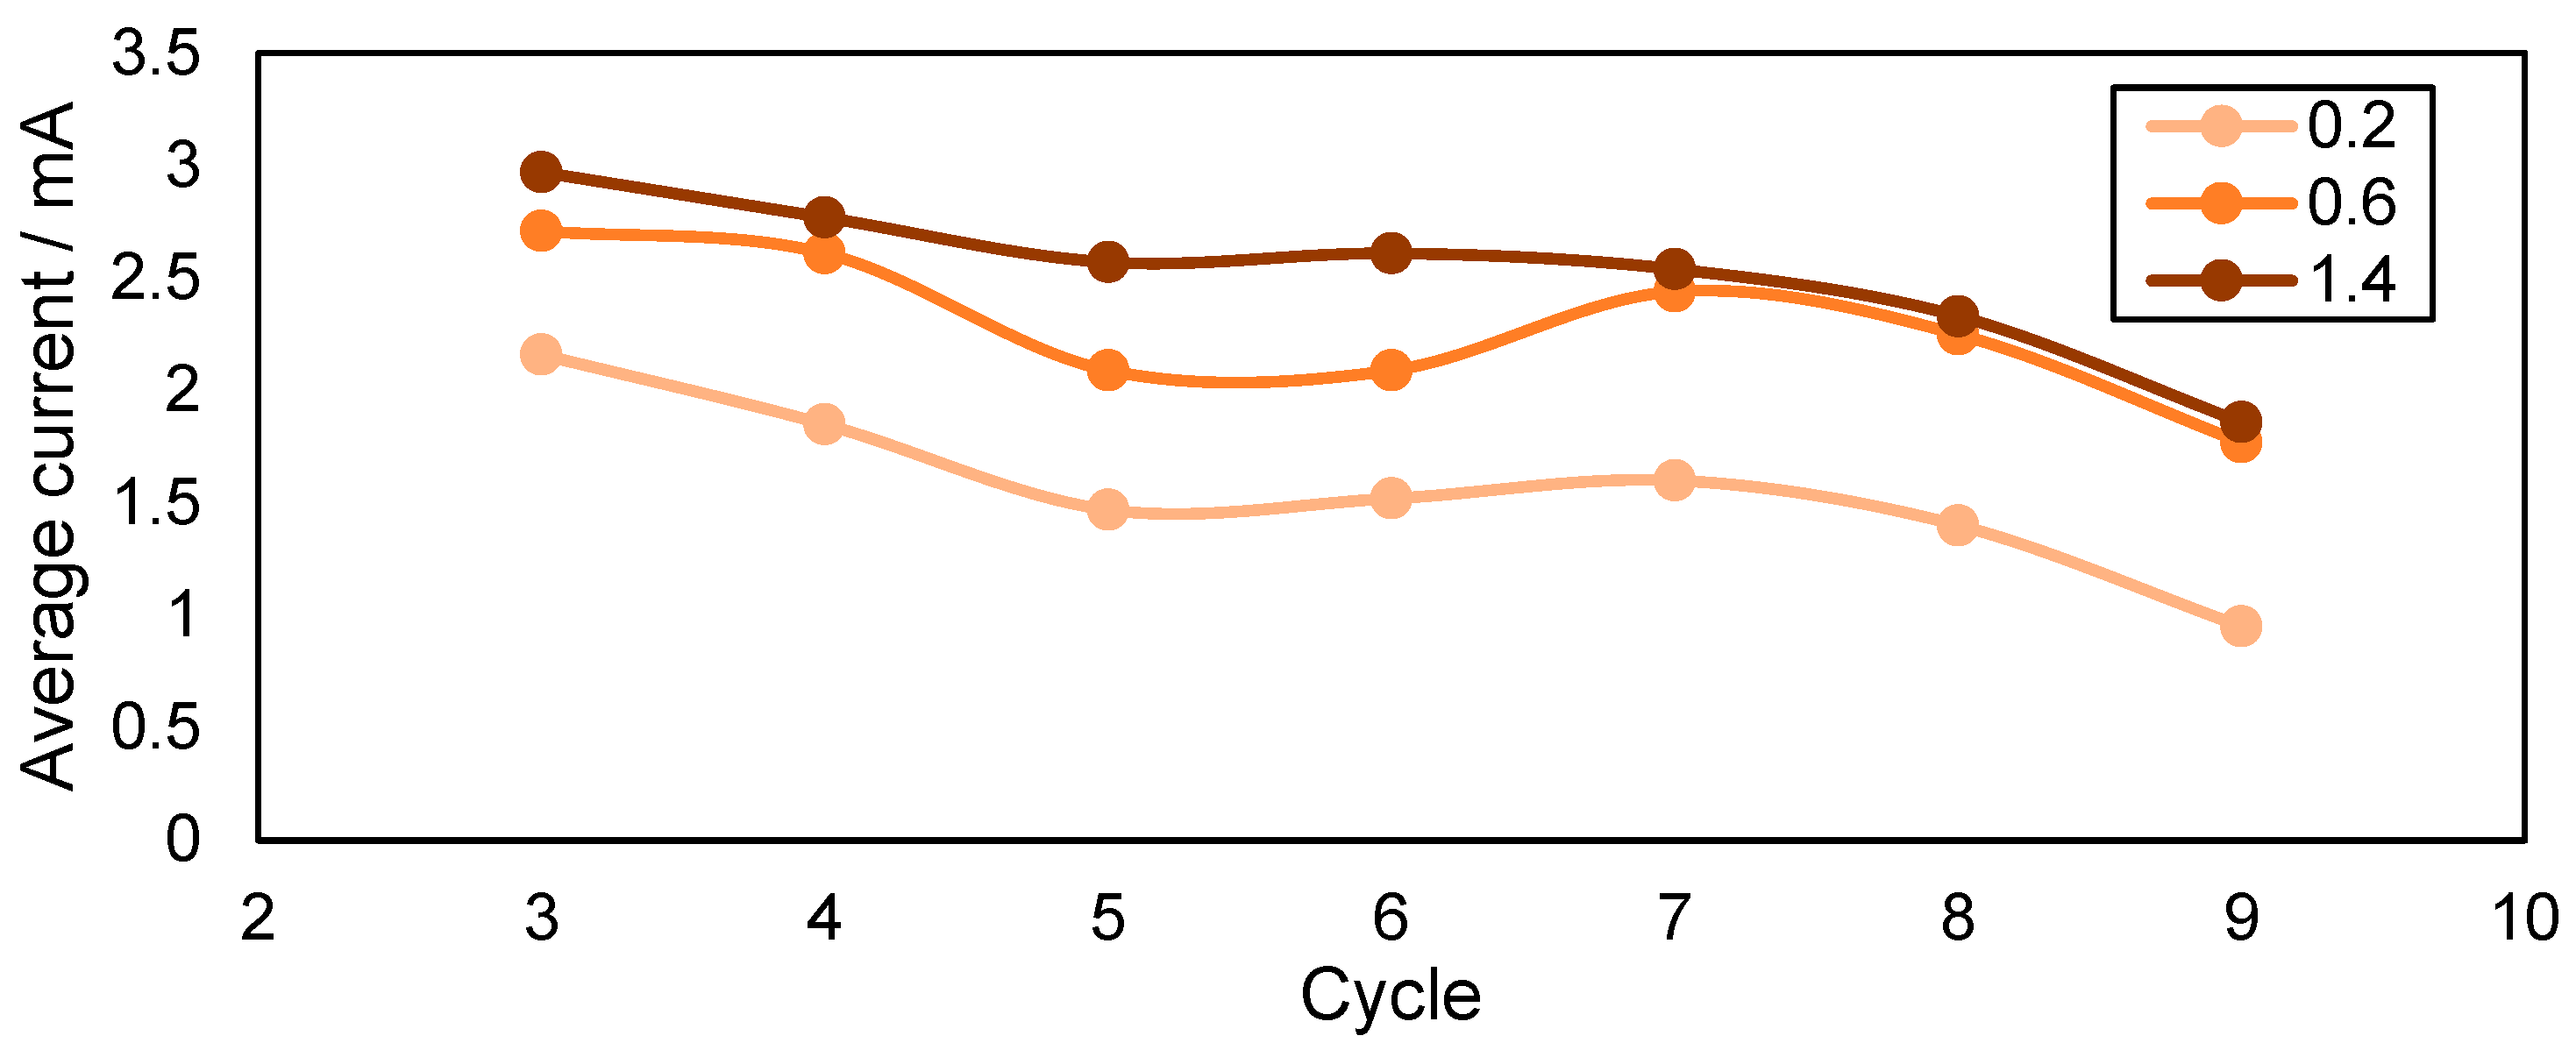
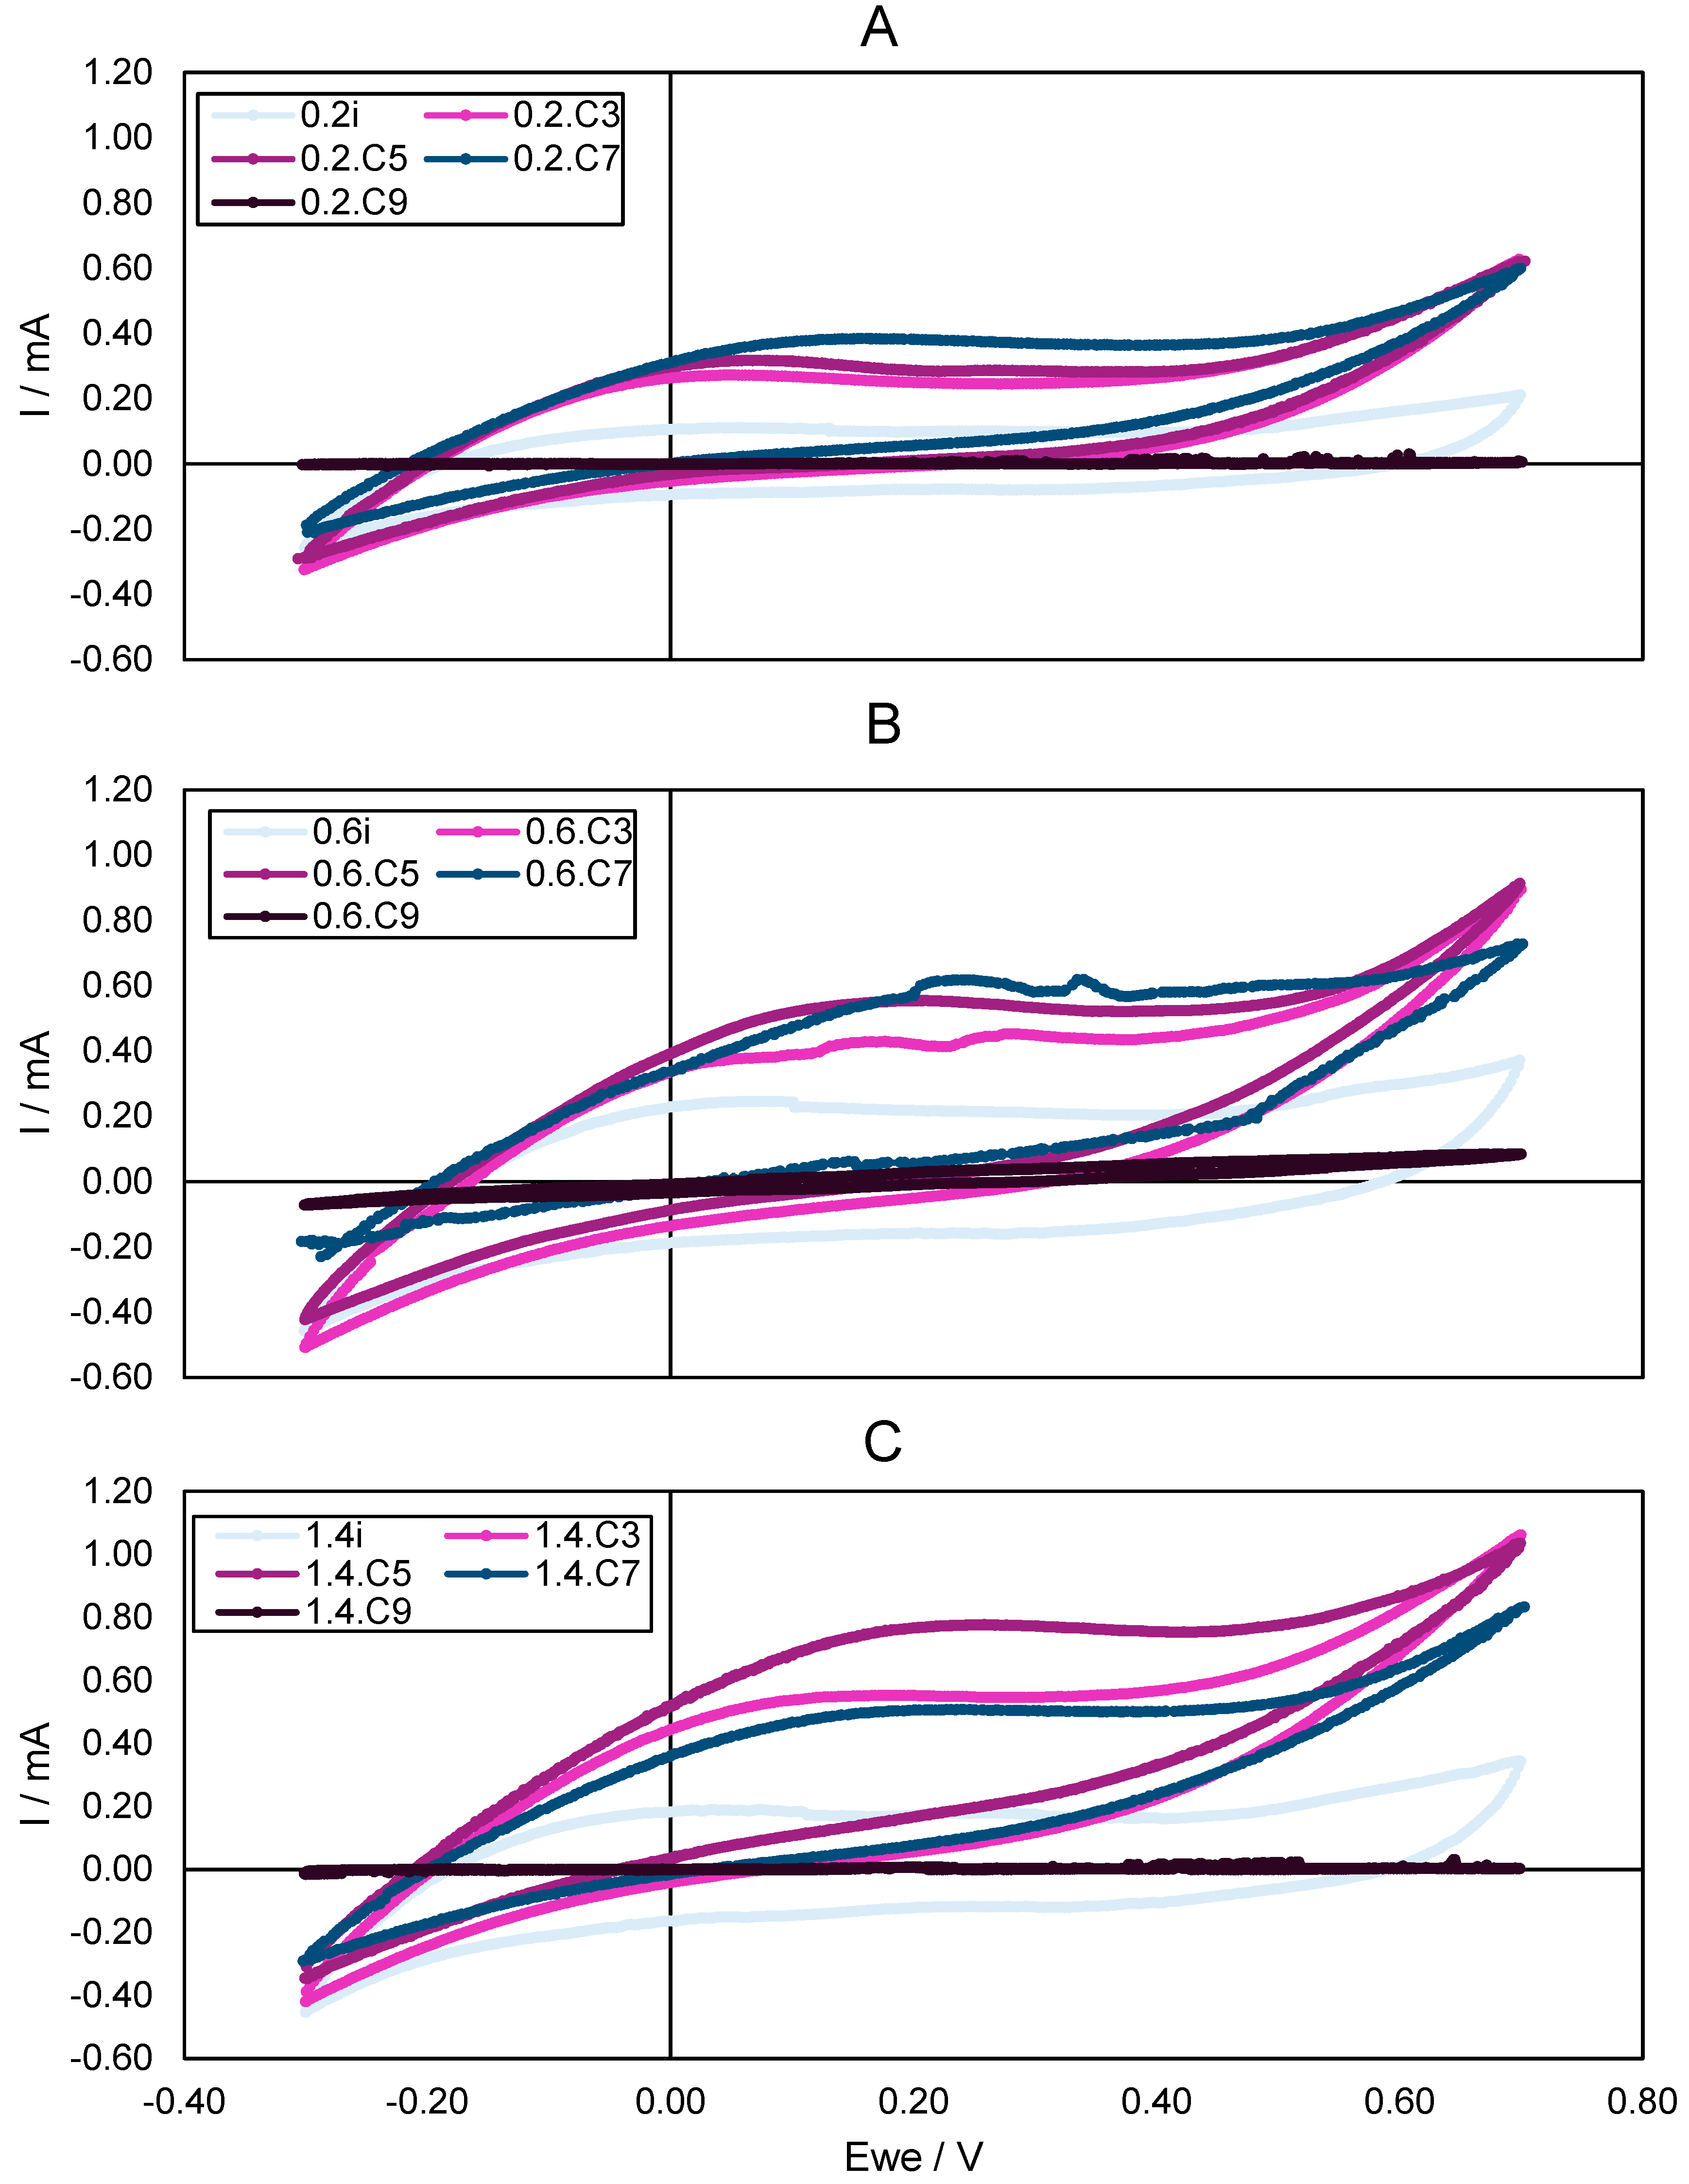
3.4. Characterization of the Biologically Activated Electrodes

The PLA-GO electrodes were biologically activated following the method described in Section 2.1. In this set of tests, we seek to characterize the electrochemical performance and durability of the electrodes. To ensure that all the electrodes were activated under identical conditions (i.e., inoculum, pH, conductivity, etc.), they were cultured within the same single-chamber cell. The cell was polarized at a potential of 0.1 V vs. Ag/AgCl and fed with sodium acetate as a carbon source. The parameters of pH, conductivity and dissolved O2 are given in Table S1 in the Supporting Information.
The electrodes needed three cycles (21 days) to reach a stable current, after which the experimental phase started. Figure 8 shows the averaged current density obtained for the electrodes with depths of pattern of 0.2, 0.6 and 1.4. The largest averaged current density was measured in the electrode with a depth pattern of 1.4 mm, followed by 0.6 and 0.2, a result that is consistent with the abiotic characterization experiments, where the performance of the electrode seems to improve with the depth of the pattern. Another important aspect shown in Figure 8 is that the current produced by all three electrodes decreased with time, although at different rates: the 0.2 electrode suffered a 56% current reduction between cycles 3 and 9 and decayed by 35% and 37% in the 0.6 and 1.4 electrodes, respectively. In addition, from cycle 5 onwards, the physical integrity of all the electrodes started to collapse, with particles detached from the electrode being clearly discernible by the bare eye in the bottom of the reactor. This led us to suspect that the decline in current could be, at least partially, explained by the physical disintegration of the electrode. Samples collected from the sediments settled in the bottom of the cell, formed the fresh PLA filament and, from the GO employed for the electrodeposition, were analyzed through thermogravimetry to investigate the degradation pattern. The derivative weight loss of sediments was relatively similar to that of the GO (Figure 9), showing peaks at temperatures of around 200 °C and 460 °C. In contrast, the weight loss profile of the PLA filament was very different from that of the GO or the sediment, showing an abrupt drop in weight between 200 °C and 500 °C.
These results seem to indicate that the degradation of the electrode can be mainly explained by the detachment of the electrodeposited GO. However, this contrasts with the visual inspection of the electrode at the end of the experiments, which showed evident signs of matrix deterioration. Therefore, we are encouraged to hypothesize that the PLA is suffering from biochemical degradation caused most probably by the proliferation of a biofilm on its surface. Although the possible degradation of the electrode apparently starts almost at the beginning of the experiment, given the decreasing point currents of the three electrodes, they seem to have a lifetime of about 56 days (not counting the 21 days of inoculation) with the optimum performance point at 35 days. This result would be thus highlighting the limited applicability of PLA to the fabrication of electrodes in bioelectrochemical systems due to its biodegradability.
Cyclic voltammetry tests were conducted at the end of the different batch cycles to monitor biofilm development in time (Figure 10). The first thing we notice is that the electroactivity of the biofilm (measured from the maximum currents) kept evolving from cycle 1 to cycle 3, and then it seemed to stabilize across the following cycles to eventually collapse in the last cycle 9, probably because of an accelerated disintegration of the matrix of the electrode. It is also important to note that the width of the CVs tended to increase with time, which is indicative of an increase in electrical capacitance of the electrode as a result of a development of the biofilm [31]. The evolution of the biofilm can be observed through the cyclic voltammetries conducted throughout the operation phase. In all three electrodes, there is a significant increase in current between the initial cycle (i), performed with synthetic medium, and cycle 3 (C3). Similarly, by cycle 5 (C5), after 35 days of operation, the biofilm appears to reach its optimal development. From this point onwards, the cyclic voltammetry results show a decline in both the thickness of the curve, which is related to the biofilm development, and the current peaks at the ends of the curve (oxidation and reduction). Among the electrodes, the 1.4 electrode demonstrates the best performance, although it also shows the greatest decrease between cycle 5 and cycle 7, eventually reaching values similar to the other two electrodes. This suggests that a greater biofilm development leads to a more pronounced degradation of the electrode surface. Despite this, the electrodes maintain a certain level of performance when comparing the curves of cycle 7 (C7) with the initial ones (i). However, in cycle 9 (C9), there is a noticeable decrease in current across all three electrodes, with a slightly lesser decrease in the 0.6 electrode, indicating a virtually null performance likely due to the absence of biofilm.

4. Conclusions

In this study we compared the electrochemical performance of two different conductive composite materials (TPU and PLA) for the fabrication of planar electrodes with surface topography modified with a triangular pattern with varying depths.
The results showed that conductive TPU is not suitable for bioelectrode fabrication due to its high charge and mass transfer resistances. The resistance of TPU electrodes is in the order of 100 times higher than those seen for PLA electrodes. In contrast, PLA offers a better alternative, showing the best electrochemical performance for pattern depths between 0.6 and 1.4 mm. In particular, the 0.6 and 1.4 electrodes exhibited lower charge transfer resistances in the equivalent circuits obtained of about half that of NP or 0.2. In this range (0.6–1.4), the most pronounced oxidation and reduction peaks are also found. On the other hand, electrodeposition with GO improved the electrodes, especially 0.6 where the charge transfer resistance was reduced by almost four times compared to the non-electrodeposited electrode. Finally, the biotic start-up of the ED-PLA electrodes also revealed a slightly better performance of the 1.4 electrode against the rest of the patterns. The electrodes underwent a degradation process, probably due to the PLA base, which led to a gradual reduction of the generated current during the operation period. The electrodes remained functionally viable for 56 days at which point the current dropped almost completely. Subsequent thermogravimetric analyses elucidated the surface degradation of the electrodes, which probably affected the biofilm.

Supplementary Materials

The following supporting information can be downloaded at: https://www.mdpi.com/article/10.3390/app14167199/s1, Figure S1: Cyclic voltammograms for PLA/Carbon black electrodes; Table S1: Measurement of pH, conductivity and O2 during the cycles.

Author Contributions

Conceptualization, S.M.-P., A.E. and R.M.; methodology, A.M.-G., T.J. and A.E.; software, A.M.-G. and S.M.-P.; validation, A.E. and R.M.; formal analysis, A.M.-G. and A.E.; investigation, A.M.-G., S.M.-P., T.J. and A.E.; resources, S.M.-P., A.E. and R.M.; data curation, A.M.-G. and T.J.; writing—original draft preparation, A.M.-G. and T.J.; writing—review and editing, S.M.-P., A.E. and R.M.; supervision, S.M.-P., A.E. and R.M.; project administration, A.E.; funding acquisition, A.E. All authors have read and agreed to the published version of the manuscript.

Funding

This research was possible thanks to the financial support of the “Ministerio de Ciencia e Innovación” through project TED2021-129687A-100, financed by MCIN/AEI/10.13039/501100011033 and by the European Union NextGenerationEU/PRTR.

Institutional Review Board Statement

Not applicable.

Informed Consent Statement

Not applicable.

Data Availability Statement

The raw data supporting the conclusions of this article will be made available by the authors on request.

Conflicts of Interest

The authors declare no conflicts of interest.

References

  1. Ieropoulos, I.A.; Singh, A.; Moreno, D.Z.; Greenman, J. Bioelectrochemical Systems and their readiness for commercialisation. Curr. Opin. Electrochem. 2024, 46, 101540. [Google Scholar] [CrossRef]
  2. Ramanaiah, S.V.; Chandrasekhar, K.; Cordas, C.M.; Potoroko, I. Bioelectrochemical systems (BESs) for agro-food waste and wastewater treatment, and sustainable bioenergy-A review. Environ. Pollut. 2023, 325, 121432. [Google Scholar] [CrossRef]
  3. Ahmadi, S.; Rezae, A.; Ghosh, S.; Malloum, A.; Banach, A. A review on bioelectrochemical systems for emerging pollutants remediation: A computational approaches. J. Environ. Chem. Eng. 2023, 11, 110021. [Google Scholar] [CrossRef]
  4. Resitano, M.; Tucci, M.; Mezzi, A.; Kaciulis, S.; Matturro, B.; D’Ugo, E.; Bertuccini, L.; Fazi, S.; Rossetti, S.; Aulenta, F.; et al. Anaerobic treatment of groundwater co-contaminated by toluene and copper in a single chamber bioelectrochemical system. Bioelectrochemistry 2024, 158, 108711. [Google Scholar] [CrossRef]
  5. Chattopadhyay, J.; Srivastava, N.; Pathak, T.S.; Priyanka, P. Advancement in electrode materials and membrane separators for scaling up of MES. In Scaling Up of Microbial Electrochemical Systems: From Reality to Scalability; Elsevier: Amsterdam, The Netherlands, 2022; pp. 161–172. [Google Scholar] [CrossRef]
  6. Saratale, G.D.; Banu, J.R.; Nastroc, R.A.; Kadier, A.; Ashokkumar, V.; Lay, C.-H.; Jung, J.-H.; Shin, H.S.; Saratale, R.G.; Chandrasekhar, K. Bioelectrochemical systems in aid of sustainable biorefineries for the production of value-added products and resource recovery from wastewater: A critical review and future perspectives. Bioresour. Technol. 2022, 359, 127435. [Google Scholar] [CrossRef]
  7. Alonso, R.M.; San-Martín, M.I.; Mateos, R.; Morán, A.; Escapa, A. Scale-up of bioelectrochemical systems for energy valorization of waste streams. In Microbial Electrochemical Technologies, 1st ed.; Tiquia-Arashiro, S., Pant, D., Eds.; CRC Press: Boca Raton, FL, USA, 2019; pp. 447–459. [Google Scholar] [CrossRef]
  8. Bajracharya, S.; Bian, B.; Jimenez-Sandoval, R.; Matsakas, L.; Katuri, K.P.; Saikaly, P.E. Nature inspired catalysts: A review on electroactive microorganism-based catalysts for electrochemical applications. Electrochim. Acta 2024, 488, 144215. [Google Scholar] [CrossRef]
  9. Fang, Z.; Hu, J.; Xu, M.Y.; Li, S.W.; Li, C.; Zhou, X.; Wei, J. A biocompatible electrode/exoelectrogens interface augments bidirectional electron transfer and bioelectrochemical reactions. Bioelectrochemistry 2024, 158, 108723. [Google Scholar] [CrossRef]
  10. Larzillière, V.; de Fouchécour, F.; Bureau, C.; Bouchez, T.; Moscoviz, R. Urban wastewater oxidation by bioelectrochemical systems: To what extent does the inoculum matter? Bioelectrochemistry 2024, 155, 108577. [Google Scholar] [CrossRef]
  11. Li, X.; Cao, H.; Feng, Q.; Lv, Y.; Zhao, Y.; Pan, H. Effects of applied voltages on electron transfer pathways for bioelectrochemical methane production from maize straw. Energy 2024, 296, 131215. [Google Scholar] [CrossRef]
  12. Li, C.; Cheng, S. Functional group surface modifications for enhancing the formation and performance of exoelectrogenic biofilms on the anode of a bioelectrochemical system. Crit. Rev. Biotechnol. 2019, 39, 1015–1030. [Google Scholar] [CrossRef]
  13. Grover, S.; Doyle, L.E. Advanced electrode materials for microbial extracellular electron transfer. Trends Chem. 2024, 6, 144–158. [Google Scholar] [CrossRef]
  14. Mier, A.A.; Olvera-Vargas, H.; Mejía-López, M.; Longoria, A.; Verea, L.; Sebastian, P.J.; Arias, D.M. A review of recent advances in electrode materials for emerging bioelectrochemical systems: From biofilm-bearing anodes to specialized cathodes. Chemosphere 2021, 283, 131138. [Google Scholar] [CrossRef] [PubMed]
  15. Chung, T.H.; Dhar, B.R. A Mini-Review on Applications of 3D Printing for Microbial Electrochemical Technologies. Front. Energy Res. 2021, 9, 679061. [Google Scholar] [CrossRef]
  16. Baş, F.; Kaya, M.F. 3D printed anode electrodes for microbial electrolysis cells. Fuel 2022, 317, 123560. [Google Scholar] [CrossRef]
  17. Wang, X.; Huang, L.; Li, Y.; Wang, Y.; Lu, X.; Wei, Z.; Mo, Q.; Zhang, S.; Sheng, Y.; Huang, C.; et al. Research progress in polylactic acid processing for 3D printing. J. Manuf. Process. 2024, 112, 161–178. [Google Scholar] [CrossRef]
  18. Mohammed-Sadhakathullah, A.H.M.; Paulo-Mirasol, S.; Molina, B.G.; Torras, J.; Armelin, E. PLA-PEG-Cholesterol biomimetic membrane for electrochemical sensing of antioxidants. Electrochim. Acta 2024, 476, 143716. [Google Scholar] [CrossRef]
  19. Cruz, R.; Nisar, M.; Palza, H.; Yazdani-Pedram, M.; Aguilar-Bolados, H.; Quijada, R. Development of bio degradable nanocomposites based on PLA and functionalized graphene oxide. Polym. Test. 2023, 124, 108066. [Google Scholar] [CrossRef]
  20. Khalil, M.; Dincer, I. An investigation of hydrogen production using 3D-printed cathodes for alkaline water electrolysis. Energy Convers. Manag. 2024, 302, 118169. [Google Scholar] [CrossRef]
  21. McDonagh, P.; McCole, M.; Skillen, N.; Robertson, P.K.J.; McCrudden, D. 3D printed carbon black-polylactic acid/copper (CB-PLA/Cu) sensor for improved sustainability in monitoring photocatalytic hydrogen peroxide evolution. J. Environ. Chem. Eng. 2023, 11, 111123. [Google Scholar] [CrossRef]
  22. You, J.; Preen, R.J.; Bull, L.; Greenman, J.; Ieropoulos, I. 3D printed components of microbial fuel cells: Towards monolithic microbial fuel cell fabrication using additive layer manufacturing. Sustain. Energy Technol. Assess. 2017, 19, 94–101. [Google Scholar] [CrossRef]
  23. Pumera, M. Three-dimensionally printed electrochemical systems for biomedical analytical applications. Curr. Opin. Electrochem. 2019, 14, 133–137. [Google Scholar] [CrossRef]
  24. Carrillo-Peña, D.; Mateos, R.; Morán, A.; Escapa, A. Reduced graphene oxide improves the performance of a methanogenic biocathode. Fuel 2022, 321, 123957. [Google Scholar] [CrossRef]
  25. Alonso, R.M.; Martín, I.S.; Morán, A.; Escapa, A. Comparison of Activation Methods for 3D-Printed Electrodes for Microbial Electrochemical Technologies. Appl. Sci. 2022, 12, 275. [Google Scholar] [CrossRef]
  26. Bard, A.J.; Faulkner, L.R.; White, H.S. Electrochemical Methods: Fundamentals and Applications; John Wiley & Sons: Hoboken, NJ, USA, 2022. [Google Scholar]
  27. Pelaz, G.; González, R.; Morán, A.; Escapa, A. Elucidating the impact of power interruptions on microbial electromethanogenesis. Appl. Energy 2023, 331, 120382. [Google Scholar] [CrossRef]
  28. Mateos, R.; Alonso, R.M.; Escapa, A.; Morán, A. Methodology for Fast and Facile Characterisation of Carbon-Based Electrodes Focused on Bioelectrochemical Systems Development and Scale Up. Materials 2017, 10, 79. [Google Scholar] [CrossRef]
  29. Bonanos, N.; Steele, B.C.H.; Butler, E.P. Applications of Impedance Spectroscopy. In Impedance Spectroscopy; John Wiley & Sons: Hoboken, NJ, USA, 2005; pp. 205–537. [Google Scholar] [CrossRef]
  30. Sayed, E.T.; Alawadhi, H.; Olabi, A.G.; Jamal, A.; Almahdi, M.S.; Khalid, J.; Abdelkareem, M.A. Electrophoretic deposition of graphene oxide on carbon brush as bioanode for microbial fuel cell operated with real wastewater. Int. J. Hydrogen Energy 2021, 46, 5975–5983. [Google Scholar] [CrossRef]
  31. Carrillo-Peña, D.; Pelaz, G.; Mateos, R.; Escapa, A. Charge storage capacity of electromethanogenic biocathodes. J. Energy Storage 2024, 76, 109789. [Google Scholar] [CrossRef]
Figure 1. Electrode design and dimensions.
Applsci 14 07199 g001
Figure 2. PLA/carbon black electrode results. (A) Anodic and cathodic peak currents and (B) peaks separation.
Applsci 14 07199 g002
Figure 3. Electrochemical impedance results for the PLA electrode. (A) EIS and (B) electric equivalent circuit.
Applsci 14 07199 g003
Figure 4. Cyclic voltammetry for TPU.
Applsci 14 07199 g004
Figure 5. Electrochemical impedance results for the TPU electrode. (A) EIS and (B) electric equivalent circuit.
Applsci 14 07199 g005
Figure 6. CV comparison between PLA and PLA-ED: (A) 0.2 mm electrode, (B) 0.6 mm electrode and (C) 1.4 mm electrode.
Applsci 14 07199 g006
Figure 7. Electrochemical impedance results for the ED-PLA electrode. (A) EIS and (B) electric equivalent circuit.
Applsci 14 07199 g007
Figure 8. Current variation of the different patterns measured along the cycles.
Applsci 14 07199 g008
Figure 9. Thermogravimetric analyses for the PLA-ED electrodes after 56 days of biotic operation. (A) Weight loss against temperature and (B) weight loss derivative. Note that in (B), cell sediments and commercial GO are referred to in the left axis, and PLA/carbon black is referred to in the right axis.
Applsci 14 07199 g009
Figure 10. CV comparison for different cycles: (A) 0.2 mm PLA-ED electrode, (B) 0.6 mm PLA-ED electrode and (C) 1.4 mm PLA-ED electrode.
Applsci 14 07199 g010
Table 1. Electrical equivalent circuit data for PLA electrodes.
NP0.20.611.4TH
Rs (Ω)14.226.0097.2915.8217.6374.169
C (F)3.07·10−51.42·10−52.88·10−52.65·10−56.68·10−53.5·10−5
Rct (Ω)647.9713.7563.3687.43691450
Rd1 (Ω)3.08·1022.81·1021.80·1022.06·1021.77·1025.27·102
td1 (s)5.9597.8026.789.6789.567.376
Table 2. Electrical equivalent circuit data for TPU electrodes.
NP0.20.6
Rs (Ω)9.4678.5535.631
Q1 (F s(a−1))5.34·10−53.28·10−56.19·10−5
a10.920.930.89
Rct (Ω)4.65·1044.01·1041.62·104
Rd1 (Ω)6.5·1042.98·1040.19
td1 (s)14.524.049.232
Table 3. Electrical equivalent circuit data for PLA-ED electrodes.
0.20.61.4
Rs (Ω)8.8942.5818.631
C (F)1.56·10−52.16·10−53.4·10−5
Rct (Ω)302.1143.4422.7
Rd1 (Ω)1.92·1021.38·1023.18·102
td1 (s)7.0237.7347.056
Disclaimer/Publisher’s Note: The statements, opinions and data contained in all publications are solely those of the individual author(s) and contributor(s) and not of MDPI and/or the editor(s). MDPI and/or the editor(s) disclaim responsibility for any injury to people or property resulting from any ideas, methods, instructions or products referred to in the content.

