Article

Response Surface Methodology for Ultrasound-Assisted Oil Extraction Optimization from Blackberry, Chokeberry, and Raspberry Waste Products

1
Department of Chemistry, Institute of Food Sciences, Warsaw University of Life Sciences, 159c Nowoursynowska St., 02-776 Warsaw, Poland
2
Department of Food Engineering and Process Management, Institute of Food Sciences, Warsaw University of Life Sciences, 159c Nowoursynowska St., 02-776 Warsaw, Poland
*
Authors to whom correspondence should be addressed.
Appl. Sci. 2024, 14(16), 7214; https://doi.org/10.3390/app14167214
Submission received: 16 July 2024 / Revised: 13 August 2024 / Accepted: 14 August 2024 / Published: 16 August 2024

Abstract

:
Berry fruit seeds which are considered as a fruit industry waste product can be a source of oil with unique chemical, physical, and nutritional properties. The blackberry, chokeberry, and raspberry seeds can be perceived as an alternative source of oil. However, conventional oil extraction is merged with financial and environmental expanses. Therefore, alternative extraction methods, ultrasound-assisted, for example, are being gradually introduced to the common practice. The aim of the following study was to determine the optimal conditions of ultrasound-assisted extraction of oil from blackberry, chokeberry, and raspberry seeds in order to obtain oil with high yield and improved oxidative stability. The variables of the experiment were extraction time and ultrasound amplitude. Based on the results, the mathematical models were fit, and optimum conditions of time and amplitude were calculated: 8.20 min and 72.98%, 10.11 min and 59.18%, 8.43 min and 95.57% for blackberry, chokeberry, and raspberry seed oils, respectively. Additionally, oils obtained in the optimized conditions were assessed in differential scanning calorimetry study to evaluate their melting and crystallization characteristics. The results showed that ultrasound application affected thermal properties of oils only slightly. The evaluation of oxidation kinetics led to the conclusion that ultrasound may cause an activation energy increase. Also, the profile of fatty acids and their distribution in triacylglycerol molecules were studied. The output values of experiments were comparable between oils obtained from the same berry seeds. All of the oils were characterized with a high share of polyunsaturated fatty acids (over 70%) with predominant content of linoleic acid. Summarized results show that the ultrasound technique can be successfully applied in the oil extraction procedure. The benefits contain improved yield, longer oxidation induction time, and invariance of the specific oil chemical and physical properties.

1. Introduction

Berry fruit wastes, mainly pomace obtained during juice pressing or wine production, are nowadays considered as a promising source of bioactive compounds. On a large scale, they are processed into animal feed or fertilizers. However, due to polyphenol content or seed oil abundance, the waste can have a high added value through the extraction of these valuable components [1]. The proximate analysis of berry fruit pomaces shows a high abundance of carbohydrates (40–70%), followed by protein (5–10%) and fat (2.5–12.5%) [2,3,4]. Alternative extraction methods, e.g., ultrasound-assisted, pulsed electric field-assisted, and microwave-assisted may accelerate the process and also be beneficial in terms of financial and environmental savings when compared to conventional extraction procedures, like solid/liquid or Soxhlet methods [5].
Special emphasis is put on ultrasound-assisted extraction (UAE) as it is an easy, quick, and efficient extraction method. It utilizes cavitation phenomenon, which involves forming and collapsing cavitation bubbles in liquid media and results in rapid local events such as mixing, turbulent liquid movement, particle breakdown, sonoporation, fragmentation, detexturation, and erosion in the surface of solid material [6]. All these effects contribute to improved diffusivity and mass transfer, which are crucial for extraction efficiency.
UAE was used in numerous studies to obtain oil from by-products with effective yield and with beneficial properties. Gasparini et al. [7] applied UAE to obtain oil from apple seeds. Compared to conventional extraction and supercritical extraction, UAE results in oil with higher unsaturated fatty acid content and increased concentration of antioxidant compounds. It was also stated that UAE was time efficient when compared to other extraction methods. Milanović et al. [8] extracted oil from winery grape by-products. UAE was found to be more efficient than cold pressing in terms of oil yield, antioxidant capacity, and abundance of α-tocopherol in grape seed oil. Oxidative stability of oil obtained in UAE was also improved. Pérez-Saucedo et al. [9] studied the UAE of avocado seed oil. The main effects of US application improved oxidative stability, acidity, peroxide, and iodine indexes. The time/yield ratio was also significantly improved by US.
Taking into account all the possible benefits of UAE, the aim of the study was to attempt US application in the oil extraction process from blackberry (BB), chokeberry (CH), and raspberry (RB) seeds, considered as by-products of the fruit industry. The objective of the work was also optimization of UAE variables (extraction time and amplitude level) in order to obtain oil with highest possible yield and longest oxidation induction time. Oils obtained in optimized conditions with control samples obtained in conventional solid/liquid extraction process were additionally subjected to detailed chemical analyses: fatty acid profile and distribution determination, oxidation kinetics, melting and crystallization characteristic studies. The results of the study were expected to point out opportunities to valorize food side streams.

2. Materials and Methods

2.1. Material

Fresh fruits of raspberry (Rubus idaeus var. Polana) and chokeberry (Aronia melanocarpa var. Nero) were supplied by local farmers from Pulawy, Poland. Blackberry (Rubus fruticosus var. Brzezina) was obtained from Horticulture National Research Institute in Skierniewice, Poland, and fruit came from the Rubus collection formed as part of the targeted task of the Polish Ministry of Agriculture and Rural Development—an ex situ conservation of genetic resources of horticultural plants. Approximately 10 kg of fruits was used to press juices in the hydraulic press (HPL 14, Bucher Unipektin, Niederweningen, Switzerland), applying a maximum of 3 Bar of pressure. The pomace left after juice pressing was then dried in the laboratory convective dryer at 45 °C and with the air flow of 1.5 m/s. The water activity of the dried pomace was measured at 25 ± 0.3 °C using Rotronic Hygrolab C1 (Rotronic AG, Bassersdorf, Switzerland) hygrometer. The results for all samples were under 0.4. The seeds were then separated from the pomace using sieves and they were used further as a material.

2.2. Methods

2.2.1. Ultrasound-Assisted Extraction

UAE was carried out according to the previously described methodology [10] in the UP400S ultrasound processor (Hielscher Ultrasonics, Teltow, Germany) with the output power of 400 W. Seed samples (2 g) were milled using an IKA Tube Mill (IKA-Werke, Staufen im Breisgau, Germany) at 20,000 rpm for 30 s and then placed in a falcon tube and filled with n-hexane at a solid/liquid ratio of 1:15 just before extraction. To keep the temperature below 45 °C, the falcon tube was immersed in an ice bath, and an immersion thermometer was used to monitor the temperature of the solid-solvent mixture. Following that, the extracts were filtered, dried with anhydrous magnesium sulfate, and evaporated under pressure at 70 mbar. Under nitrogen atmosphere, residual n-hexane was removed from oil samples.

2.2.2. Experimental Design

Extraction conditions varied in terms of ultrasound amplitude level (X1) and extraction time (X2). The parameters were determined using central composition design (CCD). Coded and actual values of ten experiments are summarized in Table 1. The conditions of experiment were chosen based on previous studies [10,11] in which, based on the optimization results, it was shown that longer extraction time and higher amplitude level are more efficient in terms of oil yield and oxidation induction time (OIT) of oil.
All runs were carried out in triplicate. Based on model fitting results, experimental equations were specified according to the following formulas ((1)—for the linear model, (2)—for the two-factor interaction model (2FI), and (3)—for the quadratic model):
Y = β 0 + β 1 X 1 + β 2 X 2
Y = β 0 + β 1 X 1 + β 2 X 2 + β 12 X 1 X 2
Y = β 0 + β 1 X 1 + β 2 X 2 + β 12 X 1 X 2 + β 11 X 1 2 + β 22 X 2 2
where β 0 —the constant coefficient; β 1 , β 2 —regression coefficients for the linear terms; β 11 ,   β 22 —regression coefficients for the quadratic terms; β 12 —regression coefficient for the interaction terms; X 1 , X 2 —coded values of independent variables.

2.2.3. Oil Yield Determination

The yield of oil extracted from berry seeds in the UAE procedure was determined in the gravimetric assay by dividing the mass of oil by the initial mass of seeds and expressed as percents (Equation (4)) [12],
Y i e l d   % = m o m s × 100
where mo—mass of oil; ms—mass of seeds.

2.2.4. Conventional Extraction

In order to obtain relevant control samples for PDSC, DSC, and GC studies, conventional solid/liquid extraction of oil was carried out. Milled seeds (2 g) were placed with 30 mL of n-hexane in the Falcon tube and immersed into a water bath. The extraction was conducted at 40 °C with constant agitation for 2 h. After that, the extract was filtered, and the solvent was evaporated following the same procedure as described for ultrasound-assisted extraction.

2.2.5. Oxidation Induction Time

The oxidation induction time (OIT) of oils was assessed in the pressure differential scanning calorimetry (PDSC) assay. The sample of oil (3–4 mg) was placed in an open aluminum pan with the empty reference pan in the test chamber of a DSC Q20 (TA Instruments, New Castle, DE, USA) apparatus. The OIT was measured in isothermal conditions of 120 °C and under initial pressure of 1400 kPa in pure oxygen atmosphere. OIT (expressed in min) was determined based on the heat flow in the function of time curve, analyzed in the TA Software (v. 4.5A) [13].

2.2.6. Oxidation Kinetics

To assess oxidation kinetic parameters including activation energy (Ea), pre-exponential factor (Z), and reaction rate constant (k), the non-isothermal PDSC variant was employed [14]. The samples of oil (3–4 mg) were heated at rates (β) of 2.5 °C/min, 5.0 °C/min, 7.5 °C/min, 10.0 °C/min, and 12.5 °C/min between 30 and 300 °C. The experiments were conducted in an oxygen atmosphere at a gas flow rate of 50 mL/min and a starting pressure of 100 kPa. The onset oxidation temperature (ton) was determined by finding the intersection of the leading edge (tangent line) of the recorded curve and the extrapolated baseline. The experimental ton values as a function of heating rates (β) were recalculated on absolute onset temperatures (Ton). The graphs of the logarithm of heating rate versus temperature of oil oxidation were plotted, and based on that, Ton dependence was described by regression Equation (5):
log β = a 1 T o n + b
where β—heating rate; Ton—onset absolute temperature (K). Activation energy (Ea) values and pre-exponential factor (Z) were calculated using Equations (6)–(8) and according to the Ozawa–Flynn–Wall methodology.
E a = 2.19 R · d log β d 1 T
where Ea—activation energy; R—gas constant.
Z = β E a e E a R T R T 2
k = Z e x p E a R T
where k—reaction rate constant; Z—pre-exponential factor.

2.2.7. Melting and Crystallization Behavior

To assess melting and crystallization characteristics, a differential scanning calorimetry (DSC) study was carried out using DSC Q200 (TA Instruments, New Castle, DE, USA) calorimeter. Samples of oils (3–4 mg) were placed in an aluminum pan with a lid, hermetically sealed, with an empty pan used as a reference. Analyses were carried out in nitrogen atmosphere. Melting characteristics assay started with heating oil samples to 80 °C in order to melt the crystals and erase thermal memory. Following that, samples were chilled to −80 °C and then heated once more to 80 °C at a rate of 15 °C/min. Crystallization characteristics were determined by cooling oil samples from 20 °C to −80 °C with a cooling rate of 2 °C/min [15,16].

2.2.8. Gas Chromatography

In gas chromatography (GC) research, the fatty acid profile was evaluated. By combining the oil samples with hexane and methanolic potassium hydroxide, the oil samples were derivatized to methyl esters (PN-EN ISO: 5509:2001) [17]. The resulting fatty acid methyl esters (FAMEs) were then analyzed using the YL6100 GC equipment (Young Lin Instrument Co., Ltd., Anyang, Republic of Korea) equipped with a flame ionization detector and a 60 m long BPX 70 capillary column (SGE Analytical Science, Milton Keynes, UK). Split injection mode was employed, with nitrogen serving as the carrier gas being applied at a ratio of one to fifty. The temperature of the detector was 250 °C, and the injector was 225 °C. The oven’s temperature program was as follows: The sample was first heated to 70 °C for 0.5 min, then to 160 °C at a rate of 15 °C/min, and finally to 200 °C at a rate of 1.1 °C/min. These temperatures were maintained for 6 min. Afterwards, the sample was heated once more to 225 °C at a rate of 30 °C/min. Based on retention durations on the chromatogram in comparison to the FAME mixture standard (Supelco 37 Component FAME Mix, Sigma-Aldrich, Bellefonte, PA, USA), the fatty acids were identified. A percentage share of each identified fatty acid in the sample was computed for the results [18].
The fatty acid distribution in triacylglycerols (TAGs) was also assessed in GC analysis. The distribution was determined by the selective hydrolysis of ester bonds in the sn-1,3 positions by pancreatic lipase. The isolation was carried out on a silica gel TLC plate. Isolated sn-2 monoacylglycerols were scraped off with gel and extracted using diethyl ether. Samples were then derivatized and subjected to GC analysis [19].

2.2.9. Statistical Analysis

The experimental design, model fitting, and optimization was carried out using Design-Expert software (v. 22.0.2, Stat-Ease Inc., Minneapolis, MN, USA). The fit summary with determination coefficient, lack of fit test, ANOVA test for fitted model, and equation determination were performed.
The results from detailed oil analyses (oxidation kinetics, DSC, GC) were subjected to the statistical analysis in Statistica software (v. 13.3, Statsoft, Kraków, Poland). Analysis of variance (ANOVA) followed by post hoc Tukey’s test were carried out. A p-value of 0.05 was applied to determine significant differences.

3. Results and Discussion

3.1. Extraction Yield

One of the main discriminants justifying usage of alternative extraction methods, like UAE, is oil yield improvement. The goal is to reach maximum possible yield with lowest possible energy and time consumption in order to make the process profitable. Multiple studies proved UAE was an effective method in terms of oil yield improvement [20,21,22,23].
Results of extraction yield obtained in 30 experimental runs for each oil were used to fit the mathematical models and their equations which reflected changes in response depending on extraction time and ultrasound amplitude. The graphical expressions of three-dimensional surface plots and contour graphs of variable interactions are shown in Figure 1. The suggested mathematical models were verified by the coefficient of determination (R2) and in the ANOVA tests (Table 2). Also, adequate Equations (9)–(11) outlining existing relationships between variables and responses were determined. For BB and CH seed oils, the yield quadratic model was significant (p < 0.05), with a non-significant lack of fit value (p > 0.05). The interactions between variables were less essential in case of RB seed oil extraction yield, as the two-factorial model was fit with significance (p < 0.05).
Cavitation affects transport and extraction rates, which are impacted by acoustic power, frequency, and ultrasonic intensity [6]. Thus, ultrasound amplitude level significantly influenced the oil yield. However, the results differed slightly depending on seeds used in the extraction procedure. Generally, mild extraction conditions, considering ultrasound amplitude, were the most suitable in terms of oil yield. In previous studies, for cranberry seed oil [10] and black and redcurrant seed oils [11], the most favorable were the highest ultrasound amplitude values.
From surface plots, it can be observed that increasing the time up to around 10 min for BB and CH and to around 15 min for RB seeds leads to the highest oil yield results. The effect of time connects with prolonged sonoporation, erosion, and detexturation of the matrix, which promotes mass transfer from cells to the solvent [6]. However, prolonged time may result in the more local rapid events presence in the ultrasonic field. That may lead to solvent evaporation which may have a negative impact on the yield, as it was described by Senrayan and Venkatachalam [24].
Y i e l d B B = 6.18 + 0.05 · X 1 + 0.48   · X 2 + 0.003 · X 1 X 2 0.001 · X 1 2 0.04 · X 2 2
Y i e l d C H = 3.18 + 0.04 · X 1 + 0.34 · X 2 0.001 · X 1 X 2 0.0003 · X 1 2 0.02 · X 2 2
Y i e l d R B = 2.28 + 0.06 · X 1 + 0.38   · X 2 0.005 · X 1 X 2

3.2. Oxidation Induction Time

Oxidation induction time (OIT) is an important oil feature as it reflects the stability of oil and its resistance to the oxidation process [25]. The PDSC method applied in the following study allows assessing OIT in an accelerated mode [26]. The mass transfer improvement during UAE can also include bioactive compound co-extraction [27]. Also, the inactivation of oxidative enzymes, i.e., peroxidase and lipase, may occur during UAE [28]. These mechanisms can be responsible for longer OIT of oils and thus prolong their shelf life. Ultrasound treatment may, however, lead to formation of free radicals, which may induce lipid oxidation reactions [29]. That is why the UAE process needs to be adjusted in order to balance the influence of both factors.
The response surface 3D graphs with contour graphs showing the extraction time and amplitude influence on OIT are presented in Figure 2. Based on the results, adequate models described by Equations (12)–(14) were fit, tested in ANOVA analysis, and verified by the coefficient of determination (R2) (Table 3). As OIT of BB and CH seed oils was dependent on the amplitude and extraction time and their interactions, they were described by quadratic models (p < 0.05) with non-significant lack of fit values (p > 0.05). The OIT of RB seed oil dependence was fit using a linear mathematical model (p < 0.05).
The impact of amplitude on OIT is consistent for all studied oils. With the increase in amplitude, the OIT was also increasing. Longer extraction time in the case of CH and RB oils also resulted in higher OIT values. The elevated oxidative stability among oils subjected to longer US treatment was also found by Malićanin et al. [30]. Except the sample that was treated with US for 135 min, the oxidative stability parameter (which was oxidation onset temperature) was increasing gradually as the time of UAE was prolonged. The study of radish seed oil revealed that oil extracted in optimized UAE conditions was characterized by almost two times longer OIT than oil extracted in the Soxhlet procedure (72.5 min vs. 36.5 min, measured in 130 °C) [31]. Our findings were also in agreement with previous results obtained in the optimization studies for cranberry seed oil [10] and black and red currant seed oils [11].
On the contrary, in the study by Perez-Saucedo et al. [9], it was described that ultrasound treatment resulted in decreased oxidation induction time of avocado oil when compared to Soxhlet extraction. Furthermore, Böger et al. [21] described that US application significantly accelerated free radical formation during storage, which was correlated with the decreased oxidation resistance of grape seed oils obtained during UAE.
O I T B B = 52.53 + 0.001 · X 1 + 2.47 · X 2 0.04 · X 1 X 2 + 0.005 · X 1 2 0.02 · X 2 2
O I T C H = 11.17 + 0.87 · X 1 + 1.82 · X 2 + 0.005 · X 1 X 2 0.008 · X 1 2 0.08 · X 2 2
O I T R B = 39.14 + 0.17 · X 1 + 0.31   · X 2

3.3. Optimization of Ultrasound Oil Extraction

Based on the mathematical formulas, the optimal conditions of BB, CH, and RB oil extractions were determined. The optimization criteria were chosen in order to obtain maximum responses values. The variable conditions were set as in a range of 5–15 min extraction time and 20–100% ultrasound amplitude. One solution with appropriate desirability result was chosen for each oil extraction. The optimized conditions of UAE with actually applied conditions and predicted responses with real values measured are summarized in Table 4. The optimal conditions were adjusted to the capability of the ultrasound processor and applied in order to verify predicted values of experiment responses. It can be noted that the actual means of yield and OIT values were within maximum ± 5% deviation from predicted results. It means that the predictions of the models were accurate and that applying RSM helps to forecast the results of the conducted experiment.
The optimization of UAE of oil from BB, CH, or RB seeds was not discussed widely so far. Matei et al. [32] studied the UAE of blackberry seed oil optimization. In the cited paper, ultrasound intensity, and extraction temperature and time were variables and extraction efficiency was a response. Researchers used n-hexane as a solvent in a 1/20 solid/liquid ratio. Based on the experiments, 13.77 W/cm2, 45 °C, and 15 min were chosen as optimum ultrasound intensity, extraction temperature and time, respectively. Regarding the optimum time of extraction, in the following study, shorter extraction time was enough to achieve maximized response values for BB seed oil. Teng et al. [33] optimized the ethanolic UAE of RB seed oil. The independent variables in their study were sonication time (10–50 min) and extraction temperature (30–70 °C), while one of the responses was extraction yield. The optimum conditions were described as 37 min extraction time in 54 °C temperature, which resulted in 22.78 ± 0.27% extraction yield. Since the range of extraction time variable differed from the extraction time values applied in the following study, the comparison is not exactly possible. However, it could be concluded that Teng et al. [33] reached very high extraction yield for RB seed oil, but it required longer sonication. Studies on optimization of UAE from other berry seeds were also carried out. Isopencu et al. [34] described the UAE of sea buckthorn seed oil. The maximum extraction efficiency was reached while applying ultrasound intensity of 13.77 W/cm2, temperature of 40 °C, and time of 10 min. For the cranberry seed oil, 95% ultrasound amplitude and 11.38 min time were chosen as optimum conditions, which resulted in an almost 22% extraction yield and maximum induction time equal to 52.6 ± 1.0 min [10]. Generally, it could be summarized that rather higher operating conditions of ultrasound intensity or amplitude are more effective in terms of extraction yield or efficiency. By applying a higher power of ultrasound, acceptable oil yield can be reached in shorter time.

3.4. Kinetic Parameters of Oil Oxidation
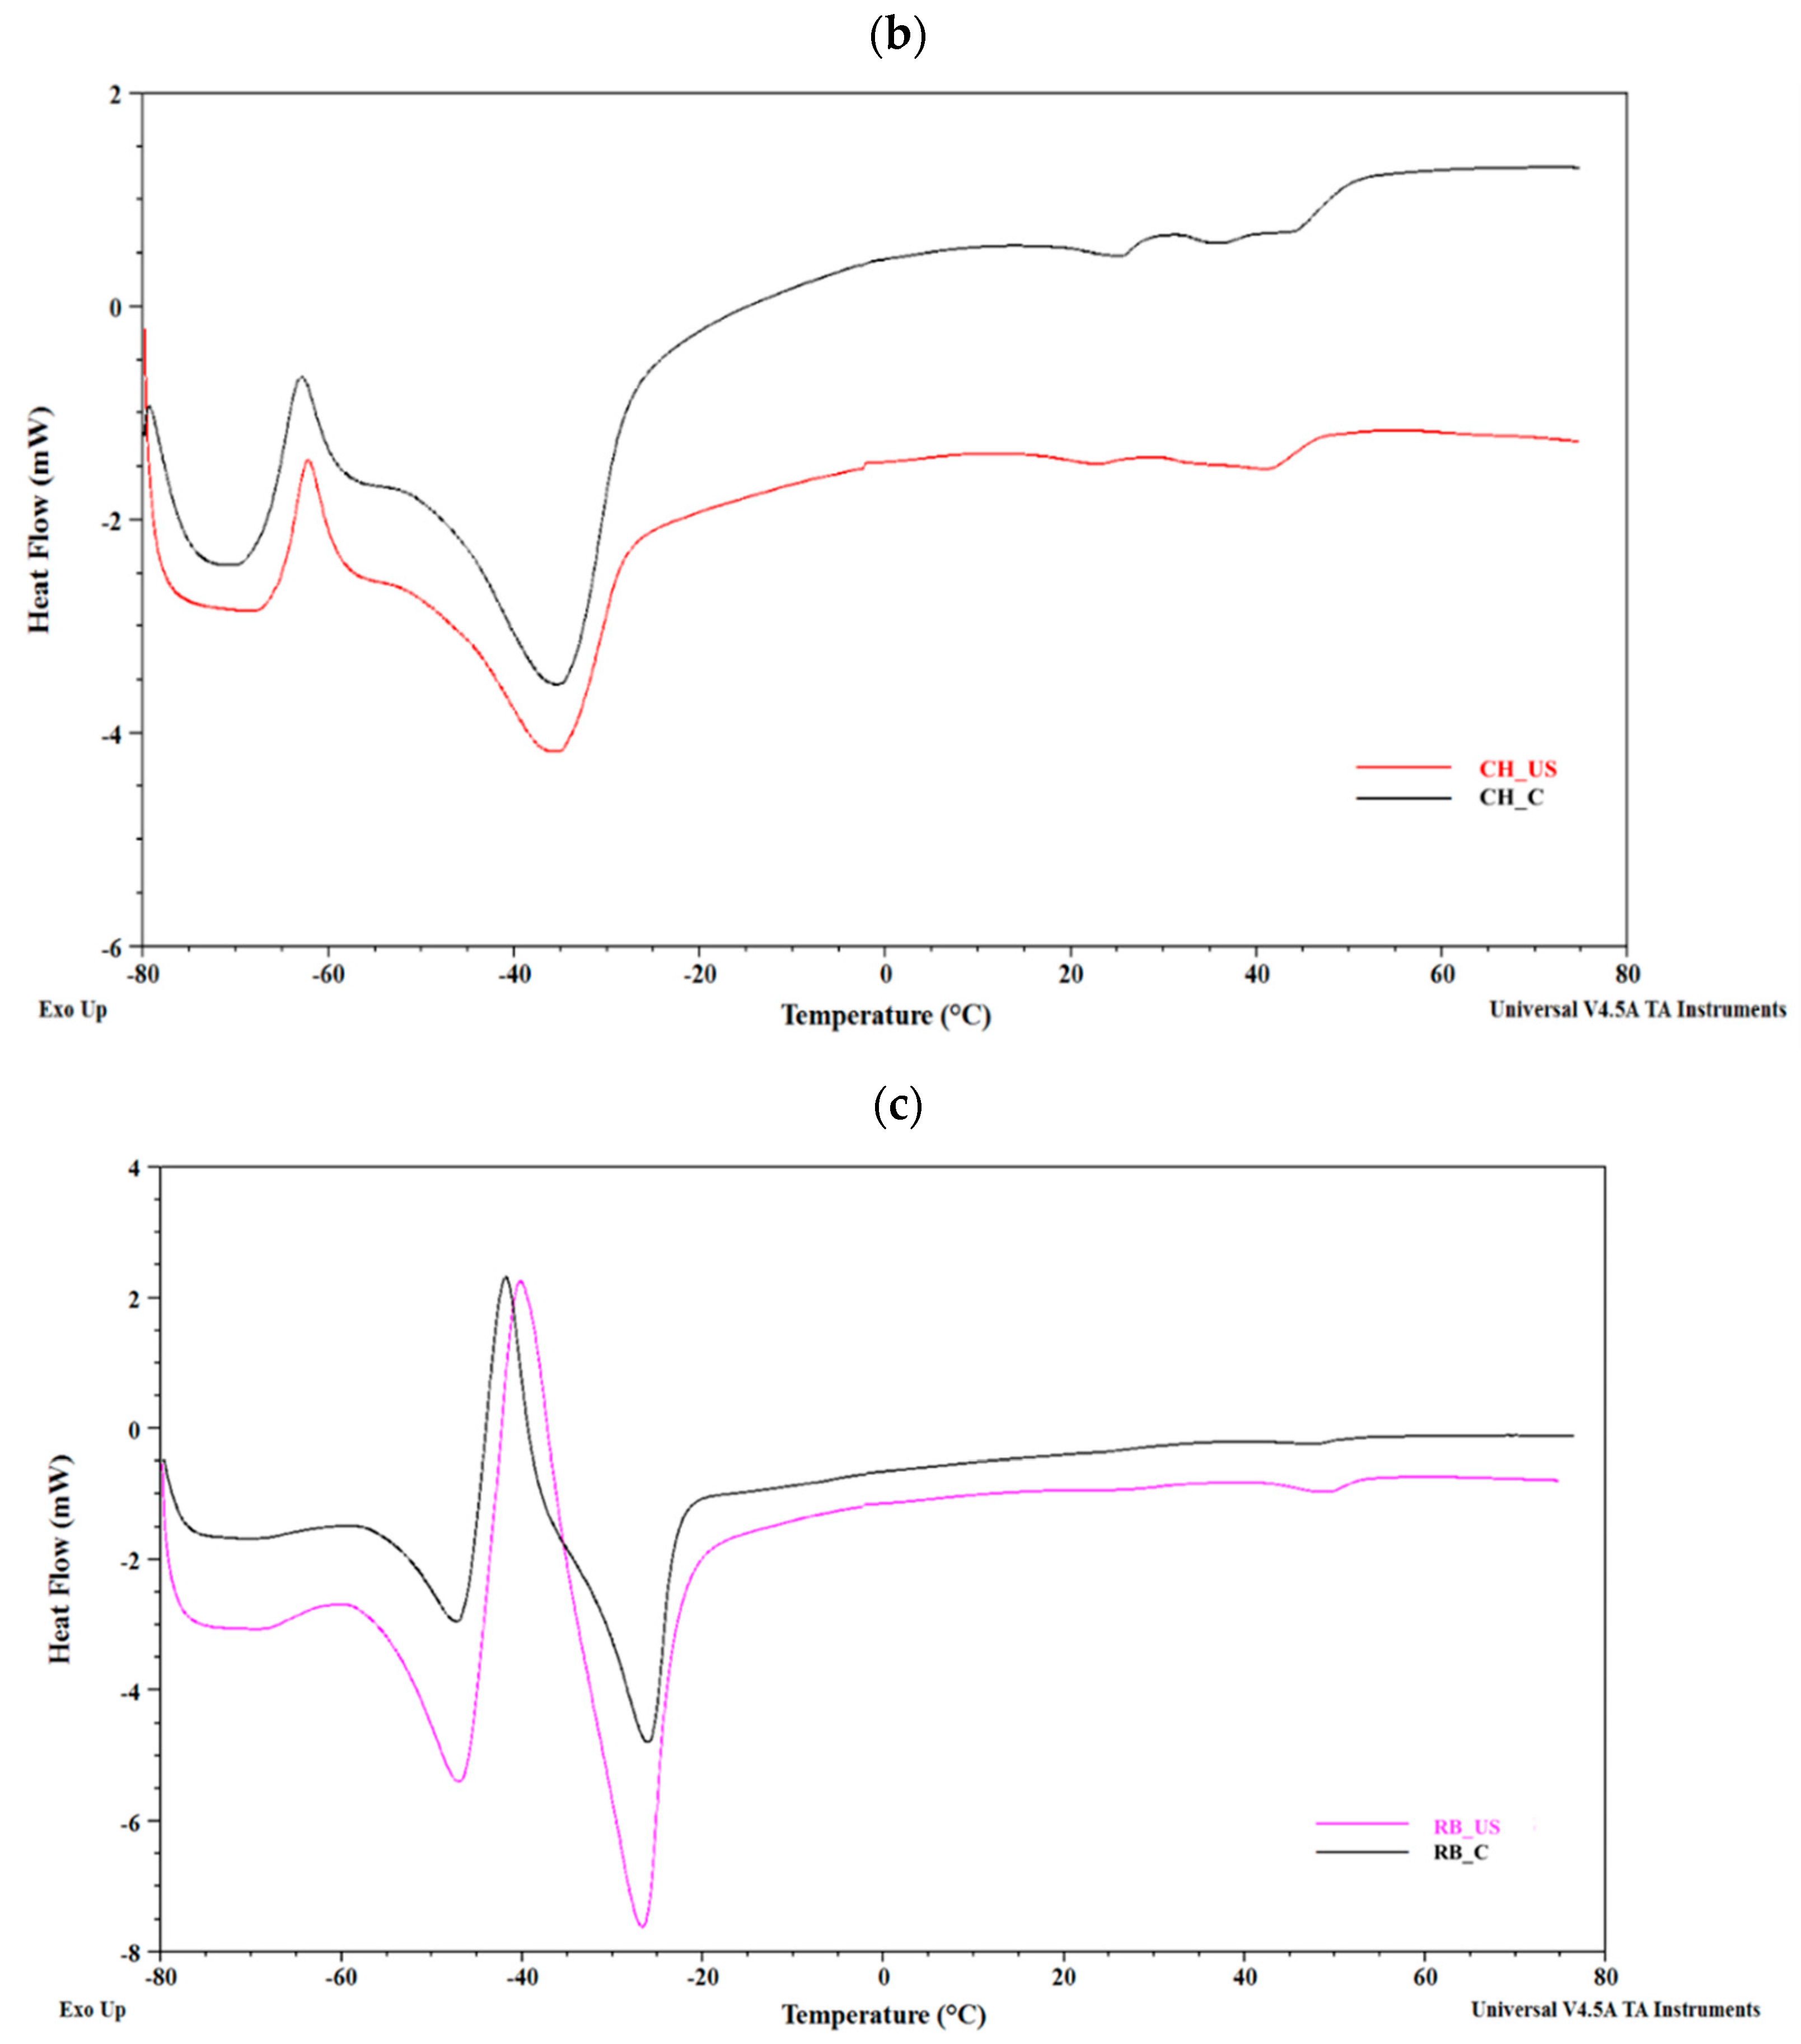
Based on the oxidation onset temperatures obtained in the PDSC assay in different heating rates, regression analysis was carried out. The results are shown in Table 5. Activation energies ranged from 82.98 to 92.01 kJ/mol. In the case of all the studied seed oils, UAE resulted in slightly higher Ea values. The findings were similar to results obtained for UAE cranberry seed oil [10] and redcurrant seed oil [11]. Also, activation energy values for berry seed oils were higher than activation energies of rapeseed and sunflower oils obtained in the accelerated storage study [35]. However, similar Ea (97.43–99.94 kJ/mol) were obtained for olive oils by Farhoosh and Hoseini-Yazidi [36]. According to Adhvaryu et al. [37], Ea is correlated with the fatty acid profile of oil, and the more PUFAs are found in oil, the higher Ea values are observed. Also, bioactive compounds presence influences the Ea of oil. Oxidation rate constants in 100–140 °C ranged from 0.0018 to 0.053, with only slight differences between oils obtained in different extraction procedures. Briefly, it can be observed that extraction method does not influence the kinetic parameters of oil oxidation and that these features are mostly dependent on the source of oil.

3.5. DSC Assessment

The BB, CH, and RB seed oils obtained in optimized ultrasound treatment conditions and control samples were subjected to detailed DSC analysis. Melting and crystallization profiles were obtained and expressed as curves with specific temperatures describing recorded peaks (Table 6). The DSC curves picturing melting profiles of oils are shown in Figure 3. It can be noted that the courses of melting curves are similar for the oils obtained from the same source. This confirms DSC as an oil authentication method [38]. In the study by Gila et al. [39], ultrasound treatment influence on olive oil quality was assessed. They also reported that US did not influence the crystallization nor melting characteristics of oils recorded by DSC. However, Rezvankhah et al. [40] found that melting and crystallization behavior of hempseed oil was affected by US applied in the extraction process. It was discovered that UAE oil was characterized by lower melting point than the control sample obtained in Soxhlet extraction, which could be attributed to the PUFA/SFA ratio, triacylglycerol composition, or crystalline structure.
Considering detailed results, in melting characteristics of BB and CH seed oils, two peaks were visible. In the case of BB seed oils, one major peak around −42 °C and minor around −21 °C were observed, which is in agreement with previous findings [41]. The DSC curve of CH seed oils consisted of one exothermic peak around −63 °C and one endothermic at −35 °C. For RB seed oils, three peaks were recorded, two endothermic- around −46 °C and around −26 °C and one exothermic, at around −40 °C. Similar curves were presented by Rajagukguk et al. [42] for the cold-pressed raspberry seed oil and by Micić et al. [41] for hexane-extracted raspberry seed oil. Any appearing differences may have been caused by changes in fatty acid profile or distribution in TAGs, as thermal events recorded during DSC in oil samples are associated with them. Low melting fractions of TAGs consist mainly of PUFAs, middle-melting TAGs consist of MUFAs and PUFAs. SFA-based TAGs are not common in the vegetable oils; thus, the peaks correlated to fully saturated TAGs were not recorded in the present study [43].
Crystallization was a one-step thermal event for all studied samples. Some differences between samples of oil obtained in optimized UAE conditions and control samples were found. In the case of oils extracted using US treatment, lower crystallization temperatures than for conventionally extracted oils were observed. The differences can be contributed to the changes in degree of saturation of TAGs, fatty acid chains length, and fatty acid distribution in TAGs [44]. Also, oils with higher SFA content crystallize in higher temperatures [45]. In regard to the literature, the crystallization peak temperatures of RB and BB oils in the present study are lower than those reported by Rajagukguk et al. [42], Micić et al. [41], or Oomah et al. [46]. Crystallization behavior descriptions for the CH seed oil have not been found yet.

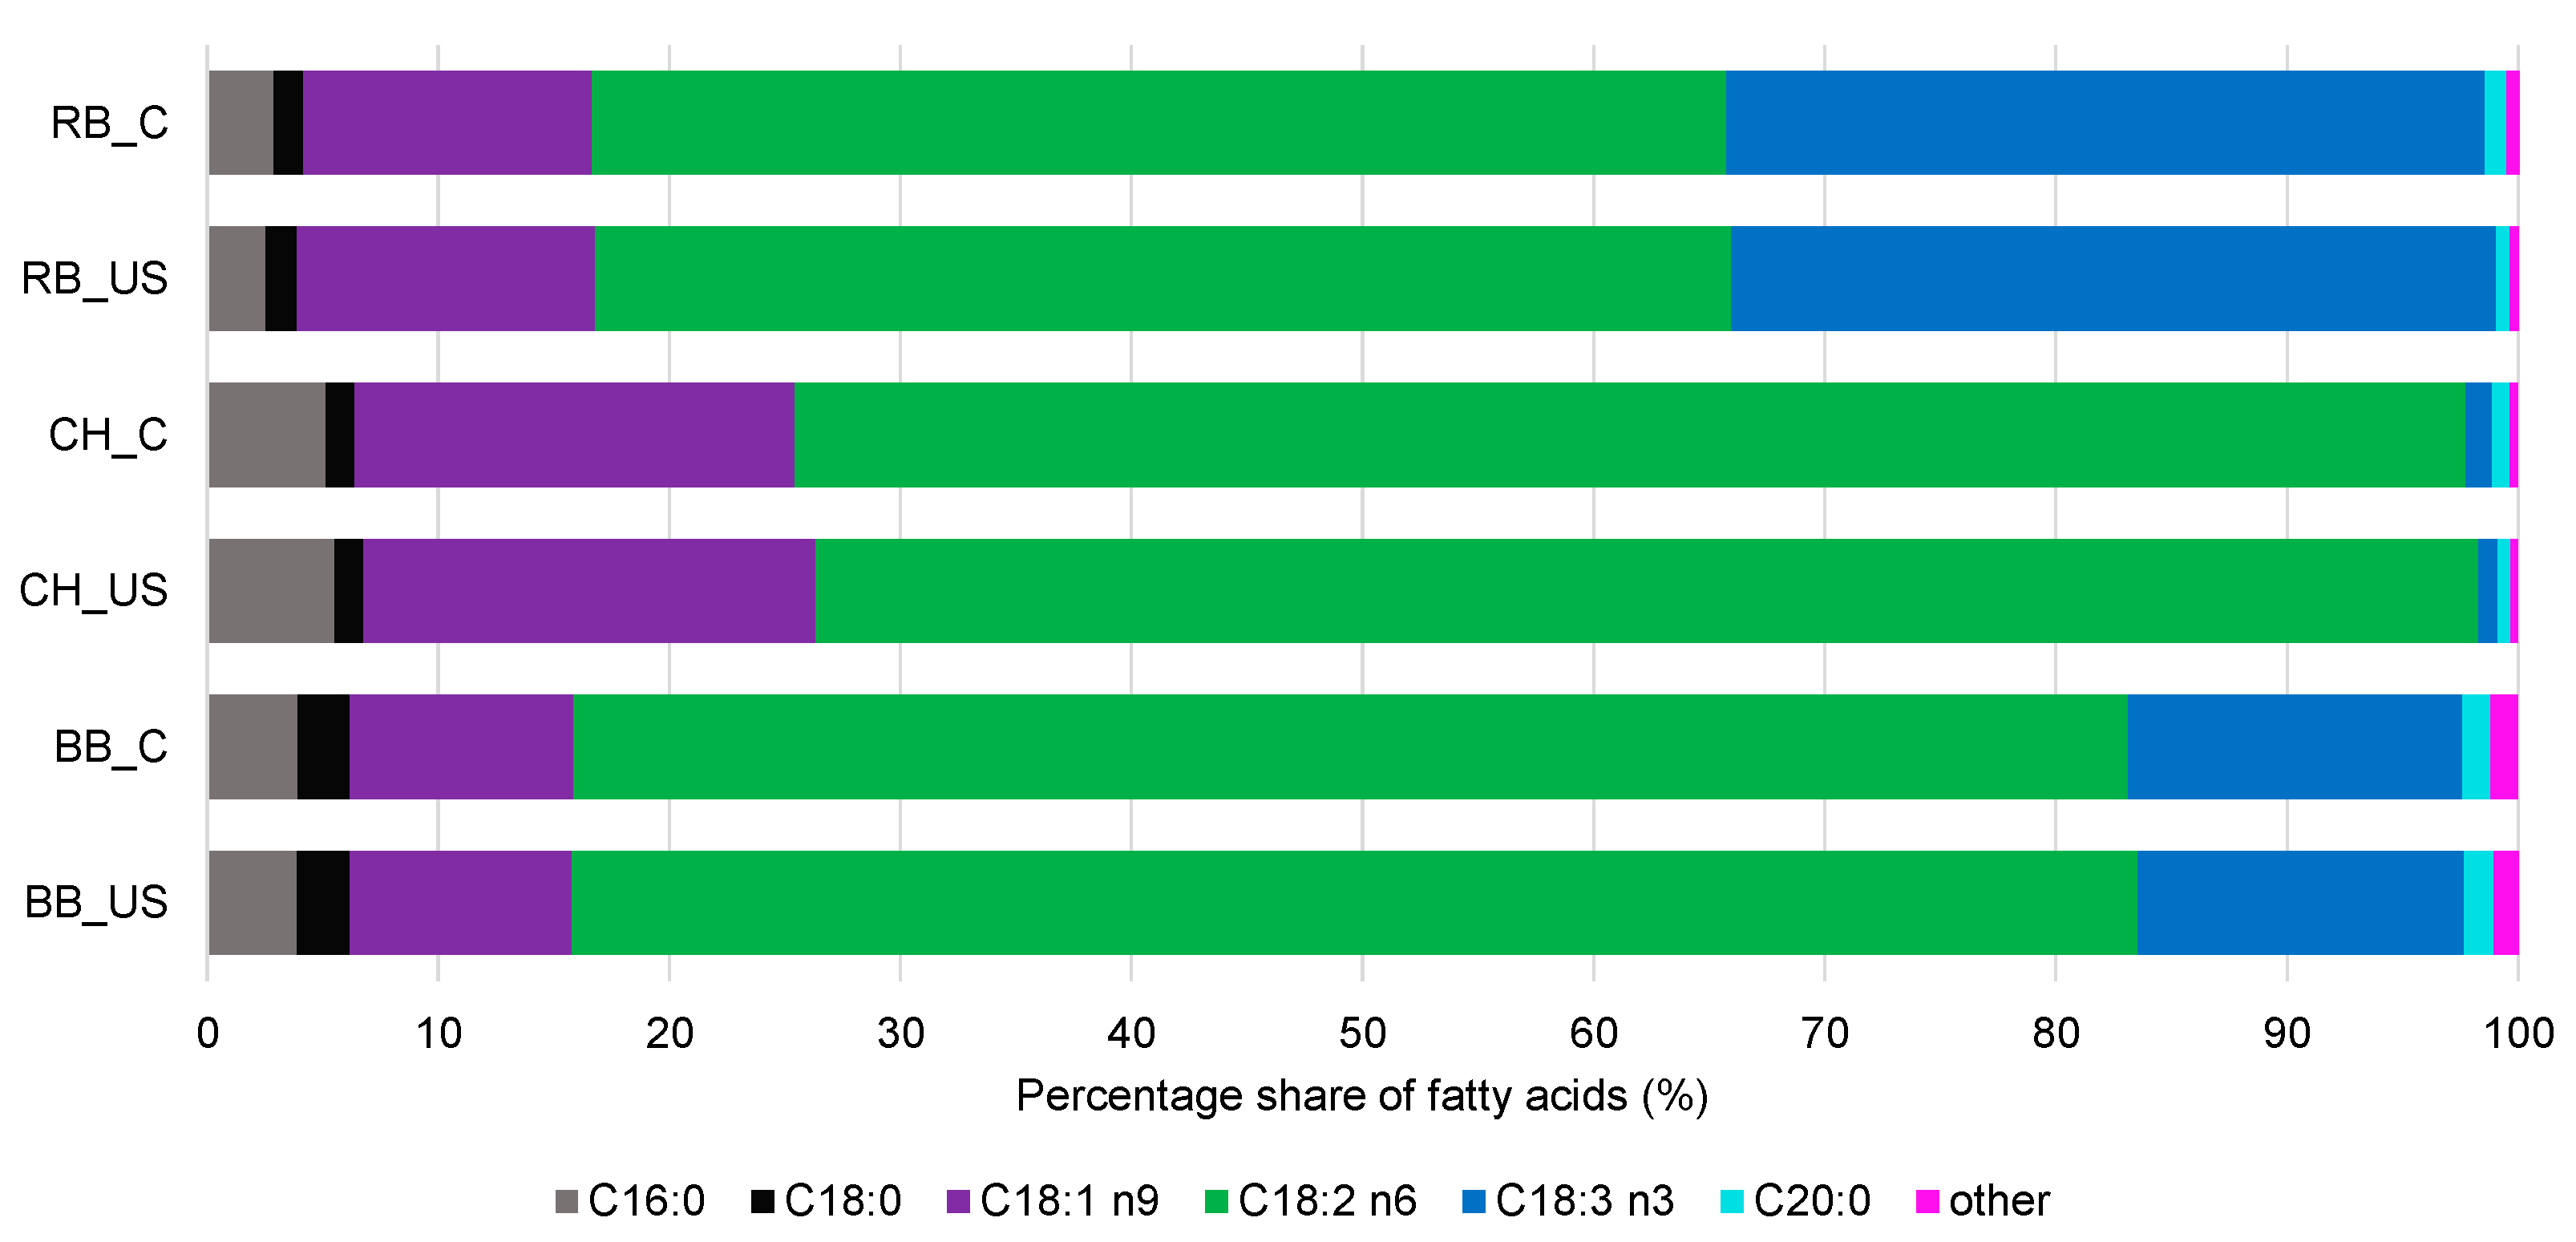
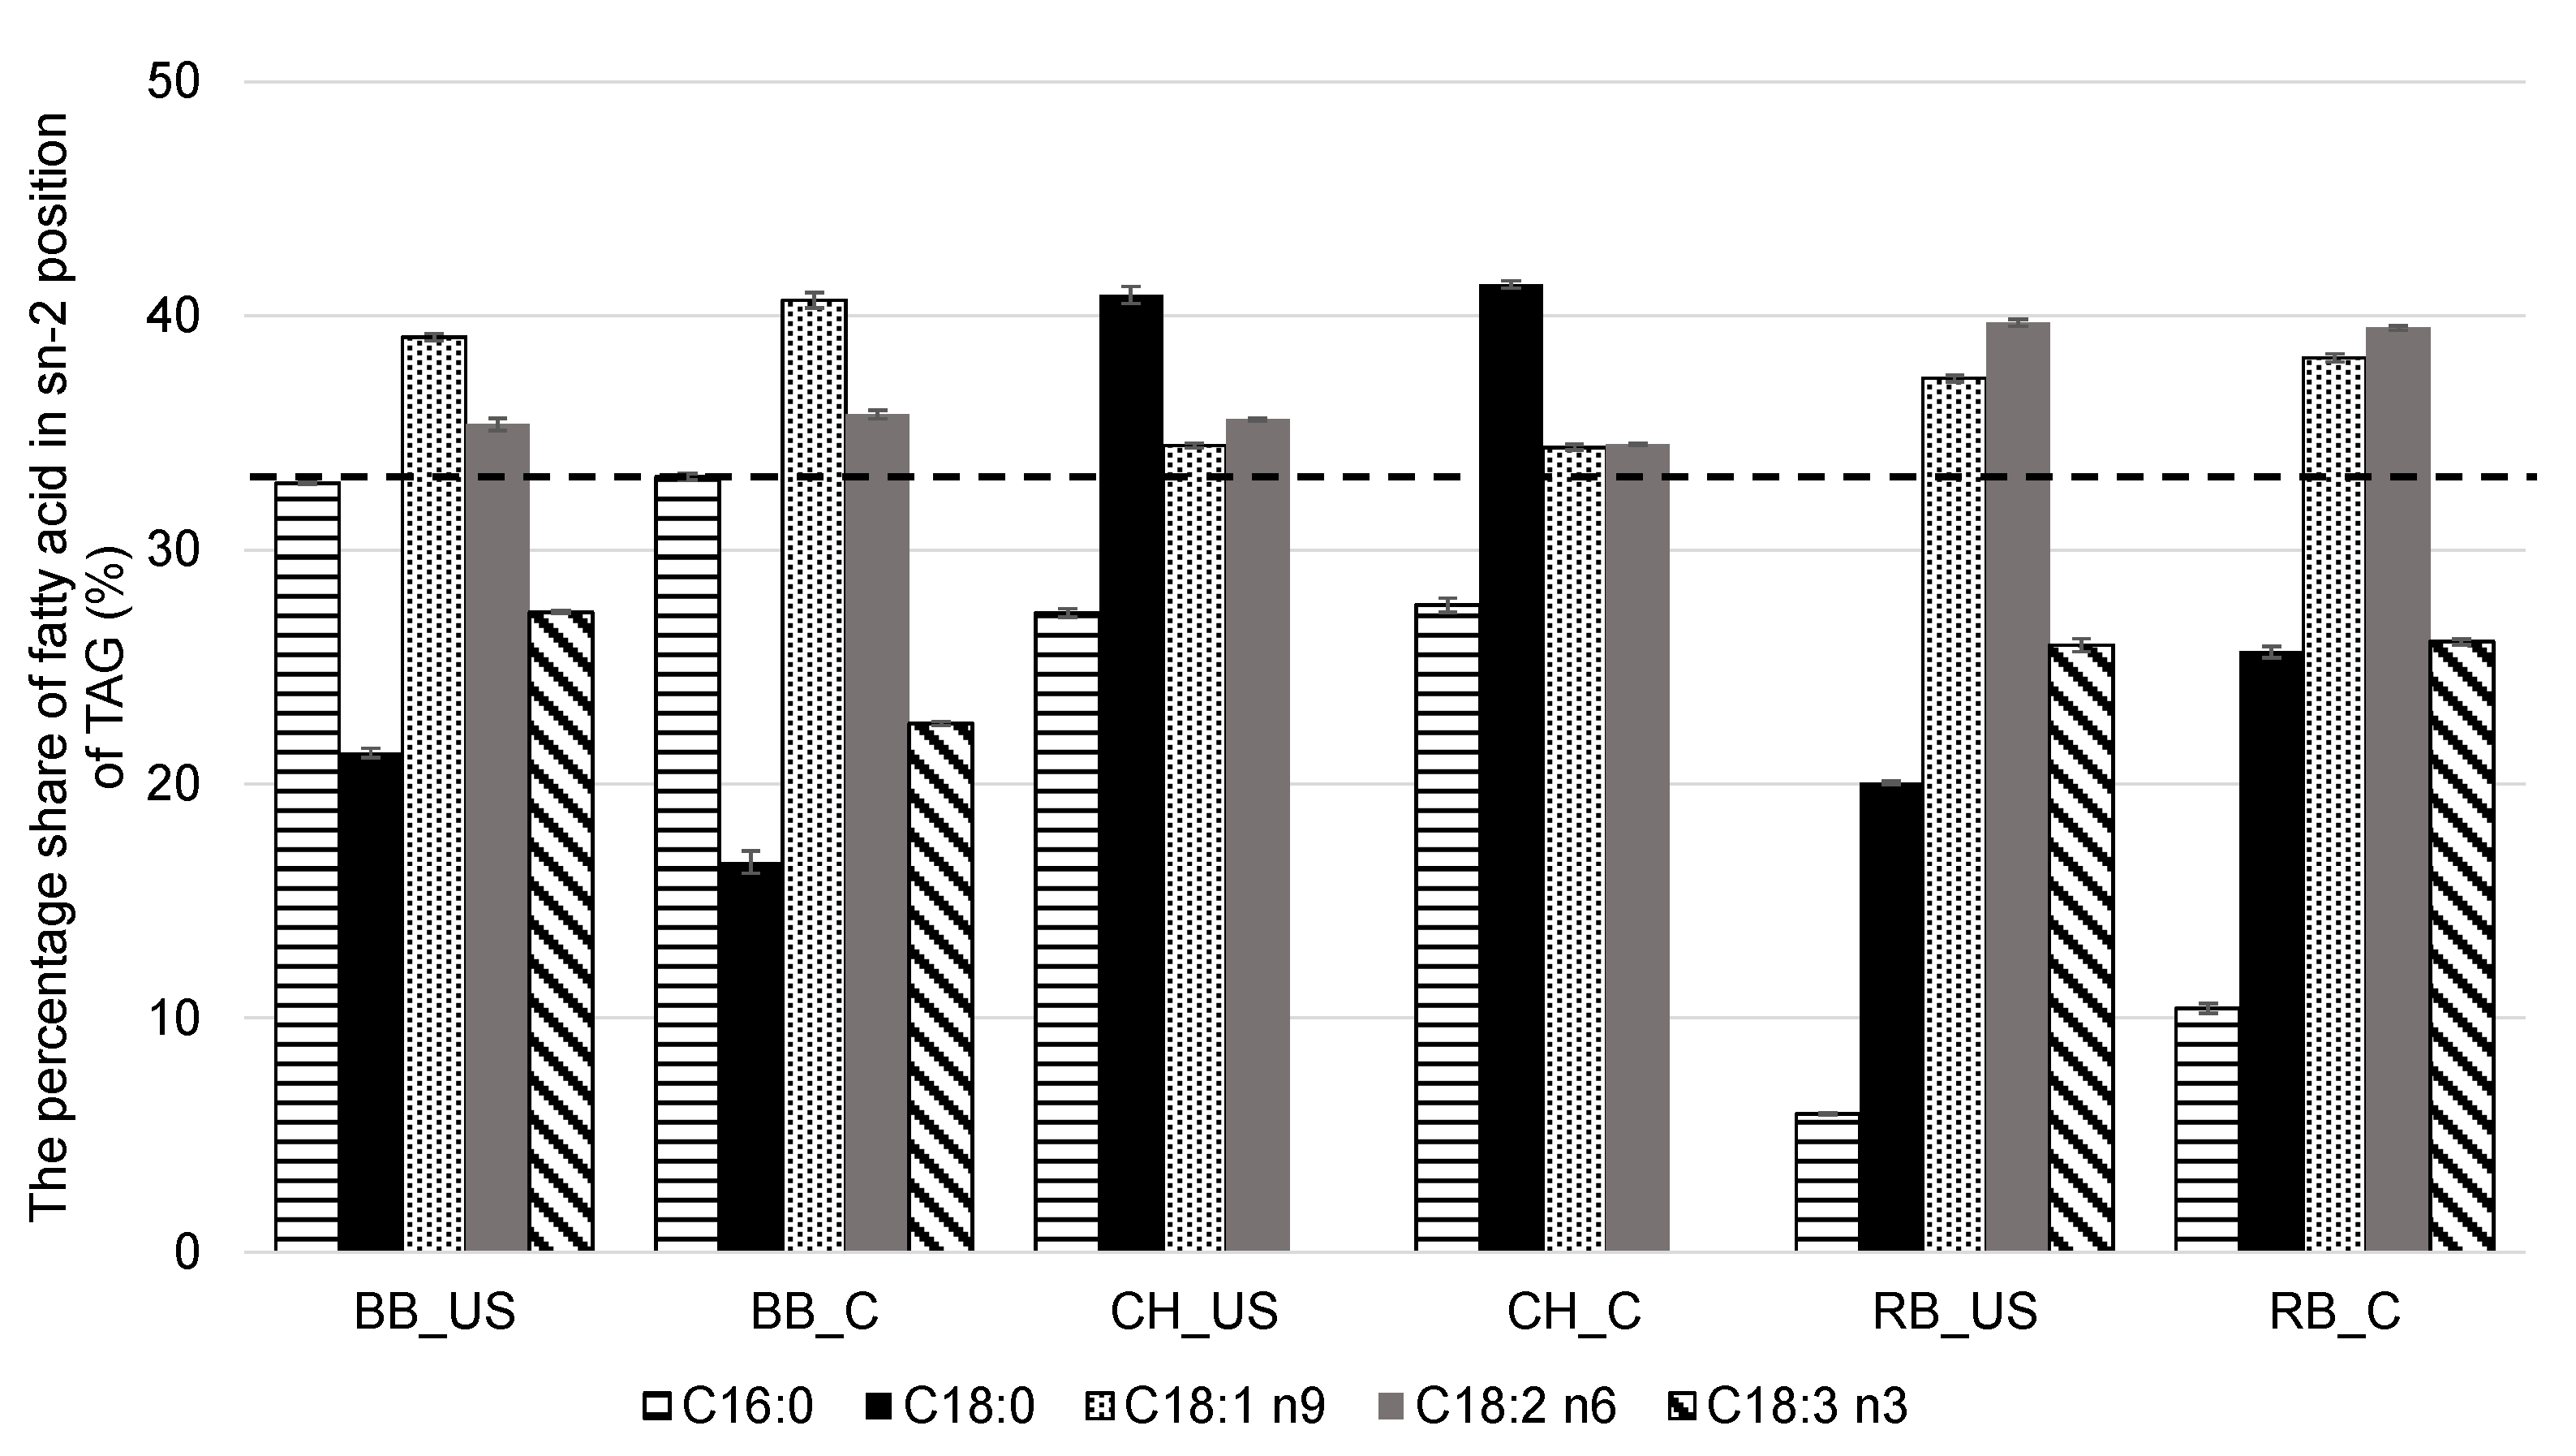
3.6. GC Analysis of Fatty Acid Profile and Distribution in sn-1,3 and sn-2 Positions in Triacylglycerols

Fatty acid profile could determine the possible application of oils. Figure 4 shows the percentage share of fatty acids in berry seed oils. All the tested samples presented a specific fatty acid profile for liquid plant oils. Major groups of detected fatty acids were PUFAs with linoleic fatty acid (C18:2 n6) as a predominant one. The fatty acid composition was similar to that of previously described studies [32,47,48].
The percentage share of studied oils did not depend significantly on the extraction method applied. This is in agreement with previous findings by Gasparini et al. [7] and Thilakarathna et al. [49] who reported that fatty acid content may differ when different extraction methods are applied; however, the proportion of fatty acids remains stable or changes slightly, and it is a characteristic feature of oil originating from the same source.
Taking into account fatty acid distribution in TAG structure, the tendency remains similar to percentage share of fatty acids. The proportions are specific for particular oil, without significant impact of the extraction method applied. The type of TAG molecules determines its nutritional properties. The sn-2 position of TAGs in plant oils is usually occupied by unsaturated fatty acids [50], which was also confirmed for the studied oils (Figure 5). However, chokeberry seed oil was surprisingly characterized by high contribution of palmitic acid (C16:0) in the sn-2 position of TAG. The fatty acid position in TAG may affect the oxidative stability of oils, and according to Endo et al. [51], unsaturated fatty acids located in the sn-2 position contribute to improved oxidative stability of oil, which stands in agreement with our findings, as chokeberry seed oil was characterized by lower OIT than other oils.

4. Conclusions

The present work reveals great potential of ultrasound application in waste management and food processing industries. Ultrasound-assisted extraction is not only a faster and more sustainable method of oil extraction compared to the conventional process, but it also results in a product with improved oxidative stability. The response surface methodology turns out to be useful in optimizing parameters of ultrasound-assisted extraction of oil from blackberry, chokeberry, and raspberry seeds. As a result of the process carried out in optimized conditions, oil with relatively high yield (6.02–8.10%) and long oxidation induction time (48.78–71.15 min) is extracted. All that proves that ultrasound significantly affects mass transfer from solid to liquid medium; thus, yield and bioactive compound recovery, which prevent oil from oxidation, can be maximized. Apart from that, ultrasound does not have any adverse effect on the studied parameters of oils, like kinetic parameters, melting and crystallization characteristics, fatty acid profile and distribution in triacylglycerols. The studies on the topic should be continued in order to deepen the knowledge of specific mechanisms controlling the ultrasound-assisted process and to determine the way in which it influences the quality of products obtained.

Author Contributions

Conceptualization, I.P., A.G. and A.W.; methodology, I.P.; software, I.P. and R.B.; validation, I.P.; formal analysis, I.P.; investigation, I.P.; resources, I.P.; data curation, I.P.; writing—original draft preparation, I.P.; writing—review and editing, A.G.; visualization, I.P. and R.B.; supervision, A.G.; project administration, A.G.; funding acquisition, A.G. All authors have read and agreed to the published version of the manuscript.

Funding

Some research equipment was purchased as part of the “Food and Nutrition Centre—modernisation of the WULS campus to create a Food and Nutrition Research and Development Centre (CŻiŻ)” co-financed by the European Union from the European Regional Development Fund under the Regional Operational Programme of the Mazowieckie Voivodeship for 2014–2020 (Project No. RPMA.01.01.00-14-8276/17).

Institutional Review Board Statement

Not applicable.

Informed Consent Statement

Not applicable.

Data Availability Statement

Data presented in the following study are available on reasonable request from the corresponding author.

Acknowledgments

Authors acknowledge Justyna Wójcik-Seliga from Cultivar Testing, Nursery and Gene Bank Resources Department, Institute of Horticulture National Research Institute in Skierniewice, Poland for providing Rubus var. Brzezina fruits cultivated from the gene bank collection in Dabrowice, Poland and Sandra Czarnecka for help in carrying out the analyses and technical support.

Conflicts of Interest

The authors declare no conflicts of interest.

References

  1. Diez-Sánchez, E.; Quiles, A.; Hernando, I. Use of Berry Pomace to Design Functional Foods. Food Rev. Int. 2023, 39, 3204–3224. [Google Scholar] [CrossRef]
  2. Pecyna, A.; Krzywicka, M.; Blicharz-Kania, A.; Buczaj, A.; Kobus, Z.; Zdybel, B.; Domin, M.; Siłuch, D. Impact of Incorporating Two Types of Dried Raspberry Pomace into Gluten-Free Bread on Its Nutritional and Antioxidant Characteristics. Appl. Sci. 2024, 14, 1561. [Google Scholar] [CrossRef]
  3. Saracila, M.; Untea, A.E.; Oancea, A.G.; Varzaru, I.; Vlaicu, P.A. Comparative Analysis of Black Chokeberry (Aronia melanocarpa L.) Fruit, Leaves, and Pomace for Their Phytochemical Composition, Antioxidant Potential, and Polyphenol Bioaccessibility. Foods 2024, 13, 1856. [Google Scholar] [CrossRef] [PubMed]
  4. Čechovičienė, I.; Šlepetienė, A.; Gumbytė, M.; Paulauskienė, A.; Tarasevičienė, Ž. Composition and Physicochemical Properties of Pomace of Various Cultivars of Blackberry (Rubus fruticosus L.). Horticulturae 2023, 10, 38. [Google Scholar] [CrossRef]
  5. Piasecka, I.; Wiktor, A.; Górska, A. Alternative Methods of Bioactive Compounds and Oils Extraction from Berry Fruit By-Products—A Review. Appl. Sci. 2022, 12, 1734. [Google Scholar] [CrossRef]
  6. Chemat, F.; Rombaut, N.; Sicaire, A.G.; Meullemiestre, A.; Fabiano-Tixier, A.S.; Abert-Vian, M. Ultrasound Assisted Extraction of Food and Natural Products. Mechanisms, Techniques, Combinations, Protocols and Applications. A Review. Ultrason. Sonochem. 2017, 34, 540–560. [Google Scholar] [CrossRef] [PubMed]
  7. Gasparini, A.; Ferrentino, G.; Angeli, L.; Morozova, K.; Zatelli, D.; Scampicchio, M. Ultrasound Assisted Extraction of Oils from Apple Seeds: A Comparative Study with Supercritical Fluid and Conventional Solvent Extraction. Innov. Food Sci. Emerg. Technol. 2023, 86, 103370. [Google Scholar] [CrossRef]
  8. Milanović, J.; Malićanin, M.; Rakić, V.; Jevremović, N.; Karabegović, I.; Danilović, B. Valorization of Winery Waste: Prokupac Grape Seed as a Source of Nutritionally Valuable Oil. Agronomy 2021, 11, 1864. [Google Scholar] [CrossRef]
  9. Pérez-Saucedo, M.R.; Jiménez-Ruiz, E.I.; Rodríguez-Carpena, J.G.; Ragazzo-Sánchez, J.A.; Ulloa, J.A.; Ramírez-Ramírez, J.C.; Gastón-Peña, C.R.; Bautista-Rosales, P.U. Properties of the Avocado Oil Extracted Using Centrifugation and Ultrasound-Assisted Methods. Food Sci. Biotechnol. 2021, 30, 1051–1061. [Google Scholar] [CrossRef]
  10. Piasecka, I.; Brzezińska, R.; Ostrowska-Ligęza, E.; Wiktor, A.; Górska, A. Ultrasound-Assisted Extraction of Cranberry Seed Oil: Food Waste Valorization Approach. Eur. Food Res. Technol. 2023, 249, 2763–2775. [Google Scholar] [CrossRef]
  11. Piasecka, I.; Brzezińska, R.; Kalisz, S.; Wiktor, A.; Górska, A. Recovery of Antioxidants and Oils from Blackcurrant and Redcurrant Wastes by Ultrasound-Assisted Extraction. Food Biosci. 2024, 57, 103511. [Google Scholar] [CrossRef]
  12. Ni, Q.; Gao, Q.; Yu, W.; Liu, X.; Xu, G.; Zhang, Y. Supercritical Carbon Dioxide Extraction of Oils from Two Torreya Grandis Varieties Seeds and Their Physicochemical and Antioxidant Properties. LWT-Food Sci. Technol. 2015, 60, 1226–1234. [Google Scholar] [CrossRef]
  13. Bryś, J.; Wirkowska, M.; Górska, A.; Ostrowska-Ligęza, E.; Bryś, A.; Koczoń, P. The Use of DSC and FT-IR Spectroscopy for Evaluation of Oxidative Stability of Interesterified Fats. J. Therm. Anal. Calorim. 2013, 112, 481–487. [Google Scholar] [CrossRef]
  14. Wirkowska-Wojdyła, M.; Bryś, J.; Górska, A.; Ostrowska-Ligęza, E. Effect of Enzymatic Interesterification on Physiochemical and Thermal Properties of Fat Used in Cookies. LWT 2016, 74, 99–105. [Google Scholar] [CrossRef]
  15. Piasecka, I.; Górska, A.; Ostrowska-Ligęza, E.; Kalisz, S. The Study of Thermal Properties of Blackberry, Chokeberry and Raspberry Seeds and Oils. Appl. Sci. 2021, 11, 7704. [Google Scholar] [CrossRef]
  16. Embaby, H.E.; Miyakawa, T.; Hachimura, S.; Muramatsu, T.; Nara, M.; Tanokura, M. Crystallization and Melting Properties Studied by DSC and FTIR Spectroscopy of Goldenberry (Physalis peruviana) Oil. Food Chem 2022, 366, 130645. [Google Scholar] [CrossRef]
  17. PN-EN ISO: 5509:2001; Animal and Vegetable Fats and Oils. Preparation of Methyl Esters of Fatty Acids. Polish Committee for Standardization: Warsaw, Poland, 2001.
  18. Bryś, J.; Flores Lnês, F.V.; Górska, A.; Wirkowska-Wojdyła, M.; Ostrowska-Ligęza, E.; Bryś, A. Use of GC and PDSC Methods to Characterize Human Milk Fat Substitutes Obtained from Lard and Milk Thistle Oil Mixtures. J. Therm. Anal. Calorim. 2017, 130, 319–327. [Google Scholar] [CrossRef]
  19. Pina-Rodriguez, A.M.; Akoh, C.C. Enrichment of Amaranth Oil with Ethyl Palmitate at the Sn-2 Position by Chemical and Enzymatic Synthesis. J. Agric. Food Chem. 2009, 57, 4657–4662. [Google Scholar] [CrossRef]
  20. Dash, D.R.; Pathak, S.S.; Pradhan, R.C. Extraction of Oil from Terminalia Chebula Kernel by Using Ultrasound Technology: Influence of Process Parameters on Extraction Kinetics. Ind. Crops Prod. 2021, 171, 113893. [Google Scholar] [CrossRef]
  21. Böger, B.R.; Salviato, A.; Valezi, D.F.; Di Mauro, E.; Georgetti, S.R.; Kurozawa, L.E. Optimization of Ultrasound-Assisted Extraction of Grape-Seed Oil to Enhance Process Yield and Minimize Free Radical Formation. J. Sci. Food Agric. 2018, 98, 5019–5026. [Google Scholar] [CrossRef]
  22. Wong, S.T.; Tan, M.C.; Geow, C.H. Optimization of Ultrasound-Assisted Ethanol Extraction of Hazelnut Oil. J. Food Process. Preserv. 2019, 43, e14138. [Google Scholar] [CrossRef]
  23. Sanwal, N.; Mishra, S.; Sahu, J.K.; Naik, S.N. Effect of Ultrasound-Assisted Extraction on Efficiency, Antioxidant Activity, and Physicochemical Properties of Sea Buckthorn (Hippophae salicipholia) Seed Oil. LWT 2022, 153, 112386. [Google Scholar] [CrossRef]
  24. Senrayan, J.; Venkatachalam, S. Optimization of Ultrasound-Assisted Solvent Extraction (UASE) Based on Oil Yield, Antioxidant Activity and Evaluation of Fatty Acid Composition and Thermal Stability of Coriandrum sativum L. Seed Oil. Food Sci. Biotechnol. 2019, 28, 377–386. [Google Scholar] [CrossRef]
  25. Ciemniewska-Żytkiewicz, H.; Ratusz, K.; Bryś, J.; Reder, M.; Koczoń, P. Determination of the Oxidative Stability of Hazelnut Oils by PDSC and Rancimat Methods. J. Therm. Anal. Calorim. 2014, 118, 875–881. [Google Scholar] [CrossRef]
  26. Symoniuk, E.; Ratusz, K.; Ostrowska-Ligęza, E.; Krygier, K. Impact of Selected Chemical Characteristics of Cold-Pressed Oils on Their Oxidative Stability Determined Using the Rancimat and Pressure Differential Scanning Calorimetry Method. Food Anal. Methods 2018, 11, 1095–1104. [Google Scholar] [CrossRef]
  27. Mushtaq, A.; Roobab, U.; Denoya, G.I.; Inam-Ur-Raheem, M.; Gullón, B.; Lorenzo, J.M.; Barba, F.J.; Zeng, X.A.; Wali, A.; Aadil, R.M. Advances in Green Processing of Seed Oils Using Ultrasound-Assisted Extraction: A Review. J. Food Process. Preserv. 2020, 44, e14740. [Google Scholar] [CrossRef]
  28. Thilakarathna, R.C.N.; Siow, L.F.; Tang, T.K.; Lee, Y.Y. A Review on Application of Ultrasound and Ultrasound Assisted Technology for Seed Oil Extraction. J. Food Sci. Technol. 2022, 60, 1222–1236. [Google Scholar] [CrossRef]
  29. Wanasundara, P.K.J.P.D.; Shahidi, F. Antioxidants: Science, Technology, and Applications. In Bailey’s Industrial Oil and Fat Products; John Wiley & Sons, Ltd.: Hoboken, NJ, USA, 2005. [Google Scholar]
  30. Malićanin, M.; Rac, V.; Antić, V.; Antić, M.; Palade, L.M.; Kefalas, P.; Rakić, V. Content of Antioxidants, Antioxidant Capacity and Oxidative Stability of Grape Seed Oil Obtained by Ultra Sound Assisted Extraction. JAOCS J. Am. Oil Chem. Soc. 2014, 91, 989–999. [Google Scholar] [CrossRef]
  31. Stevanato, N.; da Silva, C. Radish Seed Oil: Ultrasound-Assisted Extraction Using Ethanol as Solvent and Assessment of Its Potential for Ester Production. Ind. Crops Prod. 2019, 132, 283–291. [Google Scholar] [CrossRef]
  32. Matei, P.L.; Deleanu, I.; Brezoiu, A.M.; Chira, N.A.; Busuioc, C.; Isopencu, G.; Cîlțea-Udrescu, M.; Alexandrescu, E.; Stoica-Guzun, A. Ultrasound-Assisted Extraction of Blackberry Seed Oil: Optimization and Oil Characterization. Molecules 2023, 28, 2486. [Google Scholar] [CrossRef] [PubMed]
  33. Teng, H.; Chen, L.; Huang, Q.; Wang, J.; Lin, Q.; Liu, M.; Lee, W.Y.; Song, H. Ultrasonic-Assisted Extraction of Raspberry Seed Oil and Evaluation of Its Physicochemical Properties, Fatty Acid Compositions and Antioxidant Activities. PLoS ONE 2016, 11, e0153457. [Google Scholar] [CrossRef]
  34. Isopencu, G.; Stroescu, M.; Brosteanu, A.; Chira, N.; Pârvulescu, O.C.; Busuioc, C.; Stoica-Guzun, A. Optimization of Ultrasound and Microwave Assisted Oil Extraction from Sea Buckthorn Seeds by Response Surface Methodology. J. Food Process. Eng. 2019, 42, e12947. [Google Scholar] [CrossRef]
  35. Amft, J.; Meissner, P.M.; Steffen-Heins, A.; Hasler, M.; Stöckmann, H.; Meynier, A.; Birault, L.; Velasco, J.; Vermoesen, A.; Perez-Portabella, I.; et al. Interlaboratory Study on Lipid Oxidation during Accelerated Storage Trials with Rapeseed and Sunflower Oil Analyzed by Conjugated Dienes as Primary Oxidation Products. Eur. J. Lipid Sci. Technol. 2023, 125, 2300067. [Google Scholar] [CrossRef]
  36. Farhoosh, R.; Hoseini-Yazdi, S.Z. Evolution of Oxidative Values during Kinetic Studies on Olive Oil Oxidation in the Rancimat Test. J. Am. Oil Chem. Soc. 2014, 91, 281–293. [Google Scholar] [CrossRef]
  37. Adhvaryu, A.; Erhan, S.Z.; Liu, Z.S.; Perez, J.M. Oxidation Kinetic Studies of Oils Derived from Unmodified and Genetically Modified Vegetables Using Pressurized Differential Scanning Calorimetry and Nuclear Magnetic Resonance Spectroscopy. Thermochim. Acta 2000, 364, 87–97. [Google Scholar] [CrossRef]
  38. Islam, M.; Bełkowska, L.; Konieczny, P.; Fornal, E.; Tomaszewska-Gras, J. Differential Scanning Calorimetry for Authentication of Edible Fats and Oils—What Can We Learn from the Past to Face the Current Challenges? J. Food Drug Anal. 2022, 30, 185–201. [Google Scholar] [CrossRef]
  39. Gila, A.; Sánchez-Ortiz, A.; Jiménez, A.; Beltrán, G. The Ultrasound Application Does Not Affect to the Thermal Properties and Chemical Composition of Virgin Olive Oils. Ultrason. Sonochem. 2021, 70, 105320. [Google Scholar] [CrossRef] [PubMed]
  40. Rezvankhah, A.; Emam-Djomeh, Z.; Safari, M.; Askari, G.; Salami, M. Investigation on the Extraction Yield, Quality, and Thermal Properties of Hempseed Oil during Ultrasound-Assisted Extraction: A Comparative Study. J. Food Process. Preserv. 2018, 42, e13766. [Google Scholar] [CrossRef]
  41. Micić, D.M.; Ostojić, S.B.; Simonović, M.B.; Pezo, L.L.; Simonović, B.R. Thermal Behavior of Raspberry and Blackberry Seed Flours and Oils. Thermochim. Acta 2015, 617, 21–27. [Google Scholar] [CrossRef]
  42. Rajagukguk, Y.V.; Islam, M.; Tomaszewska-Gras, J. Influence of Seeds’ Age and Clarification of Cold-Pressed Raspberry (Rubus idaeus L.) Oil on the DSC Oxidative Stability and Phase Transition Profiles. Foods 2023, 12, 358. [Google Scholar] [CrossRef]
  43. Dahimi, O.; Rahim, A.A.; Abdulkarim, S.M.; Hassan, M.S.; Hashari, S.B.T.Z.; Siti Mashitoh, A.; Saadi, S. Multivariate Statistical Analysis Treatment of DSC Thermal Properties for Animal Fat Adulteration. Food Chem. 2014, 158, 132–138. [Google Scholar] [CrossRef] [PubMed]
  44. Marikkar, J.M.N.; Ghazali, H.M.; Che Man, Y.B.; Lai, O.M. The Use of Cooling and Heating Thermograms for Monitoring of Tallow, Lard and Chicken Fat Adulterations in Canola Oil. Food Res. Int. 2002, 35, 1007–1014. [Google Scholar] [CrossRef]
  45. Tan, C.X.; Chong, G.H.; Hamzah, H.; Ghazali, H.M. Comparison of Subcritical CO2 and Ultrasound-Assisted Aqueous Methods with the Conventional Solvent Method in the Extraction of Avocado Oil. J. Supercrit. Fluids 2018, 135, 45–51. [Google Scholar] [CrossRef]
  46. Oomah, B.D.; Ladet, S.; Godfrey, D.V.; Liang, J.; Girard, B. Characteristics of Raspberry (Rubus idaeus L.) Seed Oil. Food Chem. 2000, 69, 187–193. [Google Scholar] [CrossRef]
  47. Mildner-Szkudlarz, S.; Różańska, M.; Siger, A.; Kowalczewski, P.Ł.; Rudzińska, M. Changes in Chemical Composition and Oxidative Stability of Cold-Pressed Oils Obtained from by-Product Roasted Berry Seeds. LWT 2019, 111, 541–547. [Google Scholar] [CrossRef]
  48. Ispiryan, A.; Bobinaite, R.; Urbonaviciene, D.; Sermuksnyte-Alesiuniene, K.; Viskelis, P.; Miceikiene, A.; Viskelis, J. Physico-Chemical Properties, Fatty Acids Profile, and Economic Properties of Raspberry (Rubus idaeus L.) Seed Oil, Extracted in Various Ways. Plants 2023, 12, 2706. [Google Scholar] [CrossRef]
  49. Thilakarathna, R.C.N.; Siow, L.F.; Tang, T.K.; Chan, E.S.; Lee, Y.Y. Physicochemical and Antioxidative Properties of Ultrasound-Assisted Extraction of Mahua (Madhuca longifolia) Seed Oil in Comparison with Conventional Soxhlet and Mechanical Extractions. Ultrason. Sonochem. 2023, 92, 106280. [Google Scholar] [CrossRef] [PubMed]
  50. Fabritius, M.; Linderborg, K.M.; Tarvainen, M.; Kalpio, M.; Zhang, Y.; Yang, B. Direct Inlet Negative Ion Chemical Ionization Tandem Mass Spectrometric Analysis of Triacylglycerol Regioisomers in Human Milk and Infant Formulas. Food Chem. 2020, 328, 126991. [Google Scholar] [CrossRef]
  51. Endo, Y.; Hoshizaki, S.; Fujimoto, K. Oxidation of Synthetic Triacylglycerols Containing Eicosapentaenoic and Docosahexaenoic Acids: Effect of Oxidation System and Triacylglycerol Structure. JAOCS J. Am. Oil Chem. Soc. 1997, 74, 1041–1045. [Google Scholar] [CrossRef]
Figure 1. Three-diemnsional and contour graphs showing oil yield dependence from extraction time and ultrasound amplitude.
Applsci 14 07214 g001
Figure 2. Three-dimensional and contour graphs showing oil oxidation induction time dependence from extraction time and ultrasound amplitude.
Applsci 14 07214 g002
Figure 3. DSC melting curves for (a) blackberry, (b) chokeberry, (c) raspberry seed oils obtained in optimized UAE conditions and in conventional extraction.
Applsci 14 07214 g003aApplsci 14 07214 g003b
Figure 4. The percentage share of fatty acids in tested oils obtained in conventional extraction procedure (BB_C, CH_C, RB_C) and under optimized UAE conditions (BB_US, CH_US, RB_US), C16:0—palmitic acid, C18:0—stearic acid, C18:1—oleic acid, C18:2—linoleic fatty acid, C18:3—α-linolenic acid, C20:0—arachidic acid.
Applsci 14 07214 g004
Figure 5. The percentage share of fatty acids in the sn-2 position of triacylglycerols in tested oils obtained under optimized UAE conditions (BB_US, CH_US, RB_US) and in conventional extraction (BB_C, CH_C, RB_C). The dashed line indicates the constant share of fatty acid occupying the sn-2 position assuming the equilibrium of all positions in the triacylglycerol molecule.
Applsci 14 07214 g005
Table 1. Experimental design—coded and actual values of ultrasound amplitude and extraction time.
RunUltrasound Amplitude X1Extraction Time X2
CodedActual [%]CodedActual [min]
1–130–15
2+180–15
3–130+115
4+180+115
5–1.41419.7010
6+1.41490.4010
7055–1.4142.93
8055+1.41417.07
9055010
10055010
Table 2. Model fitting of oil extraction yields.
OilModelR2CV (%)Model p-ValueModel F-ValueLack of Fit p-Value
BBQuadratic0.96763.480.004423.970.4097
CHQuadratic0.90302.470.03737.440.5320
RB2FI0.72587.420.04025.290.1294
CV—coefficient of variation.
Table 3. Model fitting of oil oxidation induction time.
OilModelR2CV (%)Model p-ValueModel F-ValueLack of Fit p-Value
BBQuadratic0.94122.990.014212.810.3282
CHQuadratic0.90675.020.03467.780.1272
RBLinear0.58158.040.04744.860.1355
CV—coefficient of variation.
Table 4. Optimization results of ultrasound-assisted extraction of blackberry, chokeberry, and raspberry seed oils.
OilOptimum Ultrasound Amplitude (%)Actual Ultrasound Amplitude Applied (%)Optimum Extraction Time (min)Predicted Yield (%)Predicted OIT (min)Yield (%)OIT (min)
BB 72.98708.208.0575.058.10 ± 0.4171.15 ± 3.79
CH 59.186010.116.1049.386.02 ± 0.9748.78 ± 0.69
RB95.57958.437.1758.296.96 ± 0.6061.22 ± 6.65
Table 5. Regression analysis of the PDSC data, activation energies (Ea), pre-exponential factors (Z), and oxidation rate constants (k) at different temperatures for oils obtained in optimized UAE conditions (BB_US, CH_US, RB_US) and in conventional extraction (BB_C, CH_C, RB_C).
Kinetic ParameterBB_USBB_CCH_USCH_CRB_USRB_C
a505447414923491449764558
b11.96111.23011.77611.74611.65910.817
R20.99930.99940.99540.98830.99780.9952
Ea (kJ/mol)92.0186.3089.6389.4790.5982.98
Z (min−1)1.71 × 10103.38 × 1091.14 × 10101.07 × 10108.58 × 1091.36 × 109
k at 100 °C (min−1)0.00220.00270.00320.00320.00180.0033
k at 110 °C (min−1)0.00480.00570.00680.00670.00390.0066
k at 120 °C (min−1)0.0100.0110.0140.0140.00780.013
k at 130 °C (min−1)0.0200.0220.0280.0270.0160.024
k at 140 °C (min−1)0.0390.0410.0530.0520.0300.043
Table 6. Melting and crystallization DSC assessment results for oils obtained in optimized UAE conditions (BB_US, CH_US, RB_US) and in conventional extraction (BB_C, CH_C, RB_C).
OilMelting peak Temperature (°C)Melting Enthalpy (J/g)Crystallization Peak Temperature (°C)Crystallization Enthalpy (J/g)
Tm1Tm2Tm3ΔHm1ΔHm2ΔHm3TcΔHc
BB_US–42.2 ± 0.1 c–21.6 ± 0.2 c38.7 ± 3.0 c1.6 ± 1.1 b–71.3 ± 0.8 b–9.3 ± 2.4 b
BB_C–41.7 ± 0.2 c–21.0 ± 0.8 c37.5 ± 1.5 c0.4 ± 0.1 b–70.1 ± 0.1 c–14.0 ± 0.1 ab
CH_US–62.1 ± 0.2 a–35.0 ± 0.4 b–5.9 ± 0.7 a22.9 ± 2.6 c–73.6 ± 1.0 b–8.6 ± 4.3 b
CH_C–63.9 ± 3.7 a–35.2 ± 1.4 b–5.2 ± 3.5 a21.2 ± 4.8 c–70.8 ± 0.2 c–11.8 ± 3.8 ab
RB_US–46.5 ± 0.4 b–39.5 ± 0.7 a–26.5 ± 0.2 a19.2 ± 0.4 b–23.0 ± 1.8 a37.5 ± 1.5 a–77.2 ± 0.3 a–17.8 ± 0.6 a
RB_C–47.0 ± 0.2 b–41.5 ± 0.2 a–25.8 ± 0.1 b17.1 ± 1.2 b–27.4 ± 1.4 a44.3 ± 0.5 b–75.7 ± 0.1 a–14.7 ± 0.6 ab
Different letters in superscript a–c indicate significantly different groups of results at p < 0.05
Disclaimer/Publisher’s Note: The statements, opinions and data contained in all publications are solely those of the individual author(s) and contributor(s) and not of MDPI and/or the editor(s). MDPI and/or the editor(s) disclaim responsibility for any injury to people or property resulting from any ideas, methods, instructions or products referred to in the content.

