Article

Calculation Method of New Assembled Corrugated Steel Initial Support Structure of Highway Tunnel

1
Department of Geotechnical Engineering, College of Civil Engineering, Tongji University, Shanghai 200092, China
2
Key Laboratory of Geotechnical and Underground Engineering of Ministry of Education, Tongji University, Shanghai 200092, China
*
Author to whom correspondence should be addressed.
Appl. Sci. 2024, 14(16), 7242; https://doi.org/10.3390/app14167242 (registering DOI)
Submission received: 27 July 2024 / Revised: 12 August 2024 / Accepted: 15 August 2024 / Published: 17 August 2024

Abstract

:
The assembled corrugated steel initial support structure is a new prefabricated structure in highway tunnel engineering, achieving a balance between economy and safety. This study proposes a simplified calculation method and elucidates the mechanical mechanisms of assembled corrugated steel initial support structures. Firstly, the stiffness characteristics of corrugated steel plates were studied based on full-scale tests. A general equivalent stiffness coefficient table was established. Numerical simulations of corrugated steel flange joints were conducted to explore their bending mechanical properties. A two-stage rotational stiffness model for corrugated steel flange joints was proposed. Finally, a plane strain-spring simplified calculation method for the assembled corrugated steel initial support structure was developed, and the monitoring data from the Qipanshan Tunnel validated the correctness and reliability of the proposed method. The results demonstrate that (1) the plane strain-spring simplified model consists of the planar strain equivalent calculation method for corrugated steel plates and the two-line stiffness equivalent spring of the corrugated steel flange joint. The simplified model was validated as effective by monitoring data. (2) Corrugated steel plates exhibit two stages under loading, namely gap elimination and elastic stages. The elastic stage stiffness of corrugated steel plates decreases with increasing ratio of depth to pitch (RDP), positively correlating with plate thickness when the RDP exceeds 0.333 and otherwise negatively correlated. (3) Corrugated steel lining flange joints exhibit distinct elastic and plastic stages in their linear moment–rotation curves under loading.

1. Introduction

In recent years, China has made remarkable strides in constructing expressways in mountainous regions [1]. Numerous engineering practices demonstrate that tunnel excavation disrupts the equilibrium of initial ground stress, redistributes surrounding rock stress, and potentially leads to deformation, damage, or collapse of the surrounding rock mass. Therefore, it is essential to implement support structures to manage deformation and prevent the destruction of the surrounding rock.
Current scholarly research has extensively examined the theoretical principles and deformation control technologies associated with conventional initial supports, yielding valuable insights, including stress control theories, theories on arch deformation, and bolted shotcrete arch plate support theories [2,3,4]. However, conventional initial supports for highway tunnels often suffer from drawbacks such as prolonged construction periods, high costs, and environmental impact. Conversely, the corrugated steel support structure offers distinct advantages, including simplified construction techniques, excellent adaptability, high stiffness, superior strength, shortened construction timelines, favorable cost-effectiveness, and exceptional durability.
Corrugated steel plates (CSPs) are specialized structural elements formed by pressing standard steel plates into a corrugated profile, subsequently treated with hot galvanization and insulation processes. The corrugations typically run longitudinally along the plate, enhancing its resistance to bending by increasing the moment of inertia [5], thereby imparting greater load-bearing capacity and stability. These favorable mechanical properties and adaptable nature have facilitated their application in Highway Tunnel Engineering, particularly in Class IV-V surrounding rock strata with spans ranging from 4 to 13 m in China, demonstrating robust performance [6,7,8]. Scholars have extensively investigated the mechanical properties of corrugated steel lining [9] and its connection structures [10] using experiments, field monitoring, and numerical simulations. They have elucidated the failure modes of corrugated steel structures, proposed multiple methods for calculating ultimate load capacities, and validated their technical feasibility and safety reliability in practical applications [11,12,13].
Despite the formulation of design, manufacturing, construction, and installation guidelines and standards in various countries such as the US, Australia, and Canada [14,15], theoretical research and engineering applications of corrugated steel have primarily been limited to open-cut engineering contexts, such as culvert construction, tunnel sheds, utility tunnels, and open trench tunnels [16,17,18,19,20,21]. A significant research gap remains regarding using assembled corrugated steel structures in initial tunnel support. Current design methodologies, predominantly based on the ring compression design method proposed by the American Iron and Steel Institute (AISI) and Canadian highway bridge design codes, differ notably from those required for highway tunnel initial support structures, thus precluding direct application. Furthermore, the theoretical underpinnings of corrugated steel structure calculations in China are still developing, necessitating further refinement through operational condition tests and ongoing research efforts.
In summary, significant gaps persist in the current research on utilizing corrugated steel structures for the initial support of highway tunnels. The absence of a standardized algorithm for simplified calculation of corrugated steel structures and an unclear understanding of how corrugated steel flange joints (CSFJs) influence the initial support structure further underscore the need for exploring calculation methods specific to this context. This study addresses these gaps by investigating the mechanical mechanisms and calculation methods of assembled corrugated steel initial support structures, leveraging insights from the Qipanshan tunnel project in Yunnan Province, China. This research aims to facilitate the broader adoption of corrugated steel as an innovative initial support structure in tunnel engineering through comprehensive approaches such as full-scale testing and numerical simulations.

2. Full-Scale Test of Corrugated Steel

2.1. Full-Scale Test

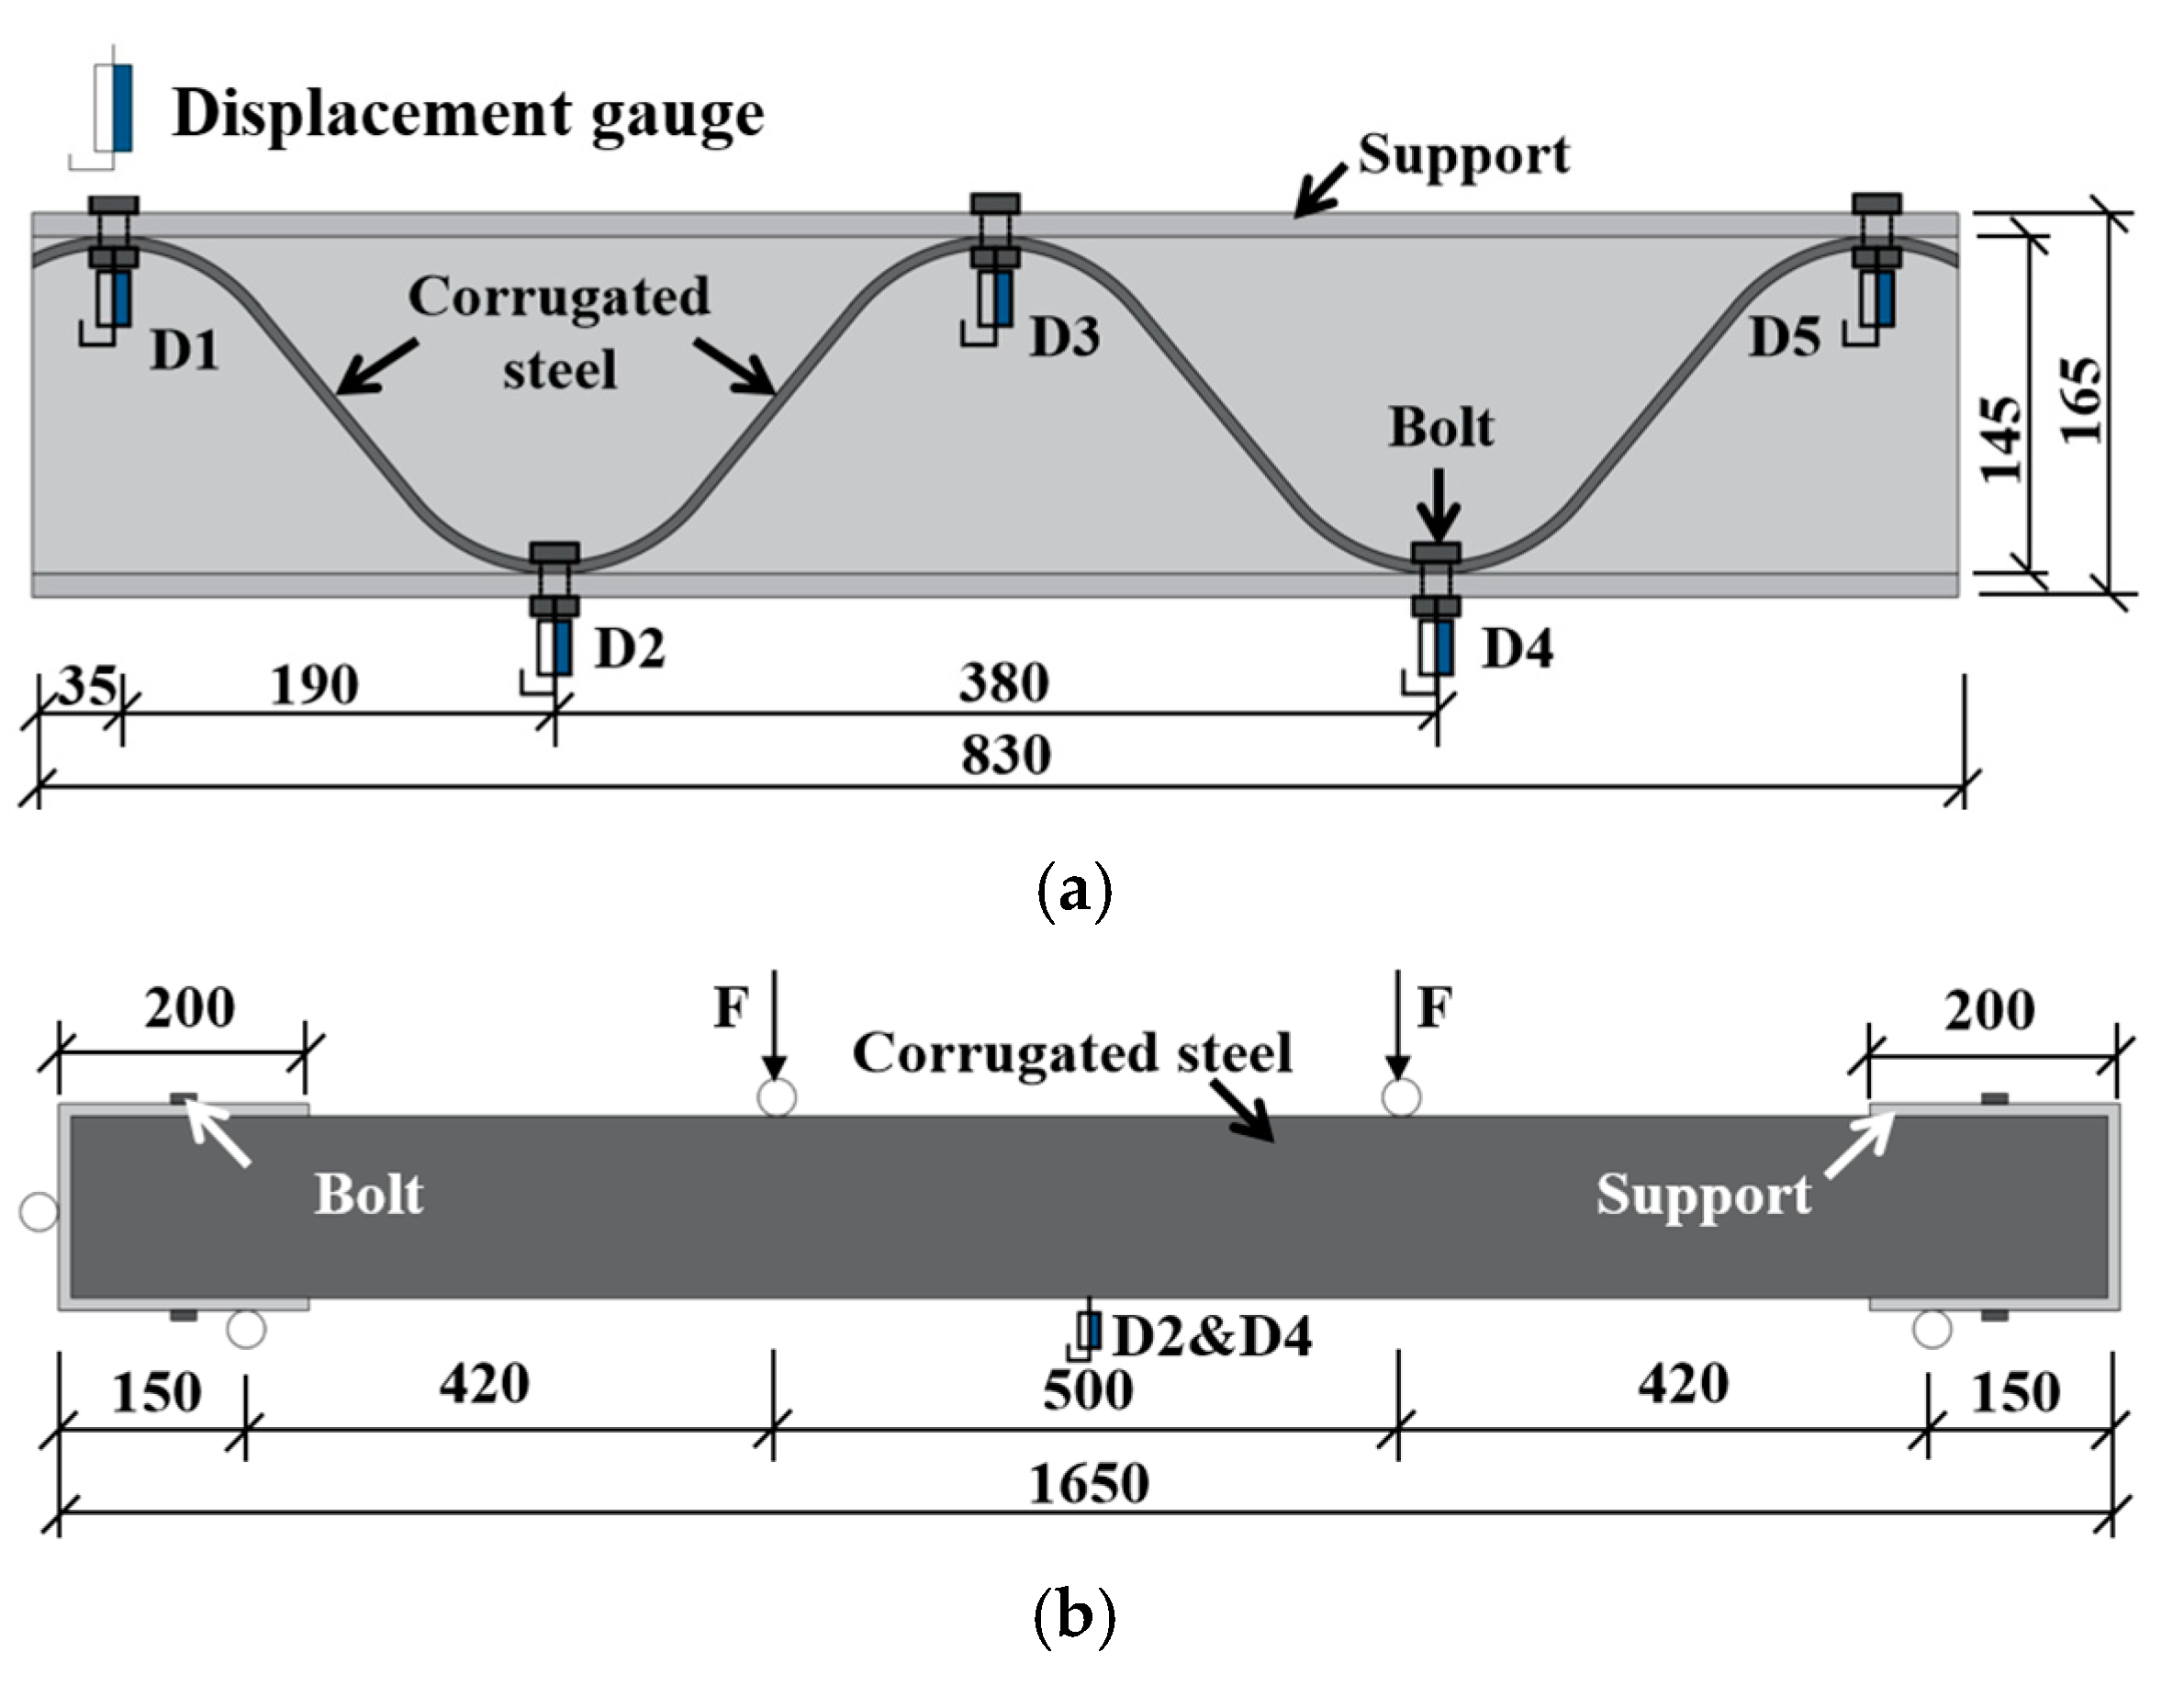
2.1.1. Specimen Design

A full-scale test was conducted to characterize the stiffness of the CSP. The test specimen consisted of E235B (ISO standard [22]) steel plates configured with corrugations measuring 380 mm × 140 mm × 5 mm (pitch × depth × thickness). The physical dimensions of the specimen were adjusted to 1650 mm × 830 mm × 150 mm (l × b × h) to suit the loading system requirements (Figure 1). Steel supports were installed at both ends of the CSP to ensure uniform stress distribution under horizontal loading conditions. The connections between the supports and the CSP employed M20 high-strength bolts. Additionally, iron rollers were positioned at the lower portion of each support to provide constraints, effectively treating the corrugated steel plate as a simply supported beam.

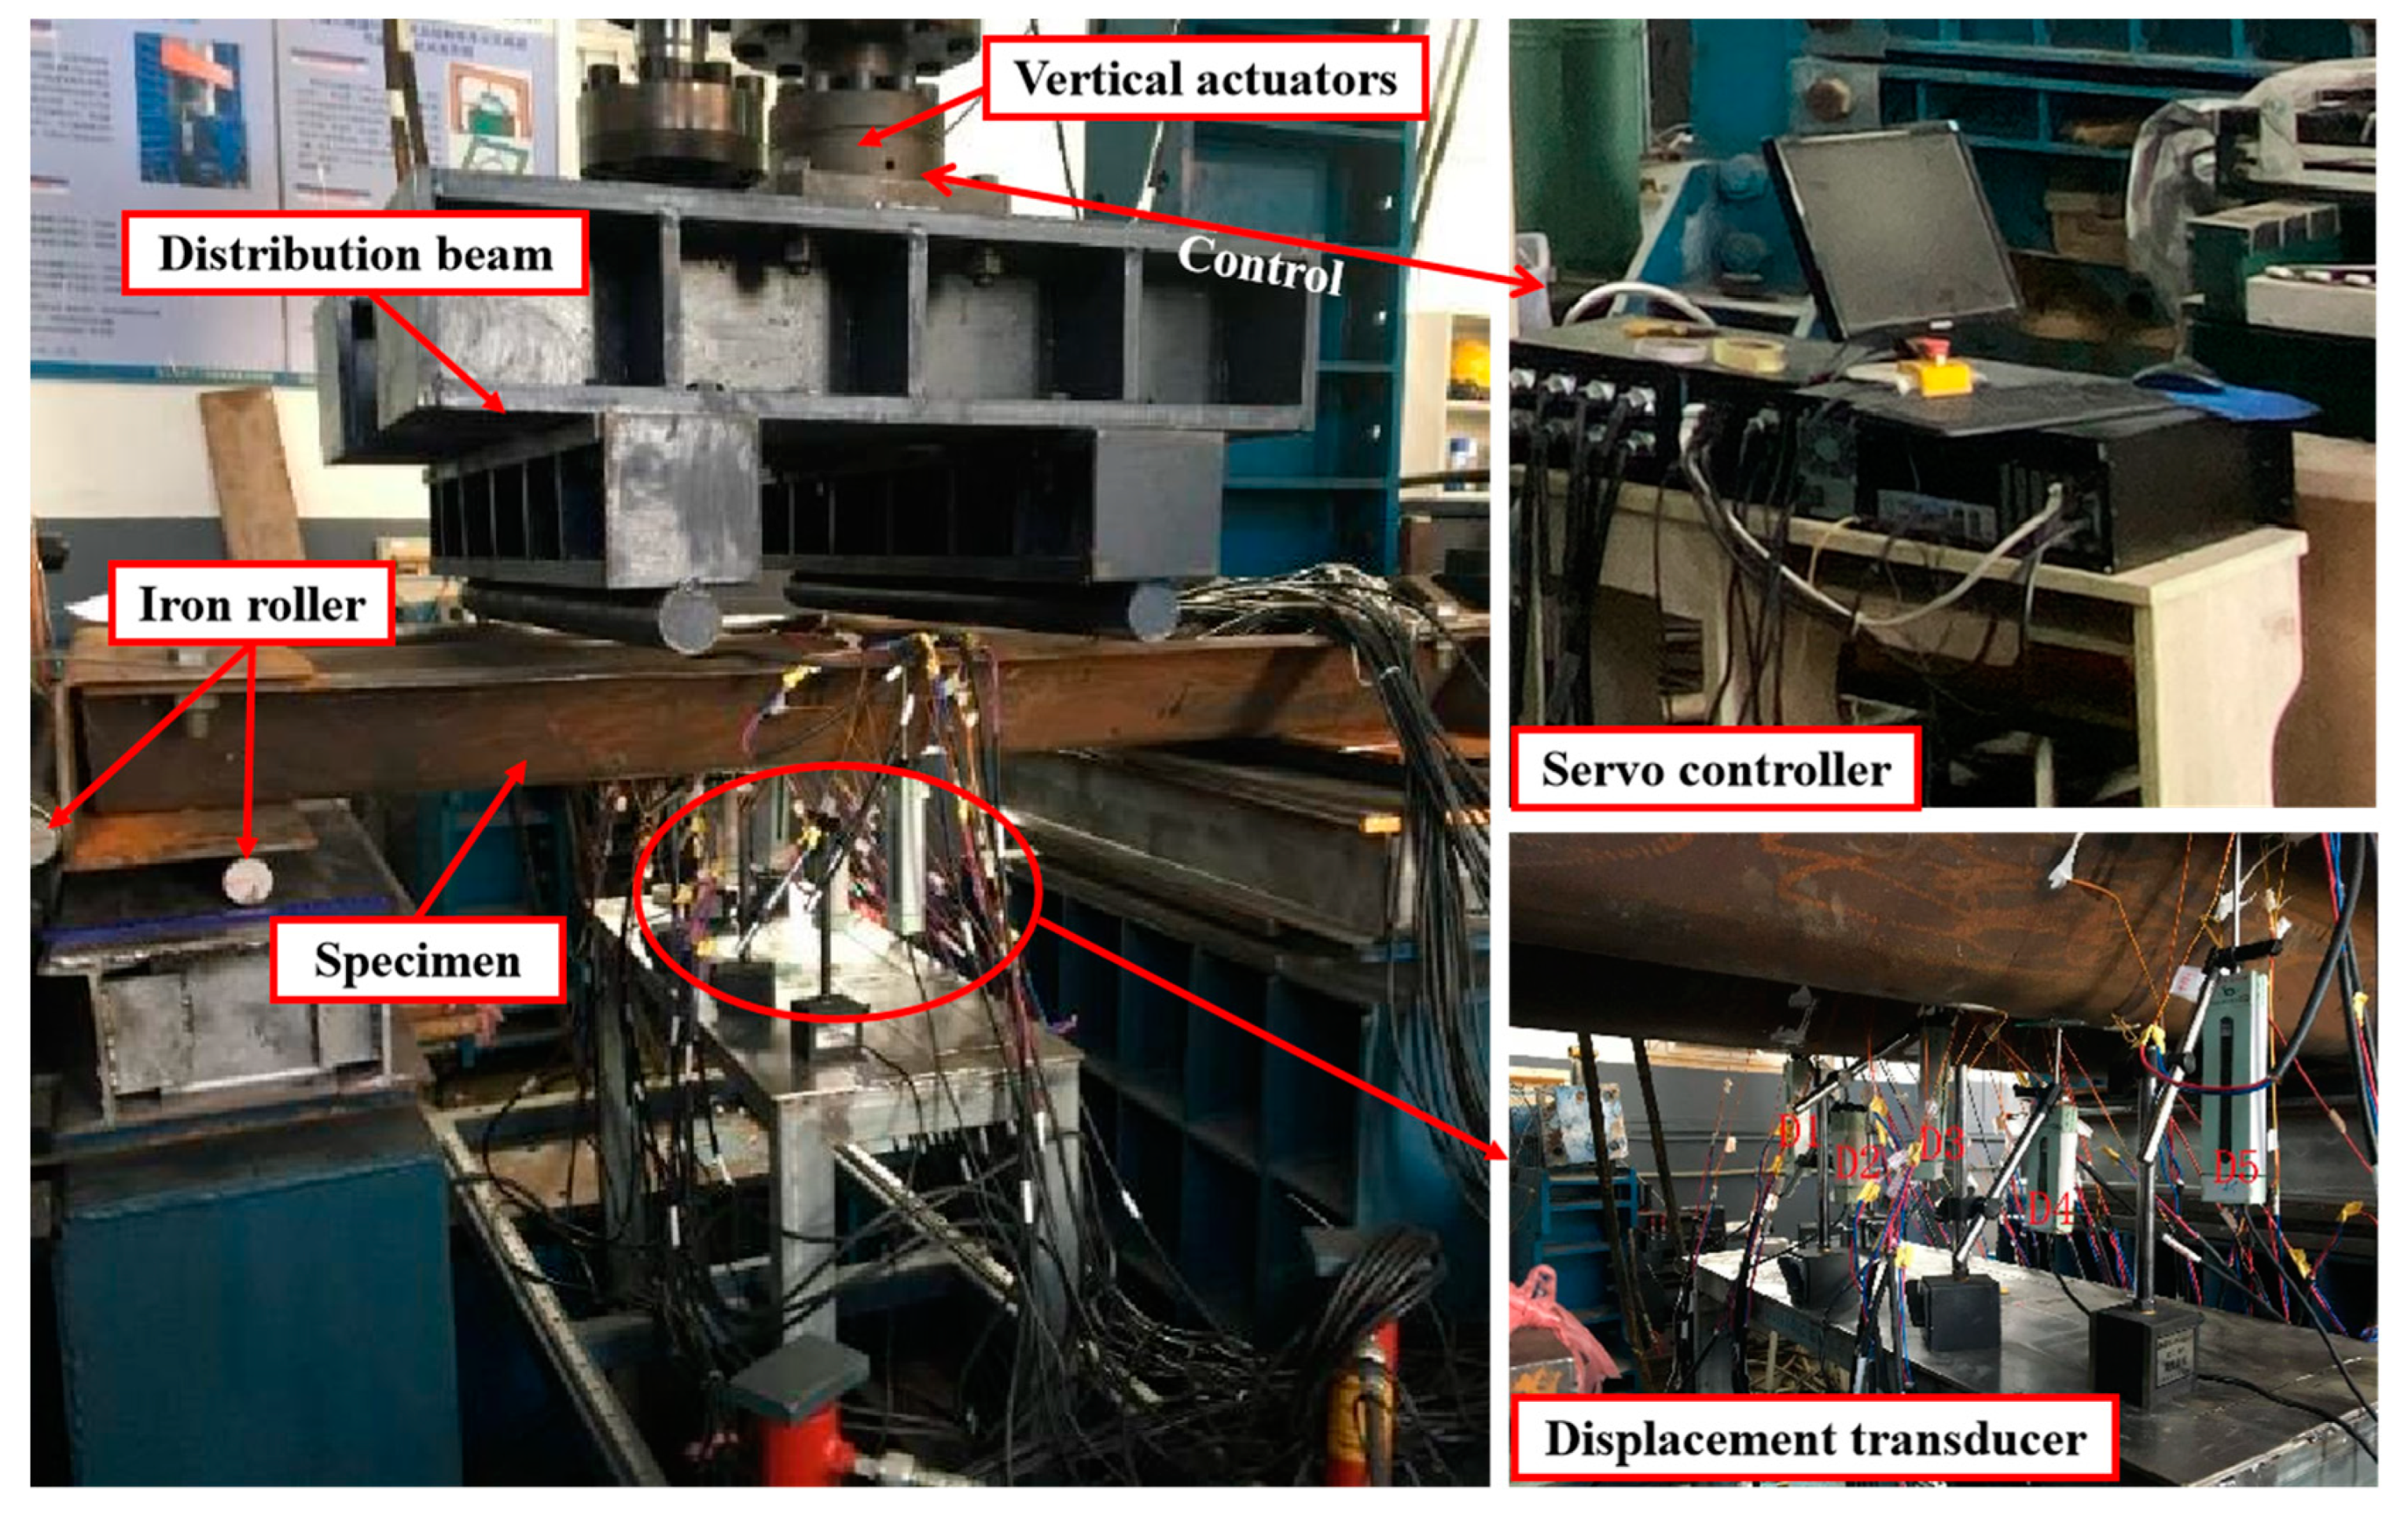
2.1.2. Test Apparatus and Loading Procedure

The TJ-GPJ1300 three-dimensional structural mechanical testing system(Hangzhou Popwil Instrument CO.,LTD. Hangzhou, China), housed at the Key Laboratory of Geotechnical and Underground Engineering of the Ministry of Education at Tongji University, was utilized for this experiment [23]. The testing system consists of a reaction frame, horizontal loading jacks, vertical loading jacks, a distribution beam, and rollers, depicted in Figure 2. (1) Reaction frame: the reaction frame provides substantial structural stiffness, ensuring the safety and stability of the experimental setup. (2) Loading jacks: the horizontal and vertical loading jacks apply axial forces and vertical loads, respectively. (3) Distribution beam: the distribution beam was utilized to transfer loads from the vertical jacks to the CSP. (4) Rollers: The two rollers beneath the CSP are supports to constrain vertical displacement. Additionally, the roller on the left side of the CSP is specifically designed to restrict horizontal displacement.
The test was performed using servo-controlled loading with incremental step loading. After completing each loading step, the load was sustained for 4 min to ensure stability from the preceding step before advancing to the next phase. The procedure was as follows: (1) applied a horizontal load of 10 kN, maintaining it constant, and (2) applied vertical loads at a rate of 5 kN per step until the CSP failure occurred.

2.1.3. Measuring System

As shown in Figure 2, critical geometric and mechanical parameters such as load, deflection, and deformation state were systematically recorded. (1) Load measurement was performed using a 5-ton wheel-mounted load cell sensor to gauge the axial force applied by the loading jack. (2) Deflection measurement was conducted with the YHD-100 rod displacement gauge, which has a measurement range of 100 mm. As shown in Figure 1, five vertical displacement measurement points (D1–D5) were strategically placed at the peaks and troughs along the bottom centerline of the specimen to monitor the deflection progression. (3) The deformation and damage characteristics of the structure are recorded through video and manual recording.

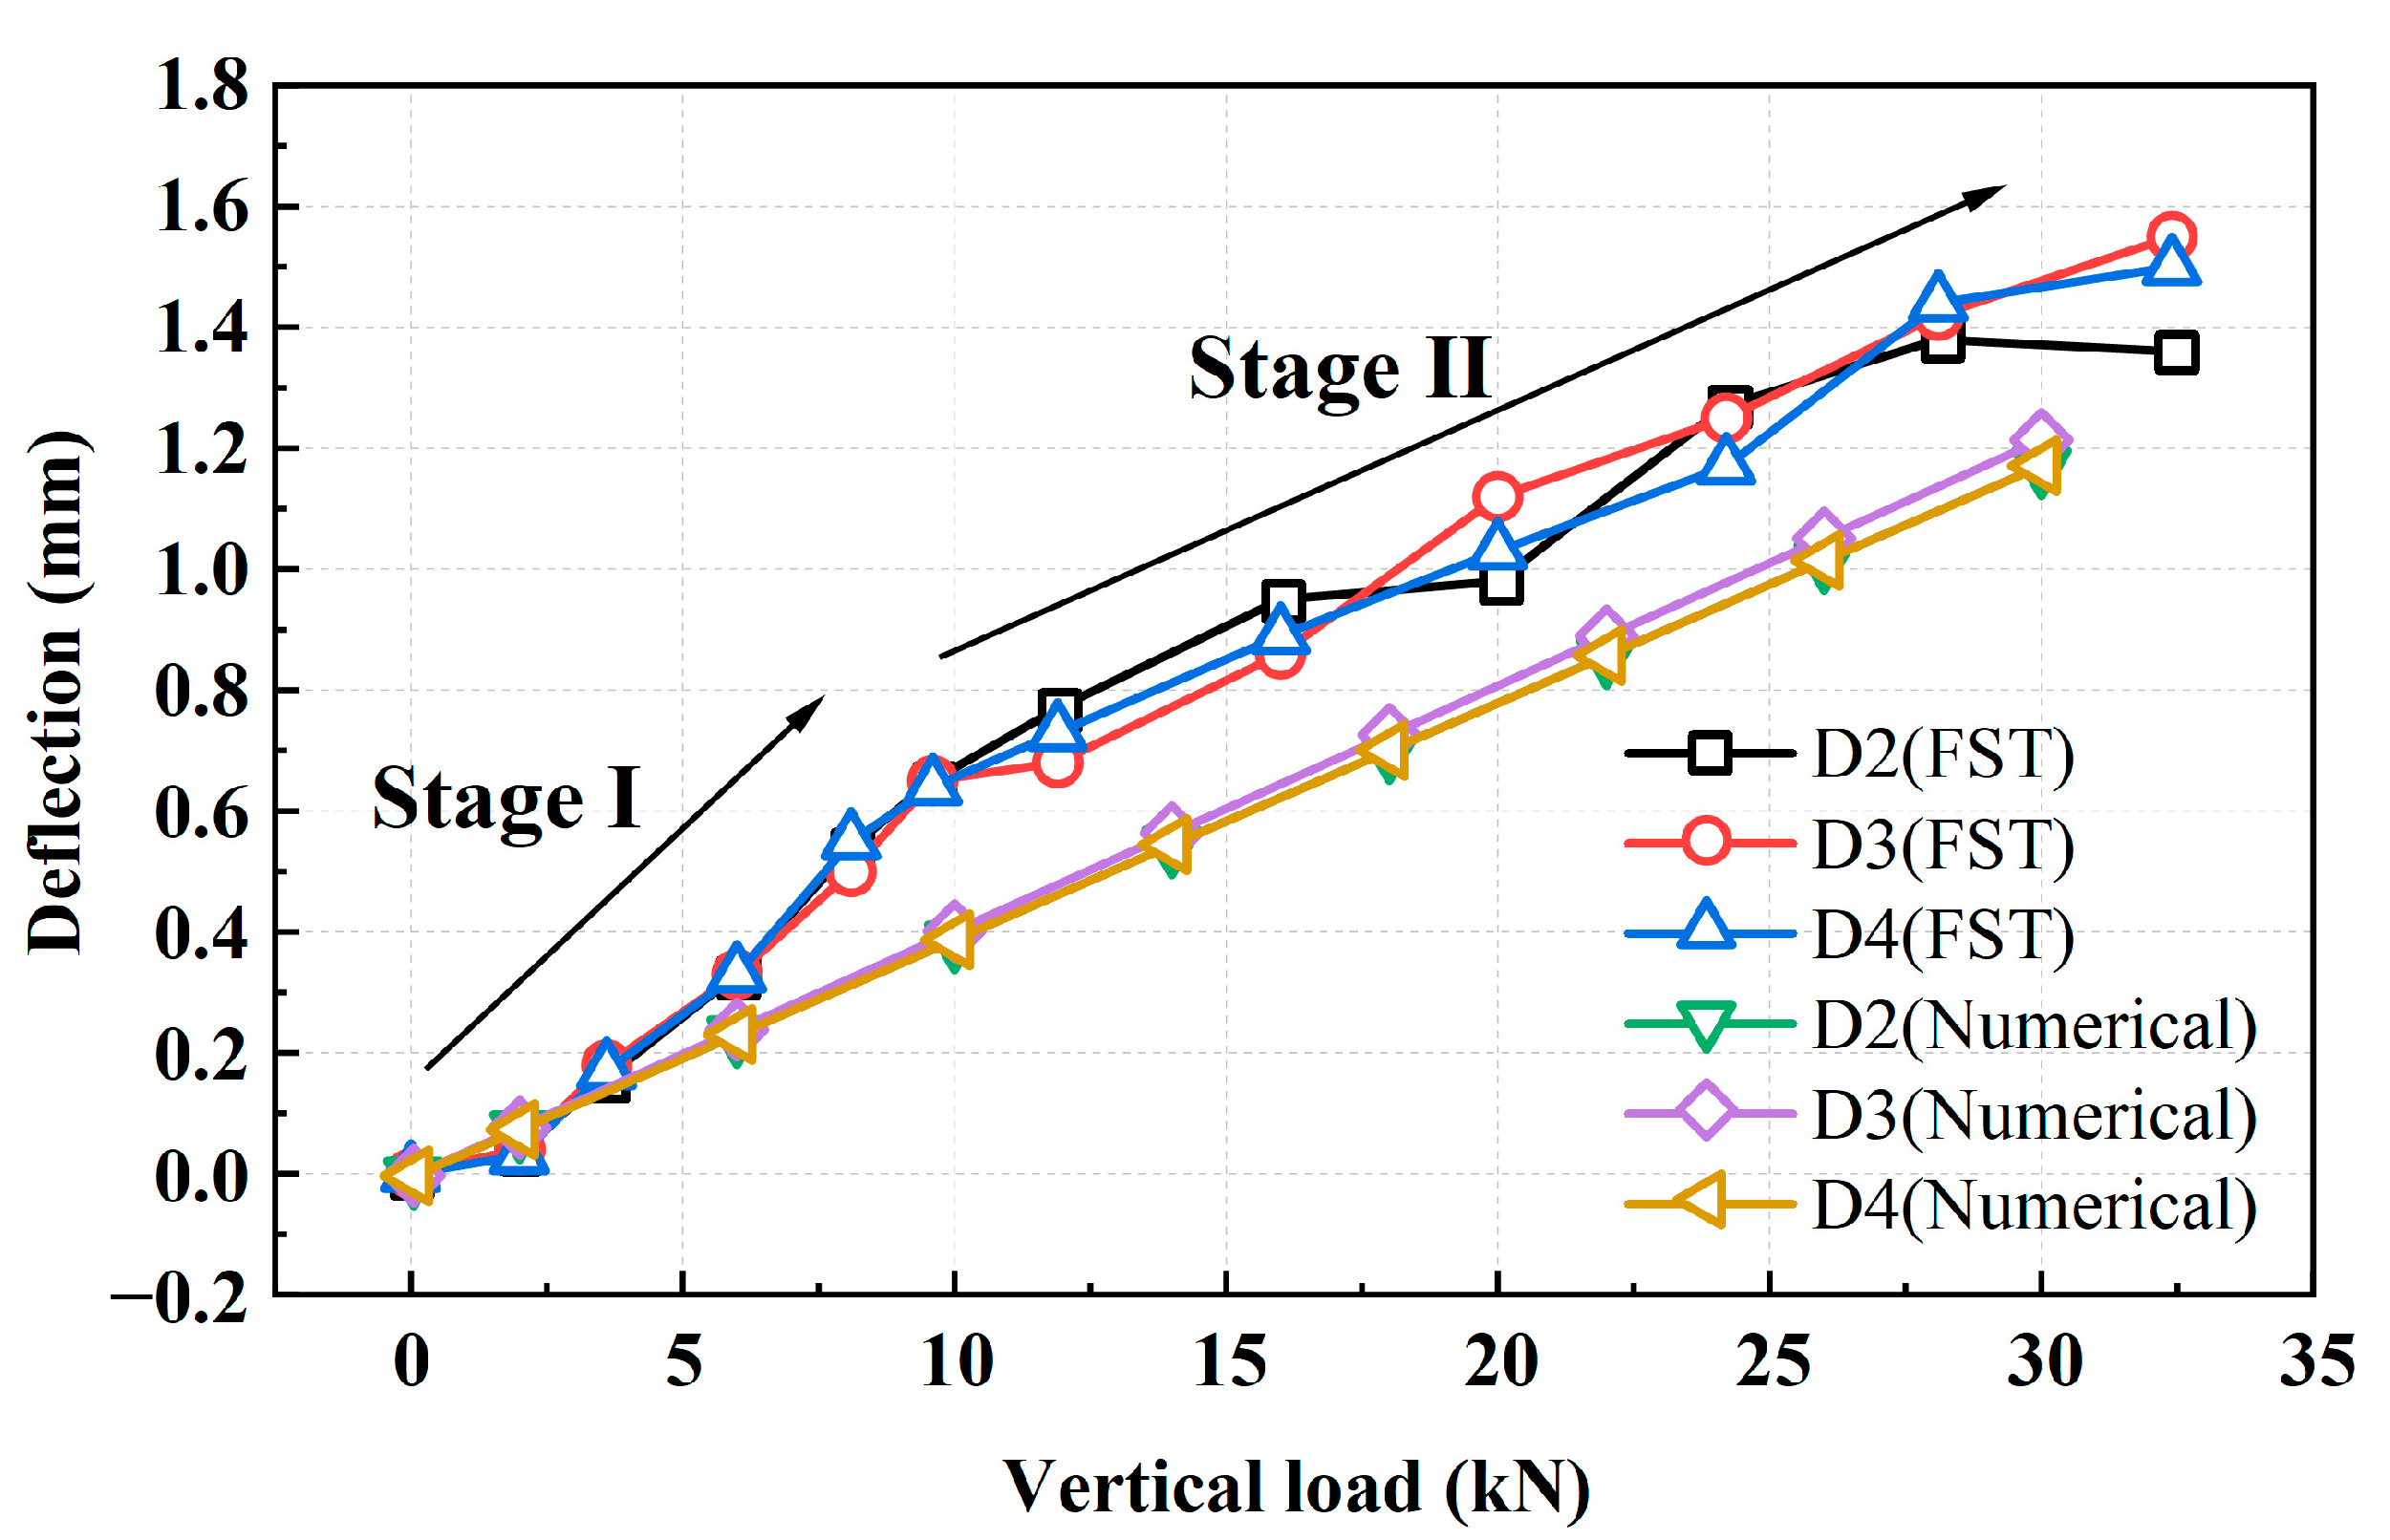
2.2. Test Results and Analysis
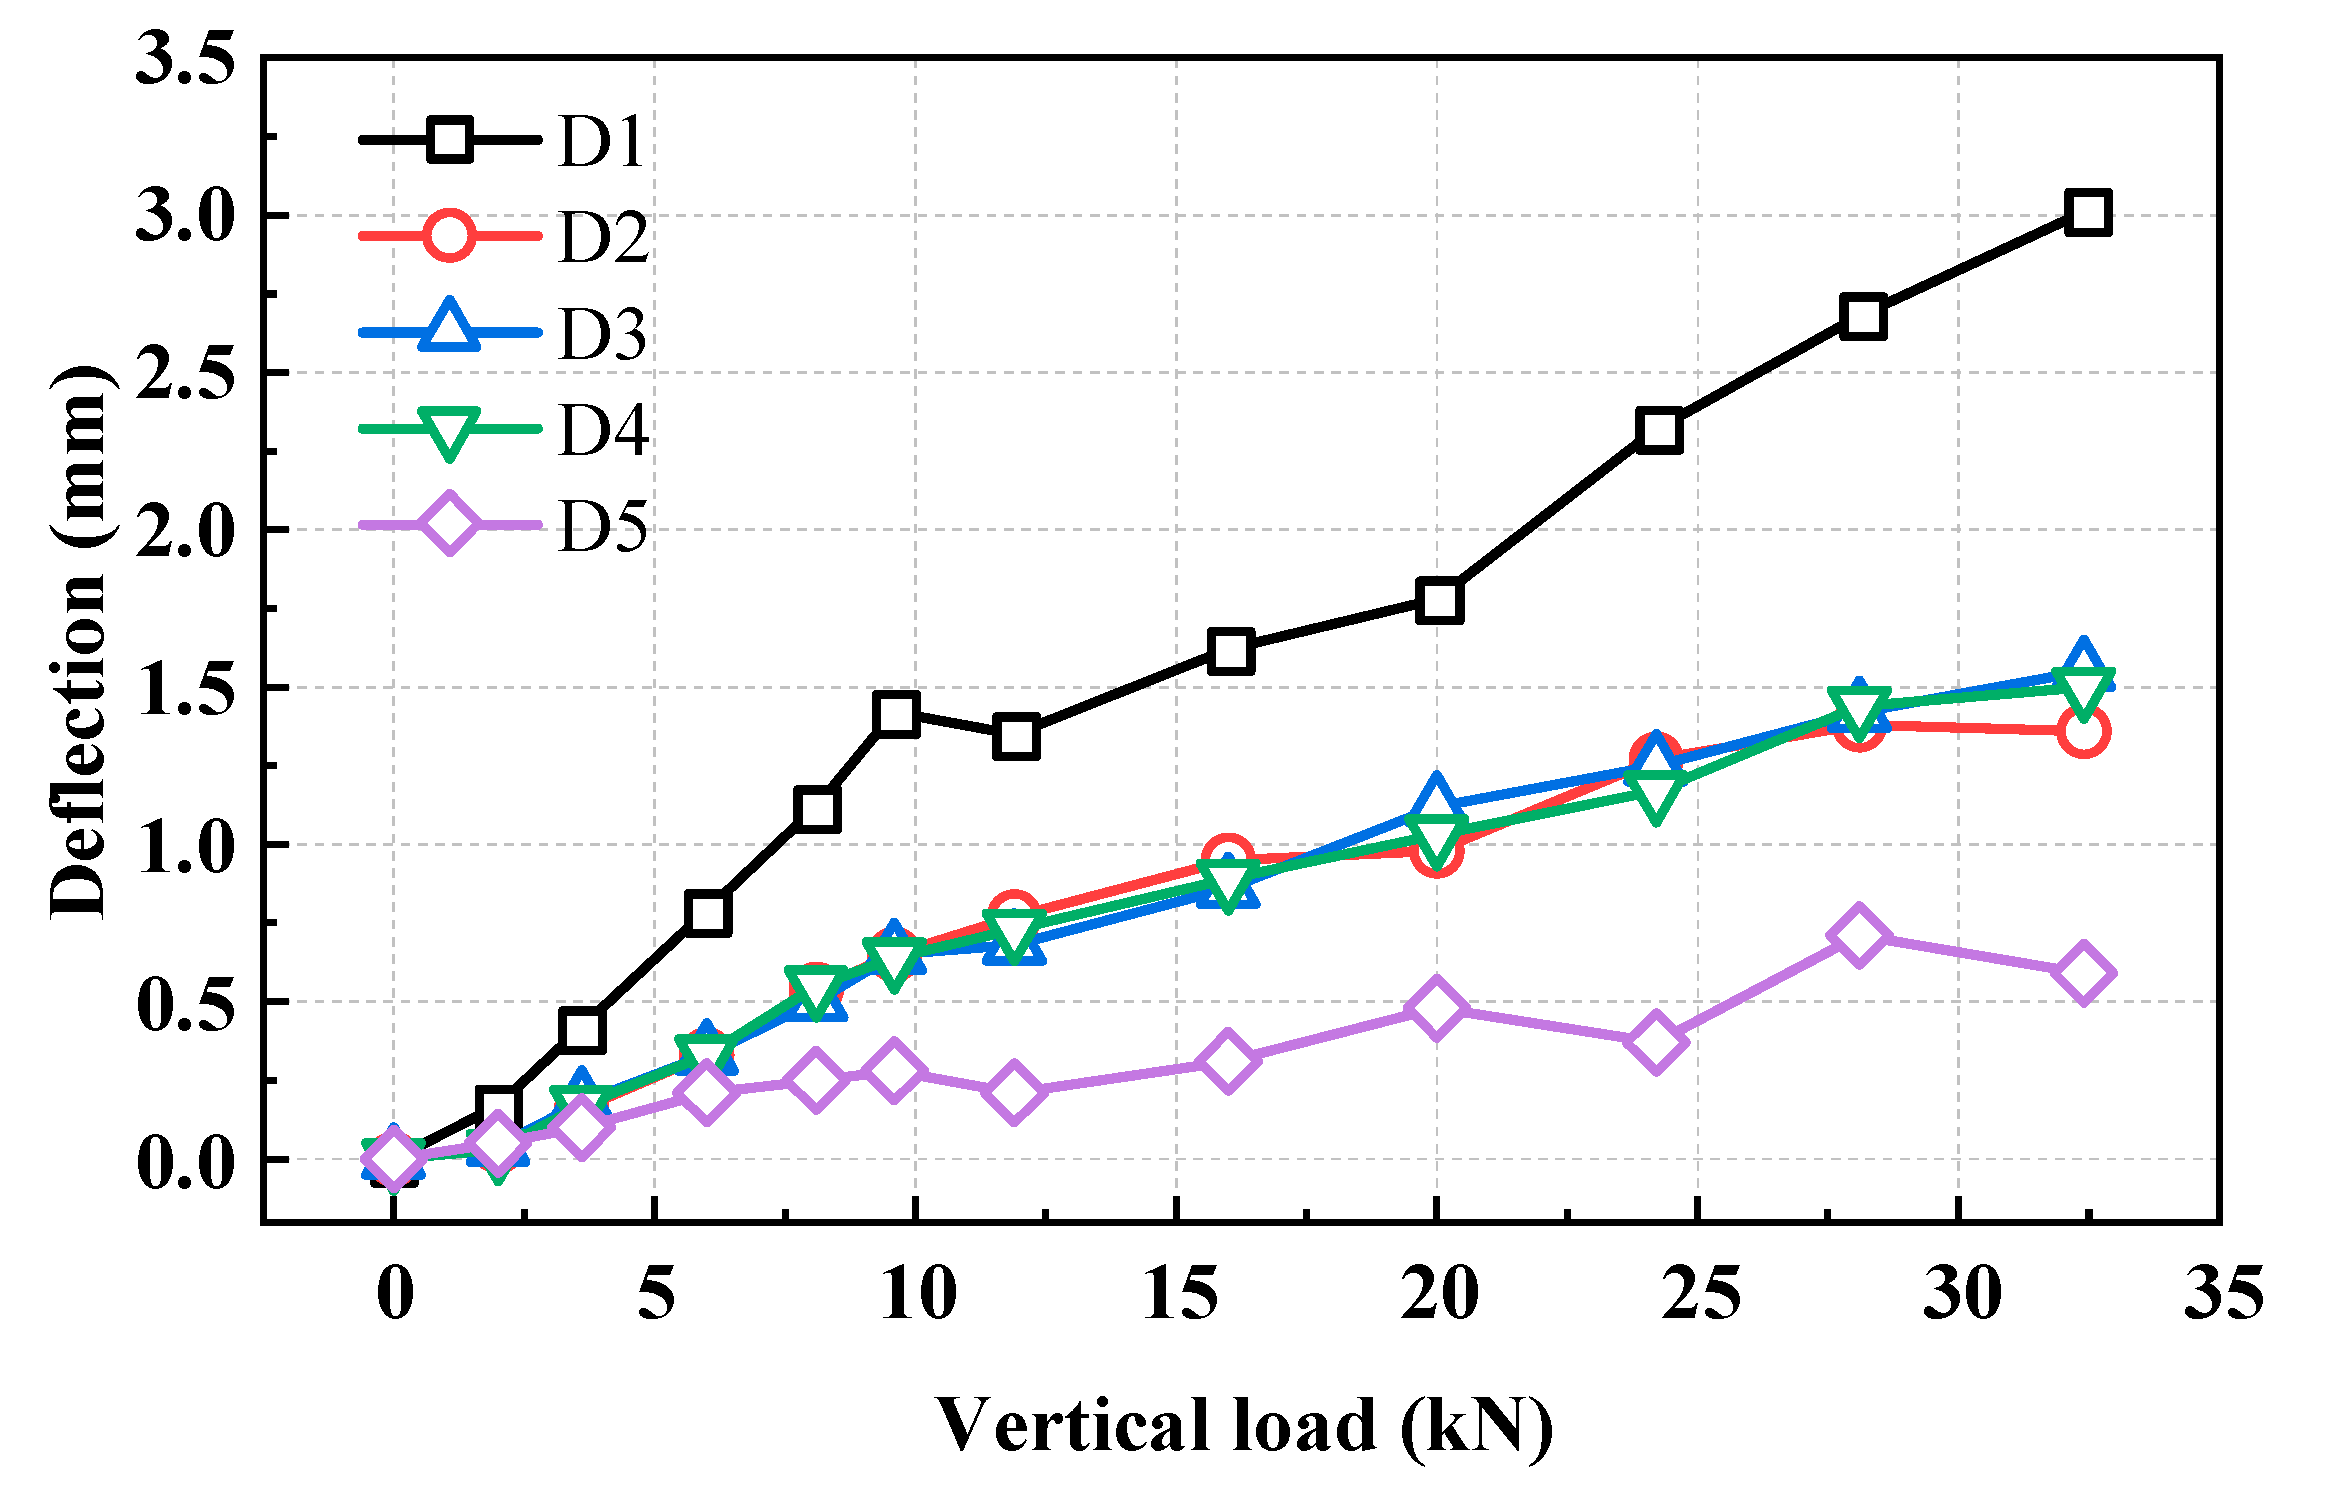
2.2.1. Test Results

During the test, vertical loading was applied in incremental steps. Following each step of vertical loading, the servo jack system and vertical displacement meter were employed to measure the respective vertical forces exerted by the two jacks, as well as the midspan deflection of CSP. Given the minimal discrepancy between the two vertical loading forces, their average was calculated as the effective vertical loading force, F. By subtracting the initial value from each vertical displacement meter reading, the deflection at each point was determined, establishing the relationship between vertical loading force and deflection in the full-scale corrugated steel test, as depicted in Figure 3.
Figure 3 reveals several key observations: (1) The maximum deflection does not exceed 3 mm, and the deflection of the corrugated steel plate increases linearly with the vertical loading force, indicating elastic behavior throughout the loading process; (2) the vertical loading force–deflection curves for measuring points D2, D3, and D4 exhibit a consistent two-stage linear relationship. Ordinary least squares fitting of the two-stage data identifies stiffness values of 14.12 kN/mm and 24.94 kN/mm at a critical point of 10 kN vertical load; (3) the curves for measuring points D1 and D5 exhibit a linear relationship up to 10 kN vertical loading, followed by significant fluctuations; (4) compared to D2, D3, and D4, the D1 curve is notably larger, whereas the D5 curve is smaller. This discrepancy arises from the inclination of the CSP toward D5 during loading, causing significant deflection deviation at the edge from the expected range. Consequently, to accurately represent the mechanical response of the CSP, data from vertical displacement meters D1 and D5 will be excluded from subsequent analyses.

2.2.2. Comparative Analysis between Test and Simulation

As shown in Figure 4, a finite element (FE) model was constructed in ABAQUS to replicate the dimensions of the full-scale test setup. (1) Meshing: Grid sizes were selected to minimize computational costs while ensuring calculation accuracy. Following multiple simulations, a grid size of 3 mm was chosen for the CSP, ensuring a minimum of two grid divisions in the thickness direction. Solid elements (C3D8R) were utilized to model the CSP and supports. (2) Interaction: The bolts were primarily responsible for securing the support and corrugated steel as a unified assembly. Due to the intricate contact interactions among bolts, CSP, and support, tie contact was utilized to link the peaks and troughs of the CSP to the support, serving as an alternative to the bolts. Hard contact was established between the side of the corrugated steel and the support. “Tie contact” means that the selected sets of points will not experience relative displacement. “Hard contact” means that the selected surfaces cannot penetrate each other in the normal direction, with tangential behavior following Coulomb’s friction law, where the friction coefficient between the steel was set to 0.1. (3) Boundary conditions: The left side of the left support restricts horizontal displacement, and the rollers under supports restrict vertical displacement. The roller on the right side of the right support was subjected to axial force. (4) Material properties: the constitutive relationships governing bolts, CSP, flanges, and supports followed an elastic–plastic hardening model, details of which are provided in Table 1.
Based on the mechanical test data of CSP, Figure 5 compares numerical simulation and experimental results. The vertical load–deflection curve from the full-scale mechanical test of CSP exhibits two distinct stages differentiated by changes in slope: clearance elimination and elastic stages. (1) During the gap elimination stage, initial gaps between the CSP and the loading system resulted in inelastic deformation. The initial loading primarily served to eliminate these gaps, characterized by a significant gap, low stiffness, and substantial deformation under equivalent forces, causing a steep slope in the curve. (2) In the elastic stage, as the gaps observed in the first stage were compressed, the CSP specimen consolidated into a unified structure, thereby increasing structural stiffness. Consequently, the slope of the curve becomes gentler, indicating effective engagement of the corrugated structure.
As a prefabricated structure, the corrugated steel samples initially exhibited gaps. During the initial loading phase of the test, these gaps were eliminated. Once the gaps were closed, the sample transitioned into the elastic stage. In contrast, the FE model was perfectly assembled with no initial gaps, allowing it to enter the elastic phase directly. The slope of the vertical load–deflection curve during the experimental elastic phase is consistent with that of the numerical calculation model. The vertical load–deflection curve from the numerical simulation closely parallels what was observed during the elastic stage of the full-scale test. A comparison of average midspan deflection values between the numerical simulation and the mechanical test reveals minimal disparity. Specifically, at a vertical force of ∆F = 20 kN, the midspan deflection measures ∆ꞷN = 0.799 mm (numerical simulation) and ∆ꞷE = 0.802 mm (mechanical test), resulting in a negligible error of only 0.38%. This consistency indicates that the numerical simulation results align well with experimental findings, affirming that the calculated stiffness of the CSP can be considered an accurate approximation of its actual stiffness.

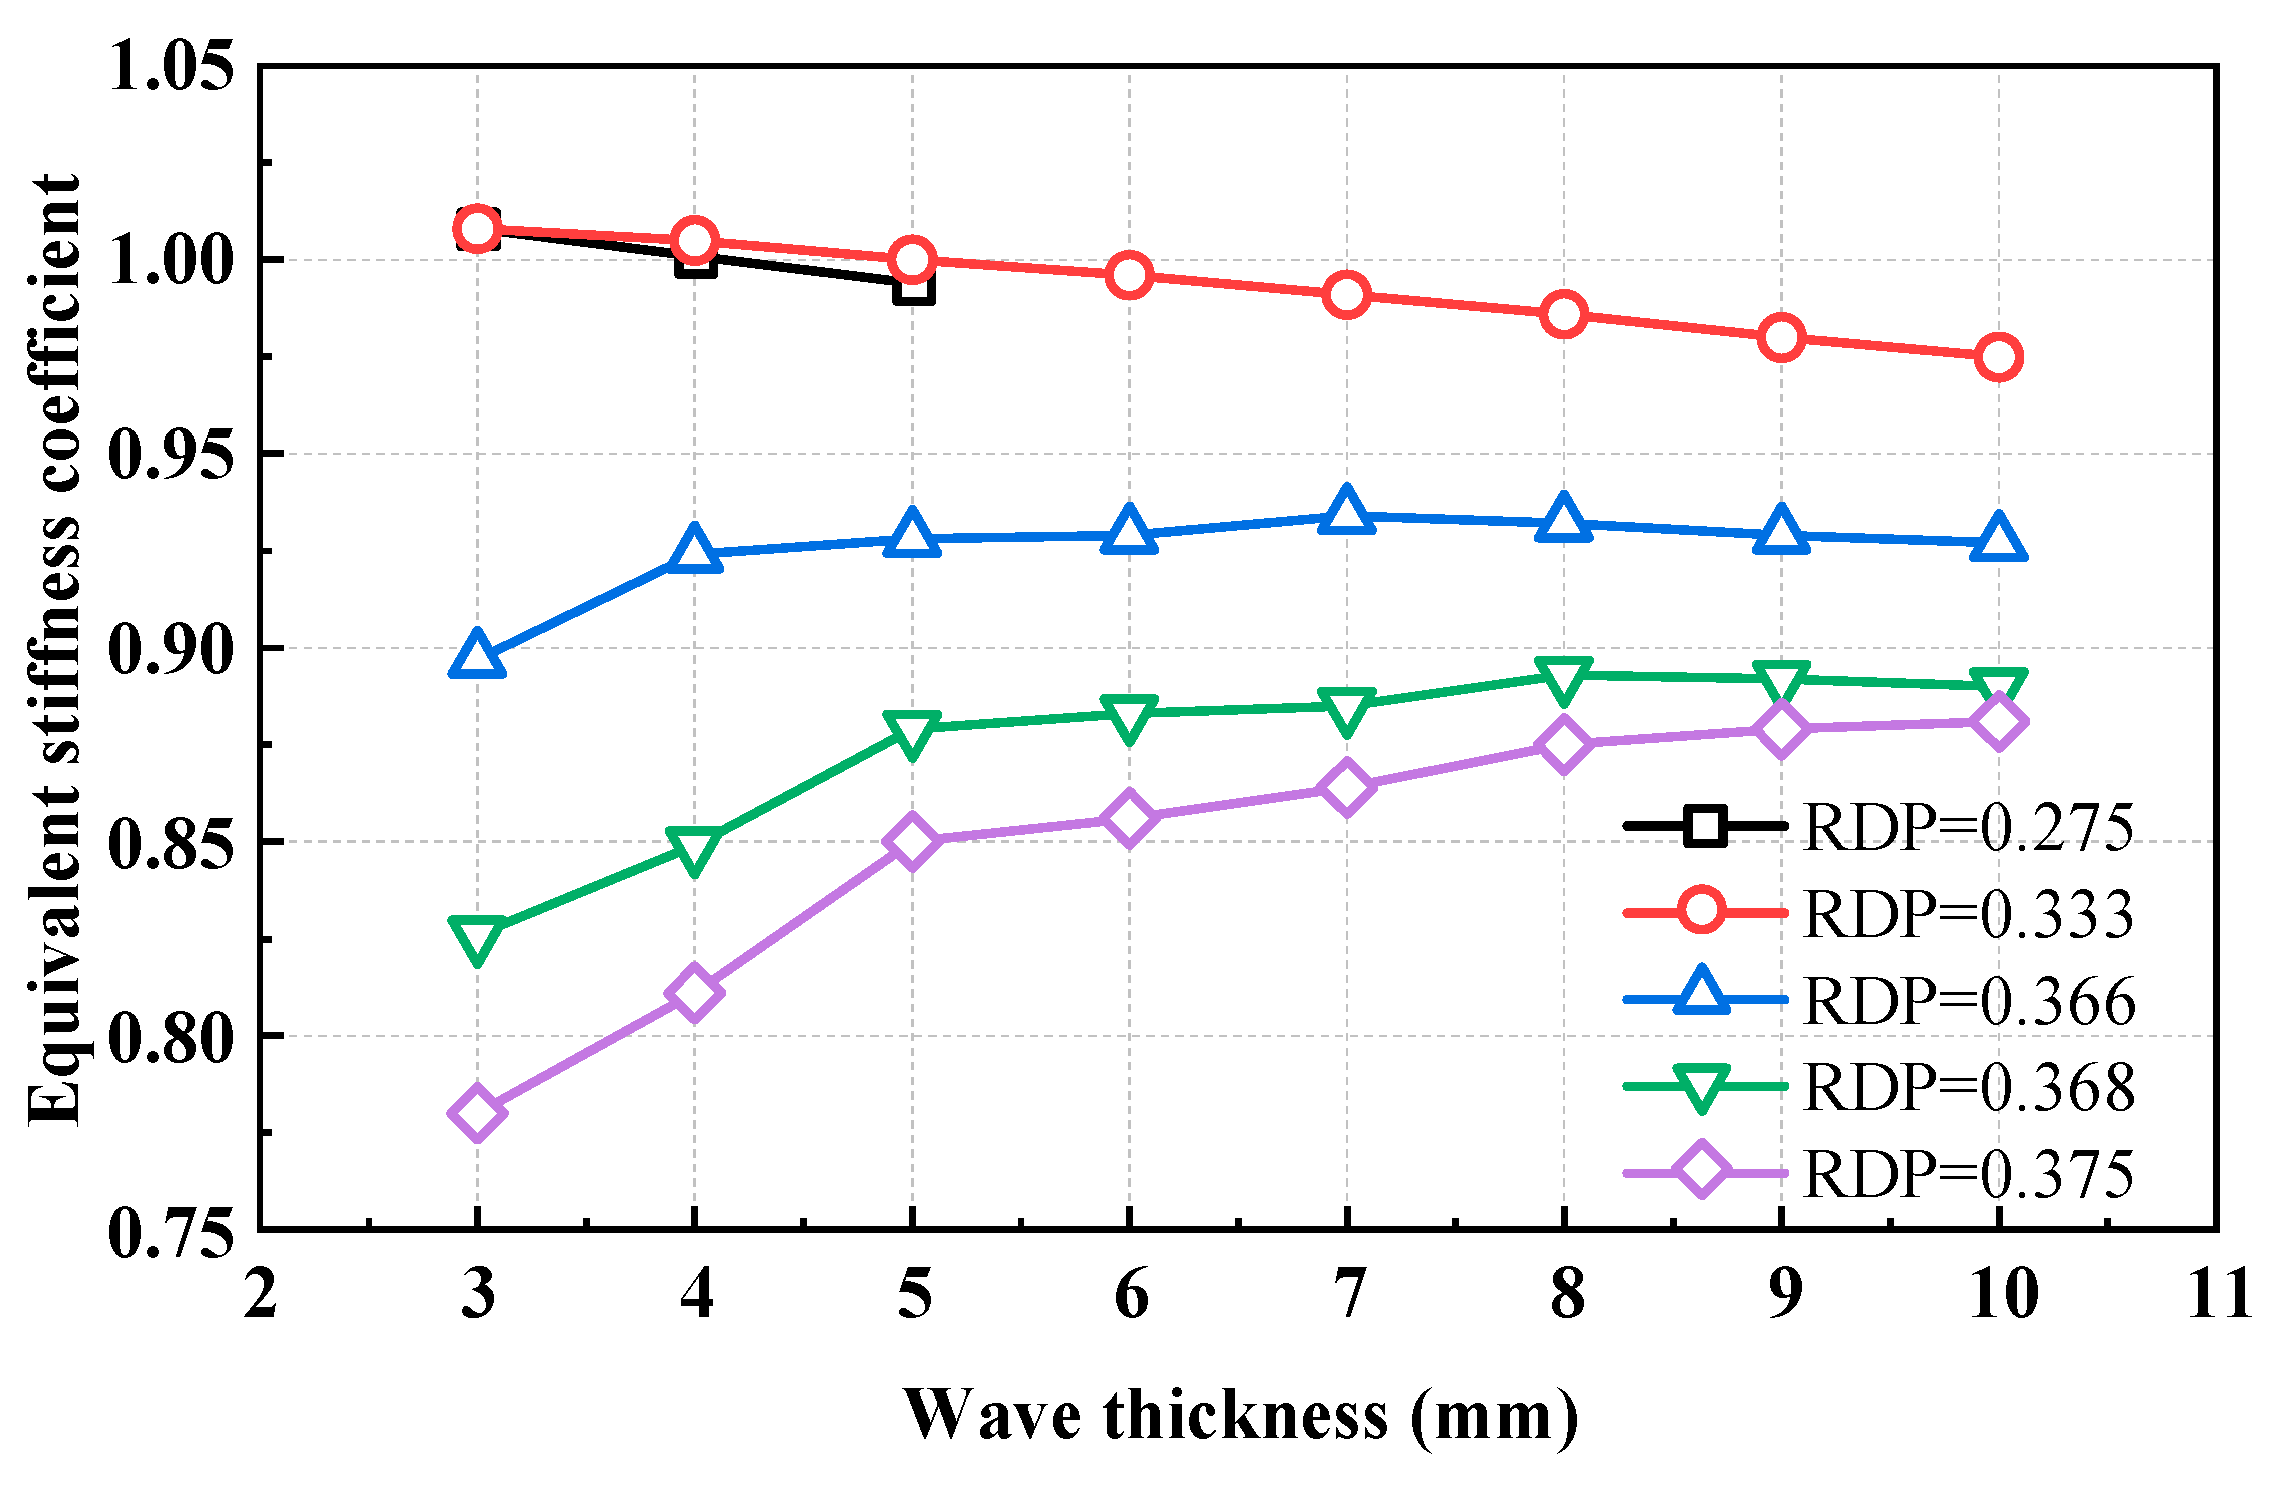
2.3. Equivalent Stiffness Coefficient

2.3.1. Proposal of Equivalent Stiffness Coefficient

According to the principle of virtual work, the structural deformation of CSP can be calculated using the following equation:
Δ = M ¯ d θ + Q ¯ d v + N ¯ d u R ¯ c
When calculating beam deflection, bending deflection can be considered only without shear and axial forces. In addition, the theoretical calculation equation of deflection can be obtained as follows by substituting load-induced d θ = M P E I d s into Equation (1):
ω theory = M ¯ M P E I d s
In Equation (2), theory refers to the theoretical deflection, MP refers to the section bending moment caused by the vertical load, and E and I refer to the modulus of elasticity and theoretical inertia moment, respectively. In the elastic stage, deformation and internal force are linearly elastic, so the incremental calculation is adopted in the follow-up calculation to reduce error.
Chengshuo et al. [21] have highlighted the unreliability of directly applying theoretical stiffness values to represent the actual stiffness of CSP. According to the Design and Construction Manual for Embedded Structures of CSP [24], the theoretical moment of inertia for a CSP plate (Model: 380 mm × 140 mm × 5 mm) is calculated as 15,117.8 mm4/mm, yielding a theoretical stiffness of 3023.6 kN·m2/m. Applying Equation (2), the predicted midspan deflection increment for CSP under a vertical force increment ΔF = 30 kN is ∆theory = 1.05 mm.
Through numerical simulation, the actual midspan deflection increment (∆ꞷtrue) is approximately determined to be ∆true = 1.20 mm, resulting in a relative error of 14% compared to ∆theory. Therefore, an “equivalent stiffness coefficient” η is proposed to adjust Equation (2), refining the theoretical deflection calculation for CSP. The modified equation for calculating the actual deflection of CSP is thus derived as follows:
ω t r u e = M ¯ M P η E I d s
To sum up, in combination with Equations (2) and (3), the calculation equation of the “equivalent stiffness coefficient” of CSP can be obtained as follows:
η = ω theory ω true = Δ ω theory Δ ω true

2.3.2. Analysis of Influence Factors

CSPs exhibit varying sectional characteristics across different models, resulting in differing equivalent stiffness coefficients. Utilizing established and validated finite element numerical simulation methods, separate analysis models are developed for several prevalent types of CSPs. Subsequently, the general table of equivalent stiffness coefficients for CSPs is computed according to Equation (4), detailed in Table 2.
According to the analysis presented in Table 2, the η of CSPs are primarily influenced by thickness and pitch depth (the amplitude of corrugations). To better understand the variation pattern of η, we introduce the concept of the “Ratio of Depth to Pitch” (RDP), defined as follows:
R D P = D e p t h P i t c h × 100 %
The magnitude of RDP correlates directly with the intensity of CSP’s wave fluctuations; a higher RDP indicates more pronounced waves, whereas a lower RDP signifies gentler undulations. Upon analysis, it becomes evident that CSPs’ overall equivalent stiffness coefficient varies in response to factors such as thickness and RDP, as depicted in Figure 6.
From Figure 6, several observations can be made: (1) For a given thickness, increasing RDP decreases η. This indicates that higher RDP values correspond to more pronounced wave fluctuations in CSP, reducing the effective stiffness-contributing regions within the wave structure. (2) When RDP exceeds 0.333, η shows a positive correlation with thickness; conversely, for RDP values ≤ 0.333, η exhibits a negative correlation with thickness. (3) The influence of thickness and RDP on η aligns closely with findings by You et al. [25], who used a sectional parameter analysis method, highlighting RDP as the primary influencing factor.

3. Rotational Stiffness of Corrugated Steel Flange Joint

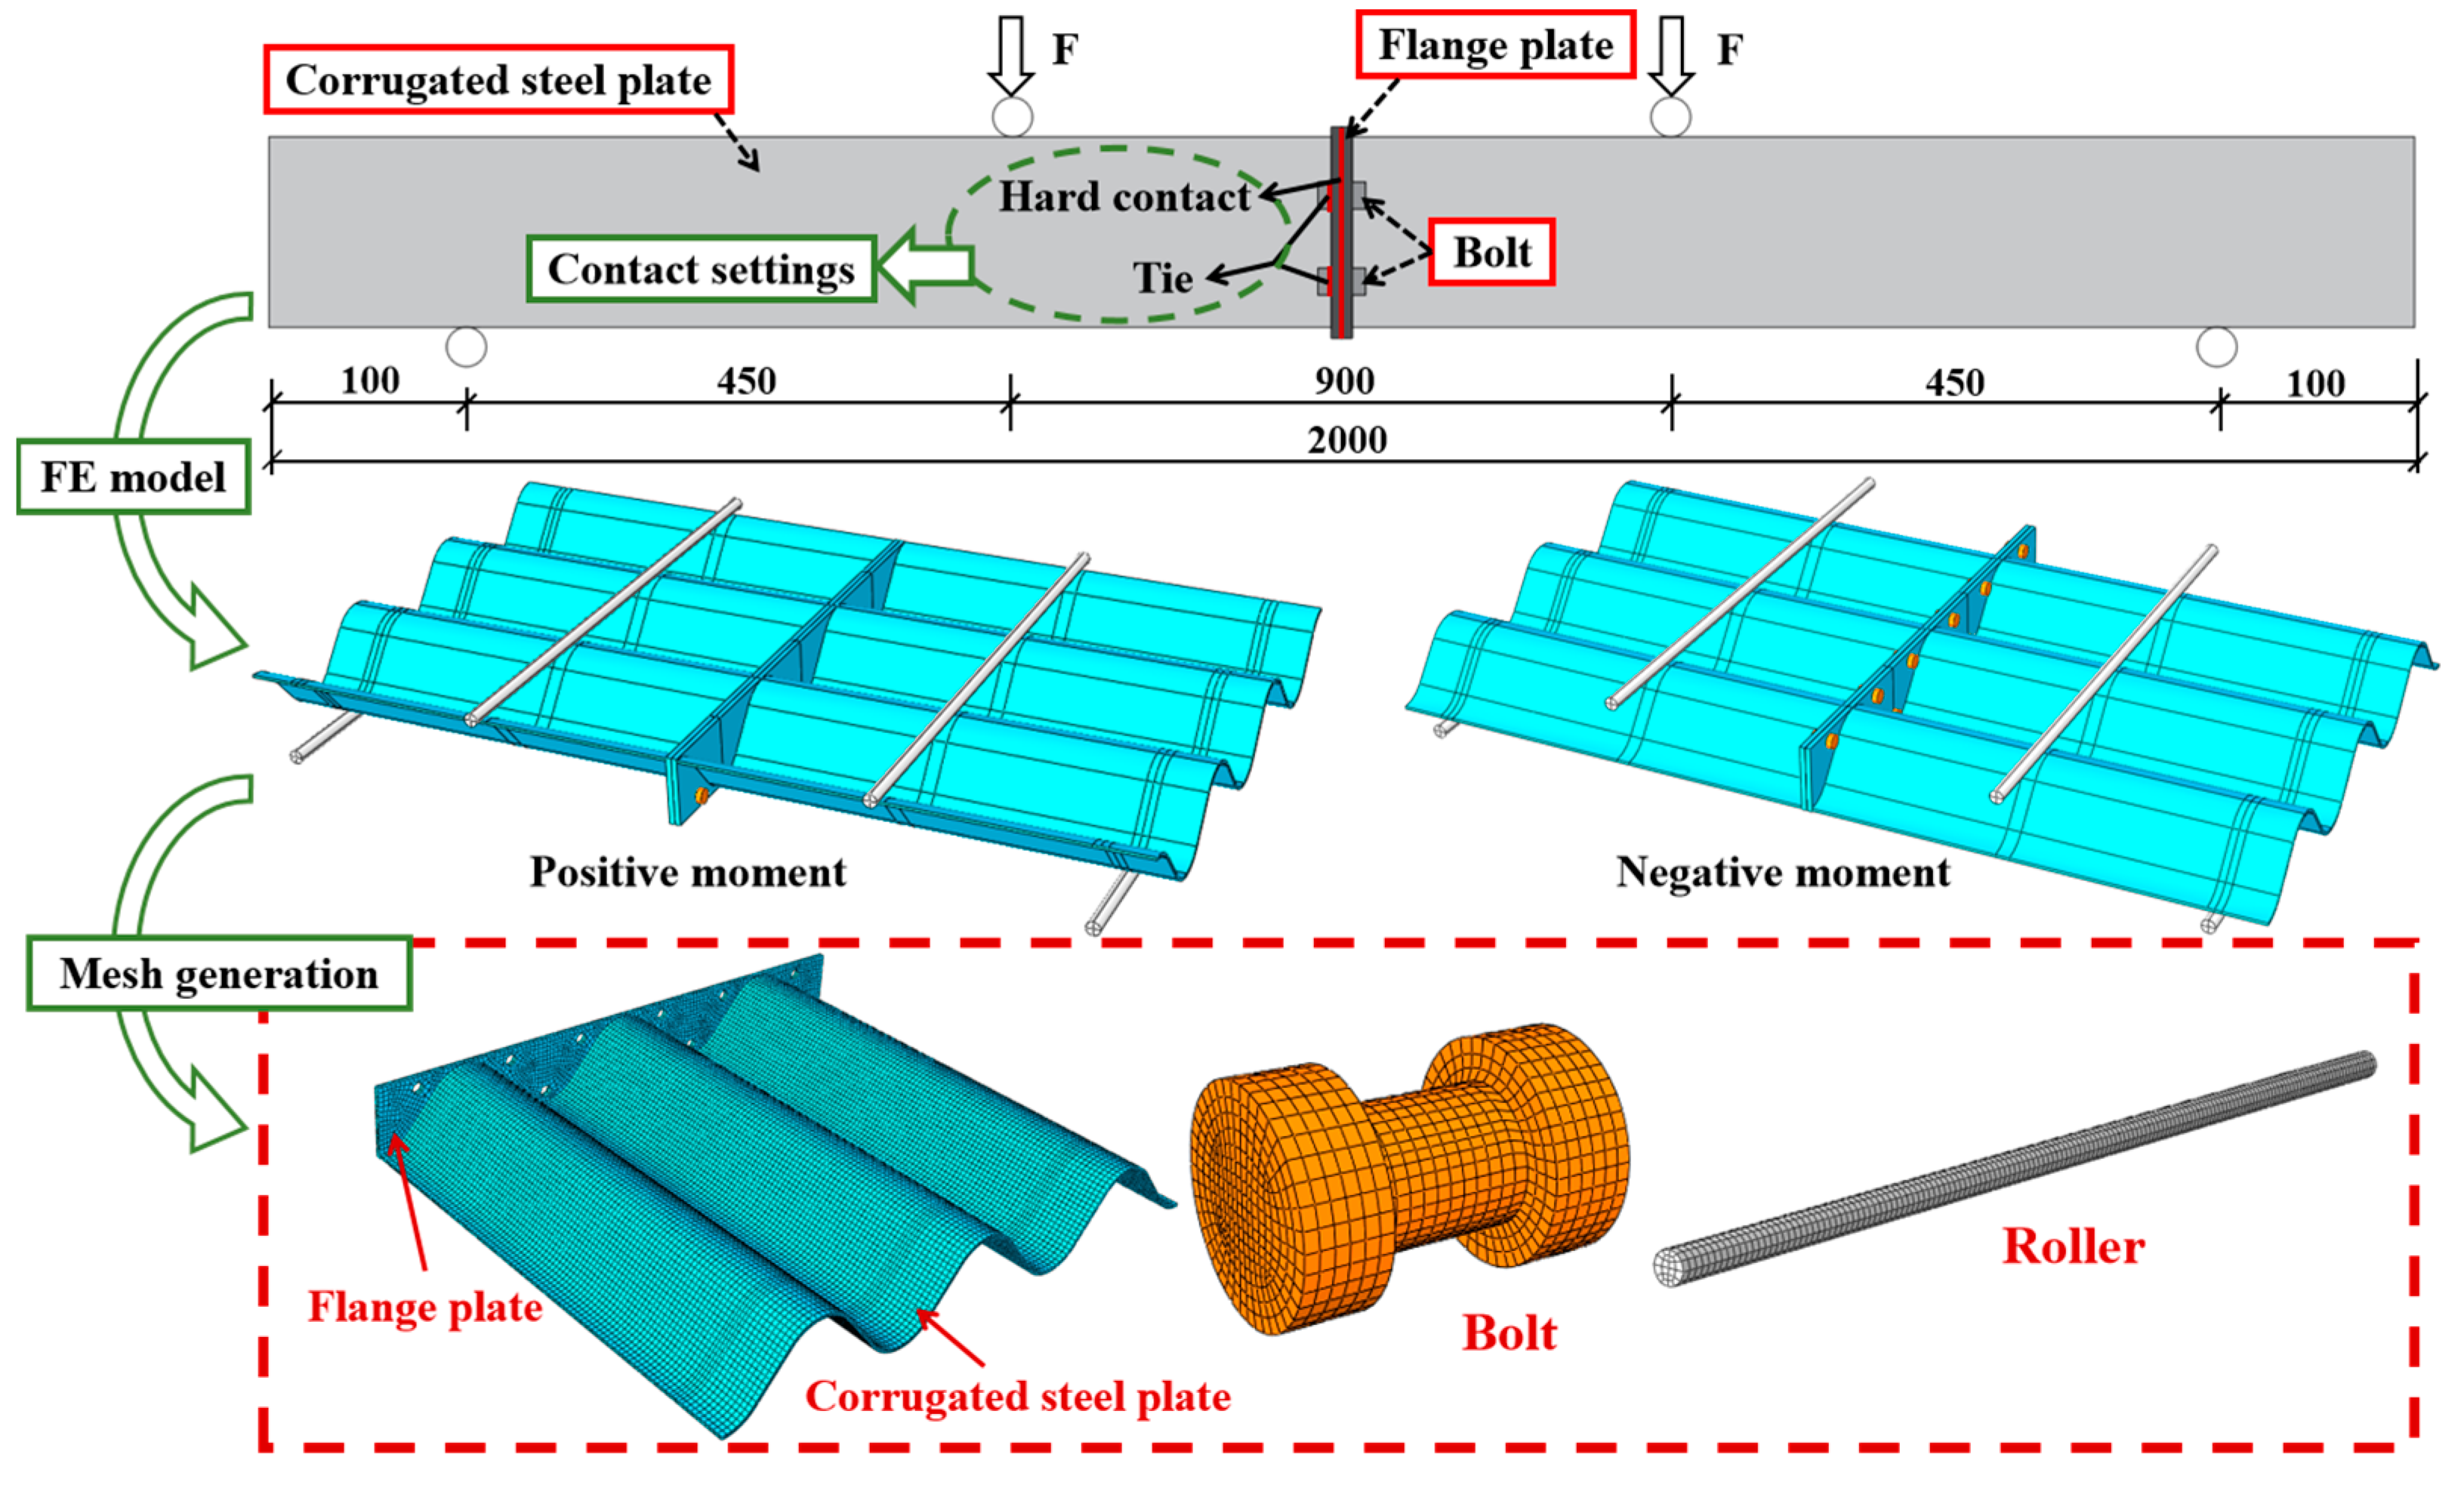
3.1. Fine Numerical Simulation Analysis

The corrugated steel flange joint (CSFJ) is a commonly used connection method in corrugated steel lining structures [12]. Specifically, the CSFJ consists of CSPs, flange plates, and bolts. The flange plates are welded to both ends of the CSP, and the connection between two corrugated steel linings is achieved by bolts securing the flange plates, as shown in Figure 7.
Currently, there is no standardized algorithm available for determining the rotational stiffness (kθ) of the CSFJ, which typically requires mechanical testing, which is slow and time-consuming. In contrast, the three-dimensional fine FE model method offers a simpler and more efficient alternative by fully accounting for local structural details. FE models of the CSFJ (Figure 7) were developed based on the study of Huang Mingli [26]. (1) Meshing: Solid elements (C3D8R) were employed to model all components. The mesh sizes for the CSP, flange plates, and bolts were 4 mm. The rollers were defined as rigid bodies, so the mesh size was deemed non-critical. (2) Interaction: Tie constraints were utilized to establish connections between the flange plates and bolts. Additionally, tie constraints were applied to connect the bottom of the CSP to the support. Hard contact and a tangential friction coefficient were specified for other interfaces. (3) Boundary conditions: The corrugated steel was free at both ends. The left-side roller was fully fixed, while the right-side roller could only move horizontally. (4) Material properties: the material constitutive was consistent with Section 2.2.2
The comparison of deflection curves (Figure 8) and destruction modes (Figure 9) demonstrate the fidelity of the FE model calculations.
By modifying the geometry of the previously mentioned FE model, a new model was developed specifically for the CSFJ in the Qipanshan Tunnel, where the CSP dimensions are 380 mm × 140 mm × 5 mm, as depicted in Figure 7. The reversed arch configuration of the CSP model faithfully replicates practical engineering conditions.

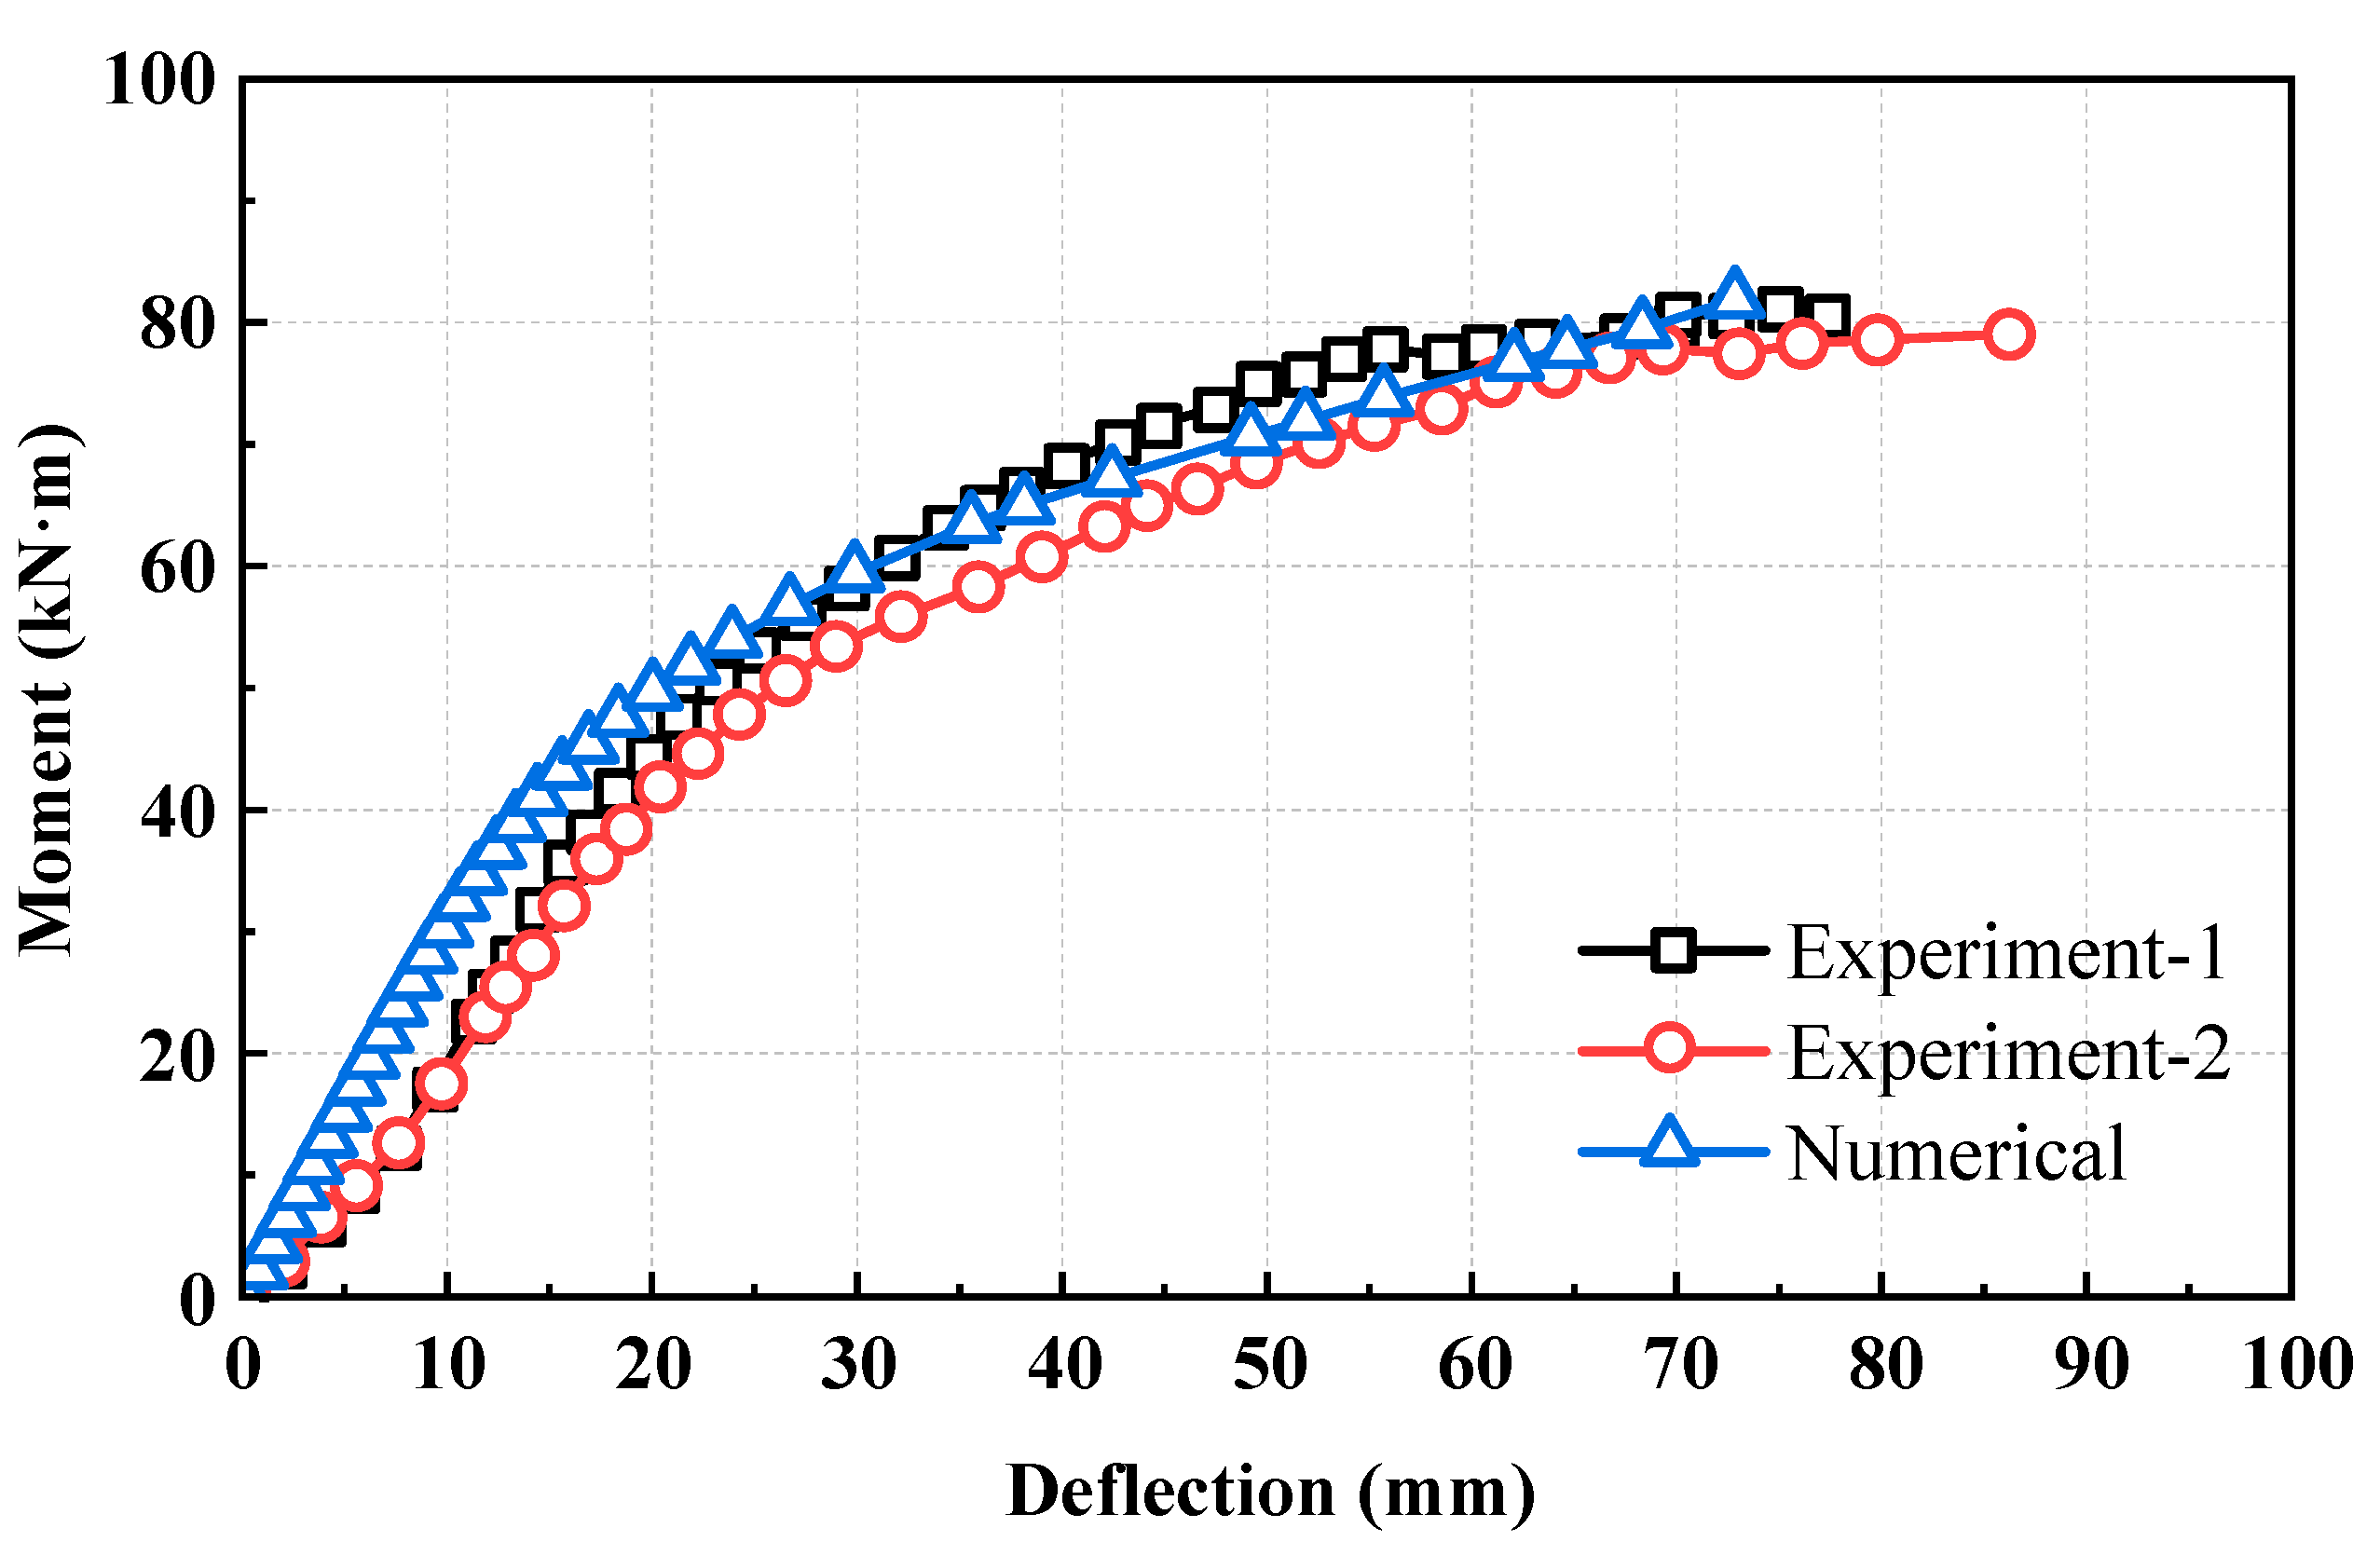
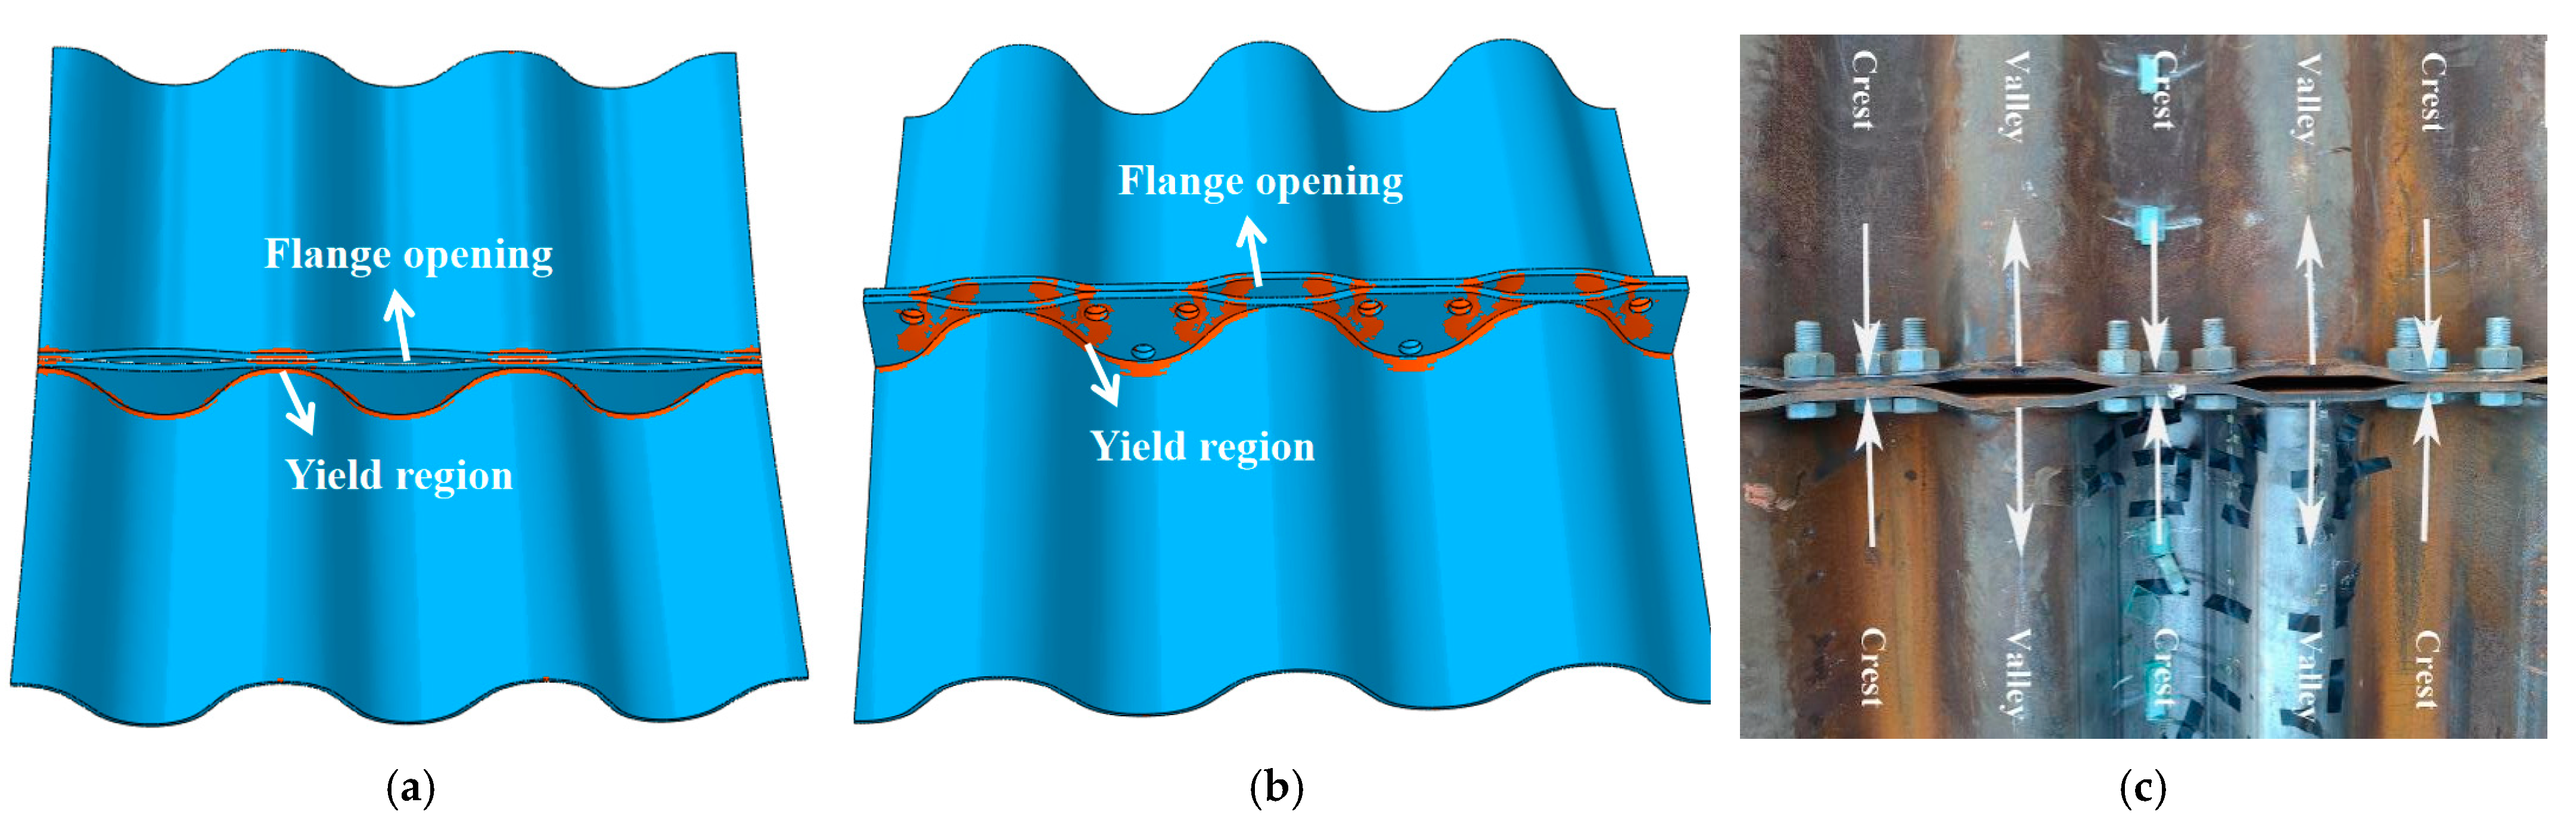
3.2. Results and Analysis

The numerical simulation of the CSFJ employed the same loading conditions as those used in the full-scale test. Specifically, a vertical load (F) was applied in incremental steps, while horizontal loads (N3) and (N4) were set at 5 kN each. Solving the three-dimensional fine FE model of the CSFJ yielded the relationship between the vertical load and the deformation of the CSFJ. The deflection near the wave crest of the CSFJ’s flange is selected as the deformation indicator, and its corresponding curve is depicted in Figure 10.
As shown in Figure 10, several observations can be made: (1) The deflection of the CSFJ gradually increases with the vertical load, following a roughly S-shaped curve. (2) Under negative bending moment conditions, an apparent inflection point in the load–deflection curve occurs at 110 kN vertical load. Conversely, this inflection point appears at 80 kN under positive bending moment conditions. Examination of the CSP and flange yield range with respect to the vertical load reveals localized yielding occurring at 110 kN and 80 kN. Thus, the vertical load capacity for the CSFJ (model dimensions: 380 mm × 140 mm × 5 mm) is determined to be 110 kN (under negative bending moment) and 80 kN (under positive bending moment).

3.3. Rotational Stiffness of Joint

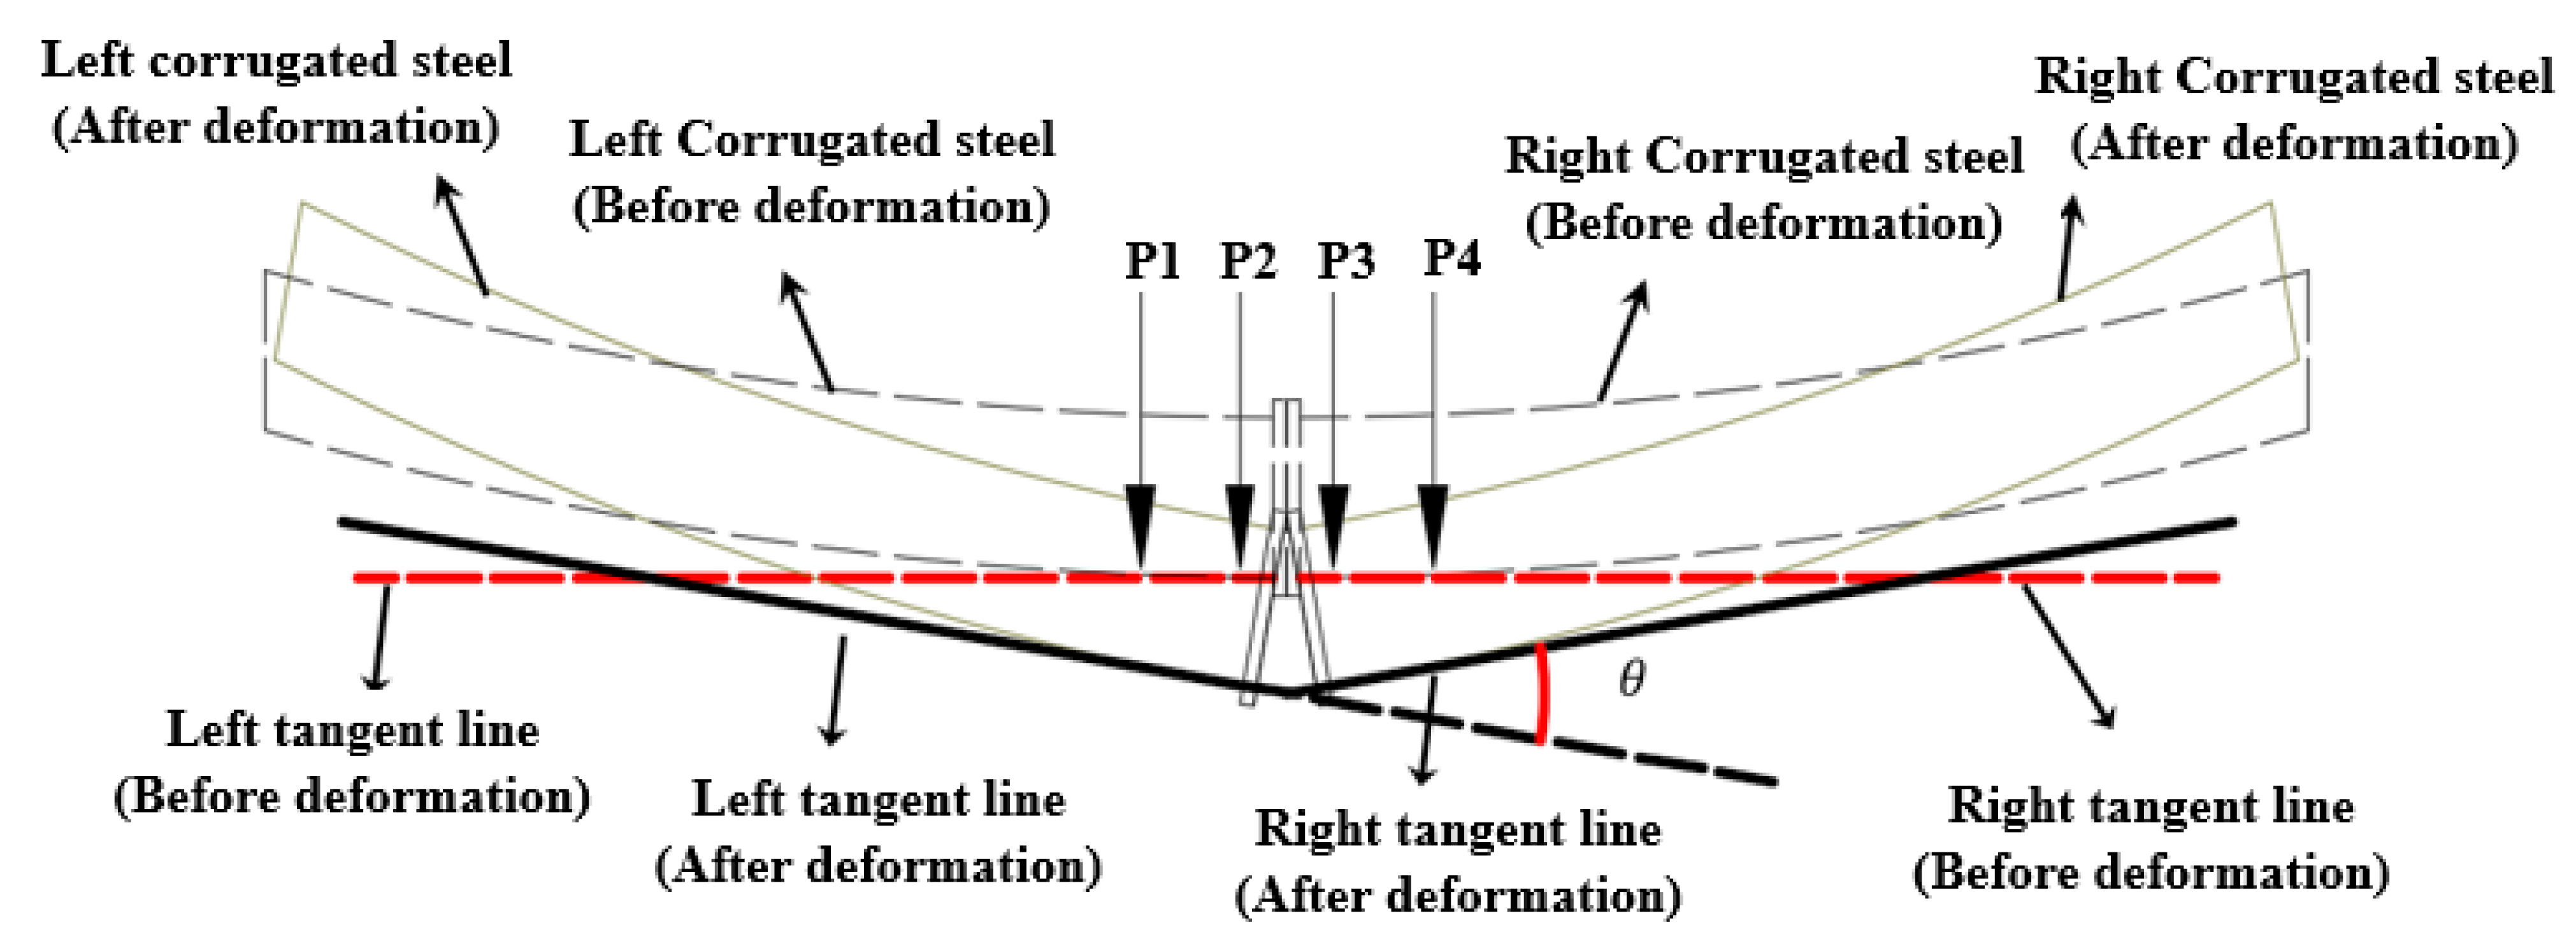
3.3.1. Rotational Angle of CSFJ

To derive the calculation equation of the rotational stiffness of the CSFJ, this paper refers to the calculation method of the joint stiffness of the traditional shield segment [27], that is,
k θ = M θ
where M and θ refer to the bending moment and rotation of the joint, respectively.
For the convenience of calculation, the rotation of the CSFJ (θ) is defined as the included angle after deformation between the tangent lines of the wave crest (or wave trough) of the CSP on both sides of the CSFJ, as shown in Figure 11.
According to the geometric relationship in Figure 11, the following angle relationship (where the rotation is in the radian system) can be deduced as follows by reading the deflection value and horizontal distance from Point 1 to Point 4 near the joint:
θ = a r c tan ω 2 ω 1 L 12 a r c tan ω 4 ω 3 L 34
where θ refers to the rotation (rad); L12 and L34 refer to the horizontal distance (m) between Point 1 and Point 2 and between Point 3 and Point 4 in the figure, respectively; and 1, 2, 3, and 4 refer to the vertical deflection values (m) of Point 1, Point 2, Point 3, and Point 4, respectively.

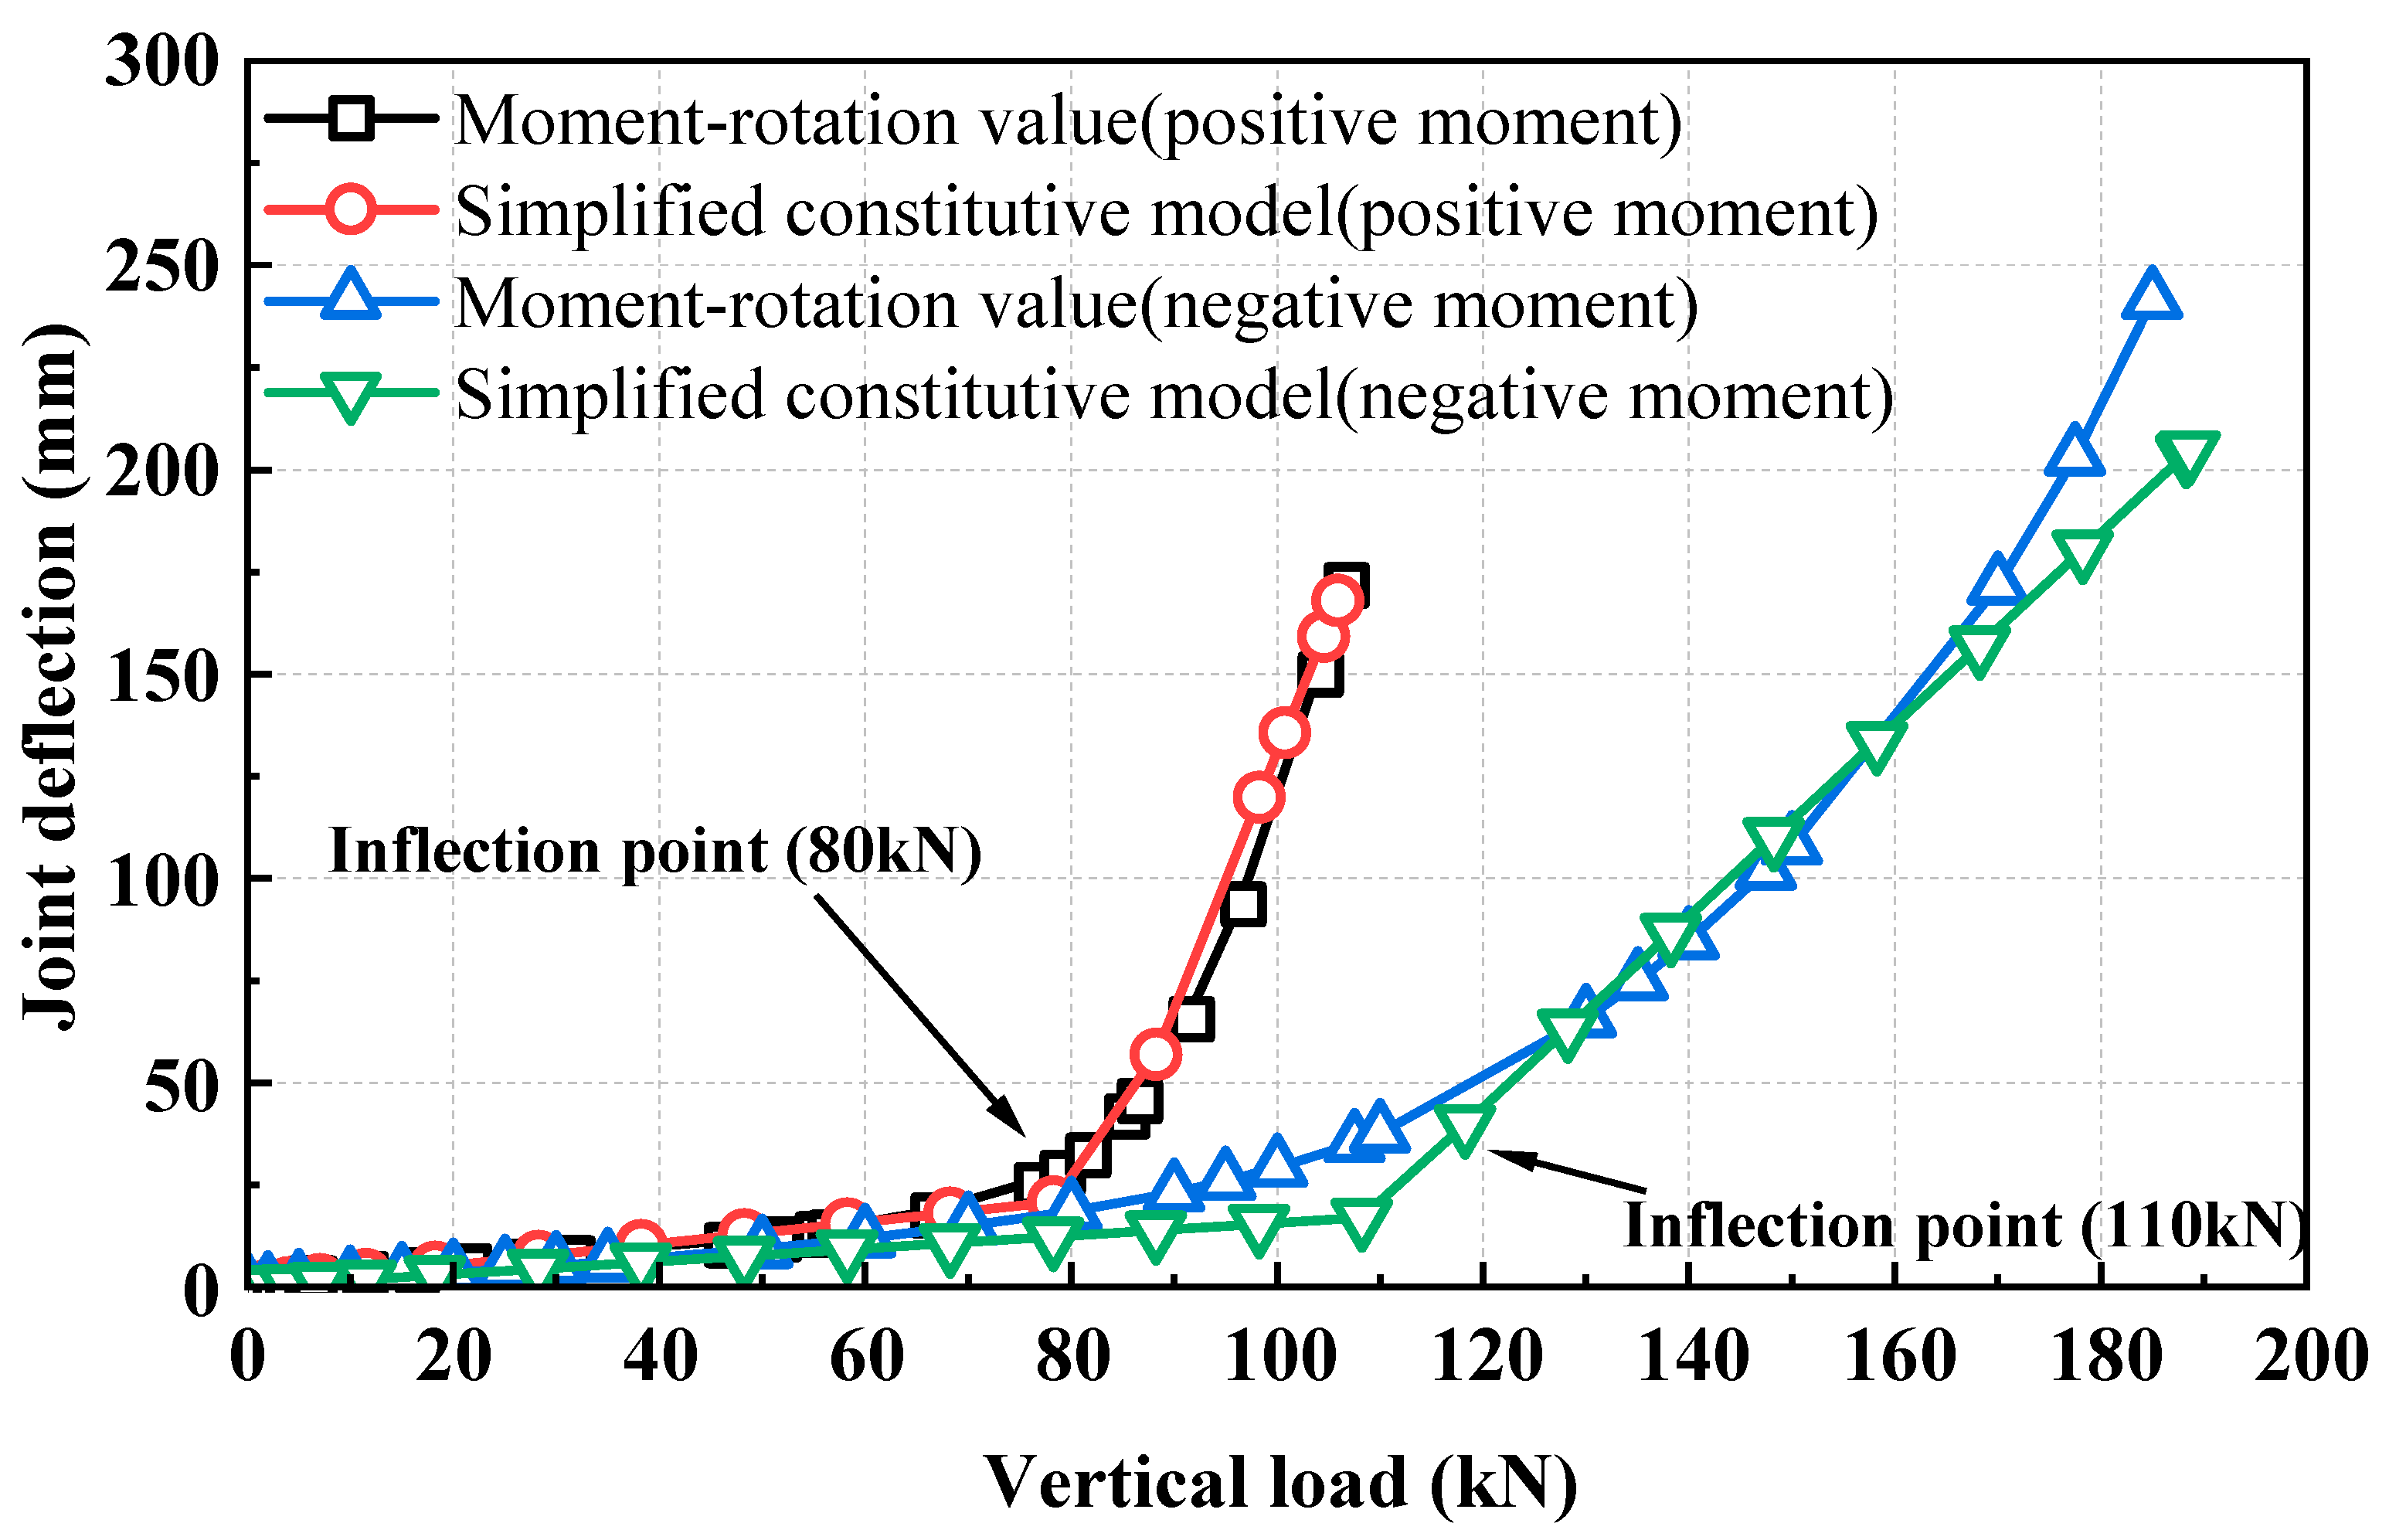
3.3.2. Rotational Stiffness of CSFJ

Based on the definition of the rotation of the CSFJ, the relationship between the deflection (ꞷ) and the rotation (θ) of the CSFJ is established, the vertical load (F) is converted into the bending moment (M), and then the vertical load–deformation curve is transformed into the rotation–bending moment characteristic curve of CSFJ, as shown in Figure 12.
Figure 12 illustrates that the moment–rotation relationship of the CSFJ exhibits a two-stage linear behavior under both positive and negative bending moments. The rotational stiffness of the CSFJ is evaluated using an elastic–plastic constitutive model, which includes two distinct phases: (1) Elastic phase: The moment–rotation curve approximates a straight line, where the slope represents the rotational stiffness of the CSFJ. In the elastic phase, the CSFJ structure experiences minimal joint opening. For the model dimensions of 380 mm × 140 mm × 5 mm, the rotational stiffness in the elastic phase is K 1 + = 761.9 kN·m/rad under positive bending moments and K 1 = 1125.0 kN·m/rad under negative bending moments. (2) Plastic phase: Upon entering the plastic phase, a significant joint opening occurs, and plastic zones near the bolt holes become evident in the flange plates. The rotational stiffness of the joint decreases compared to the elastic phase. For the model dimensions of 380 mm × 140 mm × 5 mm, the rotational stiffness in the plastic phase is K 2 + = 263 kN·m/rad under positive bending moments and K 2 = 142 kN·m/rad under negative bending moments.

3.4. Plane Strain-Spring Simplified Model and Its Validation

In order to facilitate the design and calculation of corrugated steel lining, You et al. [25] proposed the concept of the equivalent solid wall pipe section height of CSP, that is,
h e q = 12 E I E A
where h e q refers to equivalent height. Based on the results of the equivalent stiffness of CSP, the flexural stiffness of CSP in Equation (8) is modified accordingly so as to obtain the following:
h e q = 12 η E I E A
where h e q refers to the modified equivalent height; ηEI refers to the actual flexural stiffness of CSP; and EA refers to the axial stiffness of CSP.
Therefore, Equation (9) demonstrates that while calculating the equivalent solid wall section height of CSP ensures stable flexural stiffness, it does not guarantee the accuracy of axial stiffness. Direct parameter-based calculations may lead to deviations in results. Hence, the concept of the equivalent solid wall section width of CSP is derived as follows:
b e q = A h e q
where beq refers to modified equivalent height.
Through the equivalent calculations using Equations (9) and (10), the CSP section can be represented as an equivalent rectangular section. To accurately obtain the bearing characteristics of CSPs and surrounding rock, and to facilitate analysis of the interaction between CSP and back-sprayed concrete, the plane strain method is employed for computation. Utilizing the rotational stiffness results of the CSFJ, a torsional spring model is adopted to simulate the behavior of the CSFJ. Parameters of rotational stiffness are derived based on a two-stage linear model of the CSFJ proposed in Section 3.3. In conclusion, the plane strain-joint spring simplified model is formulated for the corrugated steel lining structure, presenting a calculation equation system described in Equation (11), which is the simplified calculation method for the corrugated steel initial support structure.
h e q = 12 η E I E A b e q = A h e q M = f ( θ )
To validate the accuracy of the simplified calculation method, a two-dimensional plane strain FE model was established in ABAQUS based on the three-dimensional fine joint model established in Section 3.2. The CSFJ was defined by “rotational and translational” connectors to ensure fixed distances between nodes. These nodes are coupled to the CSP end faces using coupling constraints, coinciding at the section center. The simulation results, as shown in Figure 10, indicate a good correlation between the calculations from the three-dimensional FE model and those from the simplified model.

4. Practical Engineering Application

To further validate the accuracy of the simplified calculation method proposed in Section 3.4, a two-dimensional plane strain simplified calculation model was established based on the Qipanshan Tunnel project and compared with the monitoring data.

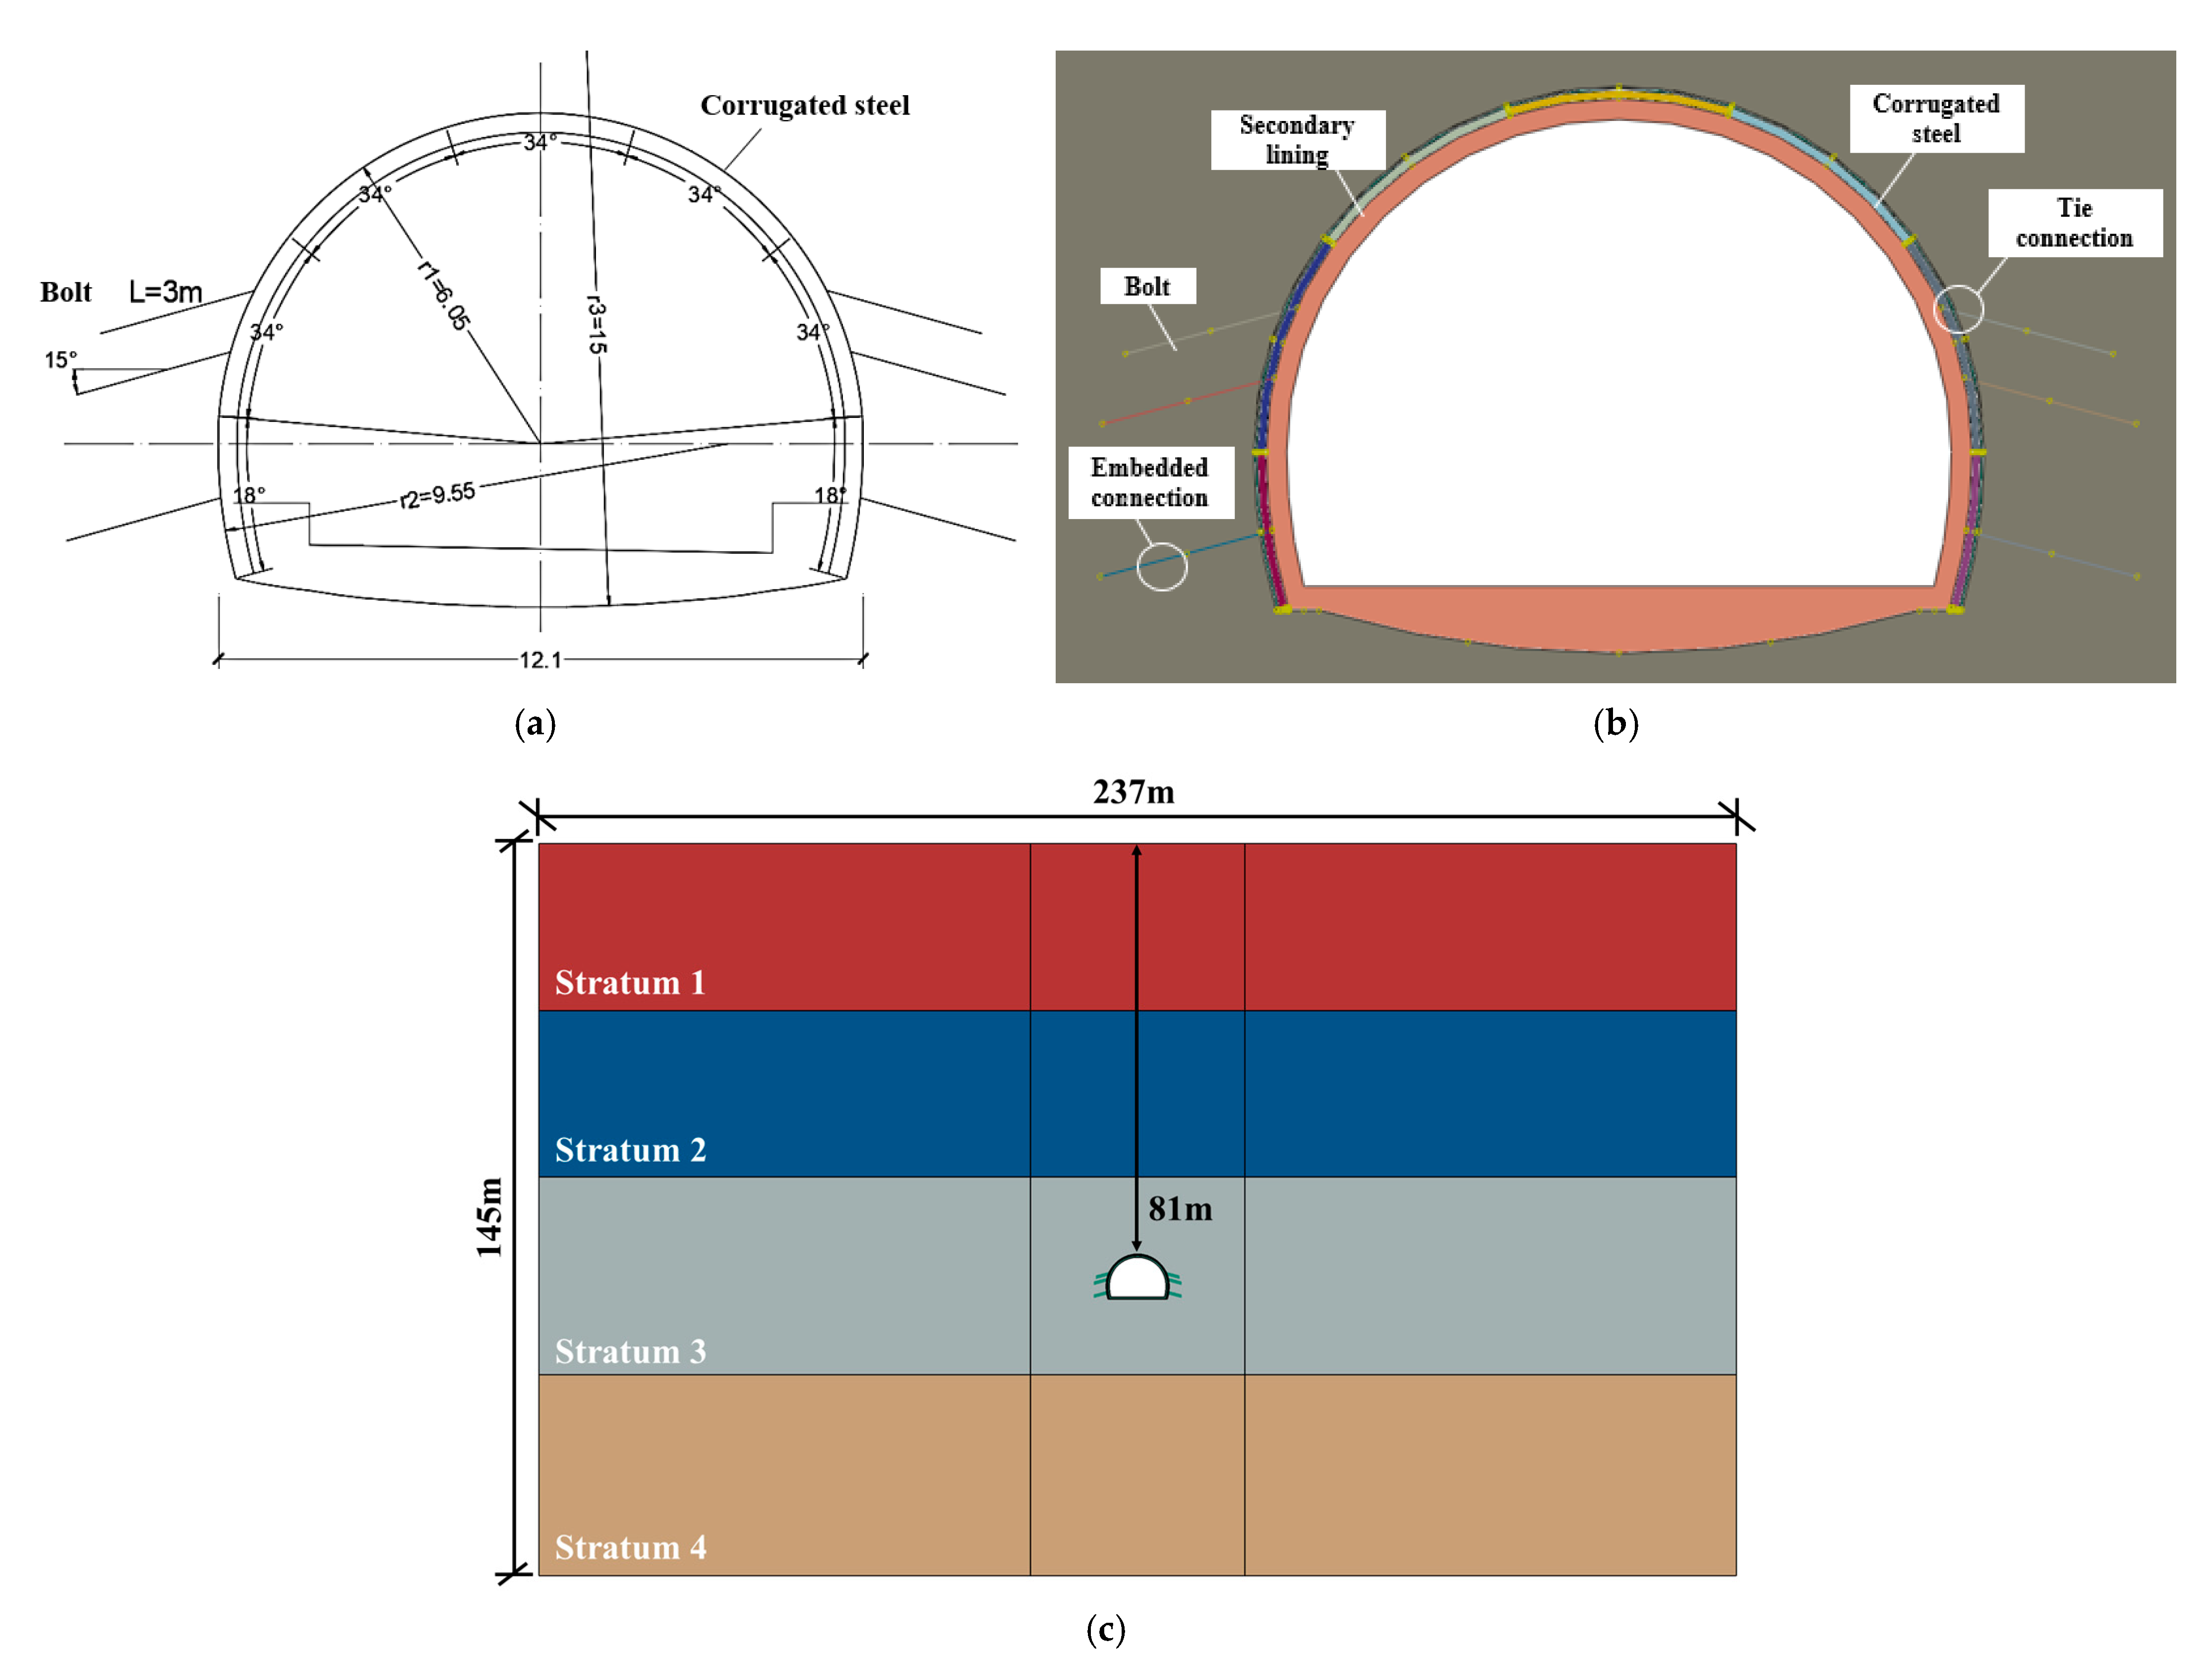
4.1. Project Overview

The Qipanshan Tunnel is situated along the Chengchuan-Jiangchuan Highway in Yunnan Province. It comprises two separate lanes. The left lane spans from stakes ZK47 + 212 to ZK48 + 460, totaling 1248 m in length with a maximum burial depth of 131 m. Similarly, the right lane extends from stakes YK47 + 205 to YK48 + 460, covering a distance of 1255 m and reaching a maximum depth of 119 m, as illustrated in Figure 13. The tunnel site is positioned on the western flank of the Heiyashan syncline, characterized by rock strata dipping at 130° with a 25° angle. The rock mass exhibits a slightly tensile, dispersed configuration, featuring rough fractured surfaces without filling. Surface erosional features, such as water-eroded ditches, grooves, and buds, are prominently developed.
The CSP selected for the initial support structure of the Qipanshan Tunnel measures 380 mm × 140 mm × 5 mm and is assembled into an arch support structure using flanges and bolts. An 8 cm deformation allowance is provided behind the CSP initial support, which is grouted after full assembly. Anchor bolts, 3 m in length, are positioned at both the arch foot and waist. The tunnel spans 12.1 m and is constructed using the top heading and bench excavation method, with the detailed lining design depicted in Figure 13a.
Monitoring is conducted in the test section of the corrugated steel lining at the right inlet, specifically at section YK47 + 355, with the tunnel buried at a depth of 81 m and surrounded by grade IV rock.

4.2. Numerical Simulation

An FE model was established based on the actual dimensions of the Qipan Mountain Tunnel, as shown in Figure 13.

4.2.1. Model Parameter

(1)
Surrounding rock: The tunnel is buried at a depth of 50 m, with a height from the lower boundary to the tunnel floor bottom being five times the tunnel height, and the span from the left and right boundaries to the tunnel wall is five times the tunnel span. The surrounding rock is classified as grade IV. Geological survey data provide mechanical parameters for the surrounding rock in each stratum, as detailed in Table 3.
(2)
CSP: The model is 380 mm × 140 mm × 5 mm. According to Equation (11), it is calculated that heq = 157 mm and beq = 41 mm. In addition, the parameters of the rotational connector are entered according to Table 4.
(3)
Backside shotcrete of CSP: the concrete grade is C20, the modulus of elasticity is E = 2.55 × 10⁴ MPa, the critical yield stress is σy = 9.6 MPa, and the thickness is 5 cm.
(4)
Secondary lining concrete: the concrete grade is C30, the modulus of elasticity is E = 3.0 × 10⁴ MPa, and the thickness is 35 cm.
(5)
Anchor bolt: The angle of depression of the anchor bolt is 15°, which is located at the arch foot and the arch waist; the actual diameter of the anchor bolt is 42 mm, and the spacing between the anchor bolts is 0.38 m × 4 = 1.52 m. After conversion, the diameter of the anchor bolt per linear meter is 38 mm.

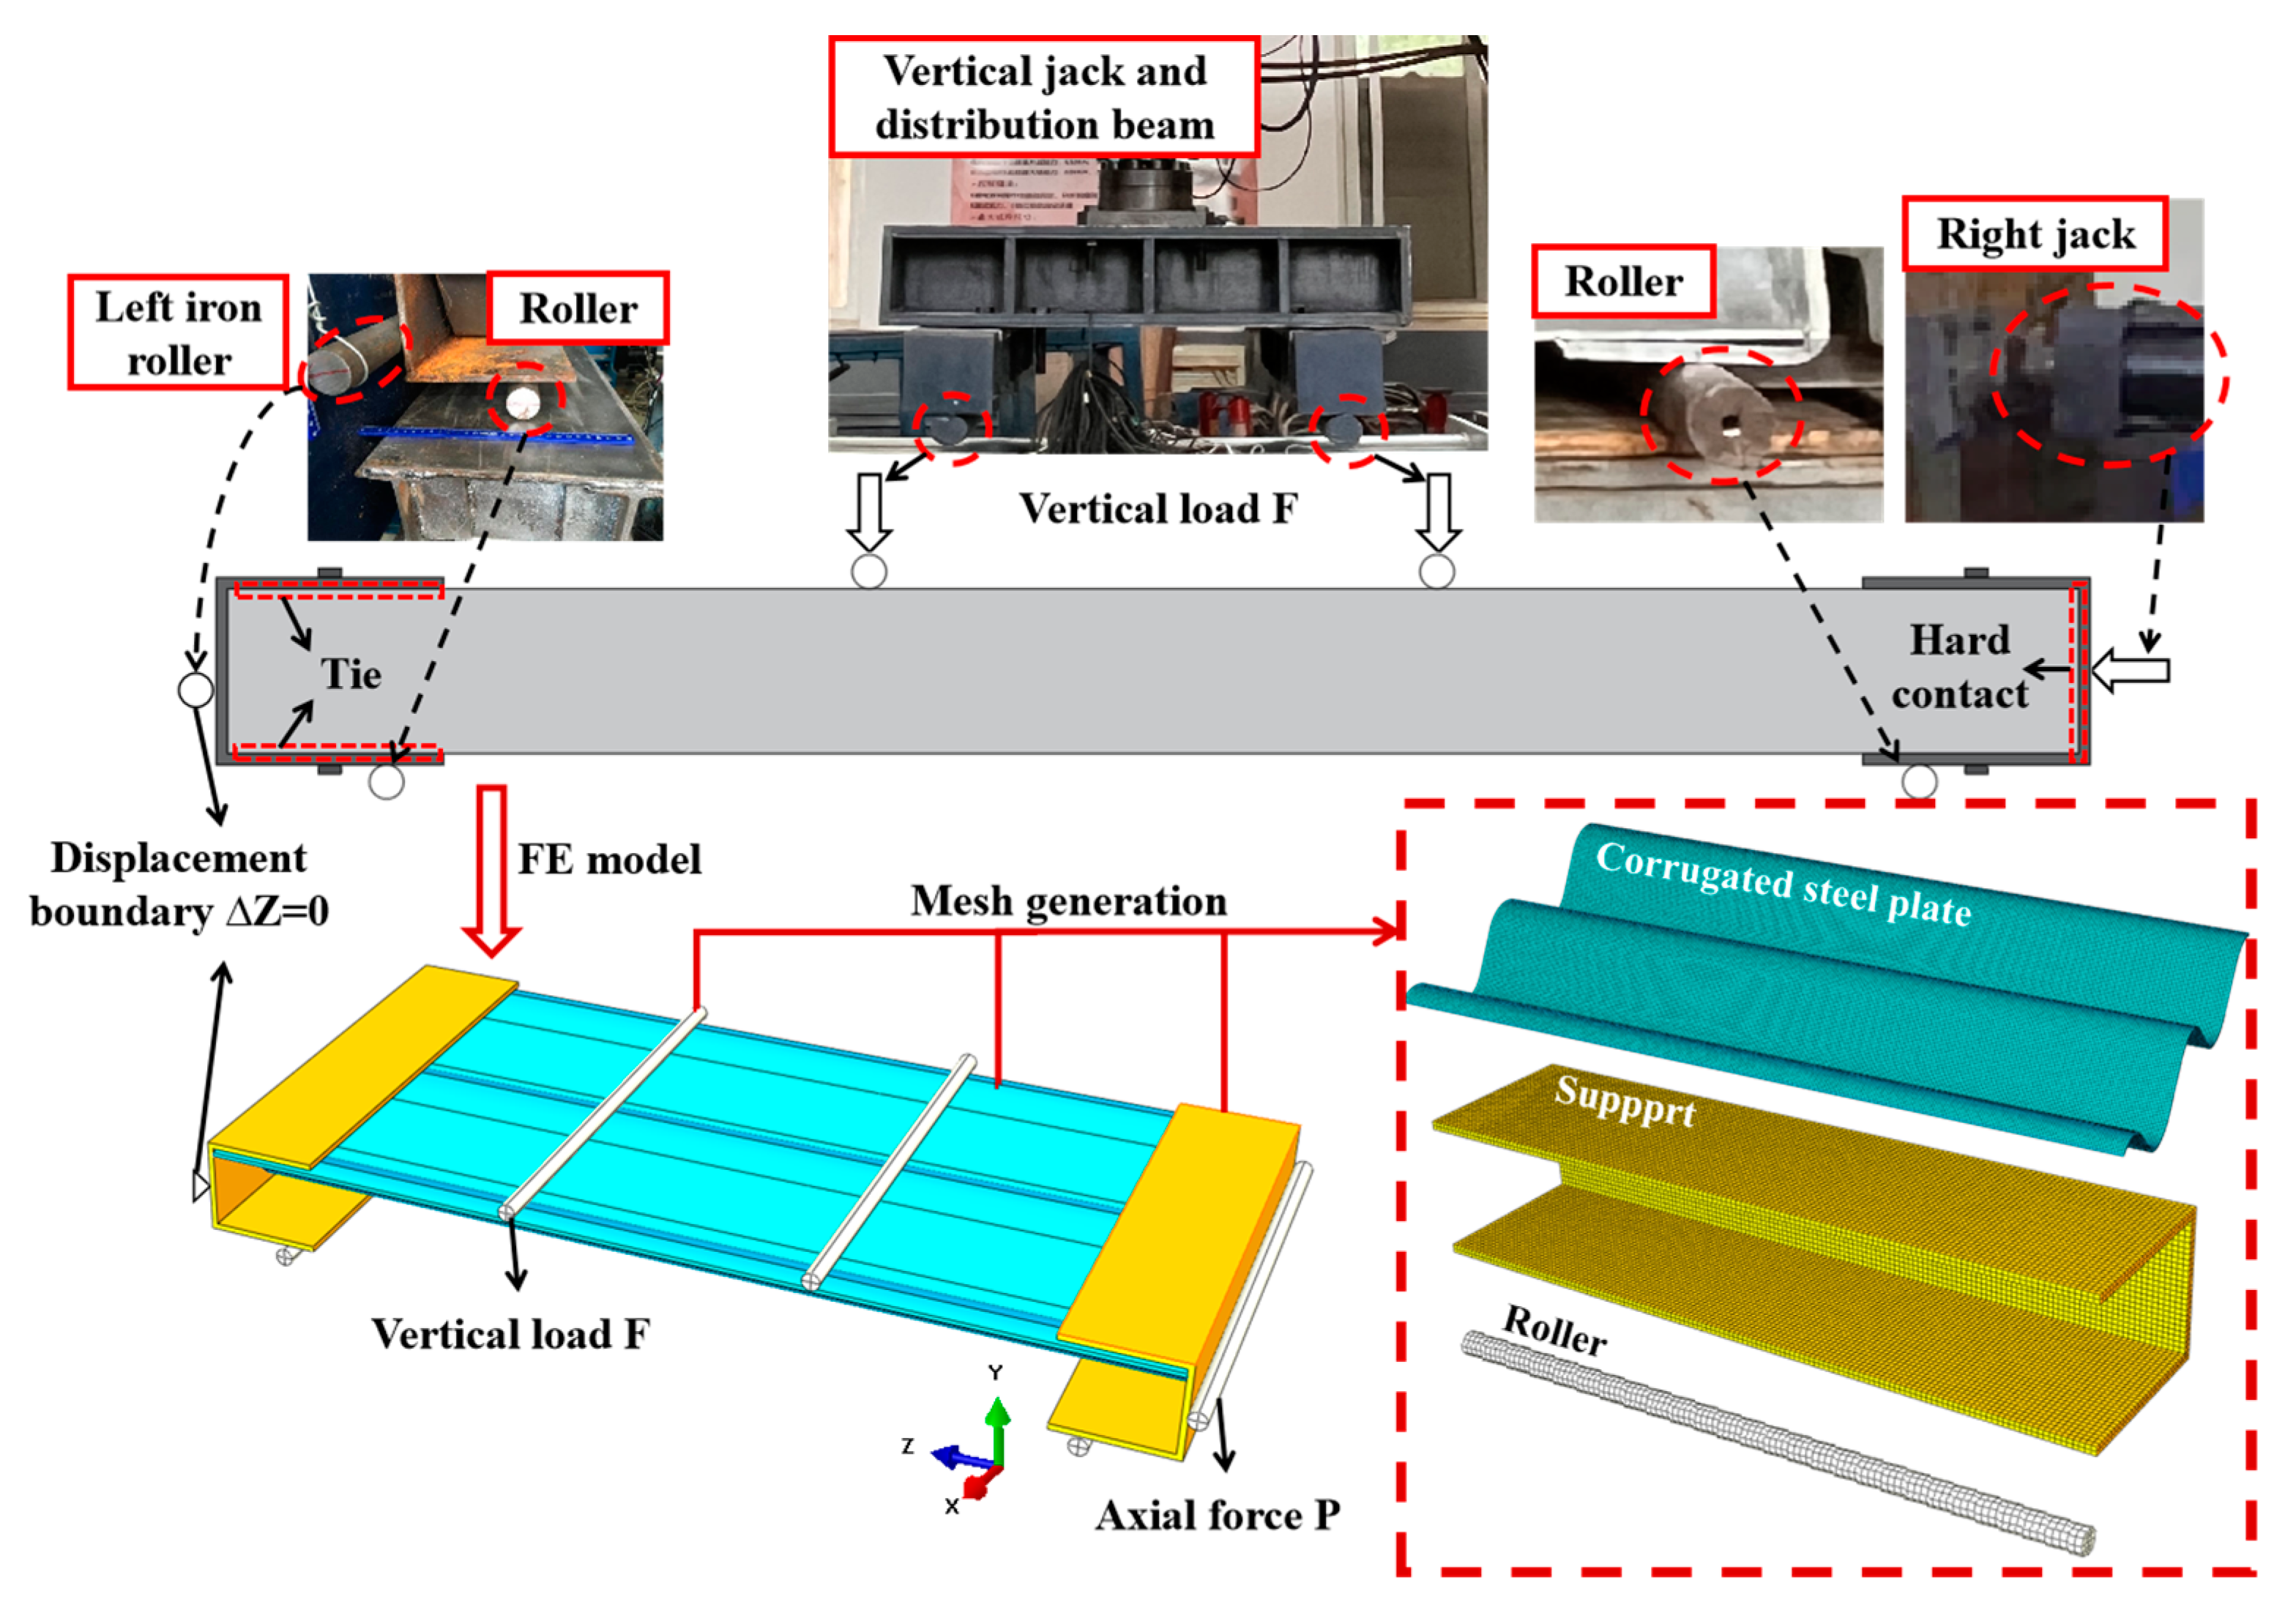
4.2.2. Structural Contact

The structural interaction is modeled with “hard contact” for normal forces and a Coulomb friction model for tangential forces. The interface between the surrounding rock and the rear shotcrete of the CSP, as well as between the surrounding rock and the secondary lining, is selected based on the internal friction angle of the soil mass. According to the study of Qingtian et al. [28], the friction coefficient in numerical simulations is 0.58 for the interface between the surrounding rock and the shotcrete behind the CSP and 0.73 between the CSP and the back-sprayed shotcrete. In the CSP’s initial support system, anchor bolts are connected to the CSP via a tie connection. The reinforcement effect of these bolts, extending deep into the surrounding rock, is simulated using Abaqus’ embedded function. Subsequently, a numerical model is established, depicted in Figure 13b.

4.3. Comparative Analysis of Monitoring Data
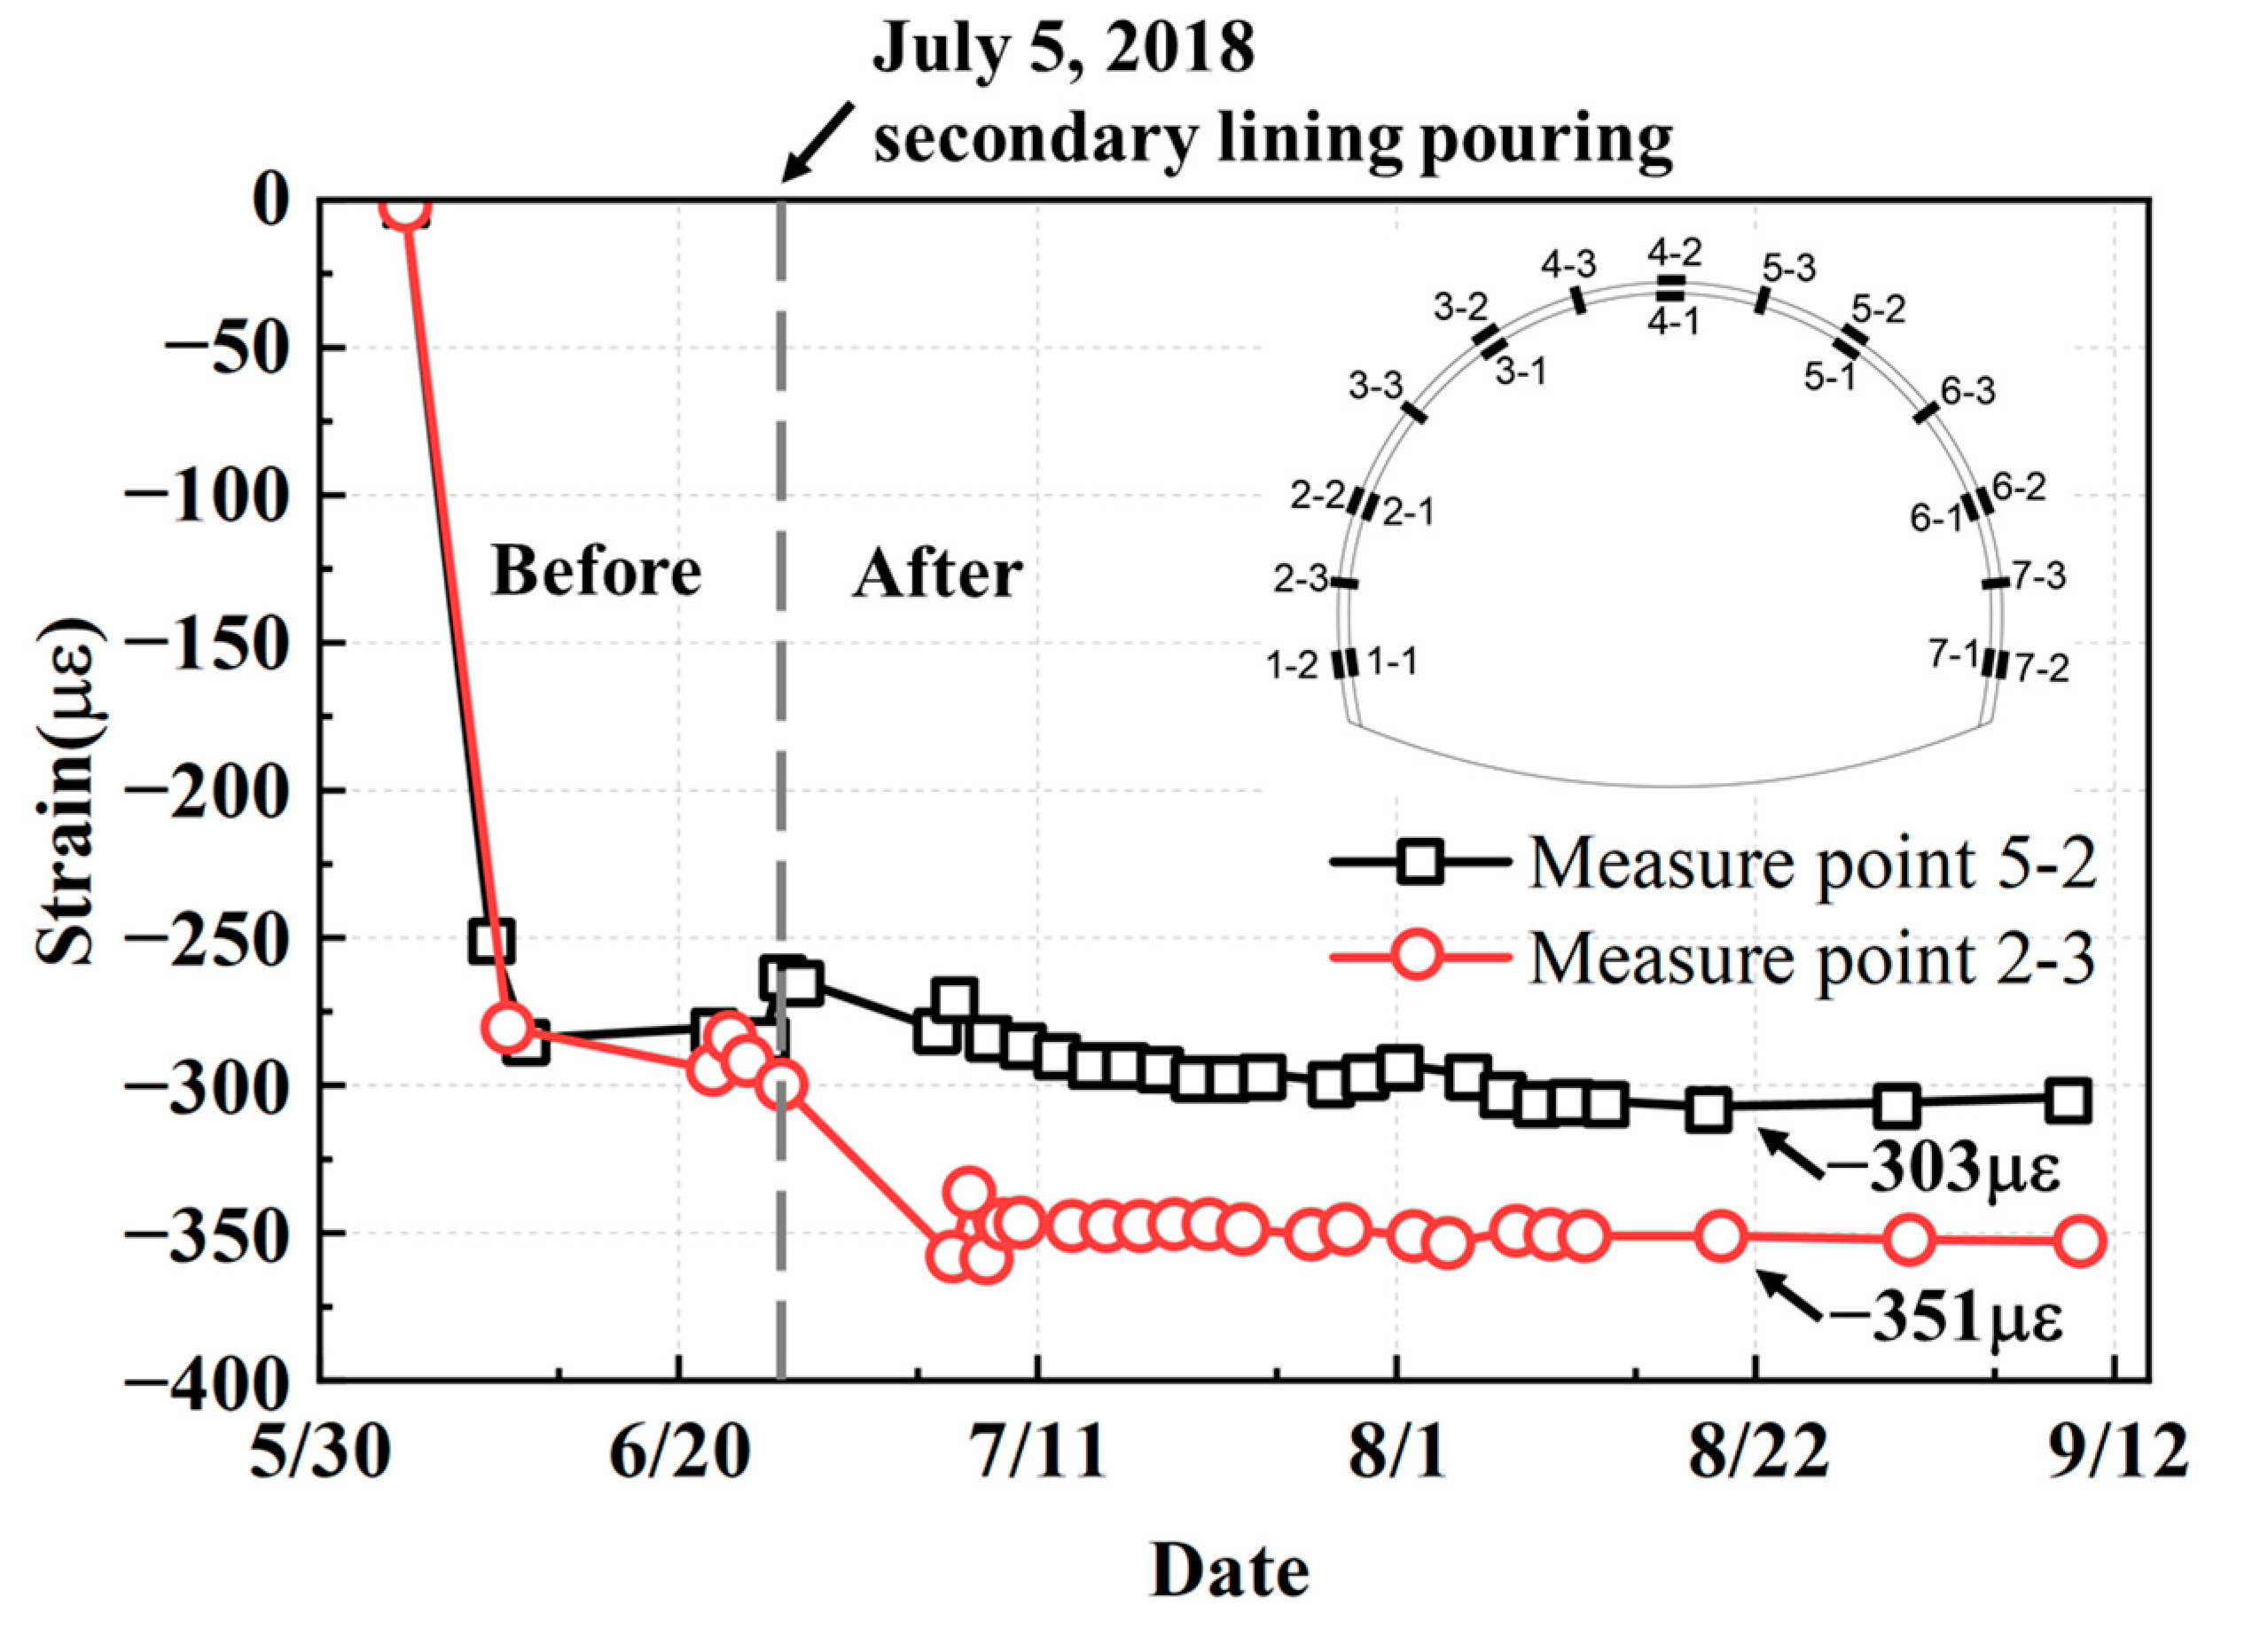
To validate the accuracy of the calculation method for the assembled corrugated steel initial support structure, numerical results are compared with actual monitoring data. Despite challenges such as construction-related interference, delayed support timing, and damage to measuring points, several representative values of final CSP strain and tunnel convergence after secondary lining are selected. These values are subjected to comparative analysis with the corresponding outputs from the numerical simulations.

4.3.1. CSP Strain

The YK47 + 355 section of the tunnel face was excavated on 29 May 2018. Installation of strain gauges was completed by 5 June 2018, followed by the pouring of the secondary lining on 5 July 2018. Figure 14 illustrates the arrangement of surface strain gauge measuring points on the CSP monitoring section. In this study, we focus on two specific measuring points, namely 2-3 and 5-2, to track changes in surface strain over time.
From Figure 14, the following observations can be made: (1) Following the completion of the corrugated steel initial support structure, the CSP strain undergoes rapid changes and gradually stabilizes after 2 weeks. Specifically, the strain at 2-3 stabilizes at −280 με, while at 5-2, it stabilizes at −300 με (negative values indicate compressive strain); (2) upon completion and stabilization of the CSP initial support construction, the strains at each measuring point are relatively consistent, indicating balanced stress distribution in the CSP initial support; (3) during the 1 week of secondary lining pouring, CSP strain fluctuates significantly: the strain at 2-3 increases and gradually stabilizes, whereas at 5-2, it initially decreases to −250 με before fluctuating again; and (4) three weeks after completion of the secondary lining pouring, CSP strain values tend to stabilize further, with final strains at 2-3 and 5-2 reaching −351 με and −303 με, respectively (negative values indicating compressive strain).
Based on the numerical simulation results, the strain of the CSP at specific positions extracted from the odb file of Abaqus FE software (ABAQUS 2020) is compared with the field monitoring results. The comparative findings are presented in Table 5.
From Table 5, it is evident that the relative error between the numerical simulation results and the monitored values of CSP strain at measuring points 2-3 and 5-2 for the initial support of CSP is 2% and 14%, respectively. Moreover, the relative errors at other measuring points are also below 15%, falling within the acceptable range.

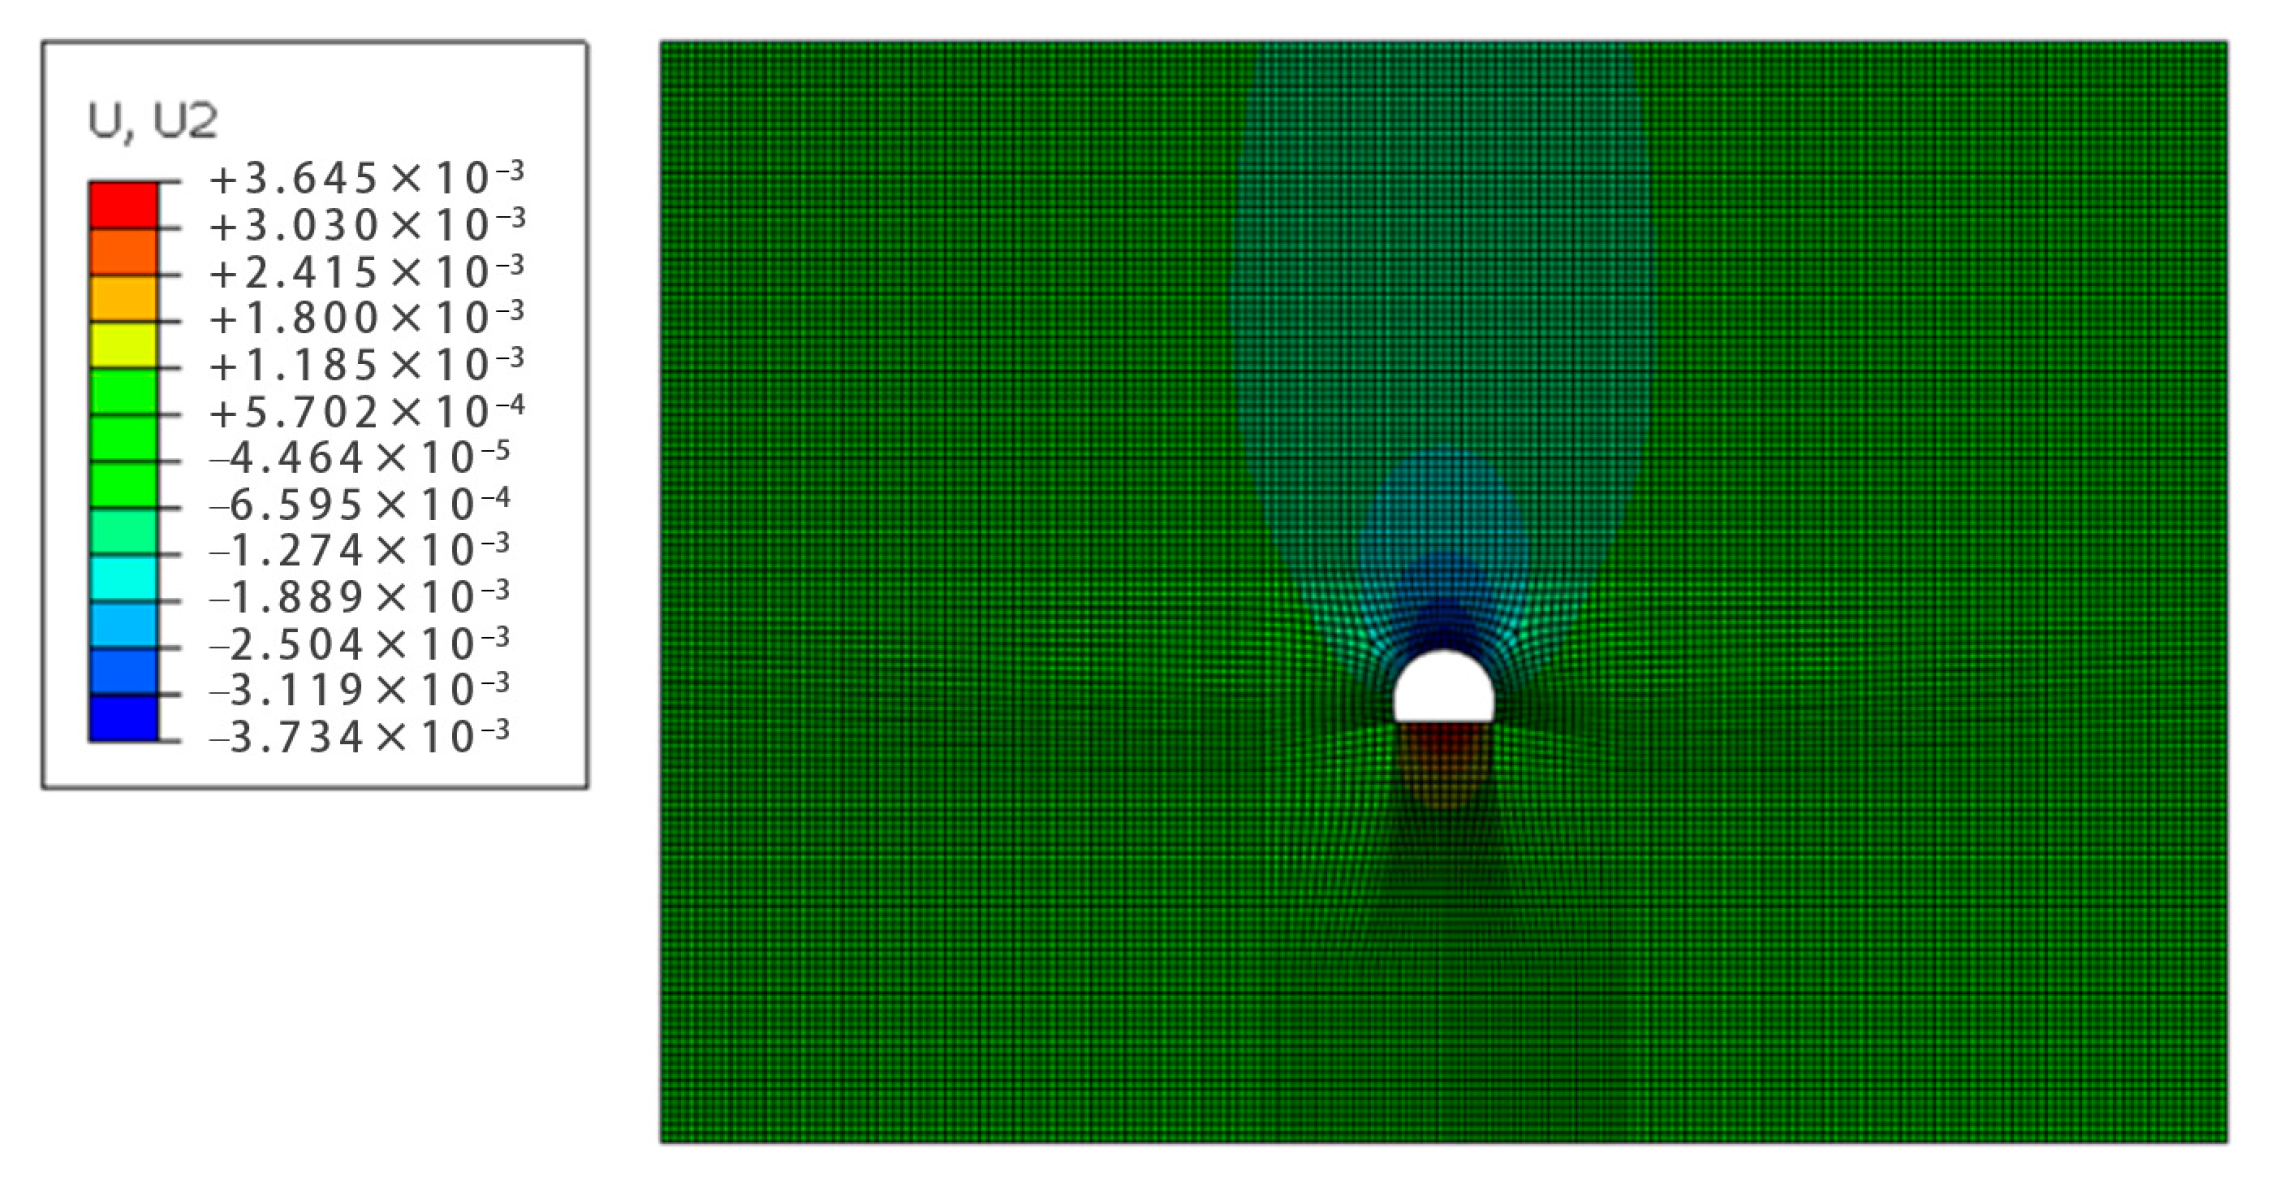
4.3.2. Convergence around the Tunnel

The convergence measurement lines around the tunnel of the corrugated steel initial support test section are depicted in Figure 15. Measuring lines AE and BF were specifically chosen to track the evolution of convergence of the secondary lining structure over time in this study. From Figure 15, the following observations are noted: (1) Measuring line AE shows a gradual increase in convergence within one month after the completion of secondary lining construction, stabilizing eventually at 2.44 mm; (2) Measuring line BF exhibits a similar pattern with convergence increasing gradually over two weeks post-secondary lining completion, followed by slight fluctuations before stabilizing at 2.41 mm; (3) Following the completion of the secondary lining, the convergence deformation of the tunnel remains minimal, suggesting a relatively stable tunnel structure.
The numerical simulation of vertical deformation around the Qipanshan Tunnel is illustrated in Figure 16. Following the completion of secondary lining pouring, monitoring data from the convergence measuring line around the tunnel indicates displacement increments in the numerical model from initial secondary lining construction to final stabilization. The convergence data from lines AE and BF in the numerical simulation are extracted and compared against field monitoring results, with the comparative findings presented in Table 6.
From Table 6, it is observed that the relative error between the numerical simulation results of tunnel convergence and the field monitoring data is below 20%. This indicates a favorable agreement between the two datasets regarding tunnel convergence.
In summary, based on the comparative analysis of the aforementioned monitoring data, the calculation method developed in this study for the corrugated initial support structure effectively simulates structural deformation, stress, and other pertinent engineering considerations. The method demonstrates its correctness and reliability in addressing practical engineering challenges.

4.3.3. Discussion on the Simplified Calculation Methods

Currently, the calculation method for the CSP initial support structure in highway tunnels is based on Equations (8) and (10). This approach assumes a rectangular cross-section and does not account for the effects of the CSFJ. Consequently, it overlooks stiffness reduction and joint weaknesses, leading to underestimated deformations and overestimated structural safety. This shortfall results in insufficient design recommendations. In contrast, the simplified calculation method proposed in this paper, based on Equation (11), provides a more accurate computation for the initial support of corrugated steel in highway tunnels and aligns closely with monitoring data.
Despite improved calculation results, the proposed method still relies on two assumptions that do not fully reflect actual structural conditions, requiring future research to address them. (1) Axial force impact: The method does not account for the impact of axial force on joint stiffness. Axial force significantly influences the stiffness and load-bearing capacity of the CSFJ [10]. Future research should develop a joint model that incorporates axial force and its numerical calculation method. It is important to note that axial force enhances the bending performance of flange joints. Therefore, deformation calculations without considering axial force will be greater than the actual situation, serving as a safety margin without affecting design calculations. (2) Two-dimensional model limitations: The two-dimensional model fails to capture three-dimensional effects. Corrugated steel support structures are assembled using staggered seams, similar to shield tunnel segments [29]. The two-dimensional model reflects continuous seam assembly but does not account for the strengthening effect of staggered seams. Future research could propose a simplified three-dimensional calculation method. Staggered seam assembly enhances the structure, so two-dimensional calculation results will be greater than the actual situation, providing a safety margin that does not impact design safety.
Additionally, high-temperature fires in steel structures require significant attention. Heat conduction, thermal shock, and thermal waves during tunnel fires present thermal coupling problems [30,31] for CSP initial support. Therefore, new calculation methods for CSP initial support under high-temperature conditions need to be developed.

5. Conclusions

A series of full-scale tests and numerical simulations were conducted to investigate the mechanical mechanism of the assembled fast CSP initial support structure. Utilizing equivalent stiffness coefficients and a rotational stiffness model, a simplified calculation method was established. The primary conclusions drawn are as follows:
(1)
Full-scale tests were performed to characterize the stiffness properties of the CSP plate’s load–deformation curve in two stages: clearance elimination and elastic stages. The presence of initial gaps within the structure and loading system was found to initiate the clearance elimination stage. To refine the calculated CSP stiffness values, a general equivalent stiffness coefficient table for CSP plates was established, and its variation pattern was analyzed: the equivalent stiffness coefficient decreases with increasing relative displacement between plates (RDP). When the RDP exceeds 0.333, the equivalent stiffness coefficient positively correlates with thickness; otherwise, it exhibits a negative correlation.
(2)
The entire loading process of the CSFJ was generalized into a rotational stiffness model encompassing two stages: elastic and plastic. Both stages demonstrated linear behavior. Based on the rotational stiffness values from these stages, a plane strain-spring simplified model for the assembled corrugated steel initial support structure, accounting for joint conditions, was proposed.
(3)
Leveraging the Qipanshan Tunnel in Yunnan Province, a numerical model of the assembled corrugated steel initial support structure was established, incorporating structural contact relationships and constitutive models. A comparative analysis of calculation results and monitoring data was conducted to validate the accuracy and reliability of the calculation mentioned in the above method.

Author Contributions

Methodology, C.Y.; Investigation, T.W.; Writing—original draft, X.H.; Writing—review & editing, Q.Z.; Supervision, W.D. All authors have read and agreed to the published version of the manuscript.

Funding

This study has been supported by research grants from the General Program of Gansu Provincial Department of Transport Science and Technology Project (2022-01) and by the National Natural Science Foundation of China (No. 52378405).

Institutional Review Board Statement

Not applicable.

Informed Consent Statement

Not applicable.

Data Availability Statement

The original contributions presented in the study are included in the article, further inquiries can be directed to the corresponding author.

Conflicts of Interest

The authors declare no conflict of interest.

References

  1. Wu, M.; Wu, Q. Present Situation and Prospect of Mechanization Construction of Mountain Highway Tunnels. J. Chongqing Jiaotong Univ. (Nat. Sci.) 2020, 39, 14–21. [Google Scholar]
  2. Song, D. Study on the Mechanical Mechanism of Shotcrete-rockbolt Support System. Chin. J. Rock Mech. Eng. 1991, 2, 197–204. [Google Scholar]
  3. Bratschi, O. The railway equipment of the Gotthard base tunnel. ZEV Rail Glasers Annalen. 2008, 132, 447–450. [Google Scholar]
  4. Lunardi, P. Design and Construction of Tunnels; Springer: Berlin/Heidelberg, Germany, 2017. [Google Scholar]
  5. Lade, R.W.; Benjamin, J.A.; Schutten, H.P. Method for Making Vertically Layered MOMOM Tunnel Device. U.S. Patent 4,675,980, 30 June 1987. [Google Scholar]
  6. Li, G.; Ding, W.Q.; Ye, H. Study on the Construction Technology of Corrugated Steel Prefabricated Support Structure in Tunnel. Chin. J. Undergr. Space Eng. 2020, 16 (Suppl. S1), 178–184. [Google Scholar] [CrossRef]
  7. Liu, W.; Wang, X.; Jiang, H.; Ding, W.; Zhang, Q. Monitoring and numerical simulation analysis of corrugated steel support in weak surrounding rock mountain tunnels. IOP Conf. Ser. Mater. Sci. Eng. 2020, 741, 012042. [Google Scholar] [CrossRef]
  8. Li, H.J.; Wu, H.X.; Wang, Z.; Zhang, G.K.; Li, J.; Zhou, H.; Wang, M.Y.; He, Y. Experimental and numerical simulation of the propagation law of shock waves in corrugated steel-lined tunnels. Process Saf. Environ. Prot. 2022, 168, 1019–1030. [Google Scholar] [CrossRef]
  9. Ding, W.Q.; Huang, X.B.; Li, S.B.; Liu, W.T.; Zhang, Q.Z. Flexural stiffness characterization of the corrugated steel–concrete composite structure for tunnel projects. Undergr. Space 2023, 12, 18–30. [Google Scholar] [CrossRef]
  10. Zhao, G.Q.; Liu, J.T.; Meng, S.Y.; Liu, C.Y.; Wang, Q.H. Performance of corrugated steel plate flange joint under combined compression and Bending: Experimental and numerical investigations. Constr. Build. Mater. 2023, 389, 131798. [Google Scholar] [CrossRef]
  11. Yeau, K.Y.; Sezen, H.; Fox, P.J. Load Performance of In Situ Corrugated Steel Highway Culverts. J. Perform. Constr. Facil. 2009, 23, 32–39. [Google Scholar] [CrossRef]
  12. García, D.B.; Moore, I.D. The performance of deteriorated corrugated steel culverts was rehabilitated with sprayed-on cementitious liners subjected to surface loads. Tunn. Undergr. Space Technol. Inc. Trenchless Technol. Res. 2015, 47, 222–232. [Google Scholar] [CrossRef]
  13. Dai, M.; Guo, H.; Cai, J.; Lei, D. Static Analysis of Long-span Bridge Culvert in Corrugated Sheet Steel. Subgrade Eng. 2017, 5, 179–182. [Google Scholar]
  14. AASHTO. Standard Specifications for Highway Bridges, in Design; AASHTO: Washington, DC, USA, 1931. [Google Scholar]
  15. AS/NZS 2041.2:2011; Buried Corrugated Metal Structures—Installation, in Design. Standards Australia: Sydney, Australia, 1998.
  16. Xu, P.F.; Wei, Y.J.; Yang, Y.Y.; Zhou, X. Application of fabricated corrugated steel plate in subway tunnel supporting structure. Case Stud. Constr. Mater. 2022, 17, e01323. [Google Scholar] [CrossRef]
  17. Kunecki, B. Field Test and Three-Dimensional Numerical Analysis of Soil-Steel Tunnel During Backfilling. Transp. Res. Rec. 2014, 2462, 55–60. [Google Scholar] [CrossRef]
  18. He, W.T.; Liu, B.D.; Han, G.; Sun, S.W. Research of corrugated steel plate and concrete composite structure in bridge reinforcement and reconstruction. Earthq. Resist. Eng. Retrofit. 2019, 41, 104–111. [Google Scholar]
  19. Beben, D. Field Performance of Corrugated Steel Plate Road Culvert under Normal Live-Load Conditions. J. Perform. Constr. Facil. 2013, 27, 807–817. [Google Scholar] [CrossRef]
  20. Peng, S.Q.; Fan, L.; Jiang, C.R.; Zhou, J. Calculation and sensitivity analysis of corrugated steel bridge and culvert structure. J. Tongji Univ. 2005, 33, 1571–1575. [Google Scholar]
  21. Yu, C.S.; Ding, W.Q.; Wu, T.X.; Zhang, Q.Z. Study on calculation method of new corrugated steel reinforcement structure of highway tunnel. IOP Conf. Ser. Mater. Sci. Eng. 2020, 741, 012073. [Google Scholar] [CrossRef]
  22. ISO 630-1:2011(E); Structural Steels Part 1: General Technical Delivery Conditions for Hot-rolled Products. ISO: Geneva, Switzerland, 2011.
  23. Ding, W.Q.; Guo, Y.J.; Li, S.B.; Li, X.R.; Zhang, Q.Z. Experimental research on the mechanical behavior of segmental joints of shield tunnel reinforced with a new stainless steel corrugated plate. Case Stud. Constr. Mater. 2023, 18, e02170. [Google Scholar] [CrossRef]
  24. DB42/T 1195—2016; Manual for Design and Construction of Corrugated Steel Buried Structures. 2014: Manual for Design and Construction of Corrugated Steel Buried Structures. Hubei Quality and Technical Supervision Bureau: Wuhan, China, 2016.
  25. You, Q.; Miao, L.; Dong, D. Analysis on mechanical property of corrugated steel pipes. J. Southeast Univ. Nat. Sci. Ed. 2017, 47, 1187–1194. [Google Scholar]
  26. Huang, M.L.; Sun, T.; Zhang, Y.Q.; Song, Y. Experimental Research on Mechanical Properties of Corrugated Steel Primary Supported Structure Joint Type. Tunn. Constr. 2021, 41 (Suppl. S2), 43–49. [Google Scholar]
  27. Ding, W.Q.; Chen, X.Q.; Jin, Y.L.; Qiao, Y.F. Flexural behavior of segmental joint containing double rows of bolts: Experiment and simulation. Tunn. Undergr. Space Technol. 2021, 112, 103940. [Google Scholar] [CrossRef]
  28. Su, Q.T.; Du, X.; Li, C.X.; Jiang, X. Tests of Basic Physical Parameters of Steel-concrete Interface. J. Tongji Univ. Nat. Sci. 2016, 44, 499–506. [Google Scholar]
  29. Wang, J.C.; Huang, W.M.; Xu, R.Q.; Yang, Z.; Xu, R. Analytical Solution for Segmental-Tunnel Lining Incorporating Interaction between Adjacent Rings. J. Eng. Mech. 2020, 146, 04020075. [Google Scholar] [CrossRef]
  30. Mirparizi, M.; Fotuhi, A.R. Nonlinear coupled thermo-hyperelasticity analysis of thermal and mechanical wave propagation in a finite domain. Phys. A Stat. Mech. Its Appl. 2019, 537, 122755. [Google Scholar] [CrossRef]
  31. Mirparizi, M.; Fotuhi, A.R.; Shariyat, M. Nonlinear coupled thermoelastic analysis of thermal wave propagation in a functionally graded finite solid undergoing finite strain. J. Therm. Anal. Calorim. 2020, 139, 2309–2320. [Google Scholar] [CrossRef]
Figure 1. Schematic diagram of corrugated steel specimen (unit: mm): (a) sectional dimensions of corrugated steel specimens; (b) loading of corrugated steel specimens.
Applsci 14 07242 g001
Figure 2. Experimental device.
Applsci 14 07242 g002
Figure 3. Vertical load–deflection curve of corrugated steel in full-scale test.
Applsci 14 07242 g003
Figure 4. Schematic illustration of three-dimensional refined FE model of corrugated steel plate.
Applsci 14 07242 g004
Figure 5. Comparison between full-scale test and numerical simulation of midspan deflection of corrugated steel plate.
Applsci 14 07242 g005
Figure 6. Influence of wave thickness and RDP on equivalent stiffness coefficient of CSP.
Applsci 14 07242 g006
Figure 7. Schematic illustration of three-dimensional refined FE model of CSP flange joint.
Applsci 14 07242 g007
Figure 8. Comparison between full-scale test and numerical simulation of CSFJ.
Applsci 14 07242 g008
Figure 9. Plastic strain contour of flange joint under positive bending moment condition: (a) front view; (b) back view; (c) experimental results [10].
Applsci 14 07242 g009
Figure 10. Vertical load–deformation curve of CSFJ (negative bending moment working condition).
Applsci 14 07242 g010
Figure 11. Schematic diagram of CSFJ rotation.
Applsci 14 07242 g011
Figure 12. Rotation–bending moment curve and simplified constitutive model of CSFJ (negative bending moment working condition).
Applsci 14 07242 g012
Figure 13. Design of lining of Qipanshan Tunnel: (a) design of lining of Qipanshan Tunnel; (b) support structure FE model; (c) overview of the FE model.
Applsci 14 07242 g013
Figure 14. Monitoring curve of typical measuring points of CSP surface strain.
Applsci 14 07242 g014
Figure 15. Monitoring curve of typical tunnel convergence measuring lines of convergence.
Applsci 14 07242 g015
Figure 16. Vertical deformation around the tunnel.
Applsci 14 07242 g016
Table 1. Elastic–plastic hardening constitutive model.
SupportCorrugated SteelBolt
Stress/MPaStrain/εStress/MPaStrain/εStress/MPaStrain/ε
000000
4000.0023100.001556400.0032
5400.15324400.1328000.1532
Table 2. General equivalent stiffness coefficient table of CSP.
150-50200-55300-110380-140400-150
31.0081.0080.8970.8260.780
41.0011.0050.9240.8490.811
50.9941.0000.9280.8790.850
6-0.9960.9290.8830.856
7-0.9910.9340.8850.864
8-0.9860.9320.8930.875
9-0.9800.9290.8920.879
10-0.9750.9270.8900.881
Table 3. Mechanical parameter table of surrounding rock.
StratumSurrounding Rock ClassificationThickness/mUnit WeightModulus of ElasticityPoisson’s RatioInternal Friction AngleCohesion
1IV3320 kN/m31.8 GPa0.3227°0.20 MPa
2IV3321 kN/m32.3 GPa0.3228°0.30 MPa
3IV3922 kN/m32.8 GPa0.3230°0.40 MPa
4IV2223 kN/m33.3 GPa0.3232°0.50 MPa
Table 4. Rotation connector parameters in Abaqus.
ϴ/rad−3−0.55−0.0400.0420.453
M/kN m−96.1−96.1−59.2042.153.953.9
Table 5. Comparison table of CSP strain.
Number of Measuring PointsMonitoring Value/μεCorresponding Value of Numerical Simulation/μεError
2-3−351−3552%
5-2−303−26014%
Table 6. Comparison table of monitoring–numerical simulation for convergence around the tunnel.
Field MonitoringNumerical SimulationError
Measuring LineCumulative
Displacement/mm
Relative Displacement/mmDisplacement
Increment/mm
After StabilizationAfter Secondary Lining
AE2.444.352.072.288%
BF2.412.890.981.9120%
Disclaimer/Publisher’s Note: The statements, opinions and data contained in all publications are solely those of the individual author(s) and contributor(s) and not of MDPI and/or the editor(s). MDPI and/or the editor(s) disclaim responsibility for any injury to people or property resulting from any ideas, methods, instructions or products referred to in the content.

