Article

Research on an Evaluation Method of Snowdrift Hazard for Railway Subgrades

1
Research Institute of Highway, Ministry of Transport, Beijing 100088, China
2
Department of Civil Engineering, Beijing Jiaotong University, Beijing 100044, China
3
Railway Engineering Research Institute, China Academy of Railway Sciences Co., Ltd., Beijing 100081, China
*
Author to whom correspondence should be addressed.
Appl. Sci. 2024, 14(16), 7247; https://doi.org/10.3390/app14167247
Submission received: 17 July 2024 / Revised: 11 August 2024 / Accepted: 14 August 2024 / Published: 17 August 2024

Abstract

:
The objective of this study is to investigate the potential risks posed by snowdrifts, a prevalent cause of natural disasters in northern China, on railway subgrades, and to assess their risk level. As a wind-driven process of snow migration and redeposition, snowdrifts pose a significant threat to the safety of transportation infrastructures. This study focuses on the Afu Railway in Xinjiang, situated on the northern slopes of the Eastern Tianshan Mountains, where it experiences periodic snowdrifts. We employed a combination of the Analytic Hierarchy Process (AHP) and fuzzy comprehensive evaluation (FCE) to construct an integrated evaluation system for assessing the risk of snowdrift to railway subgrades. The results indicate that subgrade design parameters and regional snowfield conditions are two key metrics affecting the extent of snowdrift disasters, with topography, vegetation coverage, and wind speed also exerting certain impacts. The evaluation method of this study aligns with the results of on-site observations, verifying its accuracy and practicality, thereby providing a solid risk assessment framework for snowdrifts along the railway. The scientific and systematic hazard assessment method of railway subgrades developed in this research provides basic data and theoretical support for future research, and provides a scientific basis for relevant departments to formulate countermeasures, so as to improve the safety and reliability of railway operations.

1. Introduction

Snowdrift is a natural phenomenon in which the wind blows snowflakes from surfaces or that are suspended in the air and redistributes them. Its formation is mainly influenced by wind speed, surface conditions, and the physical characteristics of snow. In winter, snowdrift has an important impact on transportation, infrastructure and the ecosystem, especially in alpine areas and snowy areas, where snowdrift is more common and destructive.
Snowdrift is a prevalent natural disaster in northern China, characterized by the migration and redeposition of snow under the influence of wind. The total area affected by snowdrift in China is approximately 530,000 km2 [1], primarily located in the mid-temperate zone of Xinjiang, the cold zone of the Qinghai-Tibet Plateau, and the temperate zone of Inner Mongolia, among other regions. The uneven spatiotemporal distribution of snowdrift is influenced by factors such as seasonal changes and latitude. For example, snowdrift disasters in Xinjiang frequently occur in winter and early spring, particularly in the western and northern mountainous areas [2,3]. Snowdrift poses a severe threat to agriculture, industry, and transportation. Figure 1 shows snow-covered days in China, with red areas representing the most snow-covered days and blue areas representing none, overlaid with railway lines, of which 11.83% are situated in regions with more than 180 snow-covered days.
Therefore, an in-depth study of the characteristics of snowdrift along transportation infrastructure and the distribution of related disasters is of significant theoretical and practical importance for disaster prevention, mitigation, and ensuring the safety of transportation operations. Snow disaster assessment and regionalization research has experienced a transformation from qualitative to quantitative analysis, and the assessment accuracy has been continuously improved. Early studies, such as the work of Wang [4], analyzed the number and types of snow days, classified Chinese snow, and put forward the principle of comprehensive assessment. With the development of technology, for example, Tachiiri et al. employed the Normalized Difference Vegetation Index (NDVI) and the Snow Water Equivalent (SWE) as assessment indicators, utilizing a regression analysis to evaluate snow disasters in Mongolia [5]. Park et al. utilized the PSR method to analyze their proposed snow disaster risk indices. They applied a hierarchical analysis and the entropy weight method in determining indicator weights to identify the area vulnerable to snow disasters [6]. In recent years, scholars have conducted extensive research on the prediction of snowdrift disasters and the evaluation of risk levels, proposing various assessment methods. These include snow disaster level assessment models [7,8,9,10] based on distance functions, multi-indicator comprehensive assessment methods, probabilistic analysis models, and integrated risk assessment systems. For example, Li [11] used the fuzzy comprehensive evaluation method to evaluate the snow disaster in Nagqu, Tibet, and Liang [12] established a snow inversion model to improve the classification accuracy. The application of GIS technology, such as the evaluation model established by Han [13], provides guiding suggestions for snow disaster prevention. Wu [14] evaluated the risk of railway snowdrift based on an entropy–cloud coupling model, and the snowdrift risk evaluation model established by Wang [15] for the Xinjiang Jingxin Expressway, all of which provide theoretical support and practical guidance for snow disaster prevention and control. These research outcomes have provided theoretical guidance and practical references for the prevention and control of snowdrift disasters.
However, current research has predominantly focused on the distribution and grading of snow disasters within provincial boundaries. This focus limits the applicability of existing evaluation methods to the widespread and extensive nature of snowdrift disasters along transportation infrastructure, such as railways and highways. Furthermore, the development and evolution of snowdrift disasters are influenced by various factors, including local climate conditions like topography, wind speed and direction, and snowfall amounts, as well as the structural form of the subgrade. These influences impart a strong regional characteristic to these events. Therefore, for the evaluation of snowdrift disasters in specific areas, in-depth analysis based on actual engineering conditions is required to ensure the accuracy and applicability of the evaluation results [16,17,18].
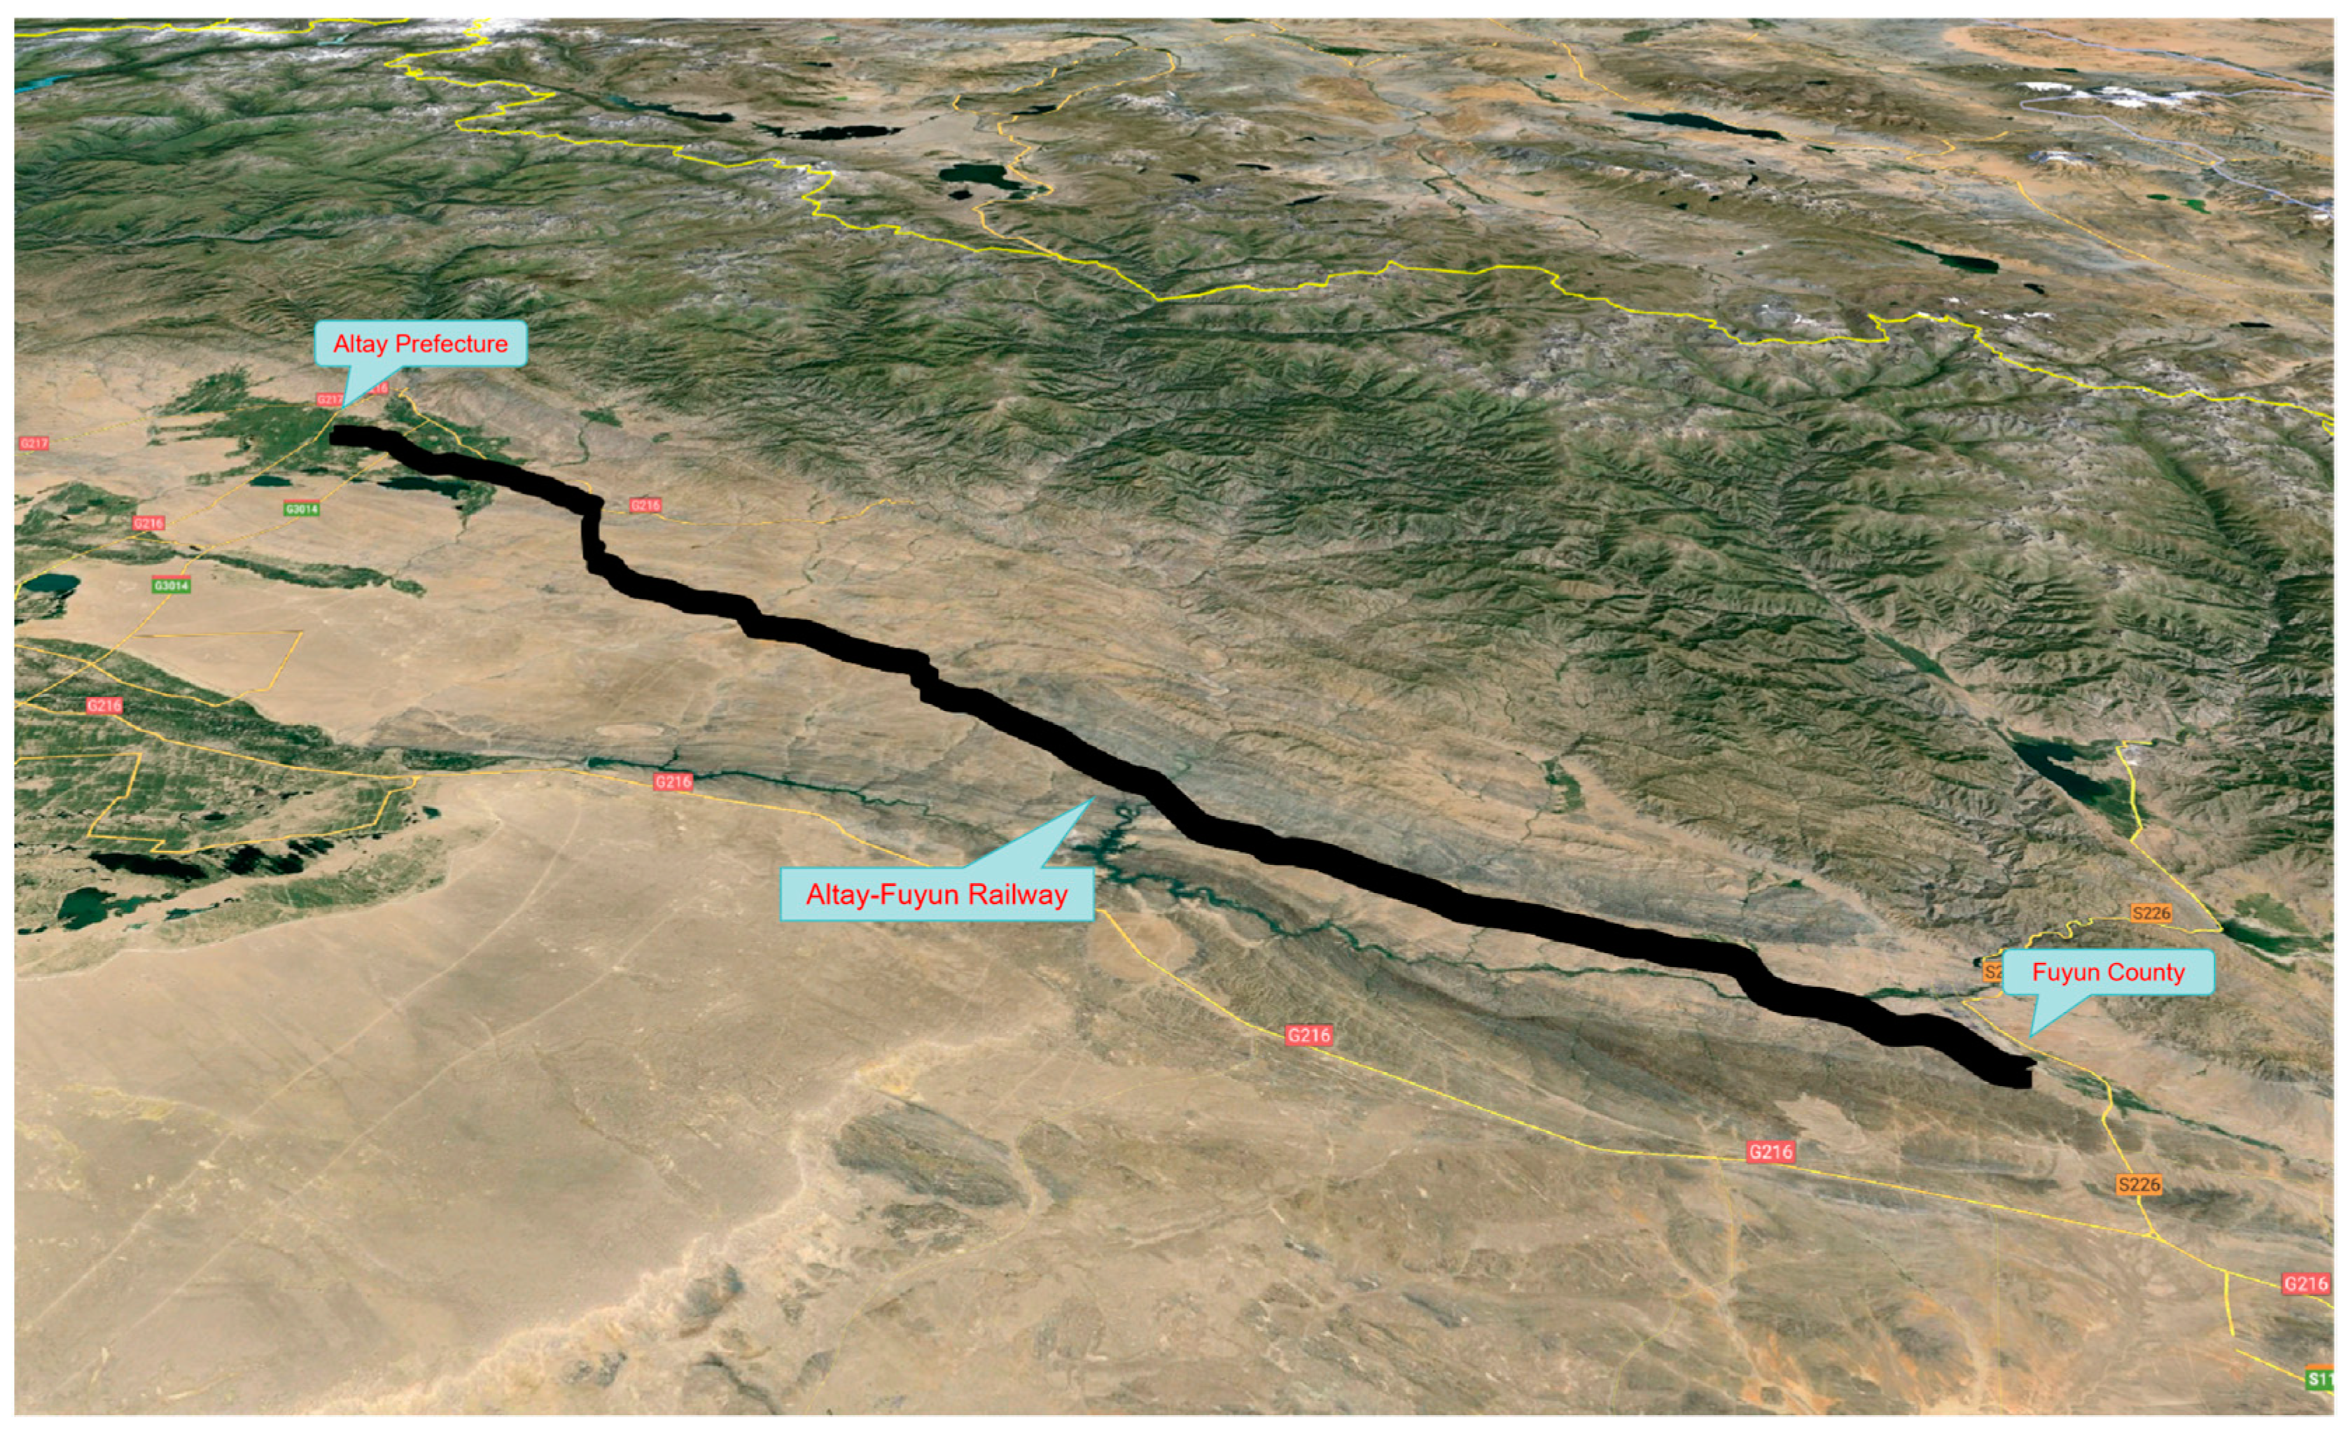
This study focuses on the Altay-Fuyun (Afu) Railway, situated in the snowdrift-prone area on the northern slopes of the Eastern Tianshan in Xinjiang. By employing a combination of the Analytic Hierarchy Process (AHP) and the fuzzy comprehensive evaluation (FCE), an integrated evaluation system was constructed to assess the risk of snowdrift to railway subgrades. Through analyzing the weights of contributing factors and conducting a fuzzy comprehensive evaluation, the study determined the risk levels of snowdrift disasters along the railway line and proposed corresponding disaster prevention and mitigation recommendations. The research results not only align with on-site observations, demonstrating the accuracy and practicality of the evaluation method, but also achieve a “qualitative + quantitative” comprehensive and synergistic risk assessment of snowdrift disasters on railway subgrades. This provides a scientific basis for the risk assessment of snowdrift disasters on railways and offers significant guidance for the design of railway subgrades and the formulation of disaster prevention and mitigation measures.

2. Methods

2.1. Factors

Whether snowdrift-related disasters occur in railway subgrade is determined by many factors, which have certain characteristics, and many factors are not related, which makes the evaluation of the risk of wind and snow-blowing disaster complex and uncertain. Therefore, in the process of railway subgrade wind and snow-blowing disaster evaluation, it is a particularly important work to accurately identify the risk factors and establish the corresponding risk evaluation indicators.
  • Environment
Site environmental conditions [4] are the basis for evaluating the severity of snowdrift disaster. Therefore, considering the characteristics of the site environment of the railway subgrade snowdrift disaster, it is subdivided into two categories: the topographic slope and vegetation cover conditions. The topographic and landform features are the comprehensive embodiment of site geological conditions, topographic fluctuation, and other characteristics, and are important factors affecting snowdrift disaster; vegetation coverage is the distribution of vegetation in the study area. If the distribution is rich, the harm of snowdrift can be effectively weakened. Generally speaking, the flatter the area and the lower the amount of vegetation coverage, the more prone the area is to snowdrift.
2.
Snowfield
Snowfield conditions [8] are the main factor affecting snowdrift disasters on railway lines. Because the snowfield conditions provide the snow source for snowdrift on the line, it is very necessary to fully grasp the regional snowfield conditions to evaluate the risk of snowdrift disaster in railway subgrade. Meanwhile, the average snow thickness, the average annual snow amount, and the duration of heavy snow in the study area reflect the environmental characteristics related to snow in the research area, which is of great significance for the research of snowdrift disaster in railway subgrade.
3.
Windfield
Windfield conditions [9] are the dynamic conditions of snowdrift. They are among the important factors in snowdrift disaster. At present, research on the windfield in railway line areas is mainly focused on the average wind speed, maximum wind speed, wind direction, and wind duration in the area. It is generally believed that when the wind speed is high enough, the phenomenon of snowdrift will occur. Then, combined with the structural form of the roadbed, it is necessary to judge whether there will be a snowdrift disaster that will affect the operation of the line. On the other hand, the direction of the wind and the roadbed also have an obvious impact on snowdrift disasters on the line.
4.
Subgrade design parameters
The design parameters of subgrade are an important factor affecting snowdrift disasters relating to railway subgrade. Cuttings are more likely to suffer from snowdrift disaster than embankments, and low embankments and deep cuttings are more likely to suffer from snowdrift disasters.

2.2. Analytic Hierarchy Process (AHP) Model

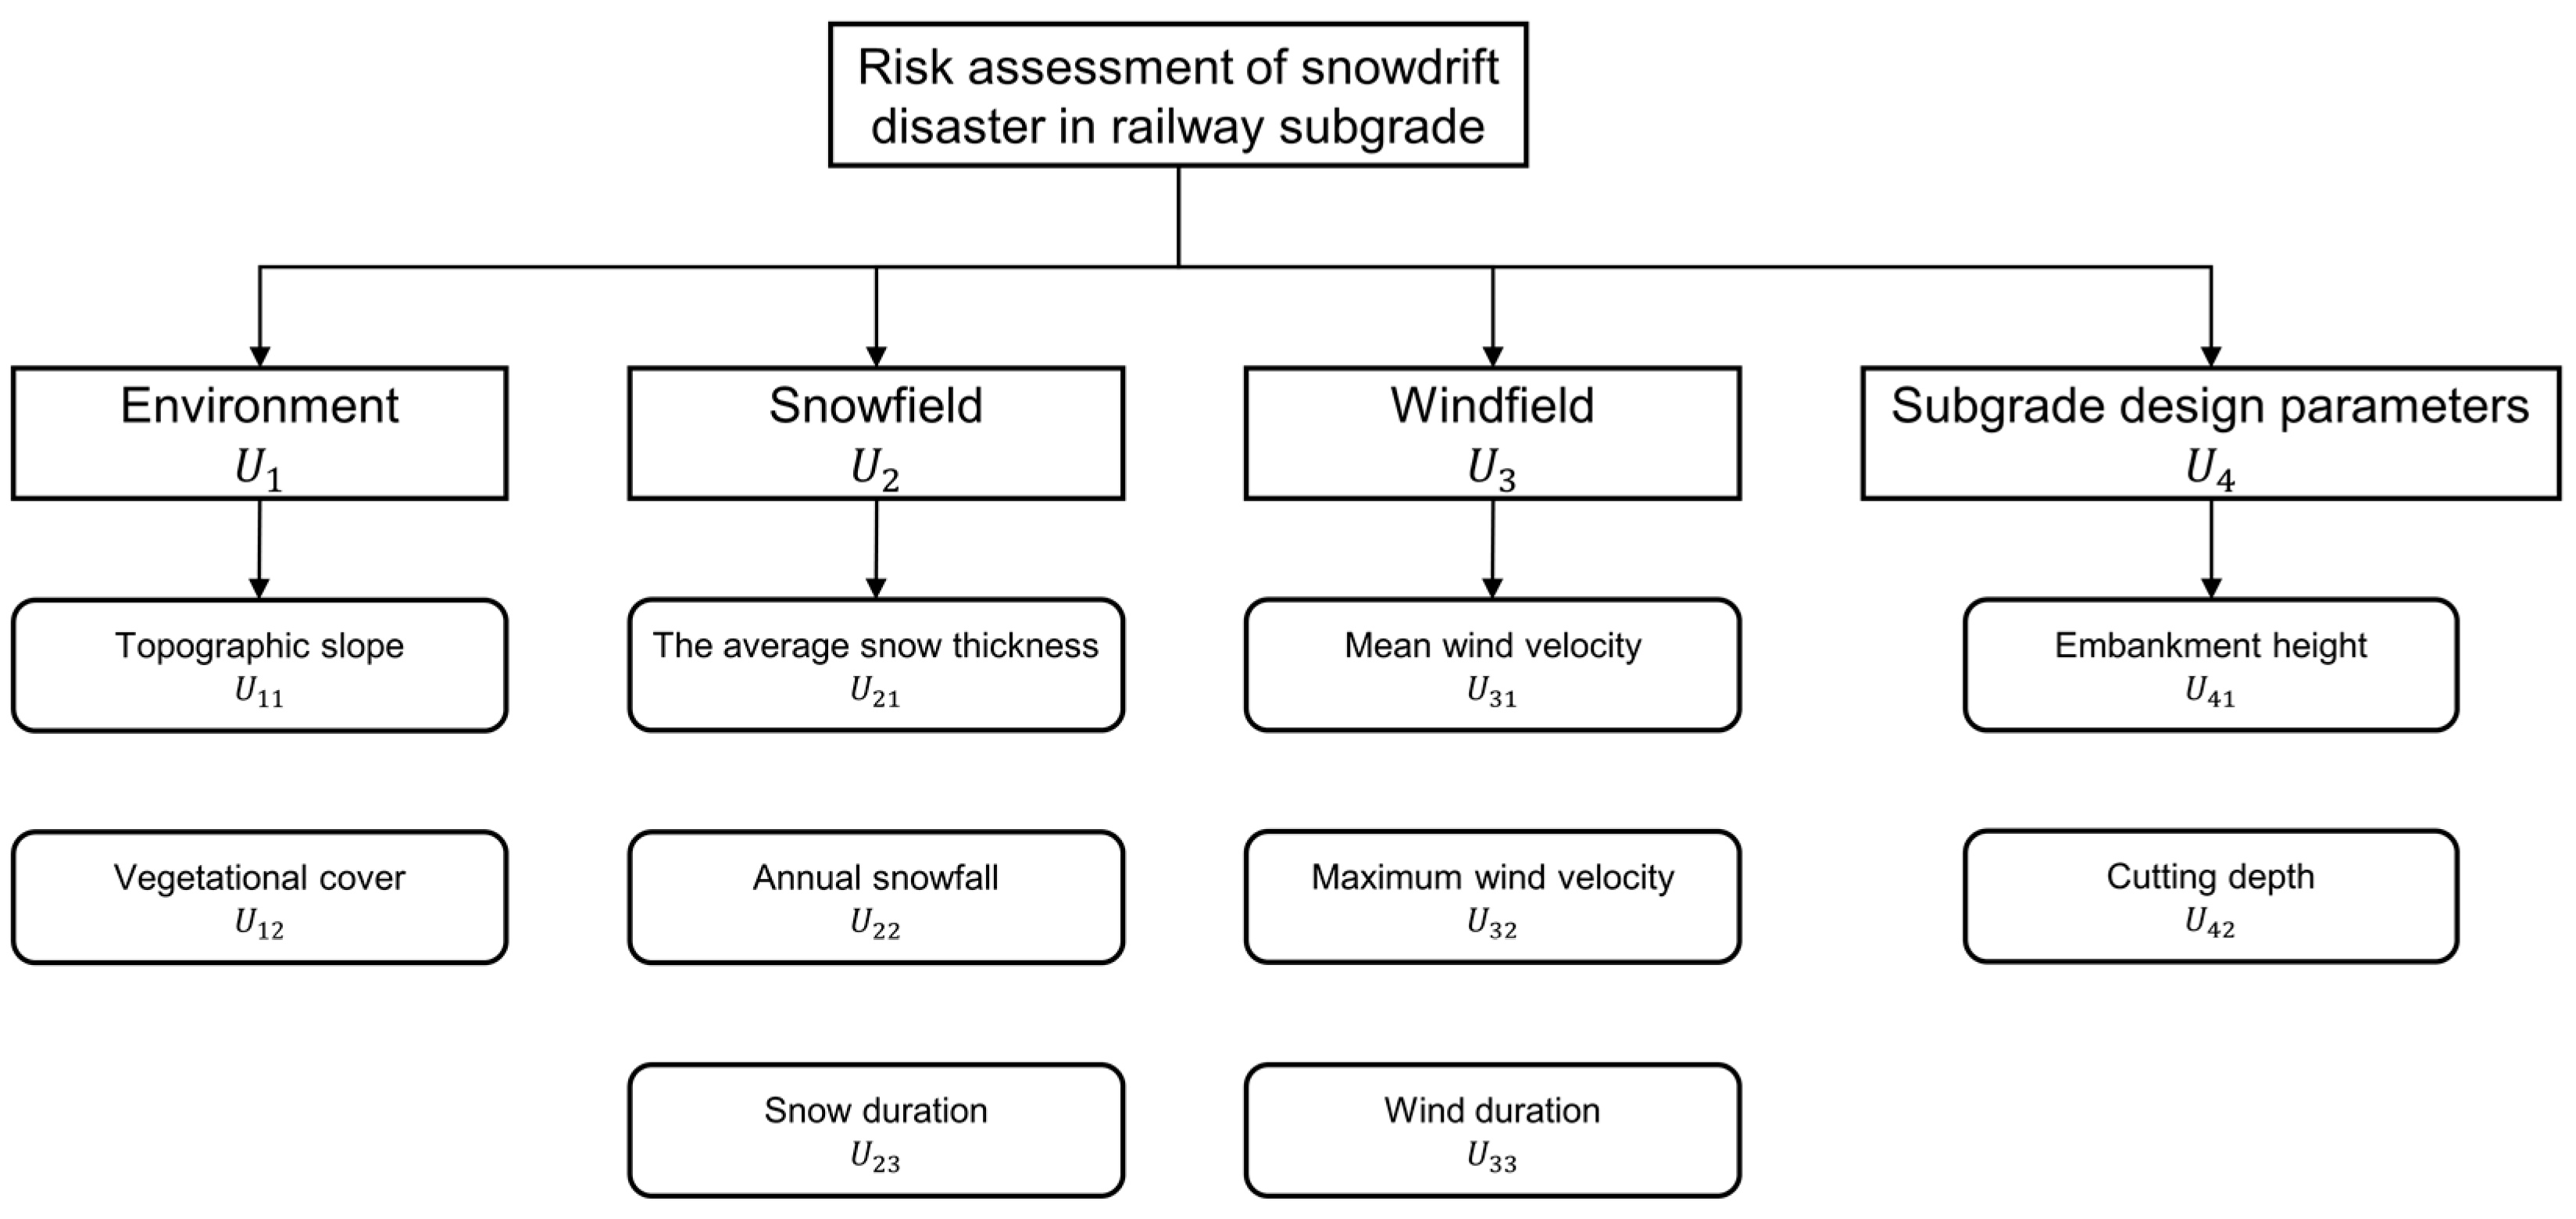
There are some different evaluation layers in the hierarchy analysis method, such as the target layer, the index layer, the scheme layer, and so on [13]. Quantitative and qualitative analysis runs throughout the evaluation process, from top to bottom. Based on the analysis of the risk factors, the hierarchical model was divided into three levels. The top layer refers to the target layer, which involves only one factor. The middle layer is the index layer, while the bottom layer is the scheme layer, which contains seven factors. In the evaluation system, A, B, and C represent different levels. At the same level, the numbers (1, 2, 3, etc.) represent different factors. Therefore, seven factors were used as assessment elements to construct a set of risk factors. A schematic representation of the hierarchical model of risk assessment is shown in Figure 2.

2.3. Establishment of the FCE Model

The FCE model establishes the process introduced in [14] based on a five-step process.
  • Step 1: Establish the factor set, U.
It can be determined that snowdrift on railway subgrades is primarily influenced by factors such as maximum wind speed, snowfall amount, average snow depth, and embankment height. Based on preliminary analysis and considering the comprehensive assessment of contributing factors to existing risk evaluations, four main indicators were ultimately selected: on-site environmental characteristics, on-site snowfield characteristics, on-site windfield characteristics, and subgrade design parameters, denoted as U1, U2, U3, and U4, respectively. Based on these main indicators, 11 secondary indicators were further divided, denoted as U1i, U2j, U3k, and U4l, corresponding to their respective main indicators. Thereby, a risk assessment system for snowdrift disasters on railway subgrades was established (Figure 2).
2.
Step 2: Establish the annotation set V
The hazard level is an index used to assess the risk level of snowdrift disasters. In order to provide a more comprehensive evaluation of the risk levels of snowdrift disasters, this paper, based on an extensive literature review and expert opinions, categorizes the hazard levels of snowdrift disasters on railway subgrades into five levels.
V = { V 1 , V 2 , V 3 , V 4 , V 5 } = { I , II , III , IV , V }
where  V  is the set of evaluation comments and  V i ( i = 1 , 2 , 3 , , l )  represents the overall evaluation of the  i -th possibility.
A level I risk grade indicates a low risk of snowdrift disasters occurring on the railway subgrade; a level II risk grade indicates a relatively low risk of snowdrift disasters; a level III risk grade indicates a moderate risk of snowdrift disasters; a level IV risk grade indicates a high risk of snowdrift disasters; and a level V risk grade indicates a very high risk of snowdrift disasters on the railway subgrade. After summarizing and generalizing the research findings of scholars at home and abroad, and combining extensive field research, expert brainstorming, experiments, and the conclusions of numerical simulations, the paper has provided the range of values for each secondary influencing factor and the indicators of these factors in Table 1.
3.
Step 3: Determine the weight vector W.
The weight of risk factors measured by the hierarchical analysis (AHP) method can be attributed to the quantitative and qualitative analysis and the quantification of the constructed hierarchical model. The evaluation exponential weight vector is determined as shown in Formulas (2)–(4).
The importance of evaluation indicator factors is represented by solving the eigenvector of the judgment matrix. This paper mainly introduces the method of calculating the eigenvector using the product method, as follows.
(1)
Normalize the column elements of the matrix
u ¯ i j = u i j i = 1 n u i j
(2)
Sum the elements of each normalized column
W ¯ i = j = 1 n u ¯ i j
(3)
Normalize the vector  W ¯ = ( W ¯ 1 , W ¯ 2 , , W ¯ n ) T  obtained from the previous step
W i = W ¯ i i = 1 n W ¯ i
Through Equations (2)–(4), the eigenvector  W = ( W 1 , W 2 , , W n ) T  of the corresponding judgment matrix, i.e., the weight value of each evaluation indicator, can be obtained.
4.
Step 4: Calculate the single-factor membership degree
Since the fuzzy statistical method requires large sample data statistics, the process is relatively complex and difficult to implement. Therefore, this paper will select an appropriate fuzzy distribution as the membership function for the evaluation index and use the fuzzy distribution method for calculation. The common ridge distribution (Figure 3) and trapezoidal distribution (Figure 4) fuzzy distributions and their graphs are shown below.
(1)
Ridge distribution.
a, right-skewed
A ( x ) = { 1 x < a 1 1 2 1 2 sin π a 2 a 1 ( x a 1 + a 2 2 ) a 1 x a 2 0 x > a 2
b, left-skewed
A ( x ) = { 0 x < a 1 1 2 + 1 2 sin π a 2 a 1 ( x a 1 + a 2 2 ) a 1 x a 2 1 x > a 2
c, symmetric
A ( x ) = { 0 x < a 2 1 2 + 1 2 sin π a 2 a 1 ( x + a 1 + a 2 2 ) a 2 x a 1 1 a 1 < x < a 1 1 2 1 2 sin π a 2 a 1 ( x a 1 + a 2 2 ) a 1 x a 2 0 x > a 2
(2)
Trapezoidal distribution.
a, right-skewed
A ( x ) = { 1 x < a b x b a a x b 0 x > b
b, left-skewed
A ( x ) = {   0 x < a x a b a a x b   1 x > b
c, symmetric
A ( x ) = {   0 x < a x a b a a x < b   1 b x < c d x d c c x < d   0 x d
5.
Step 5: Establish the fuzzy comprehensive evaluation matrix
This process requires selecting appropriate membership functions for the evaluation indicators. Generally, both quantitative and qualitative indicators are involved in slope risk assessment. For quantitative indicators, membership vectors can be obtained by constructing triangular, trapezoidal, and other membership functions for the indicators. For qualitative indicators, we employ scoring methods to quantify them, then construct membership functions and obtain corresponding membership vectors.
For the second-level evaluation indicators  U i j , the membership vectors can be represented as:
R i j = ( r i j 1 , r i j 2 , , r i j l )
For the first-level evaluation indicators  U i , the membership matrix can be represented as:
R i = [ r i 11 r i 11 r i 1 l r i 21 r i 21 r i 2 l r i n i 1 r i n i 1 r i n i l ]
For the overall risk assessment system, the membership matrix can be represented as:
R = [ R 1 R 2 R m ] = [ r 111 r 111 r 11 l r 121 r 121 r 12 l r m n m 1 r m n m 2 r m n m l ]
Performing fuzzy calculations on the membership matrix of the evaluation indicator system and the weight matrix of the indicators that have been clearly determined gives:
B = A × R = ( a i 1 , a i 2 , , a i n l ) [ r 111 r 111 r 11 l r 121 r 121 r 12 l r m n m 1 r m n m 2 r m n m l ] = ( b 1 , b 2 , , b l )
Normalization processing of the obtained comprehensive evaluation set B yields the normalized evaluation set  B ¯ = ( b ¯ 1 , b ¯ 2 , b ¯ l ) . According to the principle of maximum membership, selecting the maximum value in the fuzzy comprehensive judgment set can determine the risk level.

2.4. Determination of the Evaluation Weights

The obtained eigenvector needs to undergo a consistency test to verify whether the process of assigning indicator weights is consistent. The calculation formula is as follows:
C R = C I R I
where  C R  is the consistency ratio of the judgment matrix;  R I  is the average consistency index of the judgment matrix, which can be obtained from Table 2; and  C I  is the consistency index of the judgment matrix, calculated using Equations (6) to (8).
C I = λ max n n 1
λ max = 1 n i = 1 n ( P W ) i W i
P W = [ ( P W ) 1 ( P W ) 2 ( P W ) n ] = [ u 11 u 12 u 1 n u 21 u 22 u 2 n u n 1 u n 2 u n n ] [ W 1 W 2 W n ]
where  λ max  is the maximum eigenvalue of the judgment matrix and  ( P W ) i  is the  i -th element of the vector  P W .
When  C R  < 0.1, the judgment matrix is considered to meet the consistency requirements. Otherwise, it can be concluded that the indicator assignments of the judgment matrix do not meet the consistency requirements, and the judgment matrix needs to be adjusted until the accuracy requirements are met.

2.5. Validation of the Evaluation Results

The principle of maximum membership is the simplest and most commonly used method. The validity verification formula for maximum membership is:
a = n β 1 2 γ ( n 1 )
where  n  represents the number of elements in the expert evaluation set;
β  represents the maximum membership degree in the target evaluation vector; and  γ  represents the second largest membership degree in the target evaluation vector.
However, this method loses a lot of information, and if the second largest membership degree is very close to the maximum membership degree, the evaluation results may appear forced.
The weighted average method is a more comprehensive and accurate approach, and its formula is:
V = j = 1 n B j k · j j = 1 n B j k
where  j  represents the quantified evaluation grade,  j = ( 1 , 2 , , n ) ;
B j  represents the membership degree corresponding to each grade; and  k  is an undetermined coefficient designed to control the influence of larger  B j  values (typically  k  is 1 or 2). When  k  approaches infinity, the weighted average principle becomes the principle of maximum membership.
The V values of the different maximum membership validity as shown in Table 3.

3. Project Overview and Results

The Afu Railway is located within the Altay region of the Xinjiang Uyghur Autonomous Region. It extends in a northwest to southeast direction, crossing through Altay City, Fuhai County, and Fuyun County, spanning a distance of 146 km in total. During winter, the region faces intense cold, substantial snowfall, and strong wind disturbances, leading to intricate climatic conditions. According to local meteorological data, the maximum snow accumulation in the Altay region reaches 94 cm, with the maximum freezing depth at 180 cm. The average number of snowfall days in winter is about 40 days. The prevailing wind direction is mainly from the west, with occasional east winds. The annual average wind speed is relatively low at 2.0 m per second, but the maximum wind speed can reach up to 22.1 m per second in some local areas, and the maximum instantaneous wind speed in most areas can reach 20 m per second. The annual average number of days with winds of level eight or above is approximately 19.8 days. The Afu Railway generally runs from northwest to southeast, intersecting the prevailing wind direction at a large angle, making it prone to snowdrift disasters. The railway traverses mainly plains and low mountainous hilly areas, with varying degrees of snowdrift disaster severity along different sections. The construction of the railway has altered the local microclimate and microtopography, potentially exacerbating the risk of snowdrift disasters.
During the winters of 2017 to 2021, a comprehensive snow survey was conducted along the entire length of the railway, which was under construction at the time. The survey considered various factors such as topography, prevailing wind direction, wind speed, the degree of snowdrift hazard, and the height of subgrade filling and excavation. Key sections of the railway that are particularly susceptible to severe snowdrifts—such as shallow and deep cuttings, low embankments, and transitional sections between embankments and cuttings—were selected for representative worksites. A total of 17 monitoring sites were established to collect real-time data on wind speed, direction, and snow depth, as shown in Figure 5.
YD-ZS2 remote real-time meteorological stations were utilized to collect wind speed and direction data at a height of 3 m. Each monitoring setup includes systems for power supply, data collection, data transmission, and an Internet of Things (IOT) cloud platform. To address the issue of unstable telecommunications signals and occasional signal loss in some areas along the line, the system design incorporated breakpoint transmission technology. The monitoring period spanned from November 2017 to March 2022, with data being uploaded in real time to the Xinjiang Afu Railway Snowdrift Monitoring IoT platform.

3.1. Wind Speed and Direction Characteristics

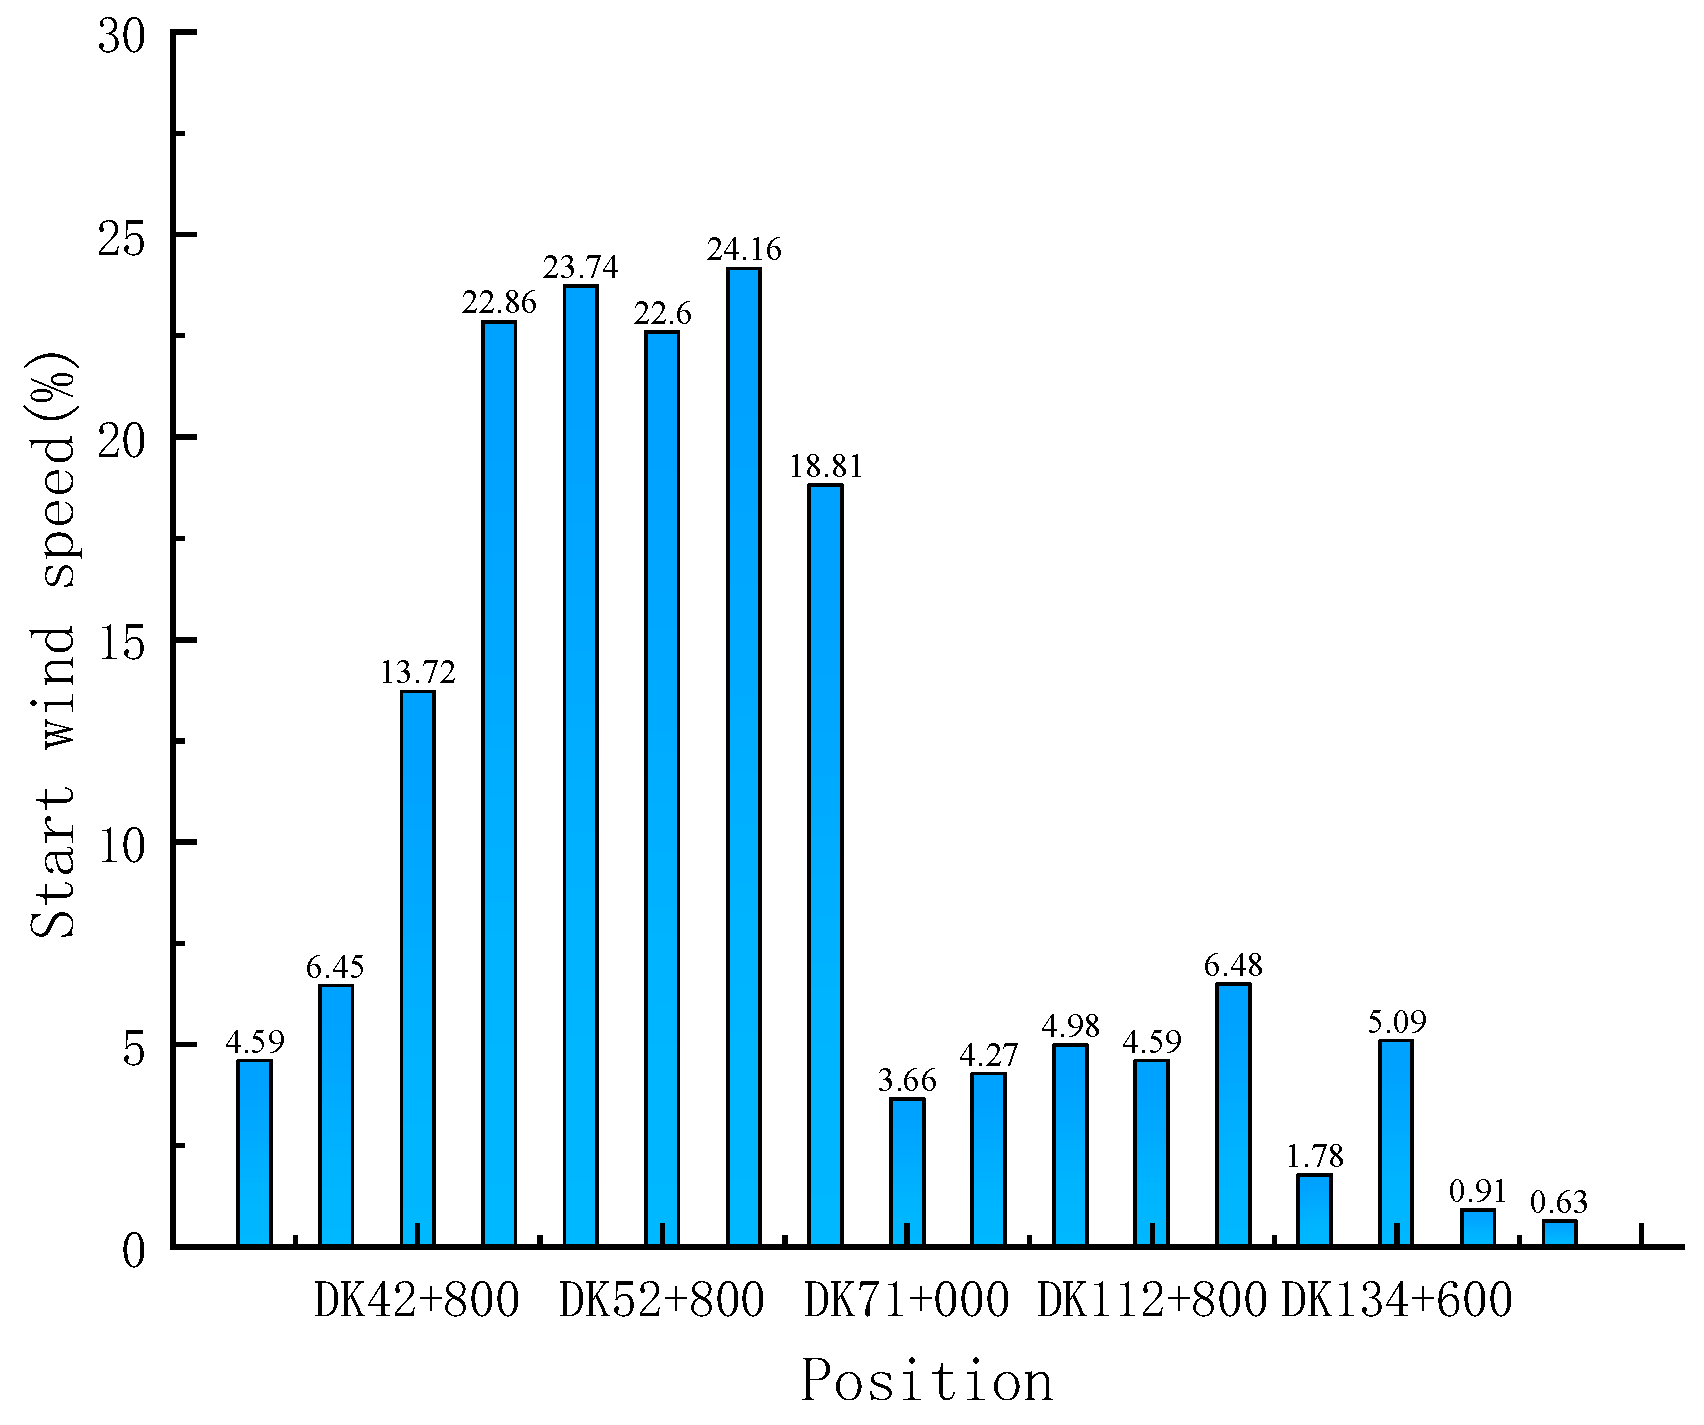
Wind is one of the critical contributing factors to the occurrence of snowdrift. Remote monitoring data indicate significant variations in wind speed and direction along the railway line. By selecting the measured wind speed values greater than the threshold wind speed of 3.3 m/s at a height of 3 m during the winter months (November to March) [19], and analyzing their frequency of occurrence as shown in Figure 6, it is determined that sections of the railway line with strong wind forces prone to snowdrift are in the region DK38 + 800 to DK67 + 600.
The monitoring equipment within this region reveals that, based on the monitored wind speed and direction data, except at DK42 + 800, where the prevailing winds are mainly from the east (E) and east-southeast (ESE), the wind at the other five meteorological stations is primarily from the north-northwest (NNW), north (N), and north-northeast (NNE), as shown in Figure 7. Given that the Afu Railway generally runs in a northwest–southeast direction, the prevailing winds form a significant angle with the railway route, which exacerbates the impact of snowdrifts.

3.2. Snow Accumulation Characteristics

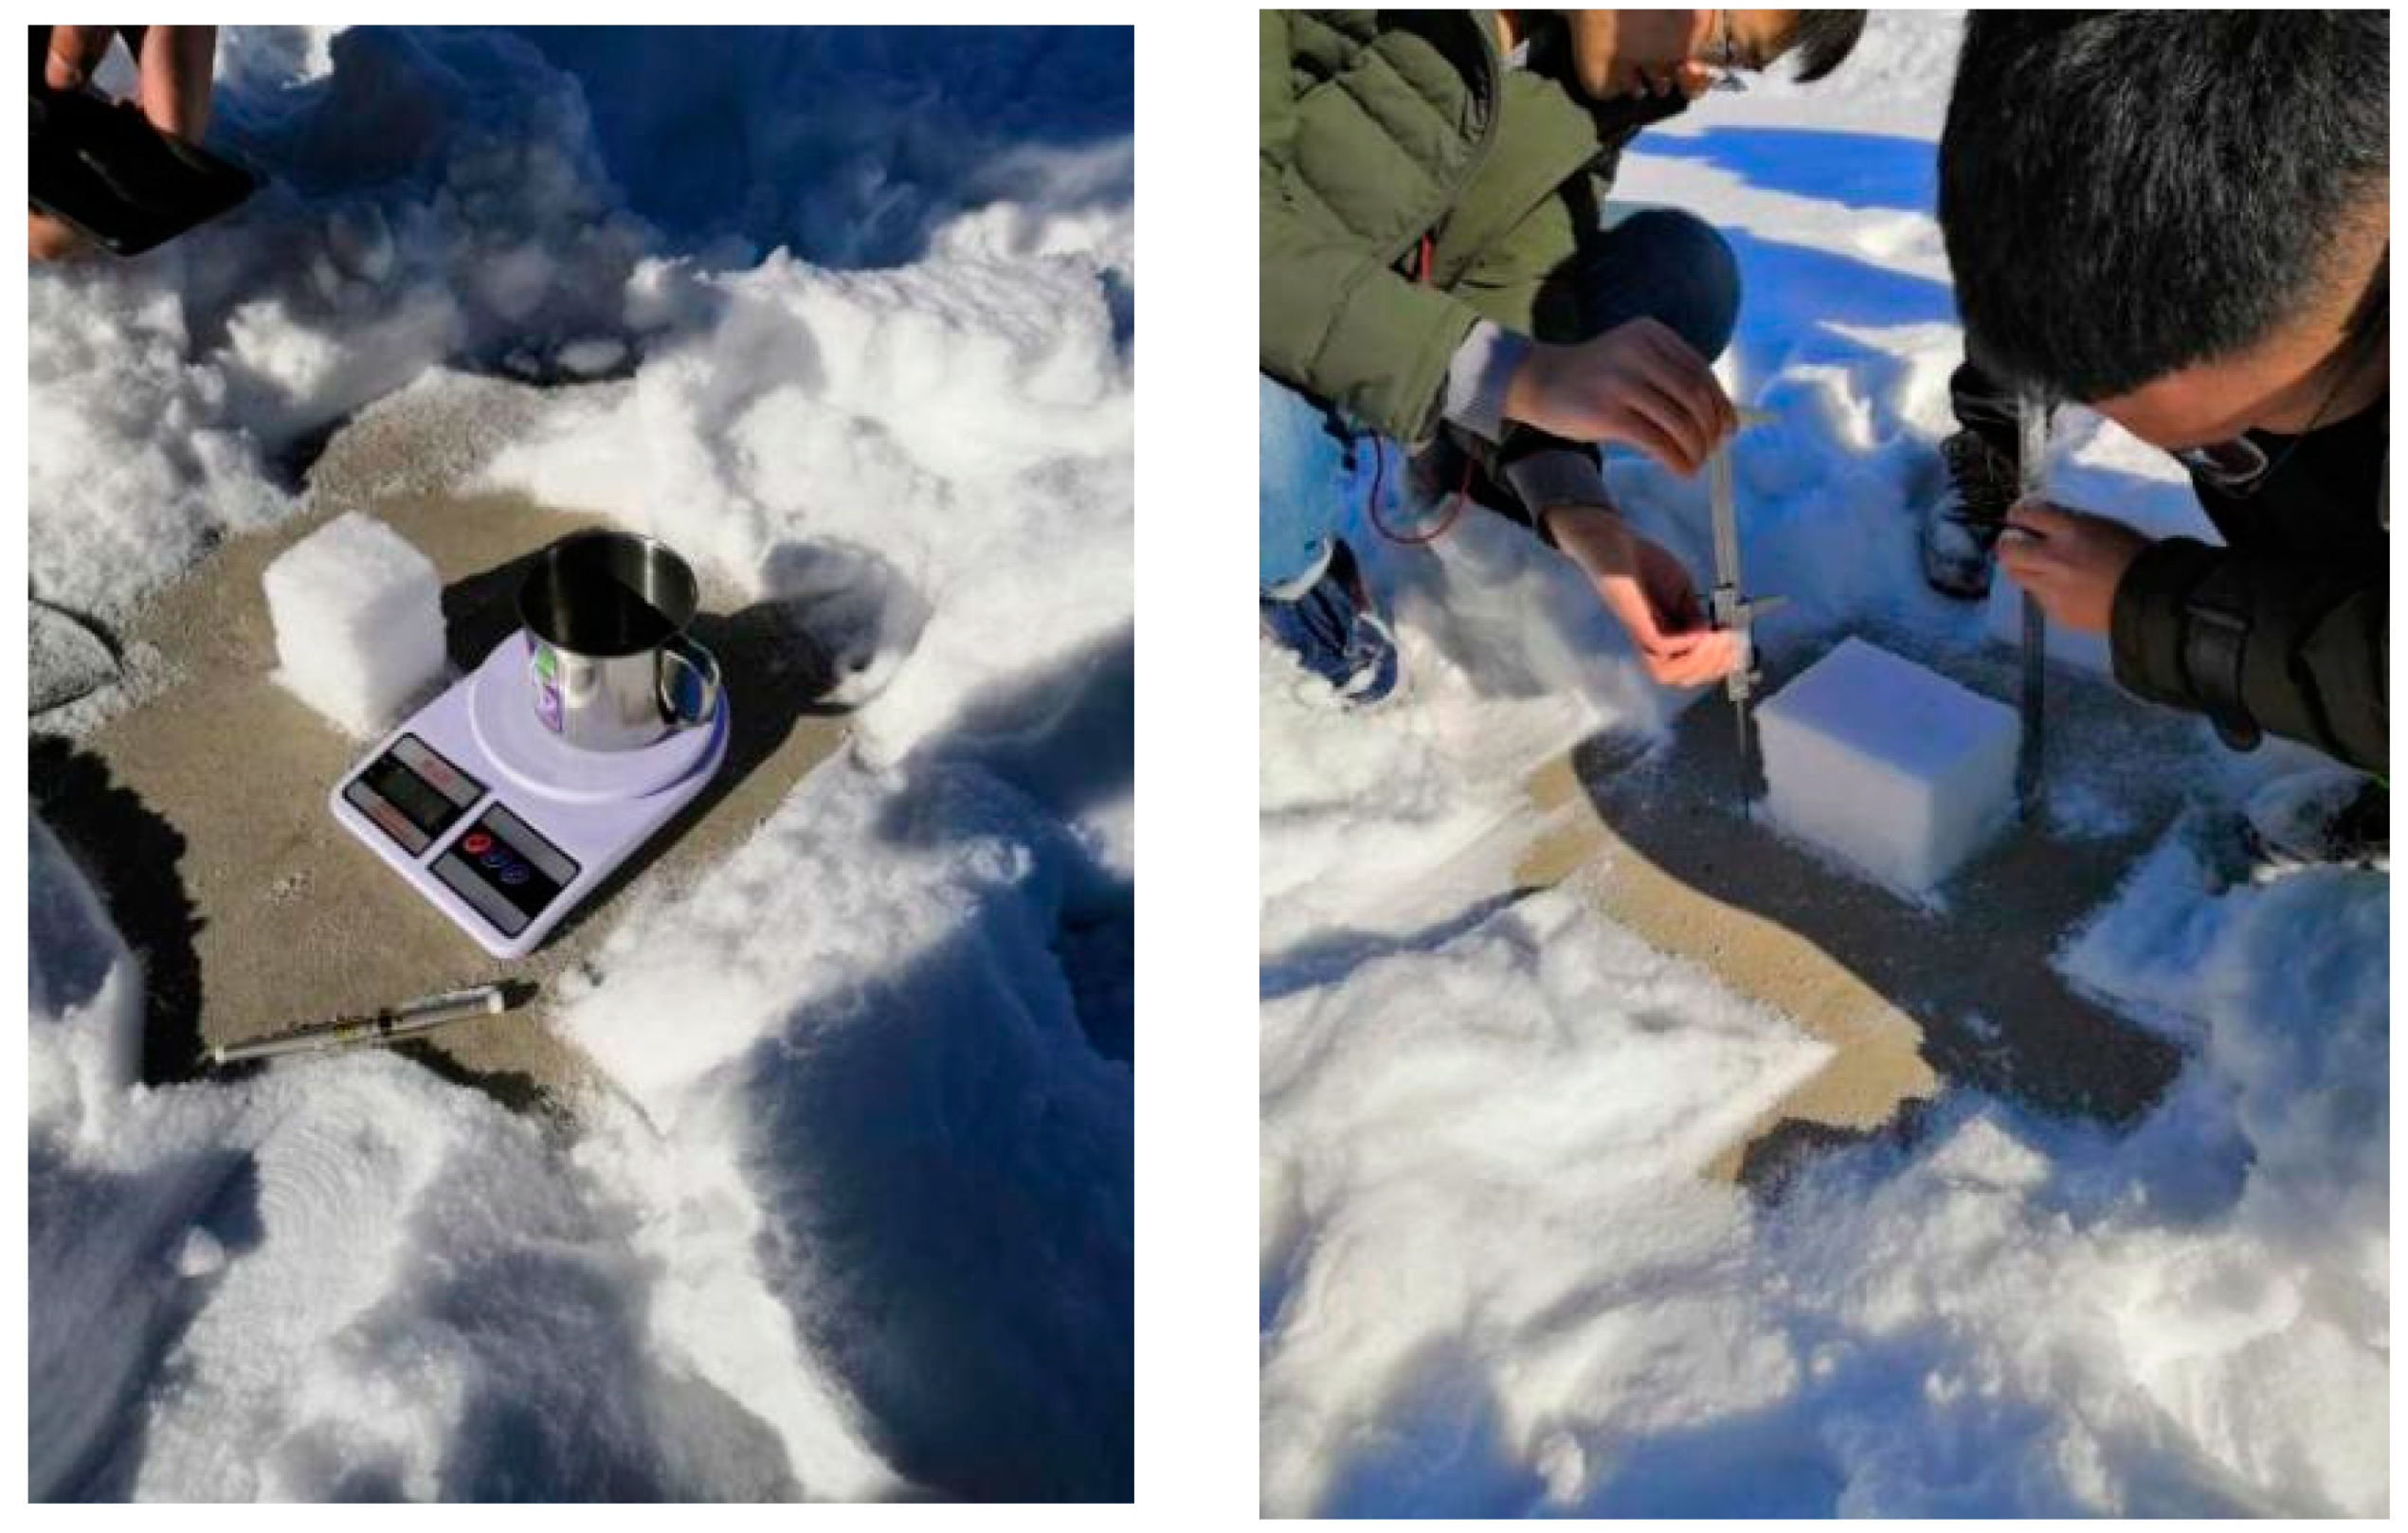
The snow accumulation density in the Tianshan Mountains during winter is categorized in the following ranges: fresh snow (dry snow) from 0.04 to 0.08 g·cm−3, fresh snow (wet snow) from 0.10 to 0.20 g·cm−3, fine-grained snow from 0.11 to 0.17 g·cm−3, medium-grained snow from 0.17 to 0.23 g·cm−3, coarse-grained snow from 0.18 to 0.24 g·cm−3, melting and freezing snow from 0.20 to 0.27 g·cm−3, and deep frost from 0.22 to 0.27 g·cm−3. Comparatively, the snow density near the Sierra Nevada range in the United States is approximately 0.17 g·cm−3, in the French Alps is about 0.30 g·cm−3, in the mountainous regions of Japan is around 0.35 g·cm−3, in Greenland is approximately 0.32 g·cm−3, and in the Arctic region is about 0.40 g·cm−3. Compared to these regions, the snow density in the Altay area is the same as that of the fresh snow in the Tianshan region, being of lower density and classified as low-density snow, which facilitates the initiation of snow particles and the formation of snowdrift. The fresh snow densities measured (Figure 8) in the project area during the winter snow surveys from 2017 to 2021 are shown in Table 4.
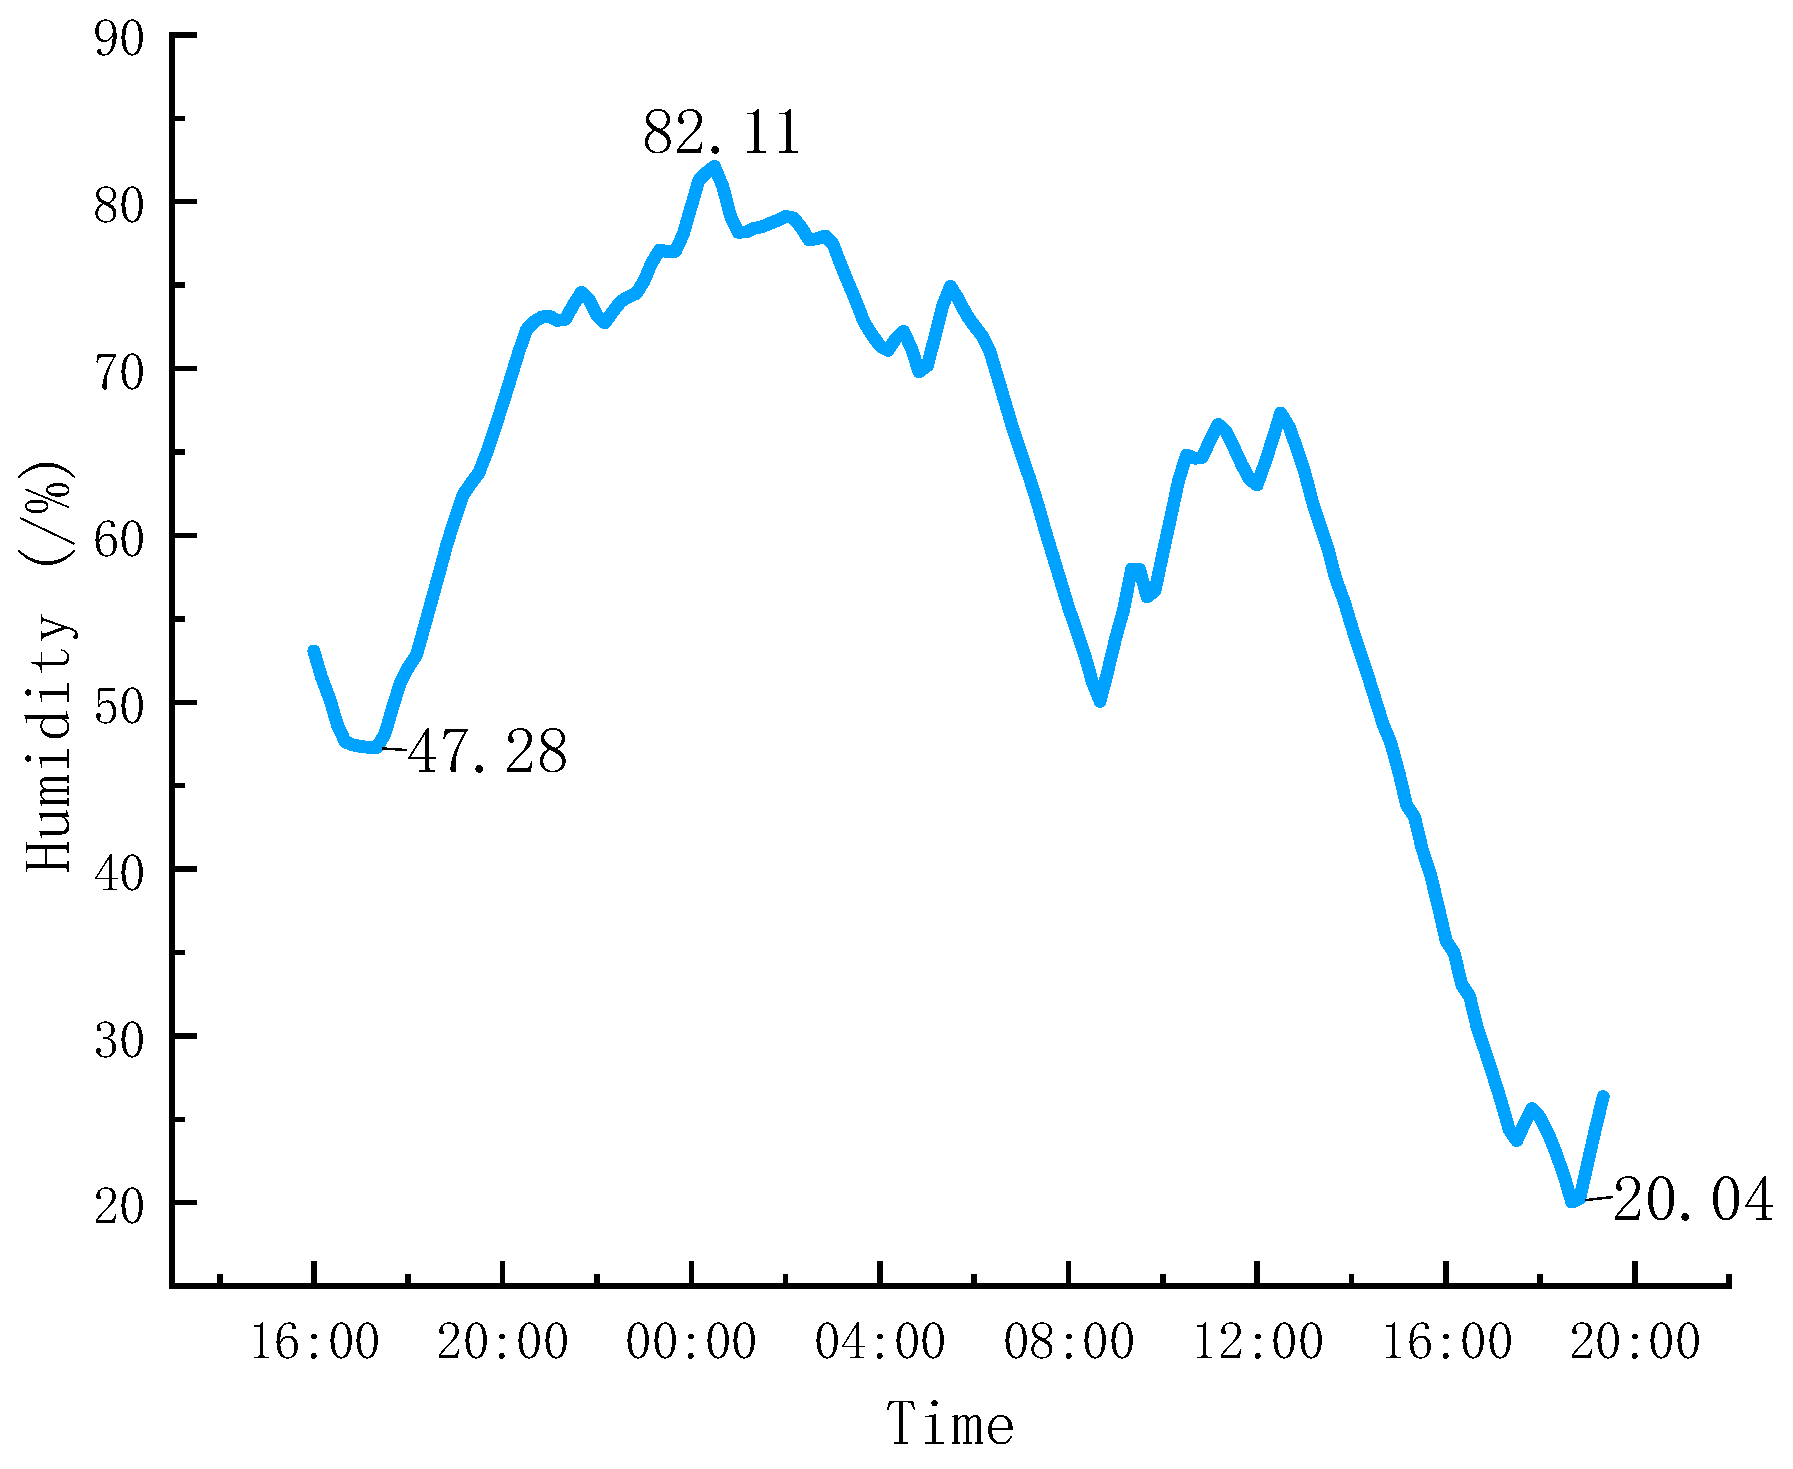
Measurements of the fresh snow density in the project area at different times have averaged 0.141 g·cm−3, which is classified as fresh snow (wet snow), a result of the higher environmental humidity during the snowfall period. For instance, on 21 January 2021, during the snowfall, the ambient temperature near the railway increased from 47.28% to 82.11%, and it dropped to 20.04% after the snowfall stopped, as shown in Figure 9

3.3. Risk Indicator Weights

To comprehensively determine the weights of the main indicators for snowdrift disasters on railway subgrades, this study invited 10 experts in the field to a group discussion to pool their collective wisdom. Based on the experts’ judgments and the rules outlined in Table 3, a comparative analysis of the importance of each first-level and second-level indicator was conducted. Ultimately, a judgment matrix for the indicators of snowdrift disasters on railway subgrades was constructed, as detailed below.
  • The judgment matrix for the first-level indicators is as follows:
    p A u i = [ 1 1 2 1 2 1 3 2 1 2 1 2 2 1 2 1 1 2 3 2 2 1 ]
2.
The judgment matrix for the second-level indicators is as follows:
p A u 1 j = [ 1 1 2 2 1 ] p A u 2 j = [ 1 2 2 1 / 2 1 1 1 / 2 1 1 ] p A u 3 j = [ 1 1 / 2 1 / 3 1 / 3 2 1 1 2 3 1 1 1 3 1 / 2 1 1 ] P A u 4 j = [ 1 1 / 3 3 1 ]
By calculating the judgment matrices for both the first-level metrics and second-level indicators, their consistency ratios (CRs) are all less than 0.1, meeting the consistency requirements (Table 5). The derived weights for each level of indicators are detailed in Figure 10.
Figure 10 indicates that among the first-level metrics, the subgrade design parameters have the greatest impact on snowdrift disasters, followed by regional snowfield conditions, while the regional windfield conditions and on-site environmental conditions have the least impact. Among the second-level indicators affecting snowdrift disasters on railway subgrades, the depth of cuttings, average snow depth, and embankment height have the greatest impact, followed by indicators such as topography, vegetation coverage, average wind speed, annual snowfall, snowfall duration, and maximum wind speed, with wind direction and wind duration having the least impact. Therefore, it is recommended that when assessing the risk of snowdrift disasters on railway subgrades, emphasis should be placed on measuring subgrade design parameters and average snow depth to make subsequent evaluation work more targeted.
In this section, the actual conditions of the Afu Railway subgrade are considered, and typical work point indicator evaluation values are selected. The constant indicators are fixed values, while the variable parameters are based on the average values from three snow seasons. At the same time, by substituting the indicators into their corresponding membership functions, the membership degree values of the snowdrift disaster risk indicators at corresponding locations of the railway subgrade can be obtained. The results are shown in Table 6, Table 7, Table 8, Table 9 and Table 10.

3.4. Risk Assessment Results

Using the fuzzy comprehensive evaluation (FCE) model, the snowdrift hazard assessment for the Afu Railway has resulted in hazard zoning as shown in the table. The high-risk sections are areas with strong wind forces and deep snow accumulation at the snow source, which meet the natural conditions for snowdrift occurrence, and the subgrade design parameters in these areas significantly exacerbate the severity of snowdrift disasters.
Through comprehensive fuzzy calculations and normalization processing of the snowdrift hazard risks for the Afu Railway, the comprehensive fuzzy judgment sets for each working condition are obtained as follows:
  • DK27 + 600 Hazardous Fuzzy Judgment Set:
    B ˜ 1 = ( 0.0497 ,   0.0410 ,   0.3749 ,   0.1740 ,   0.0947 )
    where  b ˜ i 03 = 0.3749 ; it is determined that the hazard level at DK27 + 900 is classified as Level III, indicating a moderate state of risk.
2.
DK65 + 900 Hazardous Fuzzy Judgment Set:
B ˜ 2 = ( 0.0254 ,   0.0658 ,   0.1507 ,   0.1230 ,   0.4772 )
where  b ˜ i 05 = 0.4772 ; it is determined that the hazard level at DK65 + 900 is classified as Level V, indicating a very high risk.
3.
DK135 + 200 Hazardous Fuzzy Judgment Set:
B ˜ 3 = ( 0.0497 ,   0 ,   0.4349 ,   0.1124 ,   0.261 )
where  b ˜ i 03 = 0.4349 ; it is determined that the hazard level at DK135 + 200 is classified as Level III, indicating a moderate state of risk.
4.
DK198 + 200Hazardous Fuzzy Judgment Set:
B ˜ 4 = ( 0.0497 ,   0.0082 ,   0.1023 ,   0.1570 ,   0.402 )
where  b ˜ i 05 = 0.402 ; it is determined that the hazard level at DK198 + 200 is classified as Level V, indicating a very high risk.
Validation by method described in Table 3, the maximum membership degrees of the four monitoring points are all valid (Table 11), which confirmed the accuracy of the results. The hazard levels of snowdrift disasters are as indicated above, all falling into a state of risk, with particular attention to DK65 + 900 and DK198 + 200, which are classified as Level V zones. It shows that the method is consistent with actual field measurements in comparison with on-site observations. Therefore, the hazard assessment method provided in this section is accurate and can be widely applied to the risk assessment of snowdrift disasters on railway subgrades. The areas categorized as having a high risk level require snowdrift prevention measures, such as the installation of snow fences.
Under normal circumstances, when the indicator values are the same within a certain area, the form of the subgrade structure becomes the most predominant parameter affecting the risk assessment of the subgrade. Taking the DK198 + 200 area as an example, if all parameters in this area are held constant and only the subgrade structural parameters are changed, it can be observed that when the subgrade height is below 2.5 m, the hazard level in this area is uniformly Level V. When the embankment height is between 2.5 m and 3.5 m, the hazard level in this area is uniformly Level IV. However, when the area is traversed by a cutting, regardless of the depth of the cutting, the hazard level in this area is uniformly Level V.

3.5. Accuracy Evaluation

The ROC curve is also known as the subject characteristic curve (receiver operating characteristic, ROC), which is measured by the area under the curve (area under curve, AUC). Fawcett conducted a detailed study of the ROC curve and AUC [20]. When the AUC value is less than 0.7, the model evaluation accuracy is poor, when the AUC value is between 0.7 and 0.8, the model evaluation accuracy is moderate, and when the AUC value is greater than 0.8, the model evaluation accuracy is good.
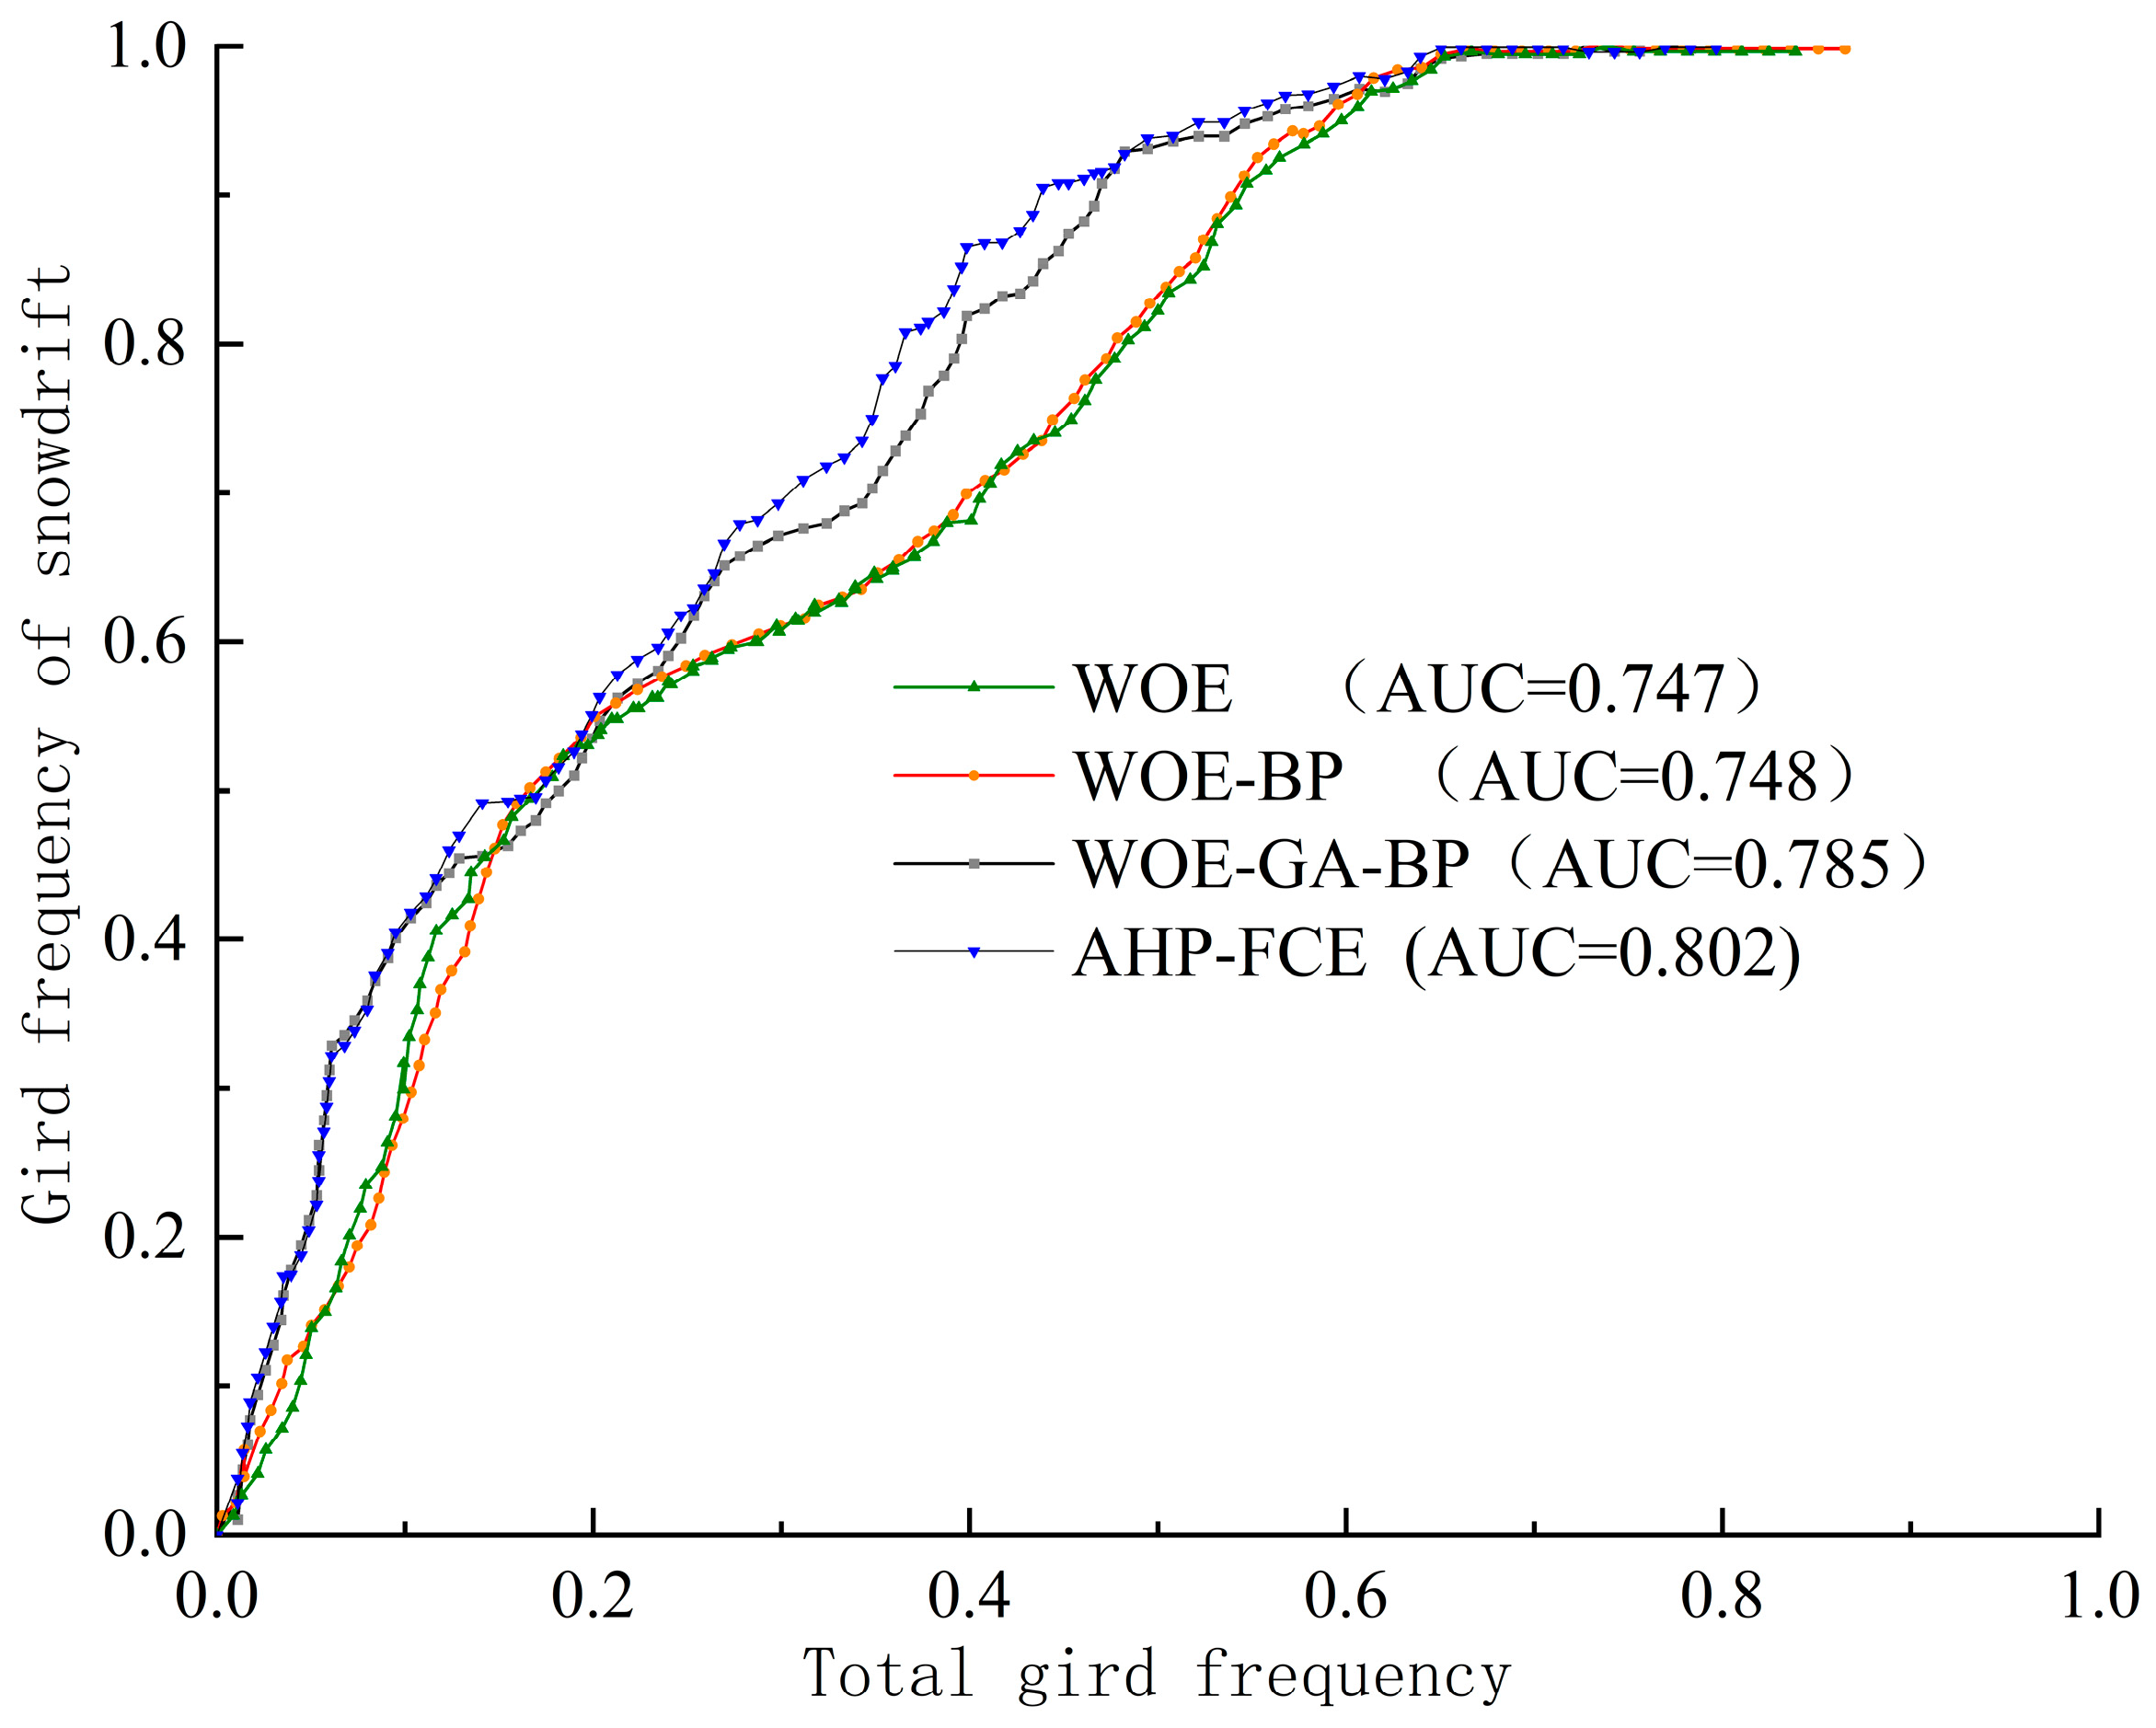
In this paper, the calculated index of snowdrift susceptibility is divided into 100 intervals from large to small, and the cumulative frequency of snowdrift, the total grid frequency of the research area, and the cumulative frequency of snowdrift is the ROC curve, and the results are compared with the calculation of He [17] on the same railway line (Figure 11).
According to the ROC curve, the AUC area of the three evaluation models used by He [9] were 0.747 (WOE), 0.748 (WOE-BP), and 0.785 (WOE-GA-BP), all of which achieved moderate evaluation accuracy. However, the corresponding AUC area of the optimized AHP-FCE model used reached 0.802, reaching a high evaluation standard.

4. Discussion

This study presents an integrated evaluation system that combines the Analytic Hierarchy Process (AHP) and fuzzy comprehensive evaluation (FCE) to assess the risk of snowdrift disasters along the Afu Railway. Our findings indicate that subgrade design parameters and regional snowfield conditions are the two primary metrics affecting snowdrift disasters, consistent with the results of a study by Sun et al. [21], which suggests that the form of subgrade structure significantly impacts the characteristics of snowdrift disasters.
Compared to earlier studies, the evaluation system in this research is more comprehensive and detailed. For instance, while Zhou et al. [22] focused primarily on the macroscopic distribution characteristics of snowdrift disasters when establishing a grading model, this study further refined the evaluation metrics and indicators, placing special emphasis on the importance of subgrade design parameters and regional snowfield conditions. Additionally, this research considers factors such as topography and vegetation coverage, which have often been insufficiently emphasized in previous studies [23,24].
The enhanced evaluation framework of this study reflects a deeper understanding of the multifaceted nature of snowdrift hazards. By incorporating a broader range of indicators, the study provides a more nuanced assessment that can better inform the development of strategies for railway subgrade design and snowdrift disaster mitigation. The acknowledgment of previously under-studied factors highlights the need for a holistic approach to risk evaluation, which this study successfully implements.
The fuzzy comprehensive evaluation (FCE) method employed in this study has demonstrated high applicability in dealing with complex issues that combine qualitative and quantitative factors, consistent with the findings of Wu Peng et al. [14]. Compared to the Multi-Indicator Comprehensive Assessment method used by Wang Ruixiang et al. [15], this study better addresses uncertainties and ambiguities in the evaluation process by introducing the concept of fuzzy mathematics [23,24]. Through fuzzy mathematical methods, this study has transformed experts’ subjective judgments into quantifiable evaluation indicators, enhancing the objectivity and accuracy of the evaluation.
Furthermore, the evaluation results of this study are in accordance with on-site actual observation results, verifying the accuracy and practicality of the evaluation method. This is similar to the research findings of Zhang [25], both confirming the effectiveness of the fuzzy comprehensive evaluation method in the risk assessment of snowdrift disasters. However, compared to the research of He [17], this study’s evaluation system is more comprehensive, considering more contributing factors, such as regional windfield characteristics and subgrade design parameters. Similarly to the research of Zhang et al. [26], the importance of comparing model results with on-site observational data is emphasized. However, this study has conducted a more rigorous examination of the validity of the evaluation results through the principle of maximum membership degree and the weighted averaging method, thereby ensuring the reliability of the evaluation results [27,28].
Despite the achievements of this study in the evaluation of the risk of snowdrift disasters, there are still limitations. The evaluation system of this study mainly relied on existing meteorological data and expert experience. Future research could consider introducing more actual measurement data and machine learning algorithms to improve the accuracy and generalization ability of the evaluation model [29]. This study mainly focuses on snowdrift disasters on railway subgrades, and the evaluation of snowdrift disasters on other transportation infrastructure is also worth further study [15,30,31]. Finally, the evaluation results need to be continuously verified and improved through long-term on-site observation. This will not only help to improve the practicality of the model but also help to discover and solve potential problems encountered in actual applications [32,33].
This study provided a more comprehensive and objective evaluation system. Compared with machine learning, the AHP-FCE method makes it easier to interpret the results, and it also provides effective decision support for managers [34,35,36]. Although our proposed method shows great potential in the evaluation of wind and snow-blowing disasters, it does have its own defects. In other words, although the application of the proposed method as an integrated weighting scheme does not necessarily depend entirely on the expert’s expertise and judgment, it is conditional and depends on the method of mathematical calculation. We found two limitations to the use of the AHP-FCE model as follows: (1) The selection of mathematical method combining subjective weight and objective weight affects the evaluation results of the susceptibility of wind and snow blowing disasters; and (2) The choice of membership function will affect the construction of the fuzzy matrix of each evaluation unit, thus affecting the calculation of the target weight. Future research could further explore and improve the evaluation system based on this study to adapt to the risk assessment needs of snowdrift disasters under different regions and conditions.

5. Conclusions

After an in-depth study and evaluation of the risk of snowdrift disasters along the Afu Railway, this research has successfully constructed a multi-level evaluation system that takes into account on-site environmental conditions, regional snowfields, regional windfields, and subgrade design parameters. Through on-site monitoring, data analysis, and model calculations, the study has clarified the weight and role of various contributing factors in snowdrift disasters, providing a scientific basis for the prevention and control of snowdrift disasters on railway subgrades.
This study ensures a more accurate assessment of the risks associated with snowdrifts, which is essential for developing effective mitigation strategies. By understanding the relative importance of different factors, authorities can prioritize measures that address the most significant risks, thereby enhancing the resilience of railway infrastructure to such natural hazards.
  • Among the factors affecting the risk of snowdrift disasters on railway subgrades, four primary contributing metrics were selected: on-site environmental conditions, regional snowfield conditions, regional windfield conditions, and subgrade design parameters. Then, 11 underlying indicators were defined, and a “5-level” evaluation system for the risk of snowdrift disasters on railway subgrades was established. Through calculations, the risk levels of snowdrift disasters along the Afu Railway line were determined.
  • In the weight distribution of the snowdrift disaster risk on railway subgrades, it was found that among the first-level metrics, regional snowfield conditions and subgrade design parameters have a significant impact on the risk of snowdrift disasters, with weights of 26.81% and 40.53%, respectively. Among the secondary indicators, the depth of cuttings and average snow depth have a considerable impact on the risk of snowdrift disasters to the railway subgrade, with weights of 29.04% and 15.09%, respectively.
  • During the evaluation process, individual indicator evaluation values from typical work points were substituted into the corresponding membership functions to obtain the membership degree values for the indicators at these work points. Subsequently, through fuzzy calculations and normalization processing, the hazard degree of each typical work point was determined. Moreover, by fixing the relevant parameters within the region according to regional characteristics and only considering changes in the form of the subgrade structure, the calculations were simplified.
  • The scientific and systematic hazard assessment method developed in this research offers foundational data and theoretical support for future studies. It provides relevant departments with a scientific basis for formulating effective countermeasures, ultimately enhancing the safety and reliability of railway operations. Additionally this assessment method serves as a valuable guide for the risk evaluation of snowdrift disasters on railways, informing the design of railway subgrades and the development of disaster prevention and mitigation strategies.

Author Contributions

Methodology, D.L. and S.Q.; Validation, M.B. and Y.Z.; Investigation, S.Q., H.X., J.F. and W.Z.; Writing—original draft, S.Q., Z.T. and H.X.; Writing—review & editing, Y.Z., H.X., Z.T. and W.Z.; Supervision, D.L. and M.B.; Project administration, S.Q. and M.B.; Funding acquisition, D.L. All authors have read and agreed to the published version of the manuscript.

Funding

This work was financially supported by the Natural Science Foundation of China Projects 42372325 and the Major Projects of Financial Science and Technology Plan of Xinjiang Production and Construction Corps (No: 2020AA002).

Institutional Review Board Statement

Not applicable.

Informed Consent Statement

Not applicable.

Data Availability Statement

Some or all of the data, models, or code that support the findings of this study are available from the corresponding author upon request.

Acknowledgments

The authors deeply appreciate the Editor and the anonymous reviewer for their useful comments, especially for the comments marked on the hard copy of the MS. The authors are most grateful for this support.

Conflicts of Interest

Authors Yufang Zhang, Jiawei Fan and Wenjiao Zhou were employed by the company Railway Engineering Research Institute, China Academy of Railway Sciences Co., Ltd. The remaining authors declare that the research was conducted in the absence of any commercial or financial relationships that could be construed as a potential conflict of interest.

References

  1. Wang, Z.; Zhang, Z. Wind blown snow zoning in China. J. Mt. Sci. 1999, 17, 312–317. [Google Scholar]
  2. Yu, X.; Liu, M.; Wang, J.; Liu, Q.; Bu, J. Statistical characteristics of the spatial distribution of wind and snow in the Xinjiang Uygur Autonomous Region. Nat. Hazards 2022, 111, 1977–2009. [Google Scholar] [CrossRef]
  3. Ding, Y.; Sun, Q.; Zhu, Q. A dynamic snow accumulation simulation approach for forecasting snow distribution over regional-scale terrain. Trans. GIS 2022, 26, 1421–1443. [Google Scholar] [CrossRef]
  4. Wang, Z. Researches on Snow Cover, Snow-drifts and Avalanches in China. J. Glaciol. Geocryol. 1988, 10, 273–278. [Google Scholar]
  5. Tachiiri, K.; Shinoda, M.; Klinkenberg, B.; Morinaga, Y. Assessing Mongolian snow disaster risk using livestock and satellite data. J. Arid. Environ. 2008, 72, 2251–2263. [Google Scholar] [CrossRef]
  6. Park, H.; Lee, S.J.; Yu, I.; Jeong, S.; Chung, G. Snow disaster risk index in the Ulsan Metropolitan City. J. Korean Soc. Hazard Mitig. 2014, 14, 97–106. [Google Scholar] [CrossRef]
  7. Marković, M.; Lukić, S.; Baumgertel, A. Sensitivity analysis of roads to snowdrifts in the autonomous province Vojvodina area, republic of Serbia. Environ. Eng. Manag. J. 2023, 22, 779–790. [Google Scholar] [CrossRef]
  8. Liao, X.; Huang, K.; Song, D.; Wen, H.; Ling, S.; Wu, X. Distribution characteristics of snow and evaluation of snowdrift susceptibility along the Xinku section of Yining-Aksu Railway in China. Cold Reg. Sci. Technol. 2024, 217, 104020. [Google Scholar] [CrossRef]
  9. Koc, K.; Ekmekcioğlu, Ö.; Özger, M. An integrated framework for the comprehensive evaluation of low impact development strategies. J. Environ. Manag. 2021, 294, 113023. [Google Scholar] [CrossRef]
  10. Wang, X.; Lv, S.; Quan, J. The evolution of cooperation in the Prisoner’s Dilemma and the Snowdrift game based on Particle Swarm Optimization. Phys. A Stat. Mech. Appl. 2017, 482, 286–295. [Google Scholar] [CrossRef]
  11. Li, S.; Feng, X.; Zuo, W. Research on fuzzy comprehensive evaluation for regional dangerousdegree of snow disaster in Nagqu of Tibet. J. Nat. Disasters 2001, 1, 86–91. [Google Scholar] [CrossRef]
  12. Liu, X.; Chen, Q.; Liang, T.; Guo, Z.; Chai, Q. Establishment of snow disaster remote sensing monitoring and damage estimation systems in Altai pastoral region of Xinjiang. Chin. J. Appl. Ecol. 2006, 17, 215–220. [Google Scholar] [CrossRef]
  13. Han, S.; Guo, W.; Ke, C.; Zhao, J.; Ma, D. Comprehensive assessment of snow disaster risk in Northeast China. High-Tech Commun. 2020, 30, 91–100. [Google Scholar]
  14. Wu, P.; Chen, F.; Liu, J.; Ma, L.; Liu, L.; Hu, Z. Evaluation of highway wind and snow blowing risk based on fuzzy comprehensive evaluation method. J. Saf. Environ. 2017, 17, 2273–2276. [Google Scholar] [CrossRef]
  15. Wang, R.; Wei, J.; Liu, J.; Yan, Z.; Liu, Q. Blowing snow characteristics and risk assessment of the Yiwu-Mulei section of Beijing-Xinjiang Expressway. J. Glaciol. Geocryol. 2023, 45, 1314–1326. [Google Scholar]
  16. Li, P.; Bai, M.; Li, J.; Qiu, S.; Wei, Z. Analysis of the influence of snow fences on snow redistribution under snow-drifting in railway cuttings. Cold Reg. Sci. Technol. 2022, 196, 103520. [Google Scholar] [CrossRef]
  17. He, B.; Bai, M.; Liu, B.; Li, P.; Qiu, S.; Li, X.; Ding, L. Evaluation of Drifting Snow Susceptibility Based on GIS and GA-BP Algorithms. ISPRS Int. J. Geo-Inf. 2022, 11, 142. [Google Scholar] [CrossRef]
  18. Gao, W.D.; Liu, M.Z.; Wei, W.S.; Xu, G. The occurrence and mitigation of drifting snow and avalanche hazard in the mountains along the Jinghe-Yining railway, Tianshan, China. J. Mt. Sci. 2005, 23, 43–52. [Google Scholar] [CrossRef]
  19. Qiu, S.; Bai, M.; Jiang, H.; Li, P.; Wei, Z.; Li, X. Field Measurements and Numerical Simulation of Snowdrift on Railway Subgrade. J. Test. Eval. 2022, 50, 2988–3000. [Google Scholar] [CrossRef]
  20. Fawcett, T. An introduction to ROC analysis. Pattern Recognit. Lett. 2006, 27, 861–874. [Google Scholar] [CrossRef]
  21. Sun, Y. Evaluation of wind and snow blowing characteristics and their hazard zones in Keta Railway. Subgrade Work. 2022, 1, 25–30. [Google Scholar] [CrossRef]
  22. Zhou, Z.; Jiala; Xiao, T. Study on a grade evaluation method for snow disaster in Tibet. J. Glaciol. Geocryol. 2016, 38, 1560–1567. [Google Scholar]
  23. Li, T.; Sun, Y.; Chen, X.; Yu, H. Hazard assessment of snow disaster in Hebei province based on GIS. Henan Sci. 2018, 36, 1099–1104. [Google Scholar]
  24. Wang, X.; Lu, X.; Ma, Y.; Wang, X. Study on snow disaster assessment method and snow disaster regionalization in Xinjiang. J. Glaciol. Geocryol. 2019, 41, 836–844. [Google Scholar]
  25. Zhang, X.; Luo, H.; Zeng, X.; Zhou, C.; Shu, Z.; Li, H.; Fei, Z.; Liu, G. Research on regional economic development and natural disaster risk assessment under the goal of carbon peak and carbon neutrality: A case study in Chengdu-Chongqing economic circle. Land Use Policy 2024, 143, 107206. [Google Scholar] [CrossRef]
  26. Zhang, W.; He, J.; Chen, A.; Wu, X.; Shen, Y. Observations of Drifting Snow Using FlowCapt Sensors in the Southern Altai Mountains, Central Asia. Water 2022, 14, 845. [Google Scholar] [CrossRef]
  27. Ohara, N.; Kavvas, M.L. Field observations and numerical model experiments for the snowmelt process at a field site. Adv. Water Resour. 2006, 29, 194–211. [Google Scholar] [CrossRef]
  28. Zhong, C.; Yang, Q.; Liang, J.; Ma, H. Fuzzy comprehensive evaluation with AHP and entropy methods and health risk assessment of groundwater in Yinchuan Basin, northwest China. Environ. Res. 2022, 204, 111956. [Google Scholar] [CrossRef]
  29. Zhu, C.; Zhang, J.; Liu, Y.; Ma, D.; Li, M.; Xiang, B. Comparison of GA-BP and PSO-BP neural network models with initial BP model for rainfall-induced landslides risk assessment in regional scale: A case study in Sichuan, China. Nat. Hazards 2020, 100, 173–204. [Google Scholar] [CrossRef]
  30. Jin, Y.; Zhang, Q.; Yin, Z.; Zhang, B.; Liu, M.; Zhang, G.; Fan, F. Experiments on snowdrifts around two adjacent cube models based on a combined snow-wind facility. Cold Reg. Sci. Technol. 2022, 198, 103536. [Google Scholar] [CrossRef]
  31. Rafique, A.; Dasti, M.Y.S.; Ullah, B.; Awwad, F.A.; Ismail, E.A.A.; Saqib, Z.A. Snow Avalanche Hazard Mapping Using a GIS-Based AHP Approach: A Case of Glaciers in Northern Pakistan from 2012 to 2022. Remote Sens. 2023, 15, 5375. [Google Scholar] [CrossRef]
  32. Saigger, M.; Sauter, T.; Schmid, C.; Collier, E.; Goger, B.; Kaser, G.; Prinz, R.; Voordendag, A.; Mölg, T. A drifting and blowing snow scheme in the weather research and forecasting model. J. Adv. Model. Earth Syst. 2024, 16, e2023MS004007. [Google Scholar] [CrossRef]
  33. Xie, Z.; Hu, Z.; Ma, Y.; Sun, G.; Gu, L.; Liu, S.; Wang, Y.; Zheng, H.; Ma, W. Modeling Blowing Snow over the Tibetan Plateau with the Community Land Model: Method and Preliminary evaluation. J. Geophys. Res. Atmos. 2019, 124, 9332–9355. [Google Scholar] [CrossRef]
  34. Foglietta, C.; Panzieri, S. CISIApro Critical Infrastructures Modeling Technique for an Effective Decision Making Support. Cyber-Phys. Threat. Intell. Crit. Infrastruct. Secur. 2020, 385–396. [Google Scholar] [CrossRef]
  35. Atrigna, M.; Buonanno, A.; Carli, R.; Cavone, G.; Scarabaggio, P.; Valenti, M.; Graditi, G.; Dotoli, M. A Machine Learning Approach to Fault Prediction of Power Distribution Grids Under Heatwaves. IEEE Trans. Ind. Appl. 2023, 59, 4835–4845. [Google Scholar] [CrossRef]
  36. Cavone, G.; van den Boom, T.; Blenkers, L.; Dotoli, M.; Seatzu, C.; De Schutter, B. An MPC-Based Rescheduling Algorithm for Disruptions and Disturbances in Large-Scale Railway Networks. IEEE Trans. Autom. Sci. Eng. 2022, 19, 99–112. [Google Scholar] [CrossRef]
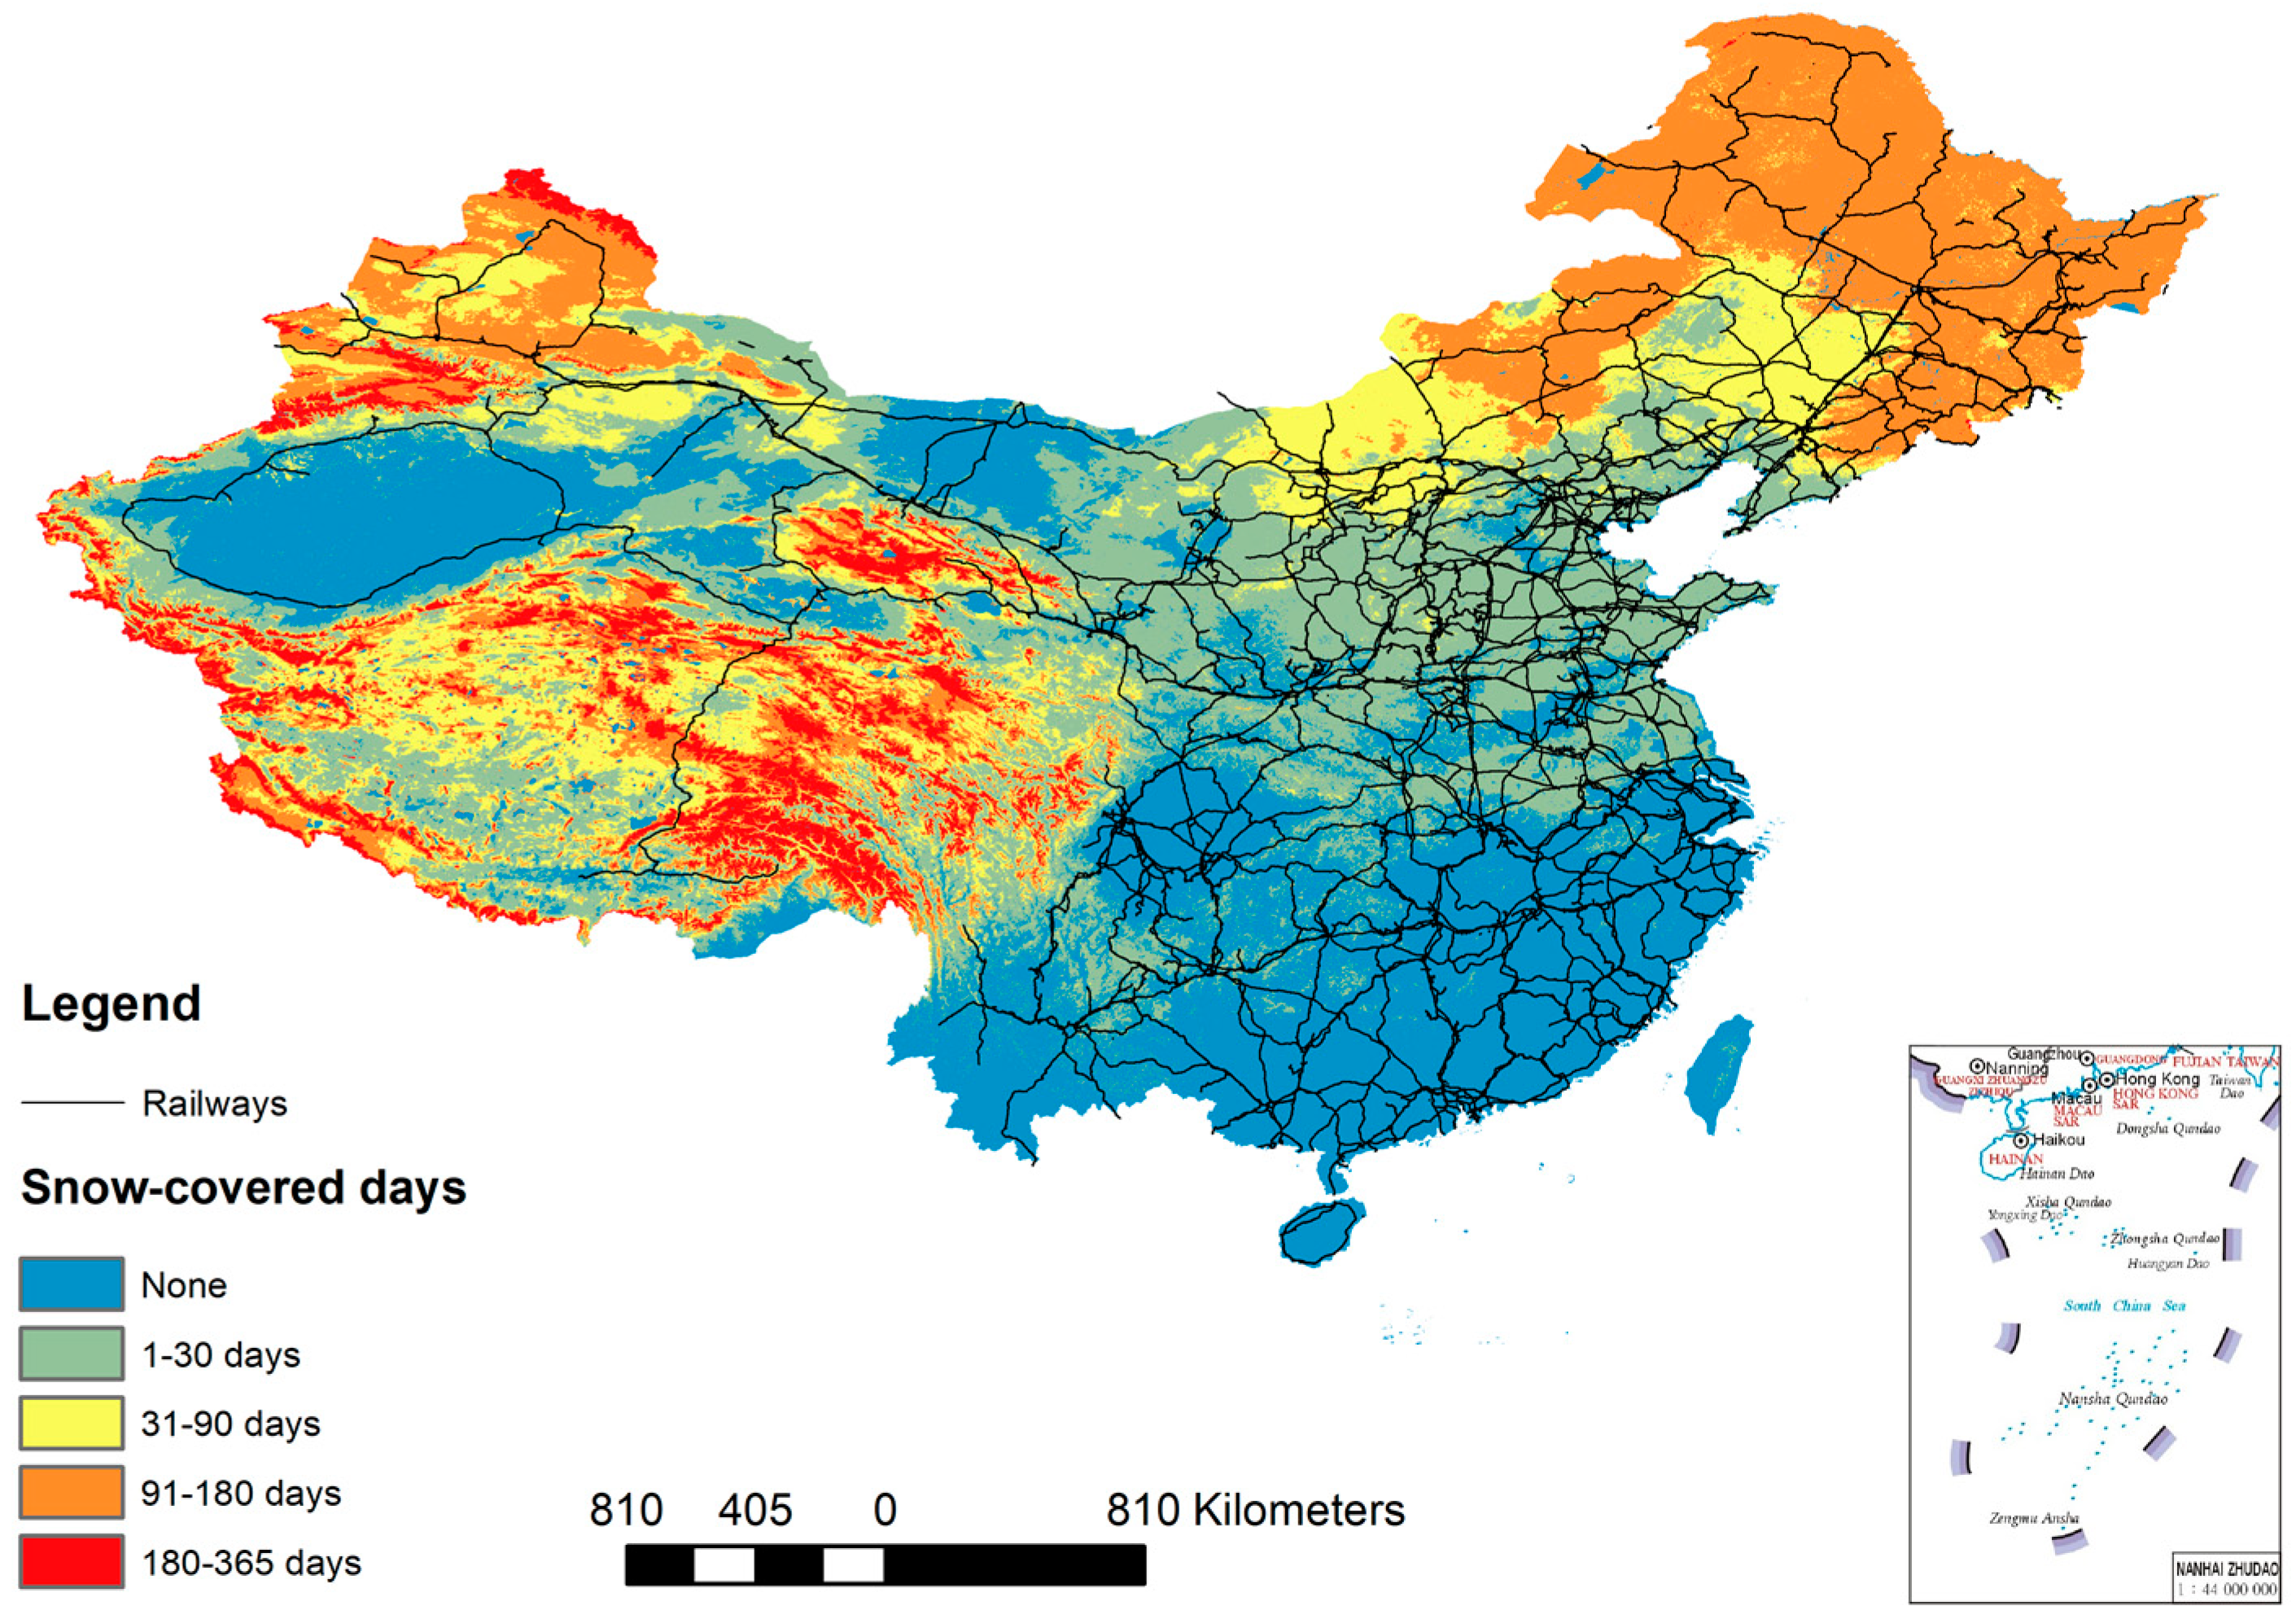
Figure 1. Map of days of snow cover on railways.
Applsci 14 07247 g001
Figure 2. Analytic Hierarchy Process (AHP) model.
Applsci 14 07247 g002
Figure 3. Ridge distribution or semi-ridge distribution. (a) right-skewed; (b) left-skewed; (c) symmetric.
Applsci 14 07247 g003
Figure 4. Trapezoidal distribution or semi-trapezoidal distribution. (a) right-skewed; (b) left-skewed; (c) symmetric.
Applsci 14 07247 g004
Figure 5. Monitoring sites and test section areas of weather stations.
Applsci 14 07247 g005
Figure 6. Winter wind speed distribution along the railway.
Applsci 14 07247 g006
Figure 7. Rose wind map of each monitoring point.
Applsci 14 07247 g007
Figure 8. Measurement of snow density.
Applsci 14 07247 g008
Figure 9. Humidity changes during snowfall along the railway.
Applsci 14 07247 g009
Figure 10. Indicator weights. (a) Level 1 index weight; (b) Level 2 index weight.
Applsci 14 07247 g010
Figure 11. ROC curve.
Applsci 14 07247 g011
Table 1. Risk assessment standard system for snowdrift disasters.
Primary
Indicators
Secondary
Indicators
Risk Assessment Criteria
Level ILevel IILevel IIILevel IVLevel V
Environment
(U1)
Topographic slope (U11)Flat Gentle hillAverage hillSteep hillMountainous area
Vegetational cover (U12)DenseModerateMediumThinNo vegetation
Snowfield
(U2)
The average snow thickness/cm
(U21)
H < 1010 ≤ H < 2020 ≤ H < 3030 ≤ H < 40H ≥ 40
Annual snowfall/mm (U22)a < 200200 ≤ a < 400400 ≤ a < 800800 ≤ a < 1200a ≥ 1200
Snow duration/h (U23)T < 66 ≤ T < 1212 ≤ T < 1818 ≤ T < 24T ≥ 24
Windfield
(U3)
Wind direction (U31)Parallel with the lineAngle to the lineAngle to the lineAngle to the lineAngle to the line
Mean wind velocity/m/s (U32)V < 11 ≤ V < 22 ≤ V < 33 ≤ V < 4V ≥ 4
Maximum wind velocity/m/s (U33)Vm < 33 ≤ Vm < 55 ≤ Vm < 77 ≤ Vm < 9Vm ≥ 9
Wind duration/h (U34)T < 66 ≤ T < 1212 ≤ T < 1818 ≤ T < 24T ≥ 24
Subgrade design parameters
(U4)
Embankment height/m (U41)h ≥ 54 ≤ h < 53 ≤ h < 42 ≤ h < 3h < 2
Cutting depth/m (U42)h ≥ 87 ≤ h < 85 ≤ h < 73 ≤ h < 5h < 3
Table 2. RI value table.
n123456789
R I 000.580.901.121.241.321.411.45
Table 3. The effectiveness table of the maximum membership principle.
VEffectiveness of the Maximum Membership Principle
+∞Complete response
[1,+∞)Very effective
[0.5,1)Effective
[0,0.5)Low efficiency
0Completely invalid
Table 4. New snow density in Aletai-Fuyun section of railway.
TimeNew Snow Density/(g·cm−3)
13 November 20170.133
15 December 20180.143
26 February 20190.146
21 December 20190.151
19 November 20200.138
21 January 20210.136
Table 5. Consistency ratio of judgment matrix.
LevelThe First LevelThe Second Level
PuPu1Pu2Pu3Pu4
CR0.0080000.052
Table 6. Evaluation index of typical work points.
Evaluating Indicator Index Evaluation Value
DK27 + 600DK65 + 900DK135 + 200DK198 + 200
Qualitative indicatorsTopographic slope (U11)55555555
Vegetational cover (U12)0000
Wind direction (U31)75806585
The average snow thickness (U21)25506545
Quantitative indicatorsAnnual snowfall (U22)1148114811481148
Snow duration (U23)14.616.214.29.4
Mean wind velocity (U32)2.11.72.53.2
Maximum wind velocity (U33)8.77.510.213.5
Wind duration (U34)2.45.23.47.2
Embankment height (U41)3.1001.4
Cutting depth (U42)01.55.80
Table 7. Indicator membership of DK27 + 900.
IndexIndex Membership
IIIIIIIVV
Topographic slope (U11)00100
Vegetational cover (U12)00001
Wind direction (U31)00100
The average snow thickness (U21)00010
Annual snowfall (U22)000.50270.49720
Snow duration (U23)01000
Mean wind velocity (U32)00.49660.503400
Maximum wind velocity (U33)0000.49310.5068
Wind duration (U34)10000
Embankment height (U41)000.50340.49650
Cutting depth (U42)00000
Table 8. Indicator membership of DK65 + 900.
IndexIndex Membership
IIIIIIIVV
Topographic slope (U11)00100
Vegetational cover (U12)00001
Wind direction (U31)00001
The average snow thickness (U21)00010
Annual snowfall (U22)000.49180.50820
Snow duration (U23)01000
Mean wind velocity (U32)00.51020.489700
Maximum wind velocity (U33)000.48860.51140
Wind duration (U34)0.51090.4891000
Embankment height (U41)00000
Cutting depth (U42)00001
Table 9. Indicator membership of DK135 + 200.
IndexIndex Membership
IIIIIIIVV
Topographic slope (U11)00100
Vegetational cover (U12)00001
Wind direction (U31)00001
The average snow thickness (U21)00010
Annual snowfall (U22)000.50550.49450
Snow duration (U23)00010
Mean wind velocity (U32)00100
Maximum wind velocity (U33)00001
Wind duration (U34)10000
Embankment height (U41)00000
Cutting depth (U42)00100
Table 10. Indicator membership of DK198 + 200.
IndexIndex Membership
IIIIIIIVV
Topographic slope (U11)00100
Vegetational cover (U12)00001
Wind direction (U31)00001
The average snow thickness (U21)00010
Annual snowfall (U22)00010
Snow duration (U23)00.49580.504100
Mean wind velocity (U32)000.49310.50690
Maximum wind velocity (U33)00001
Wind duration (U34)10000
Embankment height (U41)00001
Cutting depth (U42)00000
Table 11. Maximum membership degree validity.
PositionMaximum MembershipThe Second Largest Membership DegreenαEffectiveness
DK27 + 6000.37490.174050.63Effective
DK65 + 9000.47720.150751.15Very effective
DK135 + 2000.43490.26150.56Effective
DK198 + 2000.4020.15750.80Effective
Disclaimer/Publisher’s Note: The statements, opinions and data contained in all publications are solely those of the individual author(s) and contributor(s) and not of MDPI and/or the editor(s). MDPI and/or the editor(s) disclaim responsibility for any injury to people or property resulting from any ideas, methods, instructions or products referred to in the content.