Article

Bench-Scale Gasification of Olive Cake in a Bubbling Fluidized Bed Reactor

by
Gabriel Blázquez
,
Mónica Calero
,
Ángela Gálvez-Pérez
,
María Ángeles Martín-Lara
* and
Antonio Pérez
Department of Chemical Engineering, University of Granada, 18071 Granada, Spain
*
Author to whom correspondence should be addressed.
Appl. Sci. 2024, 14(16), 7282; https://doi.org/10.3390/app14167282
Submission received: 4 July 2024 / Revised: 31 July 2024 / Accepted: 18 August 2024 / Published: 19 August 2024
(This article belongs to the Section Energy Science and Technology)

Abstract

:
The gasification of olive cake is a promising method for converting this material into valuable energy. This work offers interesting results about the effect of equivalence ratio and temperature on the composition and quality of the produced gas obtained during olive cake gasification in a fluidized bed plant with air as a gasification agent. Additionally, the efficiency of the gasification process was evaluated. The results show that, for a specific temperature, an equivalence ratio of 0.3 showed a higher cold gas efficiency. For example, at 850 °C and an equivalence ratio of 0.1, the cold gas efficiency was 22.7%; however, at the same temperature but at an equivalence ratio of 0.3, the cold gas efficiency was increased to 61.2%. In addition, for a constant equivalence ratio, by increasing the operating temperature, there was no significant increase in the lower heating value of the exit gas, and the gas flow was practically constant with temperature, but it varied substantially with the equivalence ratio, reaching values in the range of 3.44–14.89 NL/min (825.6–3573.6 NL/kg feed). Finally, the production of CO, H2, and CH4 is estimated to be higher for tests conducted with an equivalence ratio of 0.3.

1. Introduction

Olive oil production is a significant industry in many Mediterranean countries, with Spain, Italy, and Greece being the largest producers [1]. This region’s unique climate and soil conditions are ideal for cultivating olive trees, making the olive oil industry a cornerstone of their agricultural sector. The process of producing olive oil involves several stages, including the crushing and pressing of olives to extract the oil, which results in a byproduct known as olive cake. In modern agricultural and industrial contexts, olive cake is increasingly viewed as a valuable byproduct rather than waste. It contains a substantial amount of lignocellulosic material, making it a valuable resource for generating renewable energy. One of the promising methods for utilizing this byproduct is through gasification technology.
The gasification process is a thermochemical conversion method that transforms solid biomass and residues at high temperatures (for common gasification technologies, including fixed bed gasifiers and fluidized bed gasifiers, this is 800–1000 °C) in the presence of a gasifying agent. This process converts the solid material into a versatile product gas, which can be utilized for direct heat and power generation or further upgraded into green gases or liquid fuels. Gasification is particularly appealing because it offers a sustainable way to manage agricultural waste while producing clean energy [2,3,4,5]. Other thermochemical processes, such as pyrolysis and combustion, also play significant roles in biomass conversion. Pyrolysis involves heating biomass in the absence of oxygen to produce bio-oil, biochar, and syngas, while combustion directly burns biomass to generate heat and power. Each process has its own advantages and limitations, but gasification is particularly appealing for its efficiency in producing high-value products and its potential to reduce environmental impact.
Several gasification technologies have been developed for processing olive cake, including fixed bed gasification, fluidized bed gasification, and entrained flow gasification [3,4,6,7,8]. Each of these technologies has its own set of advantages and challenges, varying in terms of cost, scalability, and efficiency. Fixed bed gasification is known for its simplicity and lower capital costs but can suffer from lower efficiency and scalability issues. Fluidized bed gasification offers better mixing and heat transfer, making it more efficient, though it is more complex and costly due to the high capital investment required for equipment and the significant operating costs associated with maintenance and energy consumption. Entrained flow gasification, on the other hand, operates at higher temperatures and can handle a wider range of feedstocks but requires significant investment and precise control.
Experimental studies on the gasification of olive cake have yielded promising results, indicating that gasification is a sustainable and economically viable method for energy conversion. These studies highlight the potential of olive cake as a renewable energy source, contributing to energy sustainability in the olive oil industry. Moreover, the adoption of gasification technologies can help mitigate environmental impacts by reducing the reliance on fossil fuels and lowering greenhouse gas emissions [3,6,8,9,10,11,12,13,14,15]. For example, Gálvez-Pérez et al. [3] focused on the effects of torrefaction and prior hydrothermal treatment on the air gasification of olive cake at low temperatures (between 625 and 700 °C), finding that higher CO, CH4, and H2 yields and cold gas efficiencies were achieved at specific conditions, with notable differences between raw, hydrolyzed, and torrefied samples. Dogru and Erdem [6], utilizing a 500 kg/h autothermal modified updraft gasifier, found that the syngas generation rate is approximately 2.5 Nm3 per kg of olive pomace, with a calorific value ranging from 5.0 to 7.0 MJ/Nm3, and that the gasification system converted over 85% of the carbon in the pomace into syngas. Tezer et al. [8] also investigated the gasification of dried olive pomace using various fixed bed gasifier systems. Syngas produced with dry air had H2 contents of 48 mol % and 45 mol % in updraft and downdraft gasifiers, respectively, with a heating value of around 12.4 MJ/Nm3. This paper presents these findings as part of a larger research project focused on hydrogen production from fixed bed reactors. On the other hand, Tamosiunas et al. [9] explored olive byproducts for energy recovery through thermal arc plasma gasification. Experiments varied parameters such as biomass flow, water vapor, and plasma power. The resulting syngas had CO (41.17 mol %), H2 (13.06 mol %), and CO2 (13.48 mol %), with a heating value of 6.09 MJ/Nm3. The work of Vera et al. [10] evaluated a pilot plant that converts these byproducts into electrical and thermal power. The plant, featuring a downdraft gasifier and a modified engine, achieved a cold gas efficiency of 70.7–75.5% and calorific values of 4.8–5.4 MJ/kg, with a payback period of 5–6 years, highlighting the potential for effective energy recovery from olive waste. Another study [11] performed the tecno-economic assessment of a combined heat and power (CHP) plant using syngas from dry olive pomace. The work modeled the plant in ASPEN Plus, using real data for calibration and performance metrics. Borello et al. [12] also presented a thermodynamic model of a combined heat and power (CHP) plant using syngas from dry olive pomace gasification. ChemCad software modeled the gasification process, with experimental data informing the model. The study of Puig-Gamero et al. [13] assessed how dolomite affects the co-gasification of coal, petcoke, and olive pomace. Results showed that dolomite improves reactivity, reduces weight loss, and enhances the H2/CO ratio while lowering sulfur and nitrogen emissions. The study of Sert et al. [14] explored hydrogen production from olive pomace using a batch autoclave at temperatures between 300 °C and 600 °C and pressures ranging from 200 to 425 atm. The effects of different catalysts were also examined. Hydrogen production increased with temperature and decreased with pressure. The highest hydrogen yield of 16.80 mol/kg biomass was achieved at 600 °C with a KOH catalyst. Finally, Cardoso et al. [15] presented a 2-D simulation of olive pomace gasification in a bubbling fluidized bed reactor, validated with experimental data. The authors found that the process has a low cold gas efficiency (~20%), and it is more suitable for small-scale domestic cogeneration rather than large facilities.
The purpose of this work is to explore the impact of equivalence ratio and temperature on the gasification process of olive cake in a fluidized bed plant, using air as the gasifying agent. By conducting experiments in a bench-scale plant, this research aims to simulate a more realistic pre-industrial scale, providing valuable insights into the optimization of gasification conditions. The focus on olive cake contributes to the development of sustainable practices within the olive oil industry. Through this work, we hope to advance the understanding and application of gasification technology, promoting a circular economy and enhancing the sustainability of Mediterranean agriculture.

2. Materials and Methods

2.1. Olive Cake

A local olive oil factory sited in Jaén, Spain, provided the olive cake used in this investigation, with an average particle diameter of 0.96 mm. A summary of the main properties of the olive cake used in this study is reported in Table 1.

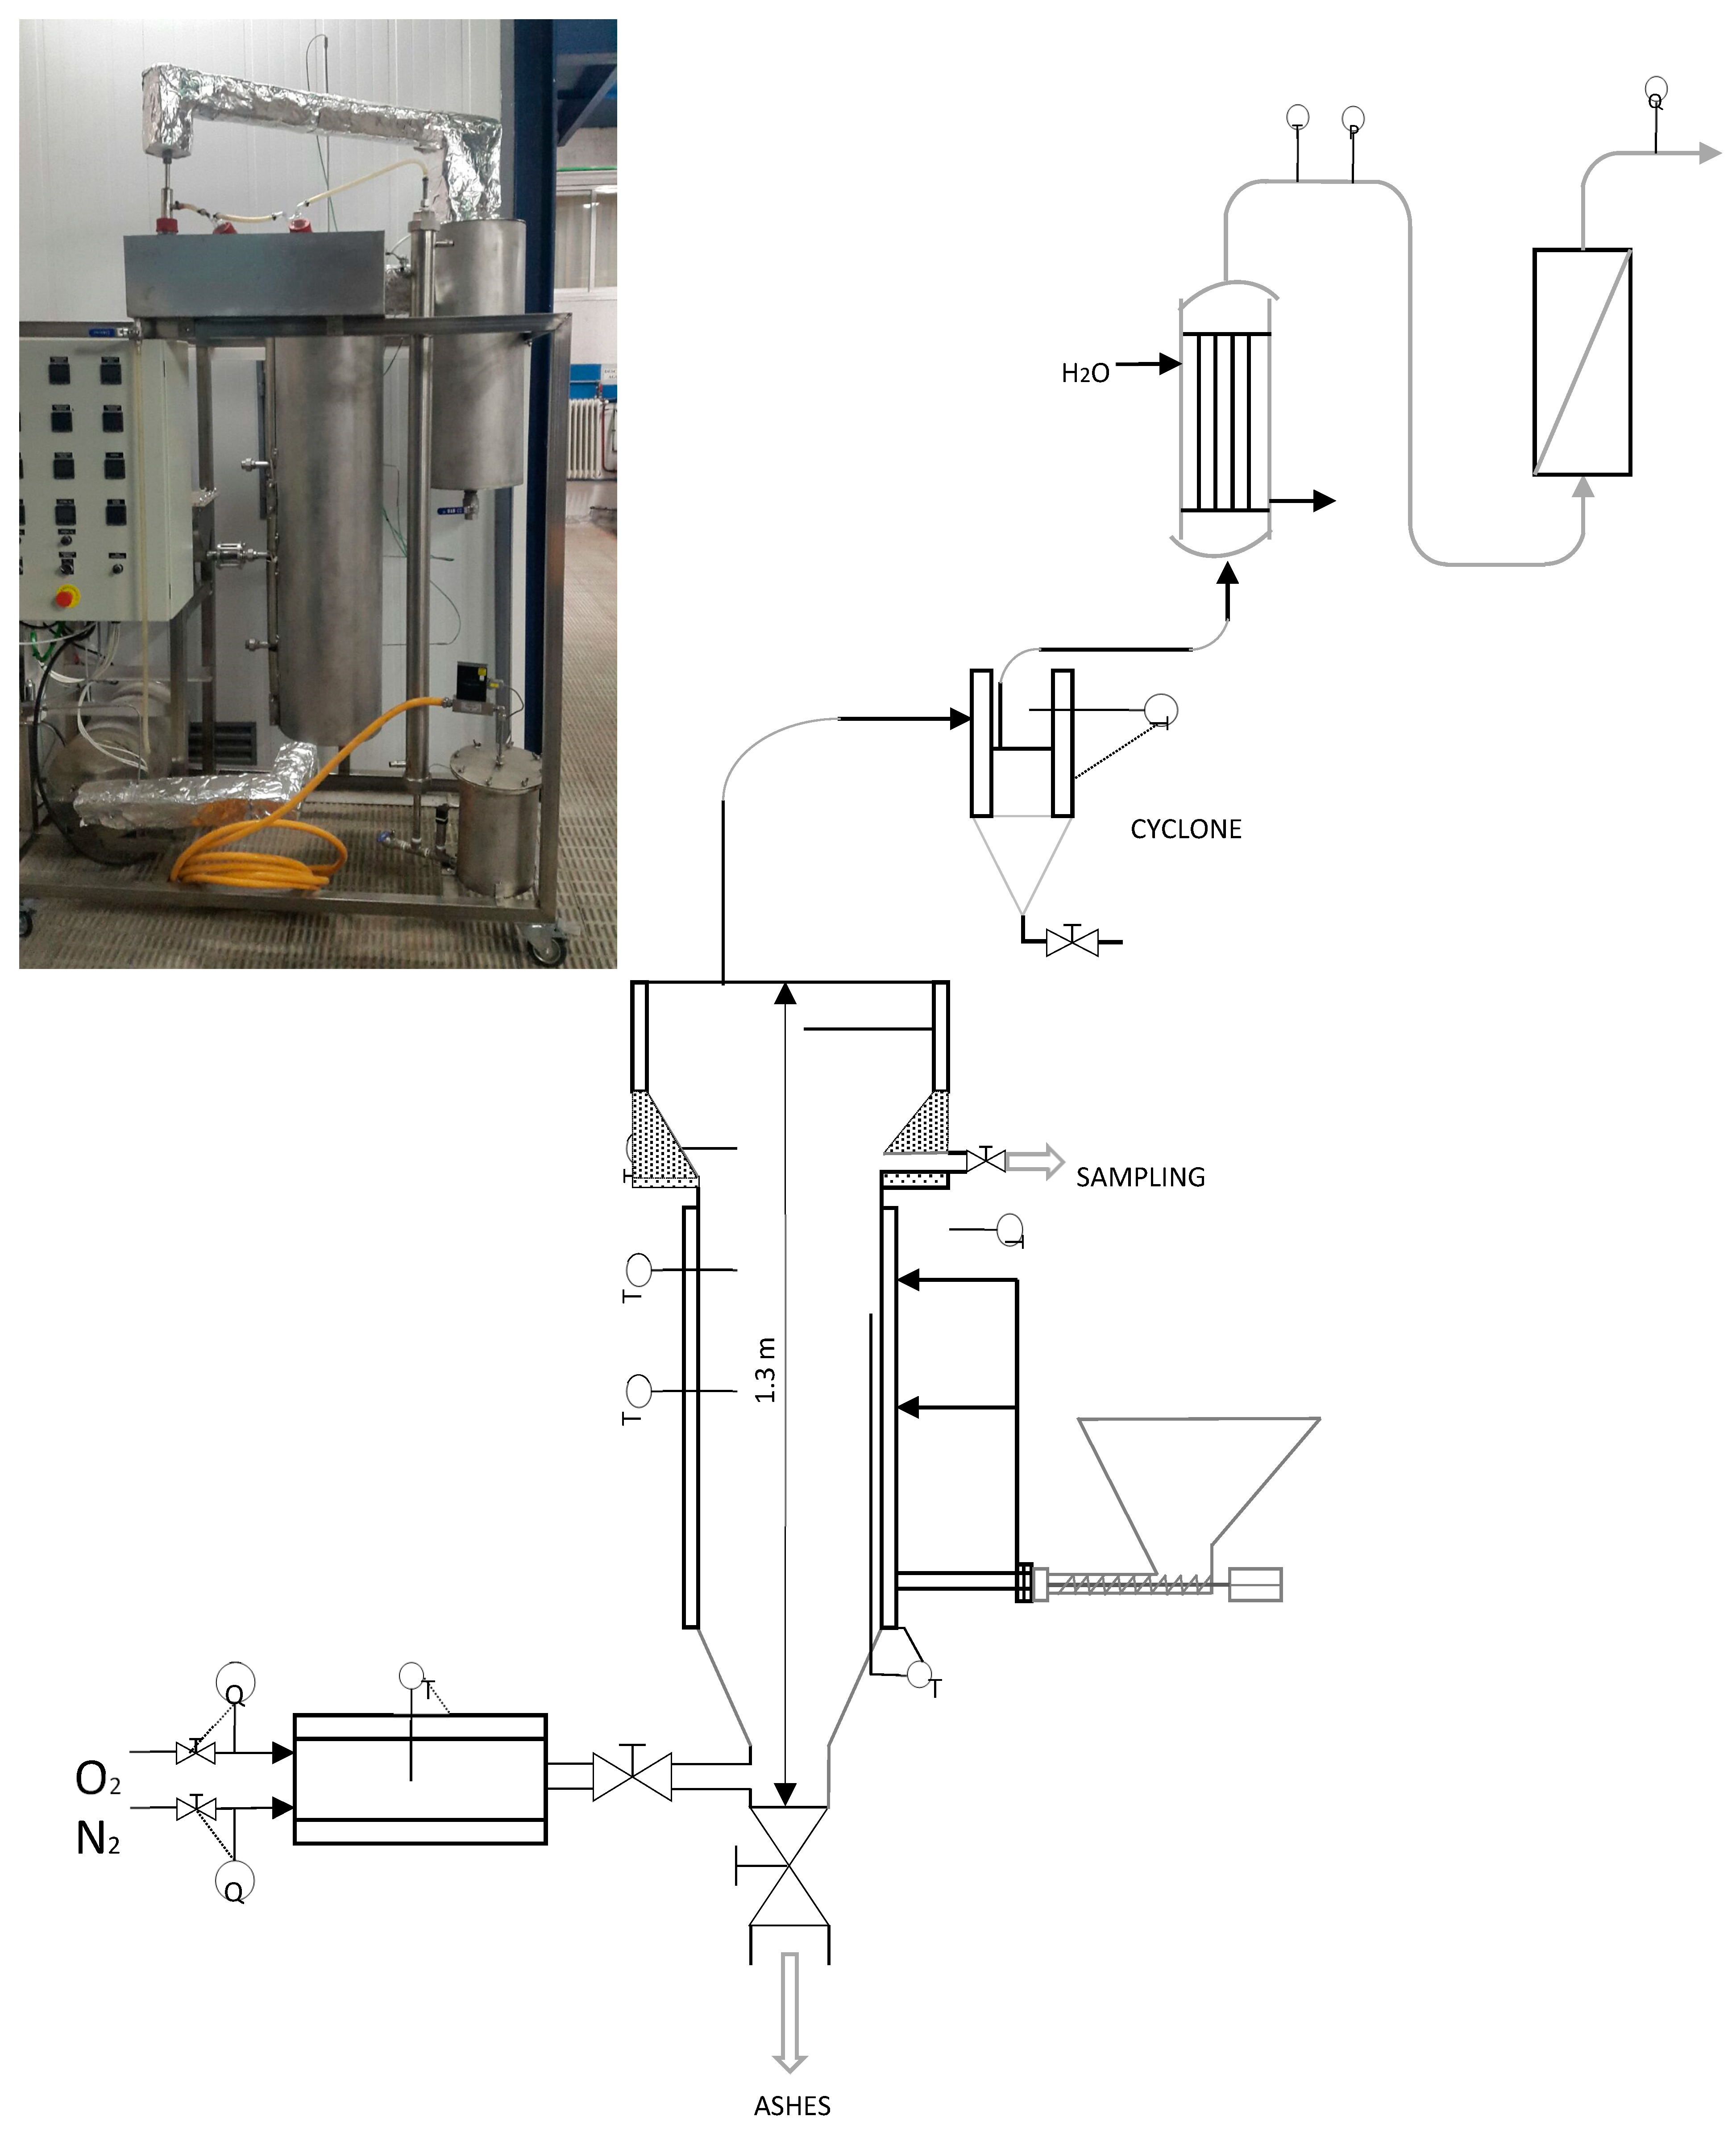
2.2. Brief Description of the Bench-Scale Plant

The equipment used consists of a biomass gasification plant based on atmospheric pressure bubbling fluidized bed technology and built of AISI 304 stainless steel for high temperatures, as shown in Figure 1. The bench-scale plant can be divided into five large interconnected modules, which are the following: (i) the feed system of the agent or gasification agents; (ii) the solid feed system; (iii) the gasification reactor and electric oven; (iv) the gas purification system; and (v) the monitoring and control systems. Sand particles were used as bed material during the gasification experiments, with a mean size of 200 µm.
The gasifier consists of a cylindrical reactor with two bodies. The lower body, with an inner diameter of 50 mm and a height of 750 mm, is connected to the upper body, which has an inner diameter of 100 mm and a height of 250 mm, by a truncated conical intermediate section. The total height of the reactor is 1150 mm.
The biomass to be treated is stored in a 1 L capacity hopper with a lid and is introduced into the gasifier through the lower part of it, through an endless screw designed to feed until 0.5 kg/h. The feed screw is attached to the lower body of the gasifier through flanges located at 3 different heights so that it is possible to feed the reactor at different heights. In our work, the feed was introduced at 0.5 m from the bottom of the cylindrical reactor.
The plant was also equipped with a cyclone, condenser system, and a filter for removing particulate matter and condensing tar and other condensable gases from the producer gas, thereby ensuring cleaner gas output and protecting downstream equipment.

2.3. Description of the Operational Procedure

Before the experimental tests began, several checking and switching tasks were performed. Once the leak check was done, the plant started to be heated. For this, an air stream was circulated, the resistors of the reactor and the air preheater (350 °C) were activated, and the cooling apparatus (4 °C), prior to the final filter, was connected. When the reactor temperature was 50 °C below the standard temperature (750, 800, 850, or 900 °C), the hose feeder (250 g/h) that had been previously inserted into the feeding pipe was triggered. Once the temperature and gas composition were stable (measured firstly with a portable gas analyzer, MRU-Vario Luxx, MRU Instruments, Inc., Humble, TX, USA), the determination of the composition of the exhaust gas was performed with an Agilent 990 Micro GC (Agilent, Santa Clara, CA, USA). Three measurements were made at intervals of 5 min, and the values were recorded for the subsequent calculation of the mean values. For each temperature, three experiments were carried out, keeping the flow rate constant, and varying the air rate to three levels of equivalence ratio (0.1, 0.3, and 0.5).
The equivalence ratio (ER) defines the ratio of the mass of the oxidant to the mass of fuel divided by the oxidant stoichiometrically required per unit mass of dry feedstock. It expresses the quantity of air used as a proportion of the stoichiometric air requirements used to gasify a given unit of fuel. In this work, to establish the chosen equivalence ratios of 0.1, 0.3, and 0.5, air flows were varied between 0.13 Nm3/h and 0.67 Nm3/h for a flow of 0.25 kg/h of olive cake.
Cold gas gasification efficiency, defined as the ability of the reaction system to harness the energy available in the biomass and convert it into energy available in the gas, was calculated according to the Equation (1) as the ratio of output gas energy to the input feed energy:
η CG = V g · LHV gas m fuel · LHV fuel
where ηCG is the cold gas efficiency, Vg the volume flow of exit gas (Nm3/h), LHVgas the lower heating value of the exit gas (MJ/Nm3), LHVfuel the lower heating value of the solid fuel (MJ/kg), and mfuel the mass flow of solid fuel (kg/h).
The fluidization process was achieved using quartz sand with a mean particle size of 200 µm. The gas flow was introduced through a perforated plate located at the base of the reactor to ensure uniform distribution and stable fluidization.
Liquid residues were sampled directly from the gasification system at designated collection points. Specifically, the sampling was conducted from the condensate collection unit, which is positioned downstream of the gasifier where the syngas cools and condenses. This unit is equipped with sampling ports to ensure a representative collection of the liquid phase.
The solid residues were collected from three key locations within the gasification system: (1) the fluidized bed reactor, (2) the cyclone, and (3) the gas filter unit. The fluidized bed reactor includes an ash collection system at the bottom to collect the ashes generated during the gasification process. After each experiment, a manual ash removal mechanism was executed. Also, the ash was recovered from the cyclone and gas filter unit sited at the end of the installation.

3. Results

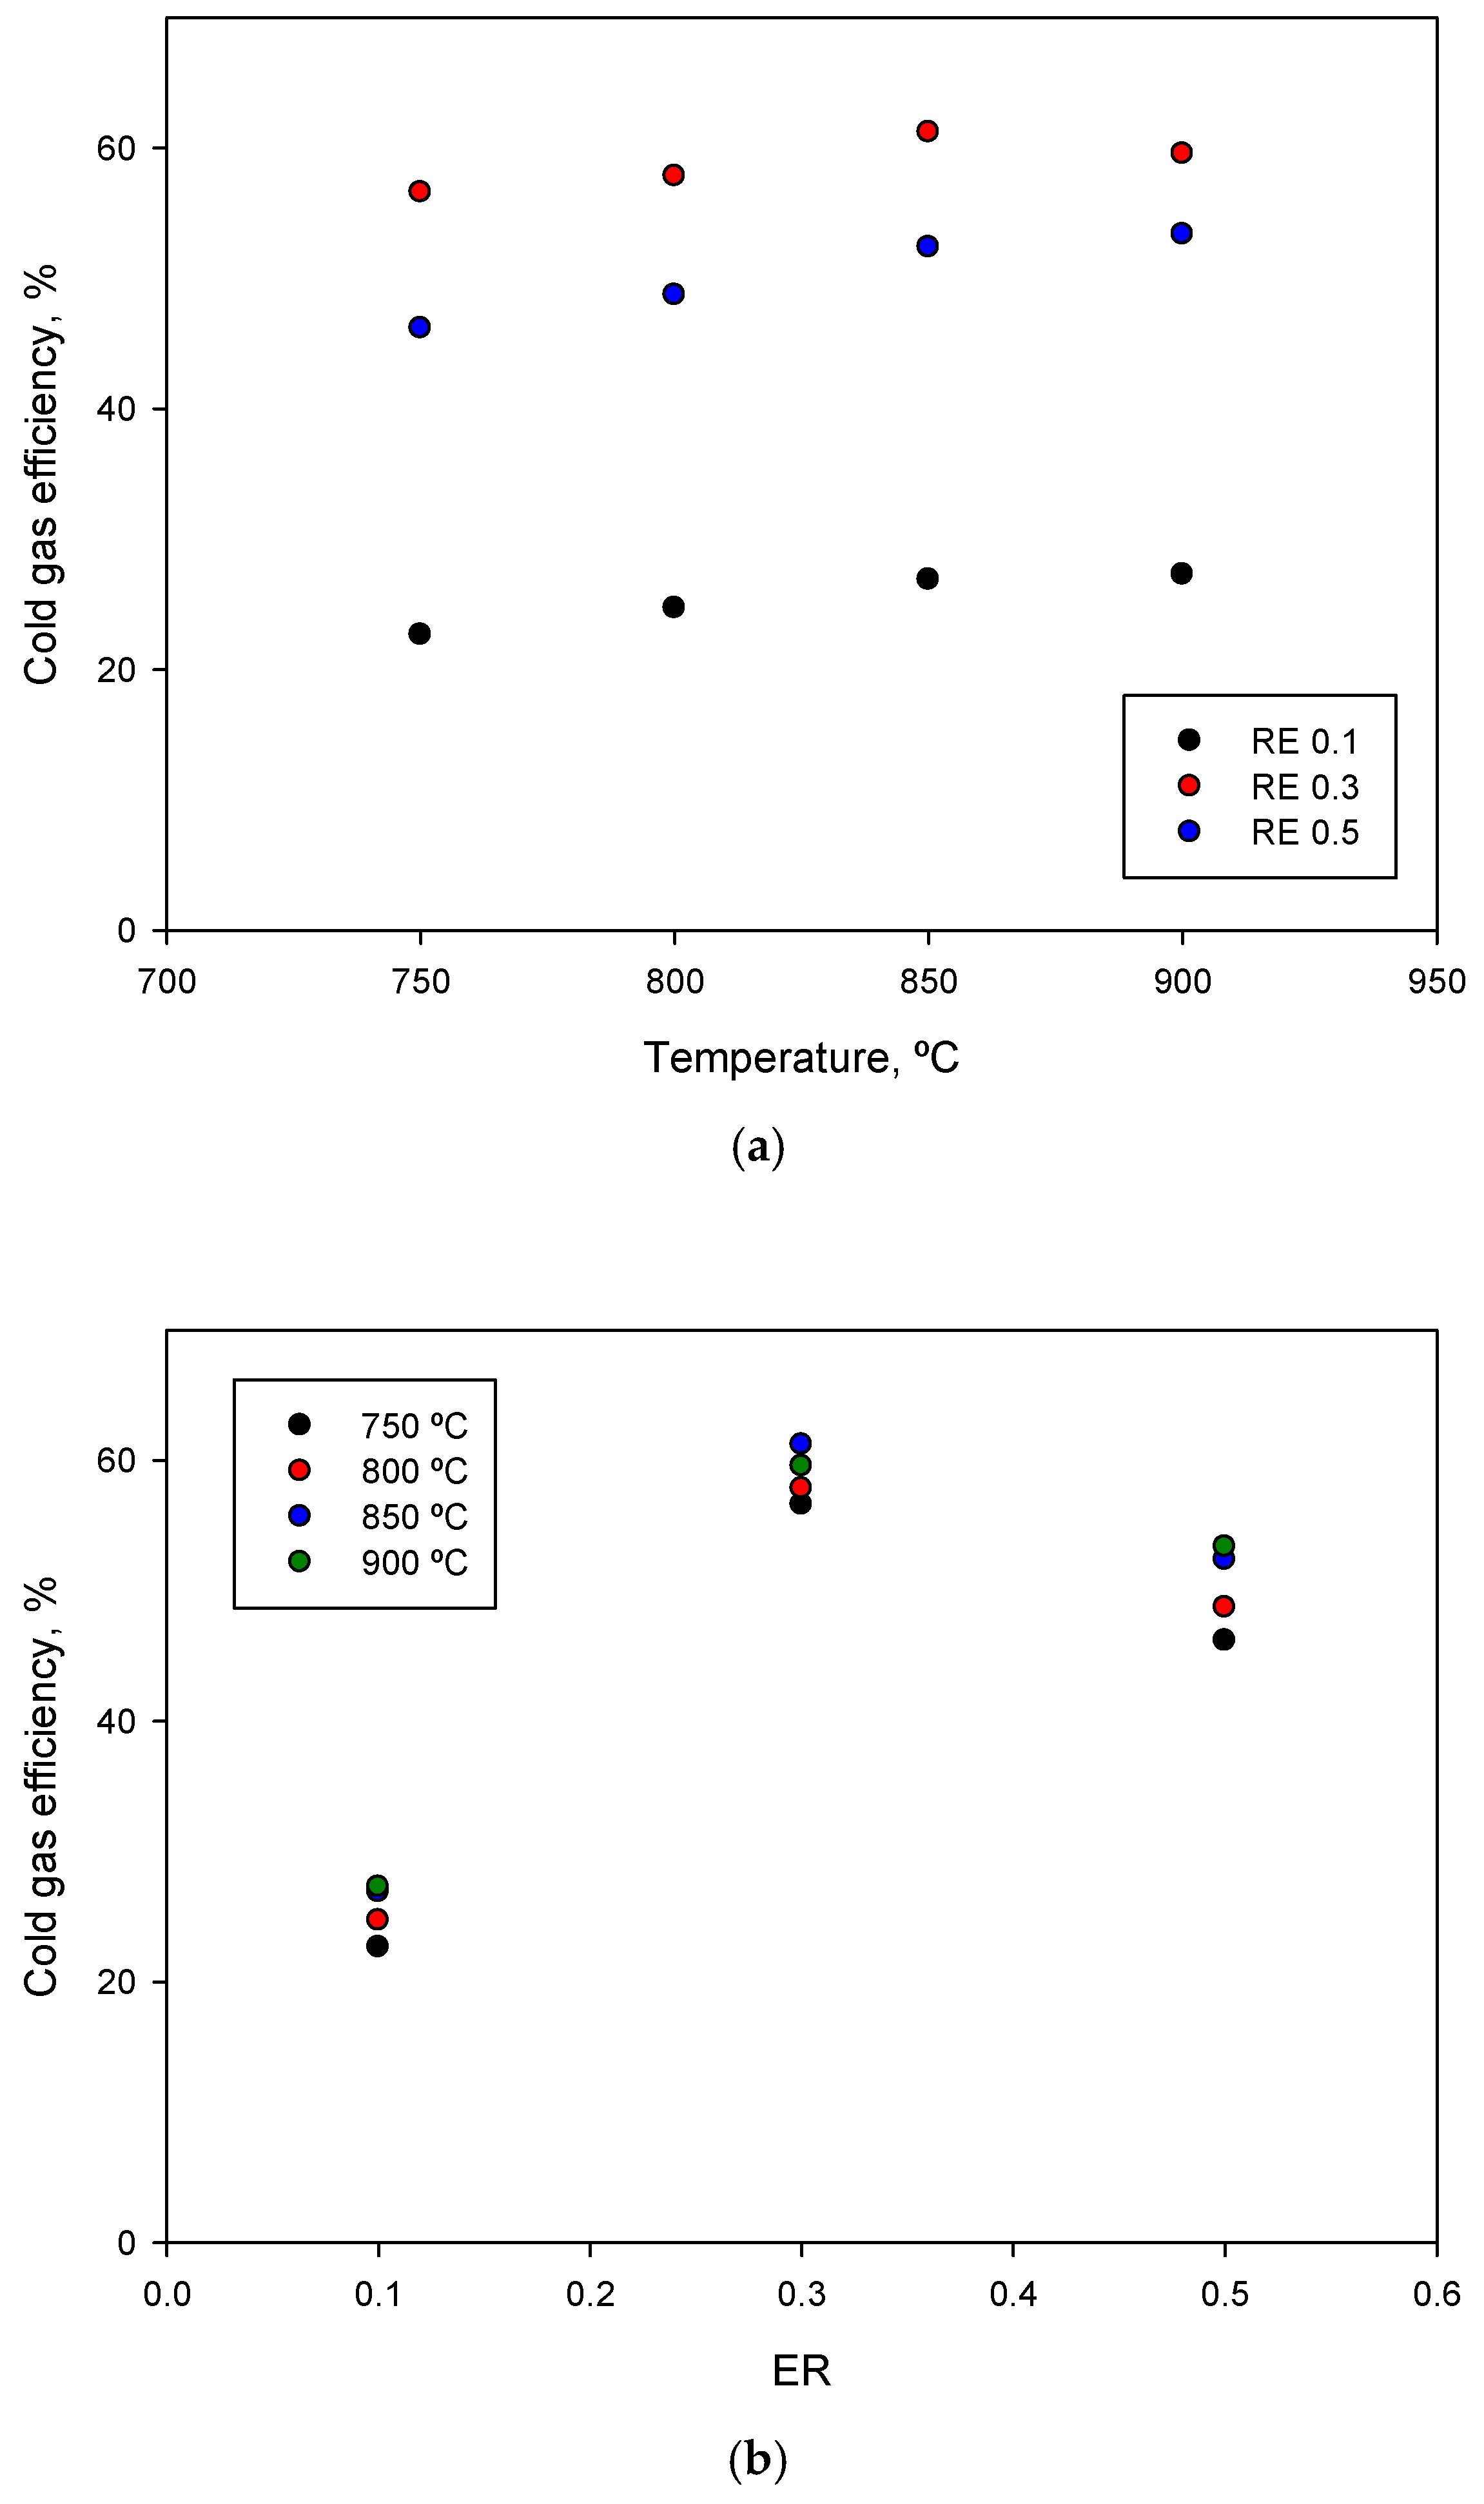
3.1. Influence of Temperature and ER on Cold Gas Efficiency

Figure 2a shows the effect of temperature on cold gas efficiency for the three ER levels studied. The results show values ranging from 22.7% (700 °C; ER 0.1) to 61.2% (850 °C; ER 0.3). The relatively low efficiency values may be because the light hydrocarbon content of the resulting gas was not considered for the LHVgas calculation. On the other hand, generally, for a specific ER, a temperature increase shows an increase in the efficiency of cold gas. However, for a 0.3 ER, the variations between the cold gas efficiency values were barely affected by the temperature, even showing a slight decrease when the temperature increased from 850 to 900 °C. If you analyze the three ER levels in more detail, you can see how the lowest efficiency values were found for a 0.1 ER.
These trends are consistent with the results obtained in previous works reported by other authors and other materials, such as Abdelrahim et al. [17], who evaluated sludges at a fixed temperature of 780 °C and with an ER between 0.1 and 0.5 and achieved a simulated efficiency of between 30 and 35%. Also, Hernández et al. [18] found that the efficiency of cold gas increased from 15 to 28% by increasing the temperature from 750 to 1050 °C for a mixture of biomass and coal. On the other hand, Niu et al. [19] found that when the ER increased to 0.28, the gas yield increased by approximately 20% for the gasification of urban solid waste.
While higher temperatures in a gasification process require more energy input, cold gas efficiency was perhaps improved by enhancing reaction rates, reducing tar formation, and better converting it into valuable gases. At low temperatures, the gasification process is less efficient as it hinders the conversion of biomass into useful gases. This is because the chemical reactions involved in gasification are favored at higher temperatures. Therefore, at low temperatures, the biomass conversion is lower, and a low cold gas efficiency was obtained [20]. It is also important to indicate that electric heating was utilized to maintain the required operating temperatures for the gasifier. However, this input was not accounted for in the cold gas efficiency calculations. Consequently, while the cold gas efficiency generally improves with increasing temperature—reflecting enhanced gasification reactions—it does not capture the complete energy dynamics of the gasifier. This discrepancy indicates that the measured efficiency improvements may not fully align with the broader energy balance considerations.
Figure 2b shows the effect of the equivalence ratio on cold gas efficiency for the four temperature levels analyzed. It is observed that the ER of 0.3 shows a higher cold gas efficiency for all the temperatures studied. However, the increase in temperature in the operating range studied hardly showed improvements in the efficiency of cold gas, ranging, for example, from 22.67% (750 °C) to 27.29% (900 °C) for the 0.1 ER; from 56.59% (750 °C) to 59.55% (900 °C) for the 0.3 ER; and from 46.16% (750 °C) to 53.38% (900 °C) for the 0.5 ER.
Maintaining a high equivalence ratio during gasification has negative effects on cold gas efficiency. When there is an excessive amount of oxygen compared to the biomass, it can lead to over-oxidation of the fuel, resulting in a decrease in the overall energy conversion efficiency. Additionally, the high equivalence ratio can also lead to an increase in the formation of nitrogen compounds, which are harmful pollutants that contribute to air pollution and climate change [21]. Therefore, finding the right balance in the equivalence ratio is essential for maximizing cold gas efficiency and minimizing environmental impacts.

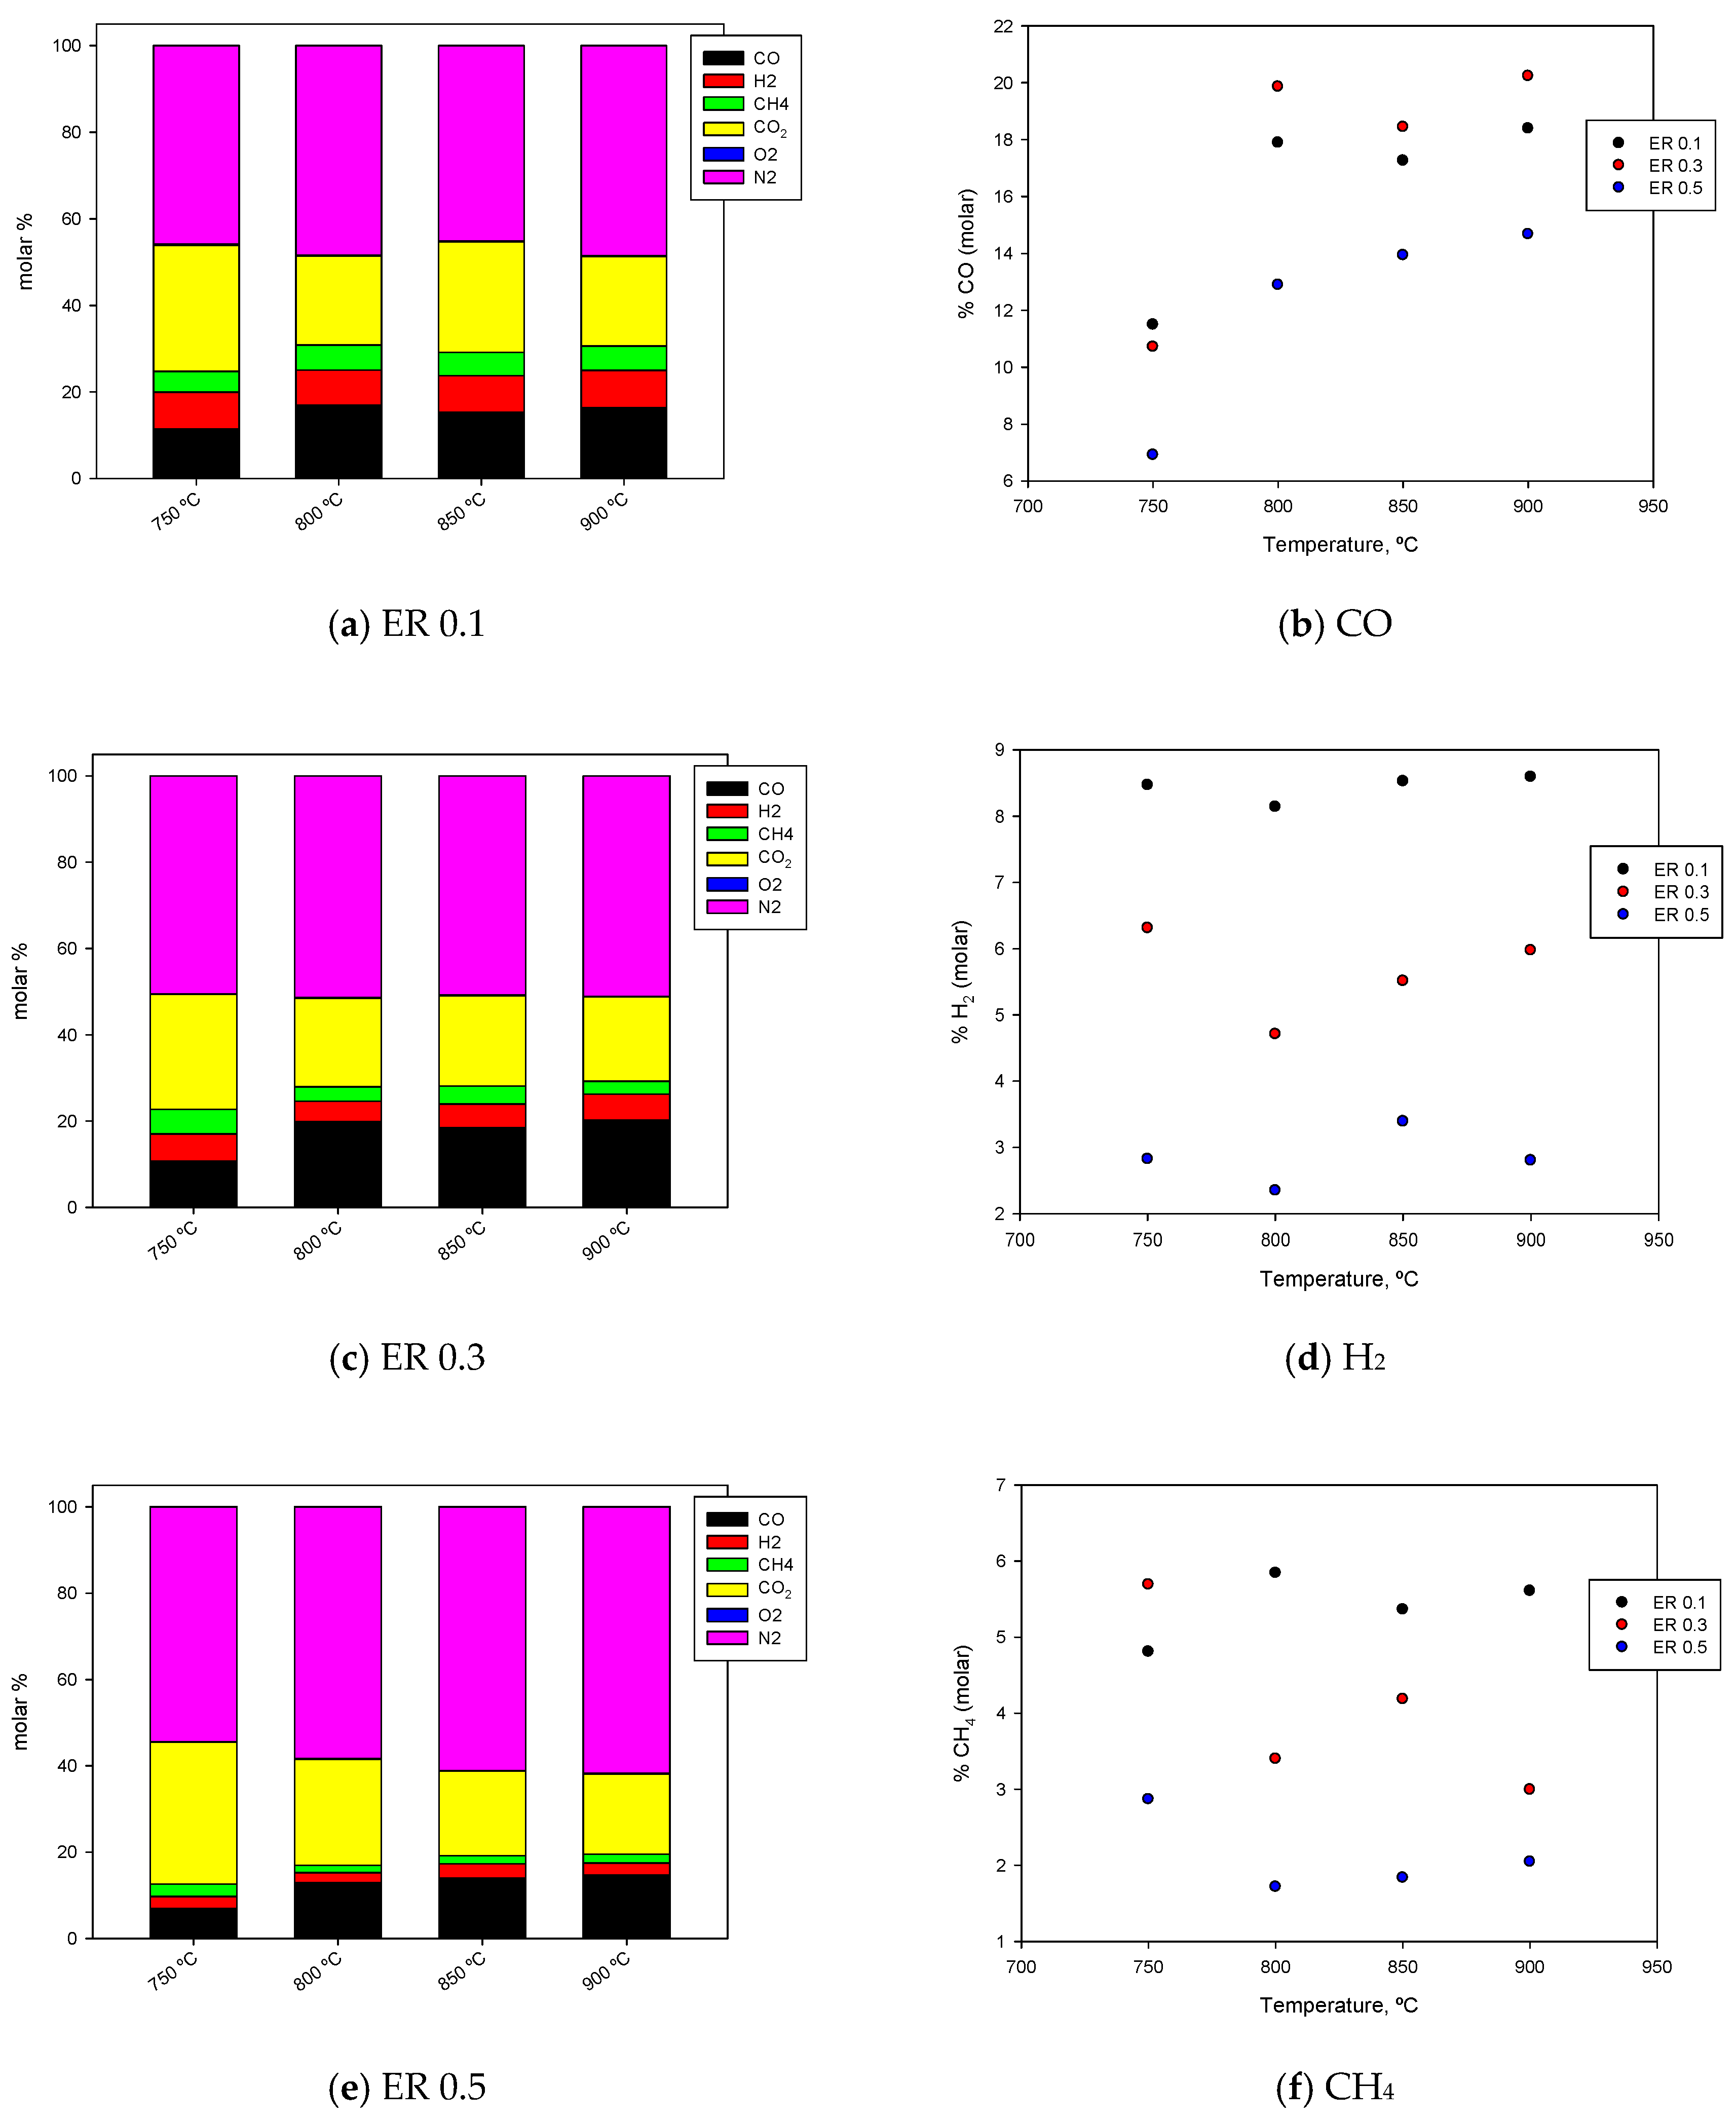
3.2. Influence of Temperature and ER on Gas Composition

Figure 3 shows the effect of temperature on gas composition for the different ER levels analyzed. Of the three components that provide energy to the gas, and which were possible to quantify, the most contributing is CO, followed by H2 and CH4. The percentage of CO in the gas was in the range of 6.9–20.2 mol %, while H2 presented a proportion of 2.3–8.6 mol %. For its part, CH4 showed gas concentration variations between 1.7 mol % and 5.8 mol %. Regarding CO concentrations, higher temperatures generally increased the CO concentration due to the enhanced breakdown of olive cake and increased reactions involving CO formation due to the Boudouard reaction, which is favored at higher temperatures. On the other hand, the data do not reveal a significant relationship between changes in temperature and the concentrations of H2 or CH4 in the gas product. At an ER of 0.1, the concentrations of H2 and CH4 were relatively higher compared to ERs of 0.3 and 0.5 and exhibited less variation with changes in temperature. At an ER of 0.3, the concentrations of hydrogen (H2) and methane (CH4) demonstrated less consistent behavior across different temperatures, with distinct peaks observed. At an ER of 0.5, the H2 and CH4 concentrations were relatively lower than at ERs of 0.1 and 0.3 and showed less variation with temperature changes. The results are consistent with previous works [22,23]. The increase in CO concentration with the rise in temperature can be explained by the increase in the rate of both water gas and Boudouard reactions [24]. Regarding the slight change in CH4 concentrations, it has been reported that this is mainly due to the simultaneous formation and consumption of CH4 in exothermic reactions at low and high temperatures, respectively [25].
In relation to the molar percentage of N2, this was in the range 45.1–61.7 mol %, increasing as the ER used was raised, but it was practically constant with the temperature. A deep analysis suggests that both the H2 and CH4 percentages decrease as the ER increases. This is because increasing the ER introduces more air in the gasifier, improves the oxidation reaction rate more than reforming and cracking reactions [26], and eventually enhances the formation of more CO2 and H2O. However, the percentage of CO increased as the ER increased from 0.1 to 0.3, and then it decreased when the ER was increased to 0.5. Then, lower ER values resulted in higher CH4 and H2 concentrations, but CO concentrations depended on the range of ER analyzed. This different effect on CO concentrations was also observed by Karatas et al. [27] in their experimental study of the gasification of waste tires with air in a bubbling fluidized bed gasifier. The results shown are also like those obtained by Arena [28], Lee et al. [29], and Niu et al. [19], in which a high ER turned into low yields of CH4, CO, and H2 in gaseous products.

3.3. Influence of Temperature and ER on the Lower Heating Value of the Gas and the Gas Flow

Table 2 reports the lower heating value of the raw gas as well as the gas flow obtained (measured under normal conditions), depending on temperature and ER. It should be noted that in the calculation of the LHV, only the energy contents of carbon monoxide, hydrogen, and methane were considered since the rest of the fuel compounds, such as light hydrocarbons with two or more carbon atoms, were not quantified.
Furthermore, the LHV includes the effect of nitrogen dilution because the gas was generated by the operation of the gasifier using air. This made the LHVgas low, between 2.21 and 5.11 MJ/Nm3, compared to other gasification studies with other agents, in which LHVgas reached values of up to 11.3 MJ/m3, as in Saebea et al. [30]. Thus, for example, Puig-Arnavat et al. [31], Boerrigter [32], and Habibollahzade et al. [33] found LHV values of 3 to 6 MJ/m3 and explained the nitrogen dilution in their works. More recently, Njuguna et al. [34] also obtained an LHV between 3.2 and 4.8 MJ/Nm3 in their experimental investigation of the gasification of macadamia nutshells.
It can be observed that, in general, by increasing the operating temperature, there is no significant increase in the LHV of the gas. However, Table 2 shows that the ER affects the LHV of the product gas because LHV is dependent on the concentrations of CO, H2, and CH4, and H2 concentrations decrease greatly as the ER becomes higher. At a higher ER, oxidation reactions are more favorable due to the increased availability of oxygen. This resulted in a higher production of CO2 and a reduced concentration of combustible gases, ultimately causing a negative effect on the syngas higher heating value [34]. Instead, the gas flow was practically constant with the temperature, reaching values in the range of 3.44–14.89 L/min (825.6–3573.6 L/kg feed), and it varied substantially with the ER, with the highest value observed at 0.5 and the lowest value at 0.1.

3.4. Influence of Temperature and ER on the Production of CO, H2, and CH4

Table 3 reports the CO, H2, and CH4 production evaluated in g of CO, H2, or CH4 per kg of olive cake. For the four selected temperatures, the production of CO, H2, and CH4 was estimated to be higher for tests conducted with an ER of 0.3, with averages of 511.2 g of CO per kg of olive cake, 11.9 g of H2 per kg, and 68.7 g of CH4 per kg. Furthermore, the results confirm that the production values of CO, H2, and CH4 obtained are like those of other researchers using comparable operating conditions [35,36]. Thus, for example, those studies found that the production of CO and H2 decreased significantly as the ER increased. Furthermore, the production of CH4 varied considerably, from 50 to 80 g/kg of biomass in the range of the operating conditions analyzed.

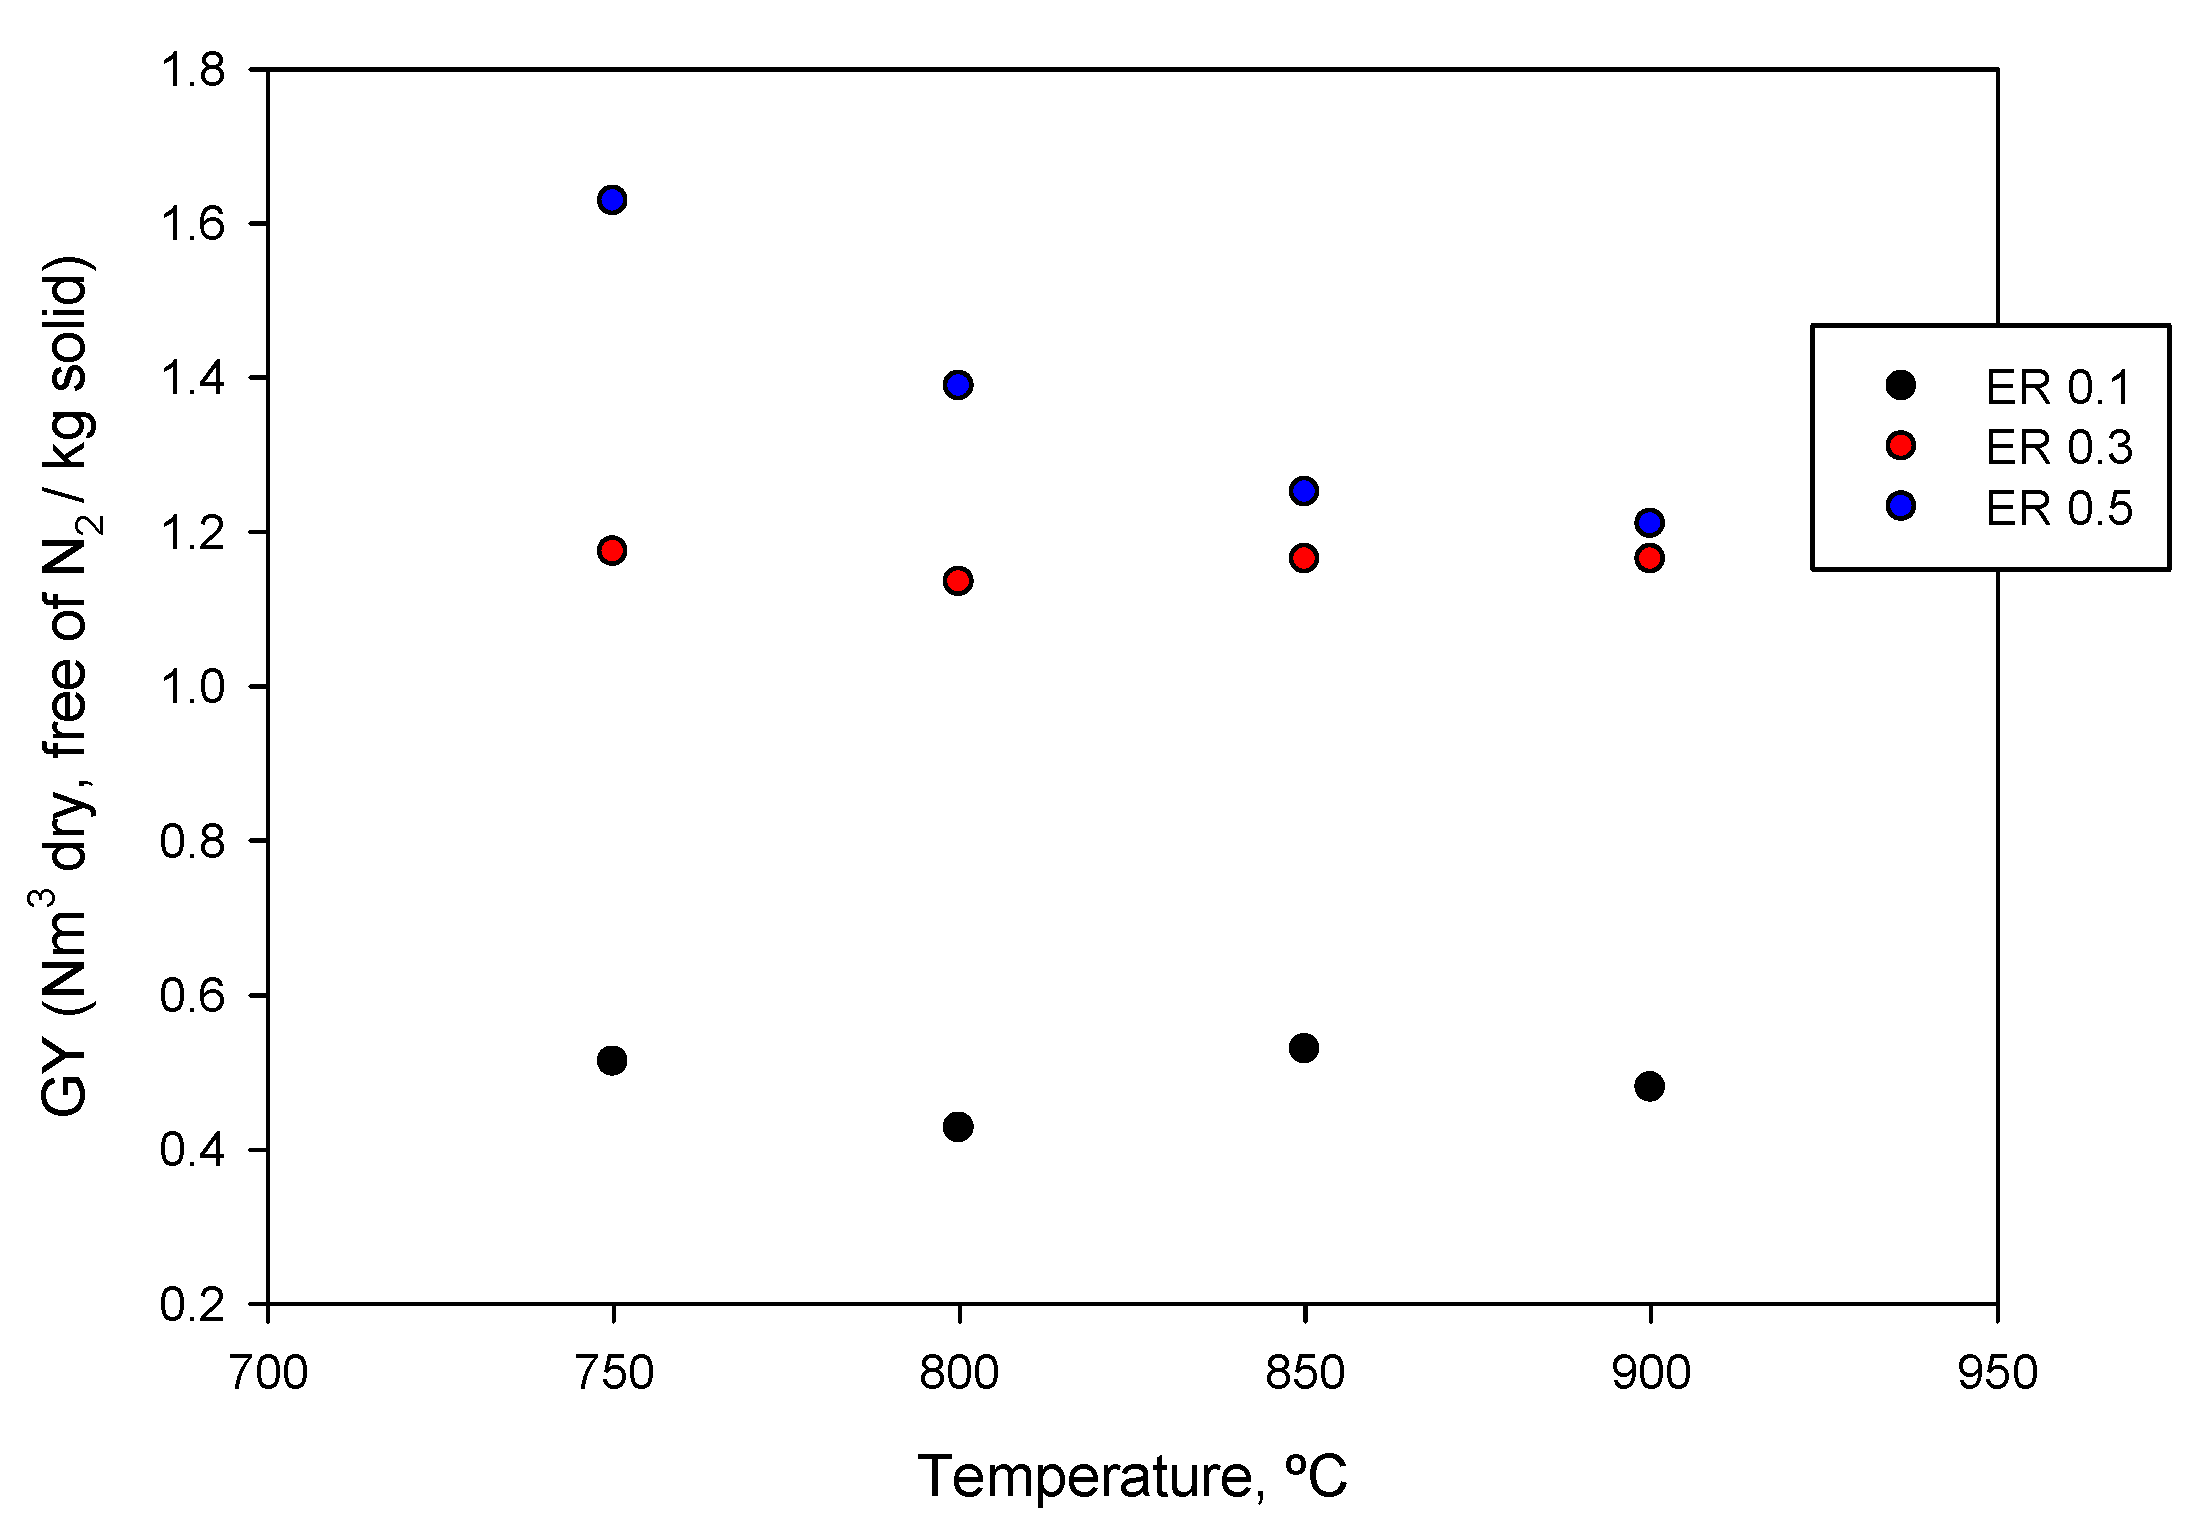
3.5. Influence of Temperature and ER on Gas Production

Gas production (GY) is defined as the ratio between the volume flow of the product gas (dry and nitrogen-free) and the volume of the solid. Figure 4 shows that the GY was kept constant by increasing the temperature for ERs of 0.1 and 0.3. However, for a 0.5 ER, the gas production decreased with temperature. This can perhaps be attributed to operational difficulties, such as maintaining consistent temperature profiles and ensuring adequate residence time for reactions. Perhaps these factors contribute to reduced efficiency in gas production. In any case, the changes are small and do not significantly alter the overall conclusions of the study. That is, gas production is especially affected by ER, with the highest GY values obtained (between 1.21 and 1.63) for an ER of 0.5, and this result is in accordance with other works published in the literature such as Lv et al. [37], Sadaka et al. [38], and Taba et al. [24].

3.6. Solid and Liquid Residues

Table 4 presents the detailed results of the yield of collected solid and liquid residues and provides comprehensive mass balance data. The yield of solid residues (comprising unreacted char and ash) was significantly influenced by the experimental variables investigated. The results indicate a small correlation between temperature and the quantity of solid residues collected. Similarly, the equivalence ratio (ER) played a crucial role in determining the quantity of solid residues. Higher ER values corresponded to reduced solid residue yields. The yield of liquid residues, primarily consisting of tar and water vapor, showed an inverse relationship with temperature. As the temperature increased, the yield of liquid residues decreased, indicating more efficient cracking of heavier hydrocarbons into lighter gaseous products at higher temperatures. Additionally, the ER influenced the liquid residue yield, with higher ER values leading to lower liquid yields.
Finally, to ensure the accuracy and completeness of the experimental analysis, a thorough mass balance assessment was performed. This involved accounting for all input and output streams, including solid, liquid, and gaseous components. The mass balance data, presented in Table 4, demonstrate an acceptable level of accuracy.

4. Conclusions

The influence of equivalence ratio and temperature on olive cake gasification in a bench-scale plant using air as a gasification agent was studied. An increase in temperature generally increased the efficiency of cold gas. The ER of 0.3 showed higher cold gas efficiency for all temperatures studied. The percentage of CO in the gas ranged from 6.9 to 20.2 mol %, with H2 and CH4 remaining constant with the operating temperature. The production of CO, H2, and CH4 was estimated to be higher for tests conducted with an ER of 0.3, with averages of 393.06 g of CO per kg of olive cake, 9.07 g of H2 per kg, and 51.55 g of CH4 per kg.

Author Contributions

Conceptualization, A.P. and G.B.; methodology, Á.G.-P., A.P. and G.B.; software, M.Á.M.-L.; validation, M.Á.M.-L.; formal analysis, G.B., M.C. and M.Á.M.-L.; investigation, Á.G.-P. and G.B.; resources, G.B. and M.C.; data curation, Á.G.-P., G.B. and A.P.; writing—original draft preparation, M.Á.M.-L.; writing—review and editing, M.Á.M.-L. and M.C.; supervision, A.P. and M.C.; project administration, M.C. and M.Á.M.-L.; funding acquisition, M.C. and M.Á.M.-L. All authors have read and agreed to the published version of the manuscript.

Funding

All authors are grateful to the Spanish Ministry of Economy, Industry and Competitiveness for the financial support received (Project CTM2016-75977-R).

Institutional Review Board Statement

Not applicable.

Informed Consent Statement

Not applicable.

Data Availability Statement

The original contributions presented in the study are included in the article, further inquiries can be directed to the corresponding author.

Conflicts of Interest

The authors declare no conflicts of interest.

References

  1. International Olive Council, The world of Olive Oil. 2022. Available online: https://www.internationaloliveoil.org/the-world-of-olive-oil/ (accessed on 2 February 2024).
  2. Sikarwar, V.S.; Zhao, M.; Fennell, P.S.; Shah, N.; Anthony, E.J. Progress in biofuel production from gasification. Prog. Energy Combust. Sci. 2017, 61, 189–248. [Google Scholar] [CrossRef]
  3. Gálvez-Pérez, A.; Martín-Lara, M.A.; Calero, M.; Pérez, A.; Canu, P.; Blázquez, G. Experimental investigation on the air gasification of olive cake at low temperatures. Fuel Process. Technol. 2021, 213, 106703. [Google Scholar] [CrossRef]
  4. Carmo-Calado, L.; Hermoso-Orzáez, M.J.; Diaz-Perete, D.; La Cal-Herrera, J.; Brito, P.; Terrados-Cepeda, J. Experimental Research on the Production of Hydrogen-Rich Synthesis Gas via the Air-Gasification of Olive Pomace: A Comparison between an Updraft Bubbling Bed and a Downdraft Fixed Bed. Hydrogen 2023, 4, 726–745. [Google Scholar] [CrossRef]
  5. IEA Bioenergy, Gasification for Multiple Purposes-Bioenergy Review 2023. 2023. Available online: https://www.ieabioenergyreview.org/gasification-for-multiple-purposes/ (accessed on 2 February 2024).
  6. Dogru, M.; Erdem, A. Autothermal Fixed Bed Updraft Gasification of Olive Pomace Biomass and Renewable Energy Generation via Organic Rankine Cycle Turbine: Green energy generation from waste biomass in the Mediterranean region. Johns. Matthey Technol. Rev. 2020, 64, 119–134. [Google Scholar] [CrossRef]
  7. Tezer, O.; Karabag, N.; Ozturk, M.U.; Ongen, A.; Ayol, A. Comparison of green waste gasification performance in updraft and downdraft fixed bed gasifiers. Int. J. Hydrogen Energy 2022, 47, 31864–31876. [Google Scholar] [CrossRef]
  8. Tezer, Ö.; Karabağ, N.; Öngen, A.; Ayol, A. Gasification performance of olive pomace in updraft and downdraft fixed bed reactors. Int. J. Hydrogen Energy 2023, 48, 22909–22920. [Google Scholar] [CrossRef]
  9. Tamošiūnas, A.; Chouchène, A.; Valatkevičius, P.; Gimžauskaitė, D.; Aikas, M.; Uscila, R.; Ghorbel, M.; Jeguirim, M. The Potential of Thermal Plasma Gasification of Olive Pomace Charcoal. Energies 2017, 10, 710. [Google Scholar] [CrossRef]
  10. Vera, D.; Jurado, F.; Margaritis, N.K.; Grammelis, P. Experimental and economic study of a gasification plant fuelled with olive industry wastes. Energy Sustain. Dev. 2014, 23, 247–257. [Google Scholar] [CrossRef]
  11. Borello, D.; De Caprariis, B.; De Filippis, P.; Di Carlo, A.; Marchegiani, A.; Pantaleo, A.M.; Shah, N.; Venturini, P. Thermo-Economic Assessment of a Olive Pomace Gasifier for Cogeneration Applications. Energy Procedia 2015, 75, 252–258. [Google Scholar] [CrossRef]
  12. Borello, D.; Pantaleo, A.; Caucci, M.; De Caprariis, B.; De Filippis, P.; Shah, N. Modeling and Experimental Study of a Small Scale Olive Pomace Gasifier for Cogeneration: Energy and Profitability Analysis. Energies 2017, 10, 1930. [Google Scholar] [CrossRef]
  13. Puig-Gamero, M.; Lara-Díaz, J.; Valverde, J.L.; Sanchez-Silva, L.; Sánchez, P. Dolomite effect on steam co-gasification of olive pomace, coal and petcoke: TGA-MS analysis, reactivity and synergistic effect. Fuel 2018, 234, 142–150. [Google Scholar] [CrossRef]
  14. Sert, M.; Gökkaya, D.S.; Cengiz, N.; Ballice, L.; Yüksel, M.; Sağlam, M. Hydrogen production from olive-pomace by catalytic hydrothermal gasification. J. Taiwan Inst. Chem. Eng. 2018, 83, 90–98. [Google Scholar] [CrossRef]
  15. Cardoso, J.; Silva, V.; Eusébio, D.; Carvalho, T.; Brito, P. Modelling and experimental analysis of a small-scale olive pomace gasifier for cogeneration applications: A techno-economic assessment. Chem. Ind. Chem. Eng. Q. 2019, 25, 329–339. [Google Scholar] [CrossRef]
  16. Quesada, L.; Pérez, A.; Calero, M.; Blázquez, G.; Martín-Lara, M.A. Kinetic study of thermal degradation of olive cake based on a scheme of fractionation and its behavior impregnated of metals. Bioresour. Technol. 2018, 261, 104–116. [Google Scholar] [CrossRef]
  17. Abdelrahim, A.; Brachi, P.; Ruoppolo, G.; Di Fraia, S.; Vanoli, L. Experimental and Numerical Investigation of Biosolid Gasification: Equilibrium-Based Modeling with Emphasis on the Effects of Different Pretreatment Methods. Ind. Eng. Chem. Res. 2019, 59, 299–307. [Google Scholar] [CrossRef]
  18. Hernández, J.J.; Aranda-Almansa, G.; Serrano, C. Co-Gasification of Biomass Wastes and Coal−Coke Blends in an Entrained Flow Gasifier: An Experimental Study. Energy Fuels 2010, 24, 2479–2488. [Google Scholar] [CrossRef]
  19. Niu, M.; Huang, Y.; Jin, B.; Wang, X. Oxygen Gasification of Municipal Solid Waste in a Fixed-bed Gasifier. Chin. J. Chem. Eng. 2014, 22, 1021–1026. [Google Scholar] [CrossRef]
  20. Kumar, A.; Jones, D.D.; Hanna, M.A. Thermochemical Biomass Gasification: A Review of the Current Status of the Technology. Energies 2009, 2, 556–581. [Google Scholar] [CrossRef]
  21. Xu, C.; Donald, J.; Byambajav, E.; Ohtsuka, Y. Recent advances in catalysts for hot-gas removal of tar and NH3 from biomass gasification. Fuel 2010, 89, 1784–1795. [Google Scholar] [CrossRef]
  22. AlNouss, A.; Parthasarathy, P.; Shahbaz, M.; Al-Ansari, T.; Mackey, H.; McKay, G. Techno-economic and sensitivity analysis of coconut coir pith-biomass gasification using ASPEN PLUS. Appl. Energy 2020, 261, 114350. [Google Scholar] [CrossRef]
  23. Esfahani, R.A.M.; Osmieri, L.; Specchia, S.; Yusup, S.; Tavasoli, A.; Zamaniyan, A. H2-rich syngas production through mixed residual biomass and HDPE waste via integrated catalytic gasification and tar cracking plus bio-char upgrading. Chem. Eng. J. 2017, 308, 578–587. [Google Scholar] [CrossRef]
  24. Taba, L.E.; Irfan, M.F.; Daud, W.A.M.W.; Chakrabarti, M.H. The effect of temperature on various parameters in coal, biomass and CO-gasification: A review. Renew. Sustain. Energy Rev. 2012, 16, 5584–5596. [Google Scholar] [CrossRef]
  25. Pohořelý, M.; Vosecký, M.; Hejdová, P.; Punčochář, M.; Skoblja, S.; Staf, M.; Vošta, J.; Koutský, B.; Svoboda, K. Gasification of coal and PET in fluidized bed reactor. Fuel 2006, 85, 2458–2468. [Google Scholar] [CrossRef]
  26. Sidek, F.; Samad, N.A.; Saleh, S. Review on effects of gasifying agents, temperature and equivalence ratio in biomass gasification process. IOP Conf. Ser. Mater. Sci. Eng. 2020, 863, 012028. [Google Scholar] [CrossRef]
  27. Karatas, H.; Olgun, H.; Engin, B.; Akgun, F. Experimental results of gasification of waste tire with air in a bubbling fluidized bed gasifier. Fuel 2013, 105, 566–571. [Google Scholar] [CrossRef]
  28. Arena, U. Process and technological aspects of municipal solid waste gasification. A review. Waste Manag. 2012, 32, 625–639. [Google Scholar] [CrossRef] [PubMed]
  29. Lee, J.W.; Yu, T.U.; Lee, J.W.; Moon, J.H.; Jeong, H.J.; Park, S.S.; Yang, W.; Lee, U.D. Gasification of Mixed Plastic Wastes in a Moving-Grate Gasifier and Application of the Producer Gas to a Power Generation Engine. Energy Fuels 2013, 27, 2092–2098. [Google Scholar] [CrossRef]
  30. Saebea, D.; Ruengrit, P.; Arpornwichanop, A.; Patcharavorachot, Y. Gasification of plastic waste for synthesis gas production. Energy Rep. 2020, 6, 202–207. [Google Scholar] [CrossRef]
  31. Puig-Arnavat, M.; Bruno, J.C.; Coronas, A. Review and analysis of biomass gasification models. Renew. Sustain. Energy Rev. 2010, 14, 2841–2851. [Google Scholar] [CrossRef]
  32. Boerrigter, H.; Rauch, R. Review of Applications of Gases from Biomass Gasification; Report ECNRX-06-066; Energy and Research Centre of the Netherlands (ECN): Petten, The Netherlands, 2006. [Google Scholar]
  33. Habibollahzade, A.; Ahmadi, P.; Rosen, M.A. Biomass gasification using various gasification agents: Optimum feedstock selection, detailed numerical analyses and tri-objective grey wolf optimization. J. Clean. Prod. 2021, 284, 124718. [Google Scholar] [CrossRef]
  34. Njuguna, F.I.; Ndiritu, H.M.; Gathitu, B.B.; Hawi, M.; Munyalo, J.M. Experimental investigation and optimization of the gasification parameters of macadamia nutshells in a batch-fed bubbling fluidized bed gasifier with air preheating. Energy Storage Sav. 2023, 2, 559–570. [Google Scholar] [CrossRef]
  35. Campoy, M.; Gómez-Barea, A.; Villanueva, A.L.; Ollero, P. Air−Steam Gasification of Biomass in a Fluidized Bed under Simulated Autothermal and Adiabatic Conditions. Ind. Eng. Chem. Res. 2008, 47, 5957–5965. [Google Scholar] [CrossRef]
  36. Jand, N.; Brandani, V.; Foscolo, P.U. Thermodynamic Limits and Actual Product Yields and Compositions in Biomass Gasification Processes. Ind. Eng. Chem. Res. 2005, 45, 834–843. [Google Scholar] [CrossRef]
  37. Lv, P.; Chang, J.; Xiong, Z.; Huang, H.; Wu, C.; Chen, Y.; Zhu, J. Biomass Air−Steam Gasification in a Fluidized Bed to Produce Hydrogen-Rich Gas. Energy Fuels 2003, 17, 677–682. [Google Scholar] [CrossRef]
  38. Sadaka, S.S.; Ghaly, A.E.; Sabbah, M.A. Two-phase biomass air-steam gasification model for fluidized bed reactors: Part III—Model validation. Biomass Bioenergy 2002, 22, 479–487. [Google Scholar] [CrossRef]
Figure 1. Schematic representation of the biomass gasification plant.
Applsci 14 07282 g001
Figure 2. Effect of temperature (a) and ER (b) on cold gas efficiency.
Applsci 14 07282 g002
Figure 3. Effect of temperature on the molar composition of the gas for the three levels of ER studied (blue is presented in (a) (800 °C and 900 °C) and also in (c) (900 °C)).
Applsci 14 07282 g003
Figure 4. Effect of temperature on gas production for the three ER levels studied.
Applsci 14 07282 g004
Table 1. Main properties of olive cake used in this study. Data from Gálvez-Pérez et al. [3] and Quesada et al. [16].
Elemental analysis
(dry basis)
C (wt., %)44.0
H (wt., %)7.0
N (wt., %)1.1
S (wt., %)ND
Proximate analysisMoisture (wt., %)6.6
Volatile (wt., %)60.8
Fixed carbon (wt., %)22.2
Ashes (wt., %)10.4
Table 2. Effect of temperature on LHVgas and gas flow for the three ER levels studied.
Temperature, °CERLHVgas, MJ/Nm3Gas Flow
(0 °C, 1 atm), L/min
Gas Flow
(0 °C, 1 atm), L/kg Feed
CGE, %
7500.14.093.95948.022.67
0.34.089.882371.256.59
0.52.2114.893573.646.16
8000.15.113.44825.624.70
0.34.249.722332.857.83
0.52.5013.893333.648.73
8500.14.774.01962.426.90
0.34.439.842361.661.19
0.52.7913.393213.652.39
9000.15.013.88931.227.29
0.34.289.922380.859.55
0.52.8913.153156.053.38
Table 3. Effect of temperature on production of H2, CO, and CH4 for the three ER levels studied.
T, °CERYield, g/kg
YH2YCOYCH4
7500.17.17136.1732.55
0.313.37318.0096.48
0.59.02309.0873.25
8000.16.01174.6334.50
0.39.81579.4856.69
0.56.99537.6340.89
8500.17.34183.8536.93
0.311.63544.9870.66
0.59.74560.3242.18
9000.17.15190.8437.30
0.312.70602.4850.95
0.57.90579.2346.18
Table 4. Yield of solid and liquid residues and mass balance data (data in g per kg of olive cake).
T, °CERInput Output
Gas, g/kgSolid, g/kgTotal, g/kgGas, g/kgLiquid, g/kgSolid, g/kgTotal, g/kg
7500.17121000171212272111441582
7500.319651000296530231631333319
7500.531901000419045591271254811
8000.16551000165511201871321439
8000.319651000296528571491143120
8000.531901000419043181111174546
8500.17121000171213431911261671
8500.319651000296528801351213136
8500.532191000421941631001124375
9000.17411000174112841631331580
9000.319941000299428671281093104
9000.53190100041904087791064272
Disclaimer/Publisher’s Note: The statements, opinions and data contained in all publications are solely those of the individual author(s) and contributor(s) and not of MDPI and/or the editor(s). MDPI and/or the editor(s) disclaim responsibility for any injury to people or property resulting from any ideas, methods, instructions or products referred to in the content.

