Abstract
Ground settlement resulting from consolidation may lead to tilted buildings, cracks in the pavement, damage to underground utilities, etc. Therefore, it is crucial to understand the consolidation behaviors (including primary consolidation and secondary compression) of the soil of the subgrade. There is a large amount of soft clay deposited in Nanjing, located in the Yangtze River Basin. The consolidation behavior of Nanjing soft clay can significantly affect foundation design and the cost of construction. In this study, experimental measurements of the consolidation behavior of Nanjing soft clay were conducted, and parameters (such as pre-consolidation pressure, secondary consolidation index and secondary consolidation ratio) related to consolidation were assessed. The concept of simulated over-consolidation ratio (OCRs) was proposed, and the close relationship between primary consolidation and secondary compression settlement and the OCRs of Nanjing clay was investigated.
1. Introduction
The consolidation of soft clay may result in different construction problems, such as ground settlement, building tilting and damage to underground utilities. Soft clay is commonly characterized with high compressibility, high natural water content and low shear strength. Foundations with soft clay may experience extreme settlement with time, which in turn may have negative impacts on the stability of buildings and their foundations. Moreover, Nanjing is located in the lower reaches of the Yangtze River and is part of the Yangtze River valley, which is located in a low mountainous hilly area [1]. In Nanjing, buildings are commonly constructed on the subgrade, which is not fully consolidated, and ground settlement continues after residents move in. As a result, it is crucial for design engineers to understand the consolidation behavior (including primary consolidation and secondary compression) of soft clay to assess the stability of designed facilities. In this study, the consolidation behaviors of soft clay in Nanjing were investigated using oedometer tests of different soil specimens taken in Pukou, in Nanjing.
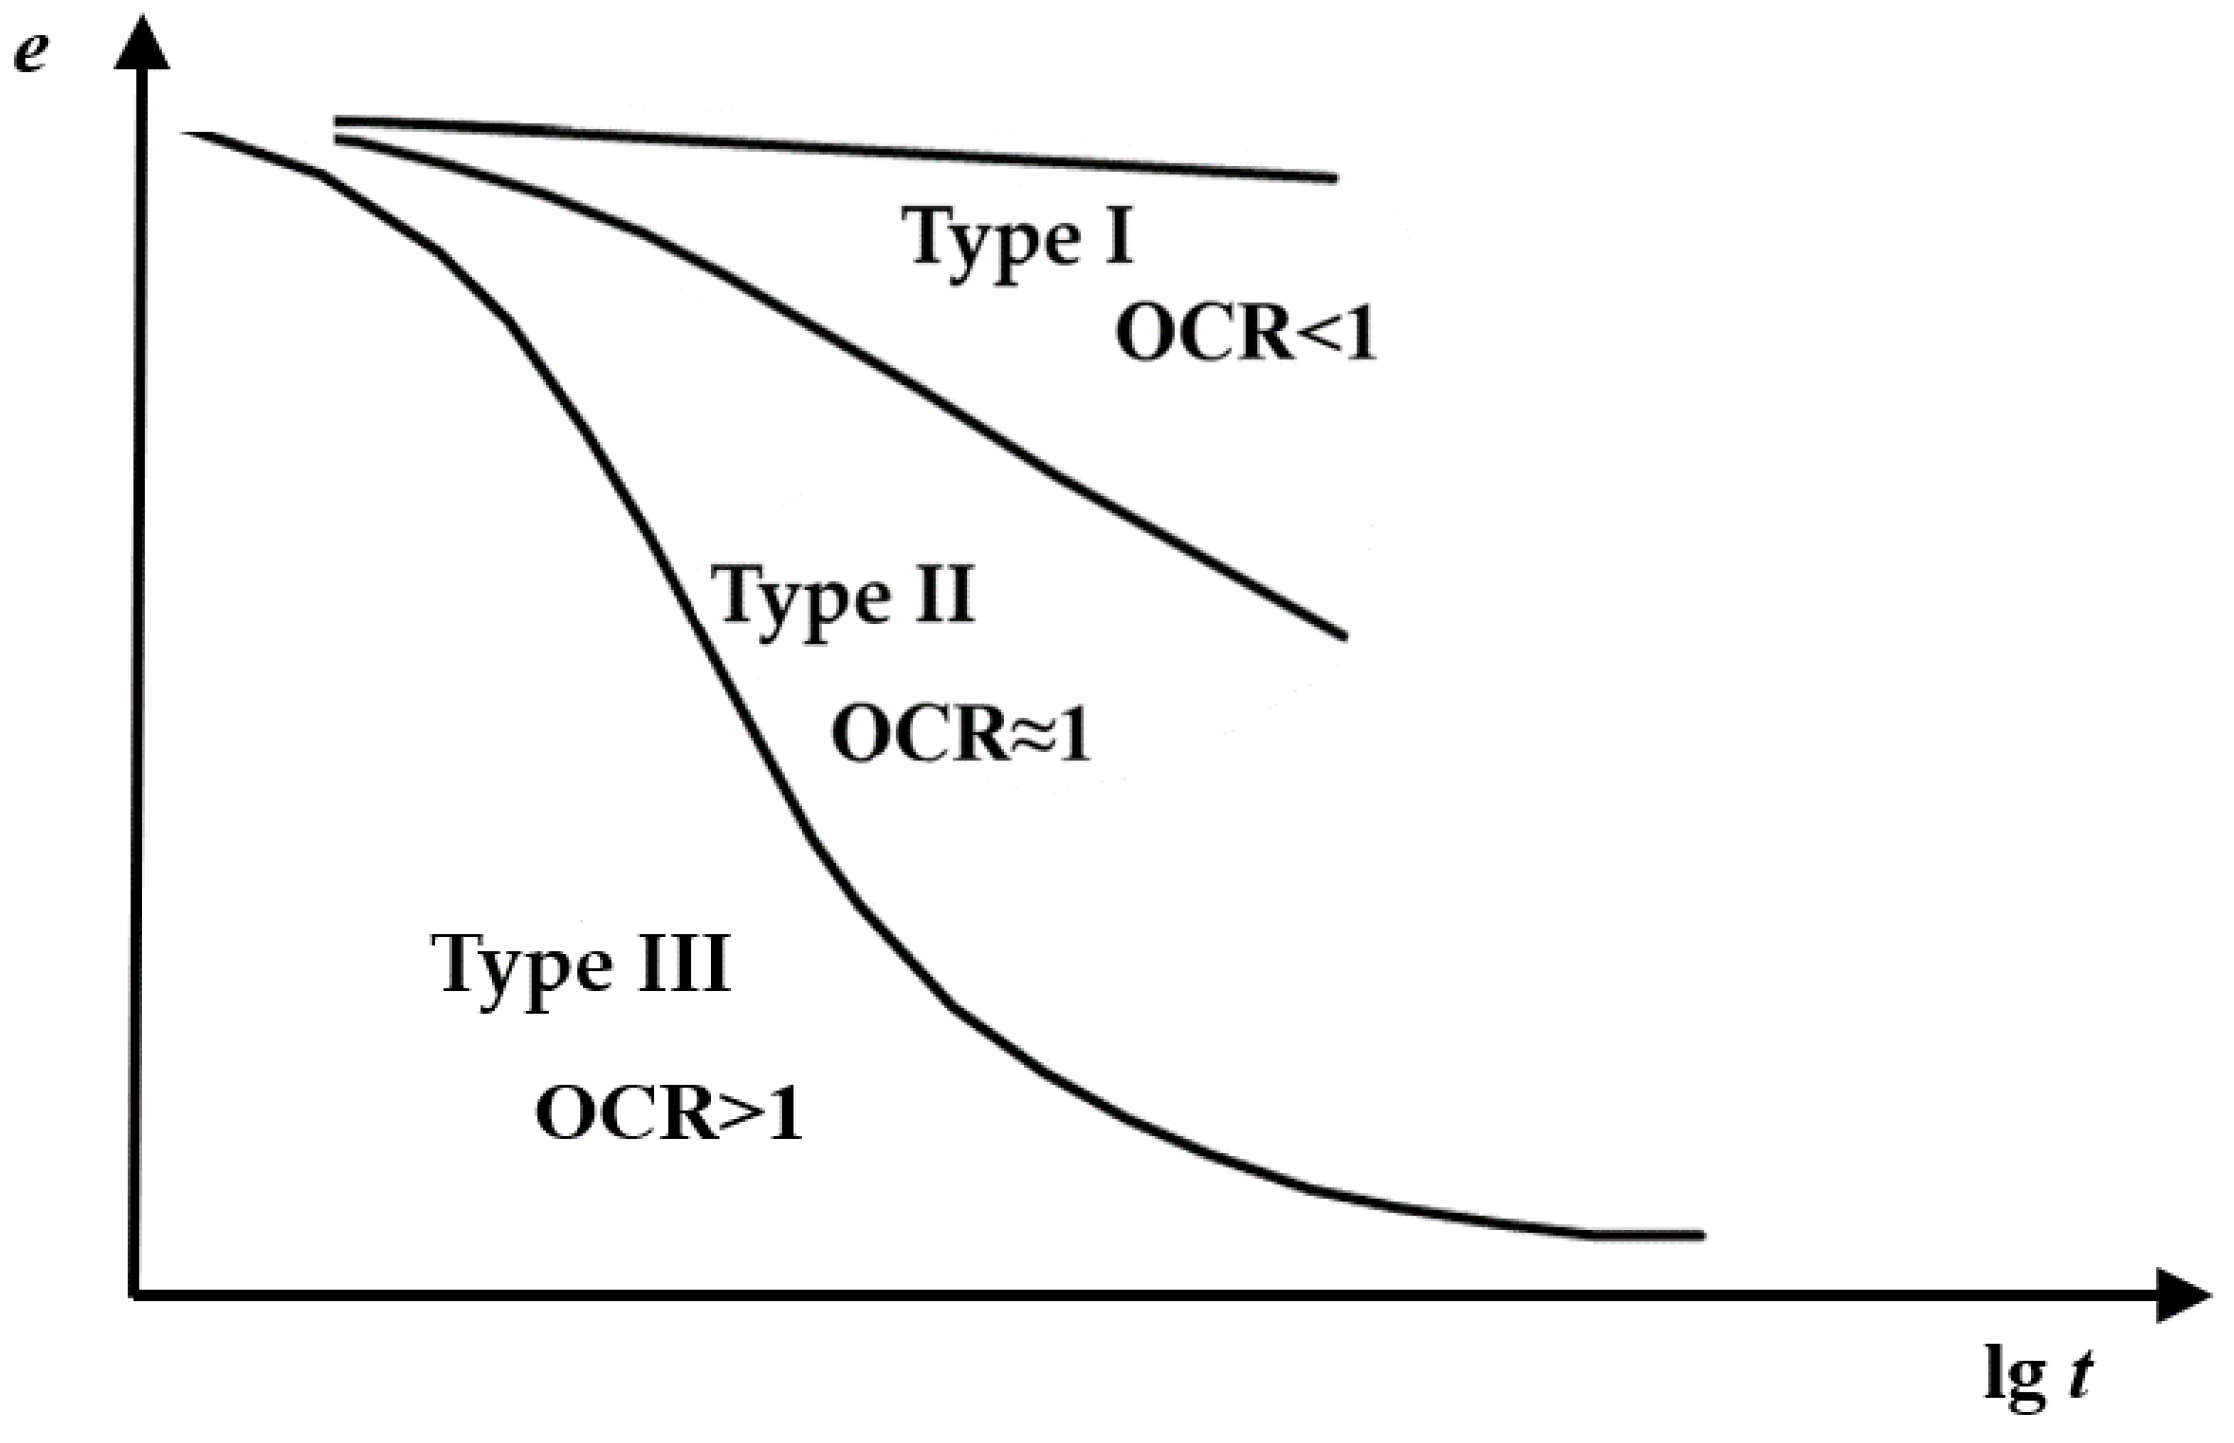
Kie [2] proposed a rheological constitutive equation from both macro and micro perspectives, along with the quadratic time effect and the frame-by-frame theory, in a representation of the consolidation behavior of soft clay. Terzaghi’s one-dimensional consolidation theory suggests that deformations after the inflection point of the logarithmic time-deformation curve are primarily due to secondary compression deformation. Currently, there are two main hypotheses regarding the relationship between soil creep and primary consolidation and secondary compression. There are debates on the mechanism of consolidation, which consist of primary consolidation and secondary compression: (1) Mesiri and Choi [3] consider that secondary compression occurs after the pore water is drained, with a temporal precedence relationship to primary consolidation; (2) Mitchell et al. [4] consider that primary consolidation and secondary compression occur simultaneously. Leroueil et al. [5] suggested that, based on one-dimensional creep test results using Batiscan clay at different vertical stress levels, as shown in Figure 1, the relationship between creep strain and time can be summarized into three types. Type I corresponds to over-consolidated soil, where the vertical consolidation pressure is less than the pre-consolidation pressure, with no obvious intersection between primary consolidation and secondary compression. Type II and Type III both exhibit a more distinct intersection of primary consolidation and secondary compression settlement. Type II corresponds to normally consolidated soil in which the vertical consolidation pressure is close to the pre-consolidation pressure, and the slope of the secondary compression line is significantly greater than that of Type I. Type III corresponds to over-consolidated soil in which the vertical consolidation pressure is much greater than the pre-consolidation pressure, and the vertical deformation of the soil specimen decreases gradually with time in a clear inverted S-shape.

Figure 1.
Illustration of different types of creeping behavior for Batiscan clay from Leroueil et al. [5], where Type I corresponds to over-consolidated soil, Type II corresponds to normally consolidated soil, and Type III corresponds to over-consolidated soil.
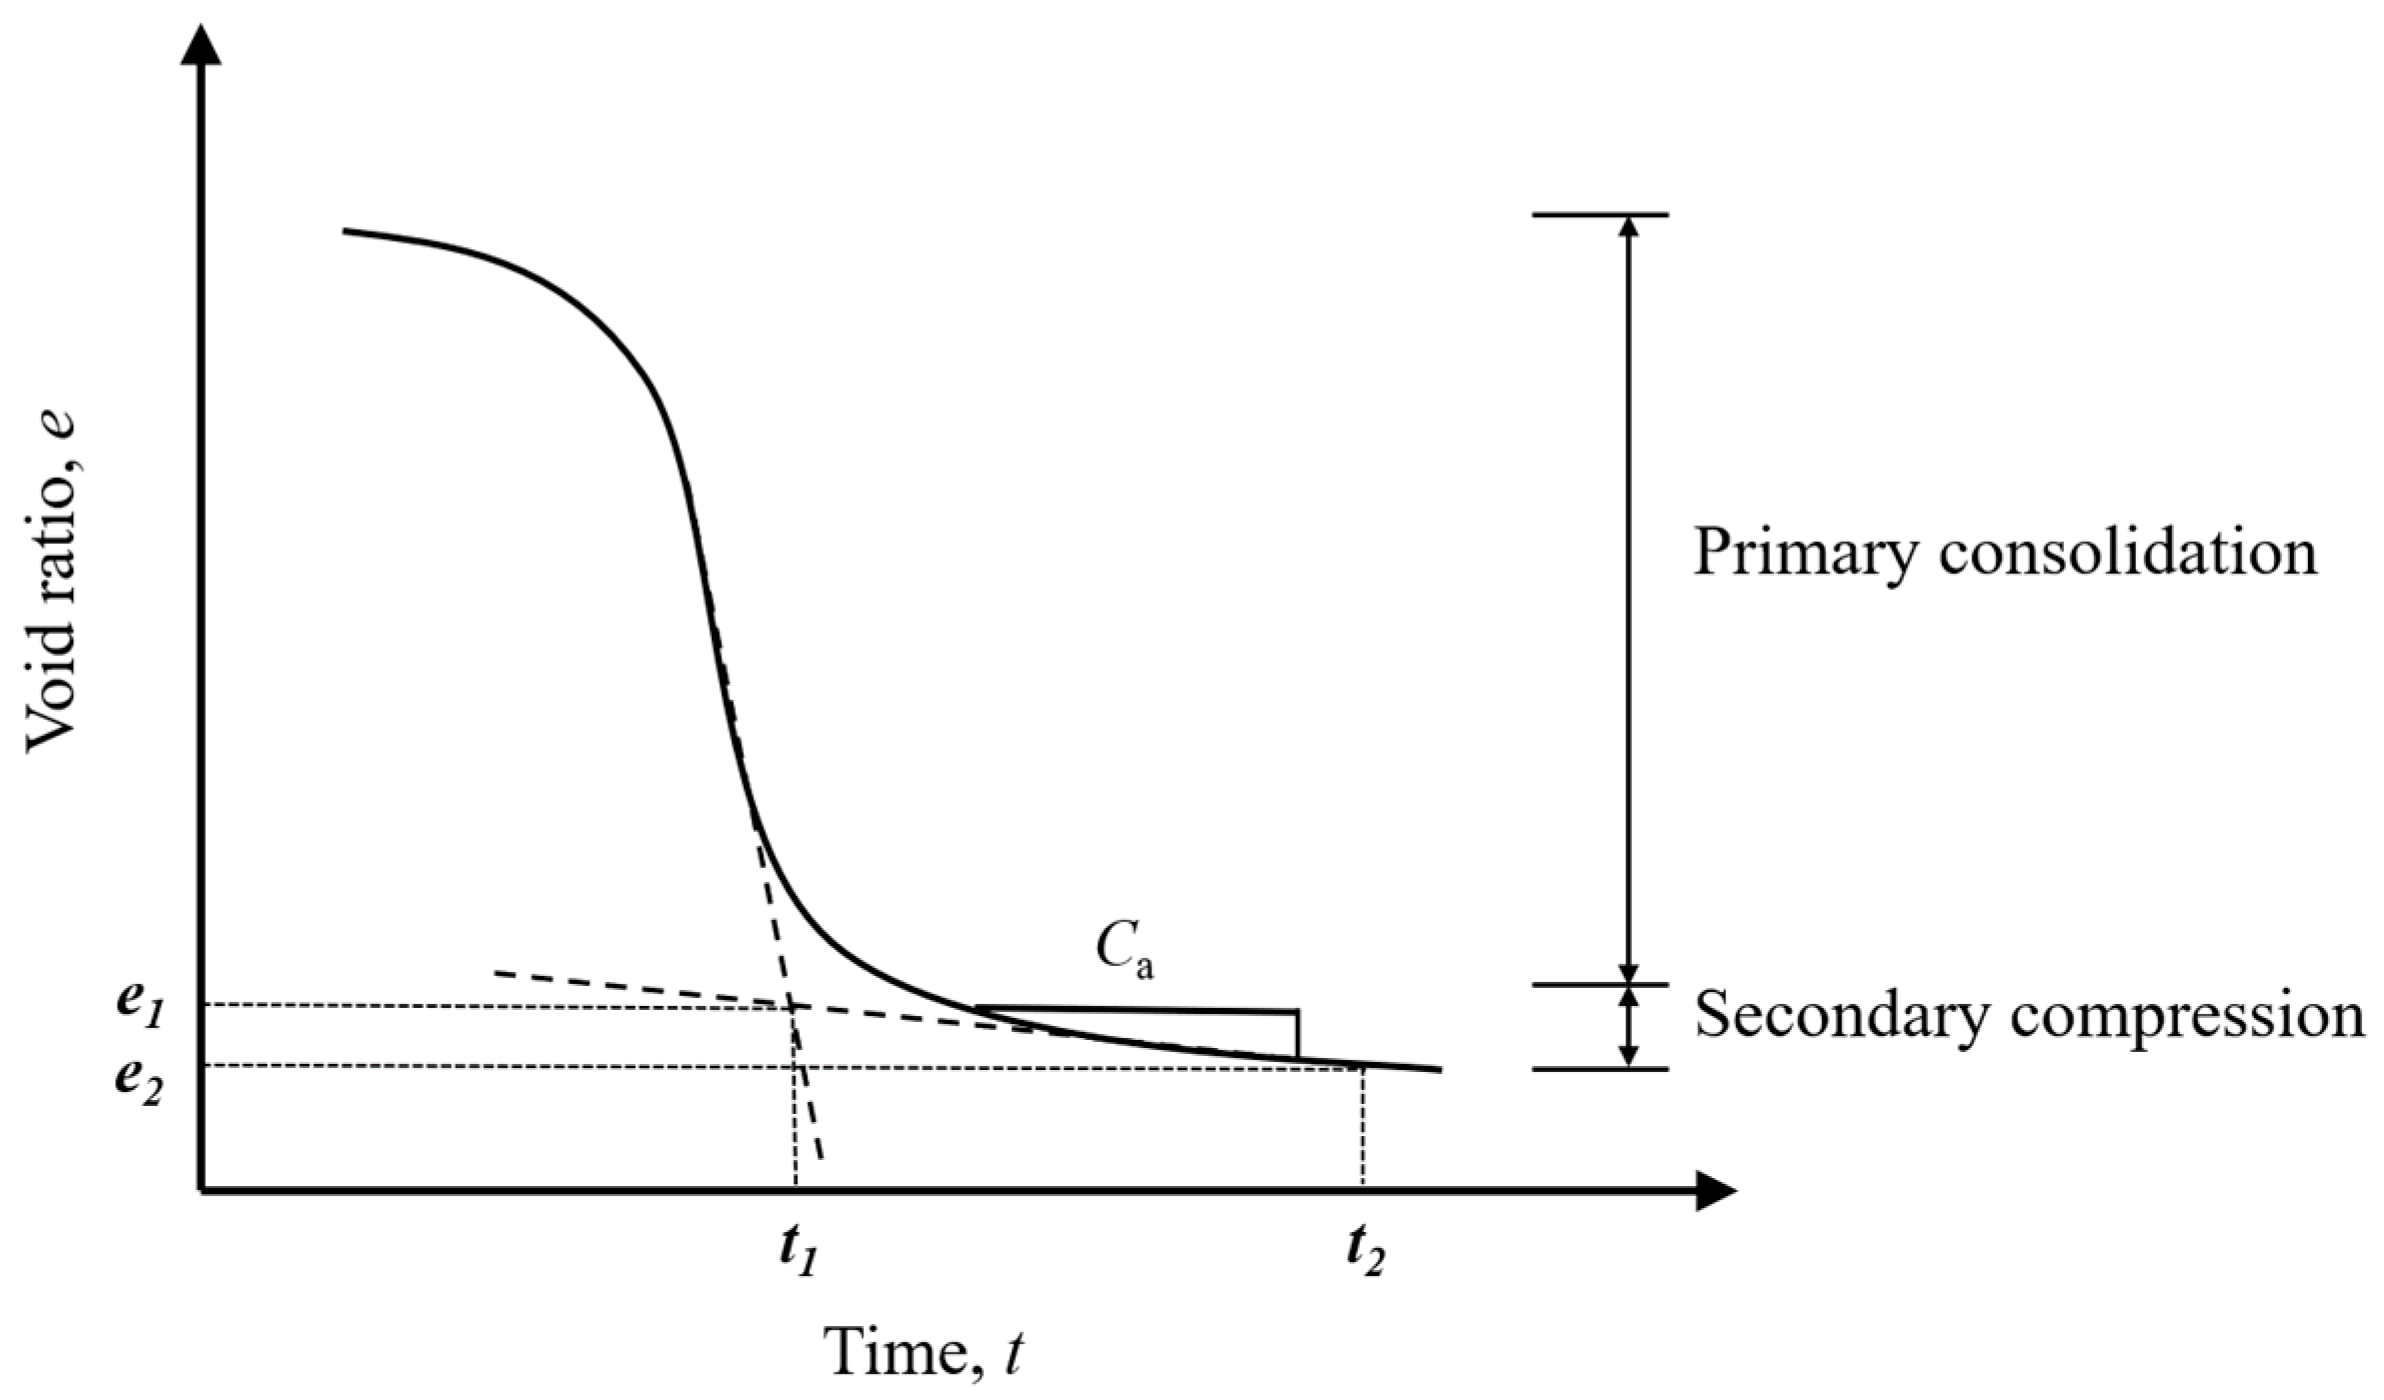
The one-dimensional oedometer is one type of equipment commonly used to investigate the consolidation behavior of clay soil. As shown in Figure 2, experimental data of a long-duration consolidation creep test using an oedometer shows an inverted S-shape. From the results of the one-dimensional oedometer test, both the compression index Cc and the secondary compression ratio Ca can be determined.

Figure 2.
Division of primary consolidation and secondary compression.
The compression index Cc can be calculated following The Standard for Soil Test Methods (GBT50213-2019) [6], as illustrated in Equation (1):
where Cc is the compression index; pi and pi+1 are the pressure values of a certain unit, and ei and ei+1 represent the void ratios corresponding to pressures pi and pi+1, respectively.
Taylor and Merchant [7] first considered the secondary compression of soils, and initially proposed the concept of the secondary compression ratio Ca for the definition of the plasticity of the soil. Taylor and Merchant [7] also proposed a mathematical model for the determination of Ca. Casagrande and Fadum [8] suggested a graphical method for the determination of Ca, and the steps in this graphical method were introduced as follows:
- (1)
- Extend the straight sections in the middle and end parts of the curve;
- (2)
- Determine the intersection point of the extended lines, and the horizontal coordinate of this point represents the boundary time between primary consolidation and secondary compression. Time point t1 in the figure corresponds to the end of primary consolidation, while subsequent times correspond to secondary compression deformation.
- (3)
- Calculate the slope of the line passing through points corresponding to t1 and t2, which represents the sought-after coefficient for secondary compression settlement.
Consequently, Ca can be defined using Equation (2), as follows:
where Ca is the secondary compression ratio; t2 represents the end time of the test, t1 denotes the primary consolidation time; and e1 and e2 represent the void ratios corresponding to times t1 and t2, respectively.
Mesri [9] analyzed the results of one-dimensional consolidation creep tests for 22 types of undisturbed cohesive soils from the published literature, and observed a linear relationship between the secondary compression ratio Ca and the compression index Cc. Mesri [9] indicated that the values of Ca/Cc varied from 0.025 to 0.100, and that a higher organic content in the soil resulted in a greater value of Ca/Cc. Zhou and Chen [10] conducted a series of consolidation tests on the undisturbed soft soil in Guangzhou, and observed that the loading ratio had a certain impact on the differentiation of the primary consolidation and secondary compression of soft soil. The value of Ca primarily varied with increases in the net stress, and it was also observed that when the stress increased beyond the pre-consolidation pressure, Ca/Cc approached a constant value of 0.03. Cao [11] indicated that the value of Ca increased linearly with increases in water content. Yu et al. [12] indicated that the value of Ca increased with increases in the applied load for over-consolidated soil, while the value of Ca decreased with increases in the applied load for normally consolidated soil. Wu et al. [13] indicated that the level of perceptibility of the endpoint of primary consolidation in the e-lgt curves of soil increased with the value of the consolidation pressure. Zhu [14] indicated that the value of Ca for the soft soil in Shanghai increased with increases in moisture content, void ratio and time, and as time increased, the rate of increase of Ca gradually decreased, and eventually stabilized.
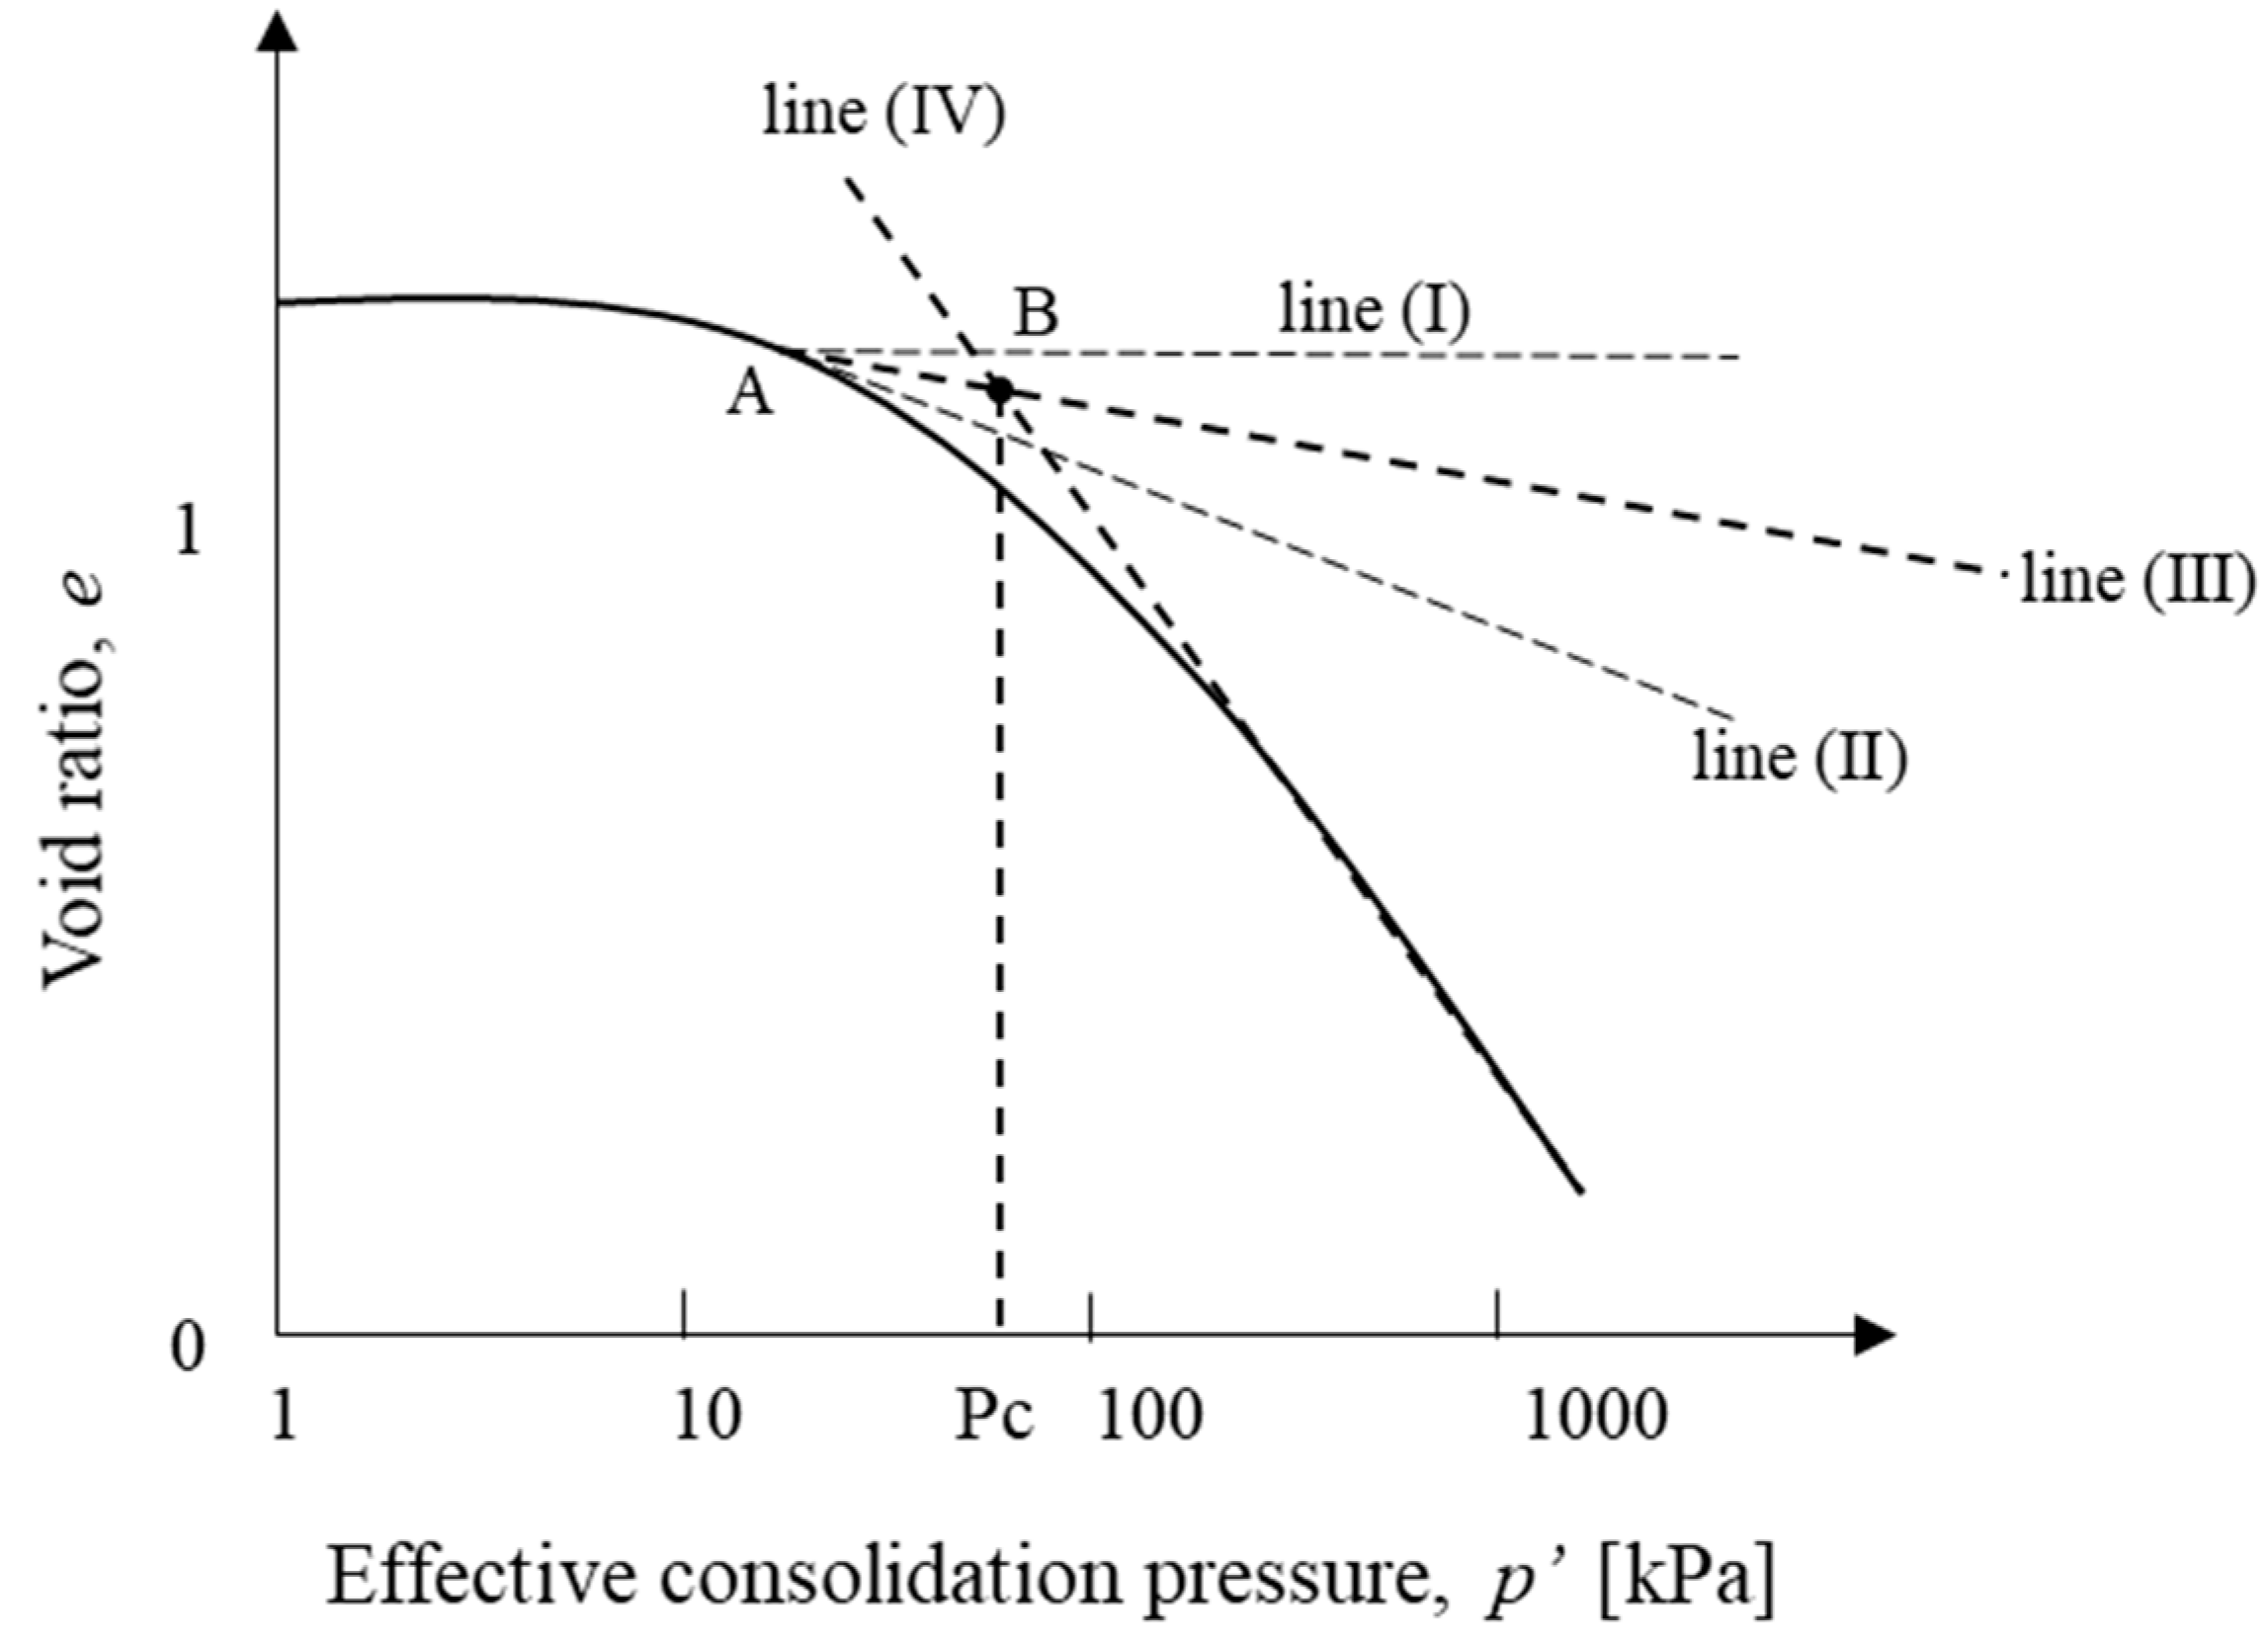
Meanwhile, Becker et al. [15] and Conte et al. [16] concluded that Casagrande’s [17] method, illustrated in Figure 3, is relatively stronger in immunizing the effects of human subjectivity in the determination of pre-consolidation pressure Pc. There are three major steps, introduced as follows, in Casagrande’s [17] method for the determination of Pc.

Figure 3.
Determination of pre-consolidation pressure suggested by Casagrande [17].
- (1)
- Locate point A on the curve with the minimum radius of curvature;
- (2)
- Draw a horizontal line (I) and a tangent line (II) through this point, and determine the bisecting line (III) of these two lines;
- (3)
- Find the straight part in the high pressure range, and extend it so that line IV and line III cross each other. The pressure corresponding to the intersection (point B) of line III and line IV defines Pc.
It has been observed that the determination of the point with the minimum radius of curvature (Pi) using visual judgement in conventional graphical methods is subjective, and may result in uncertainty regarding the determined Pc. Zhai et al. [18] best fitted experimental data from an oedometer test using Fredlund and Xing’s [19] model, as illustrated in Equation (3), and proposed a mathematical equation for the determination of the point with minimum curvature.
where af, mf and nf are fitting parameters [19], e0 represents the initial void ratio, p’ is effective stress and e is the natural constant.
After the compression curve is defined using Equation (3), the pre-consolidation pressure can be computed directly using an equation from Zhai et al. [18], as illustrated in Equation (4).
where definitions of parameters p1, pn′, k3, kn, e1 and en can be found in Zhai et al. [18].
2. Experimental Program
2.1. One-Dimensional Compression Test
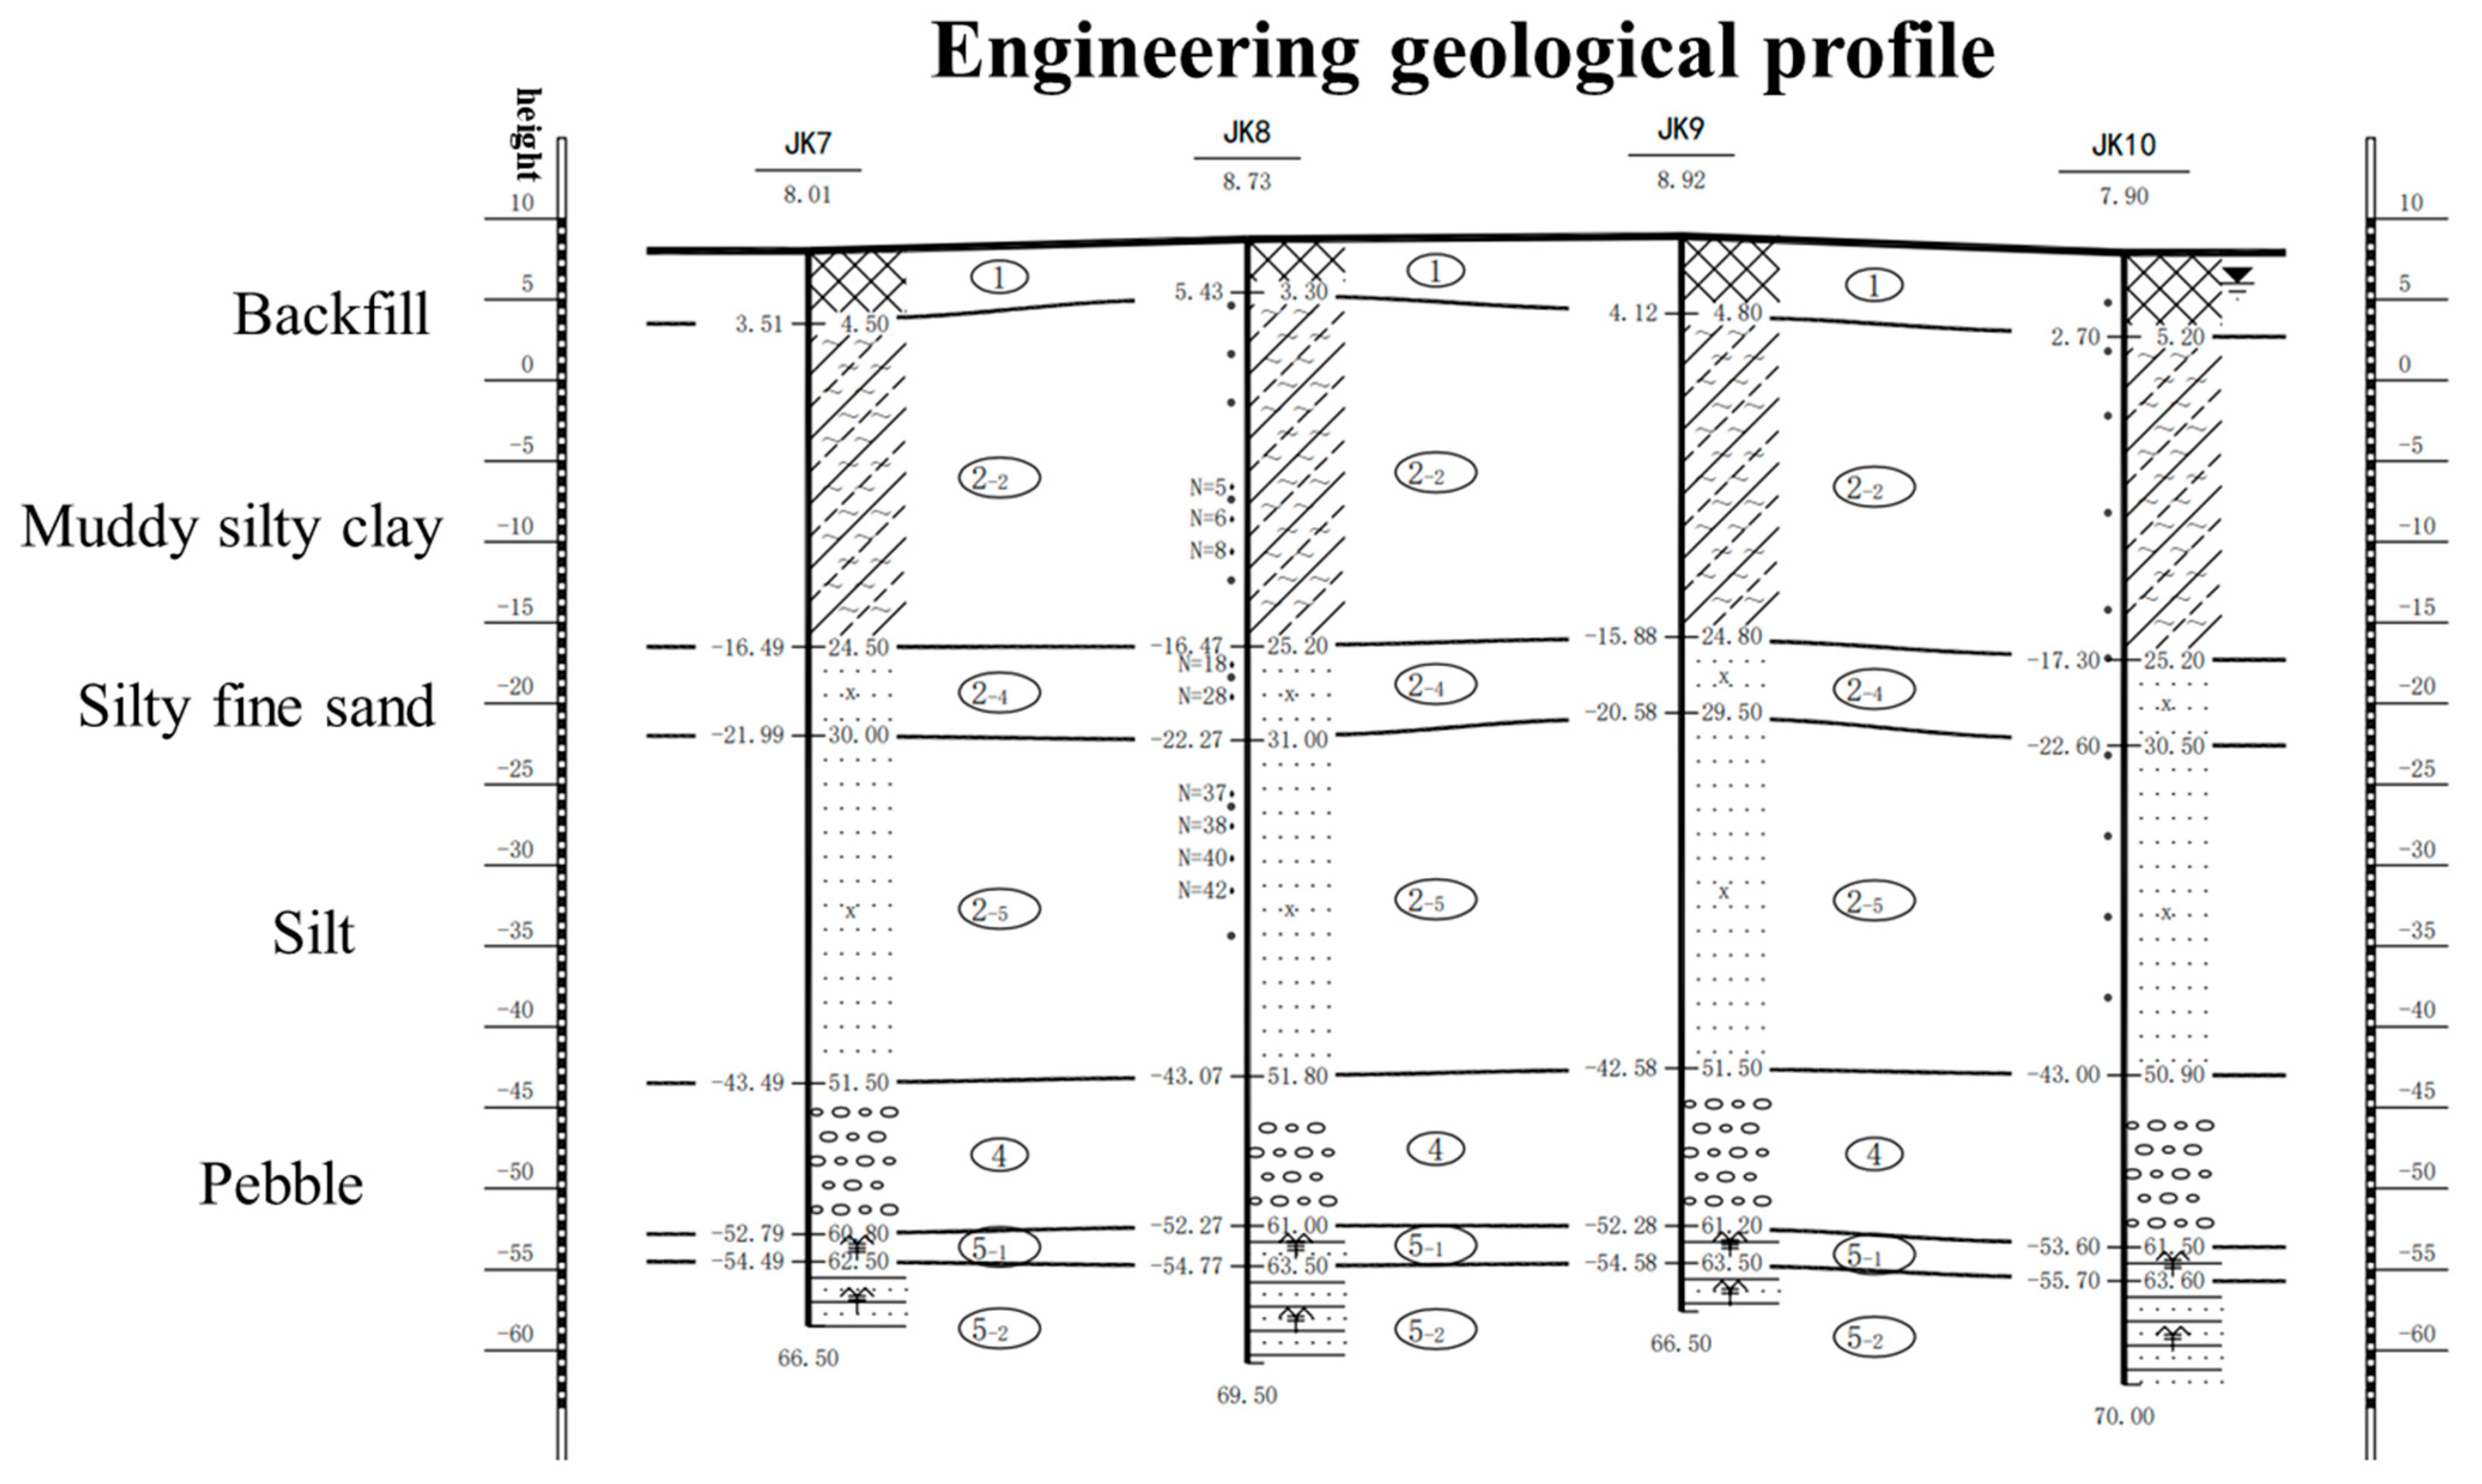
Soil specimens were taken from the muddy silty clay layer at the construction site, with depths varying from 8 to 20 m, as shown in Figure 4.
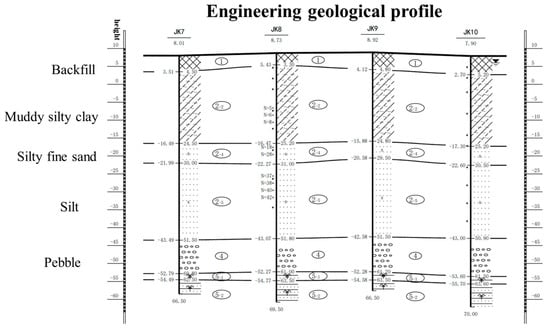
Figure 4.
Soil strata from the soil investigation report.
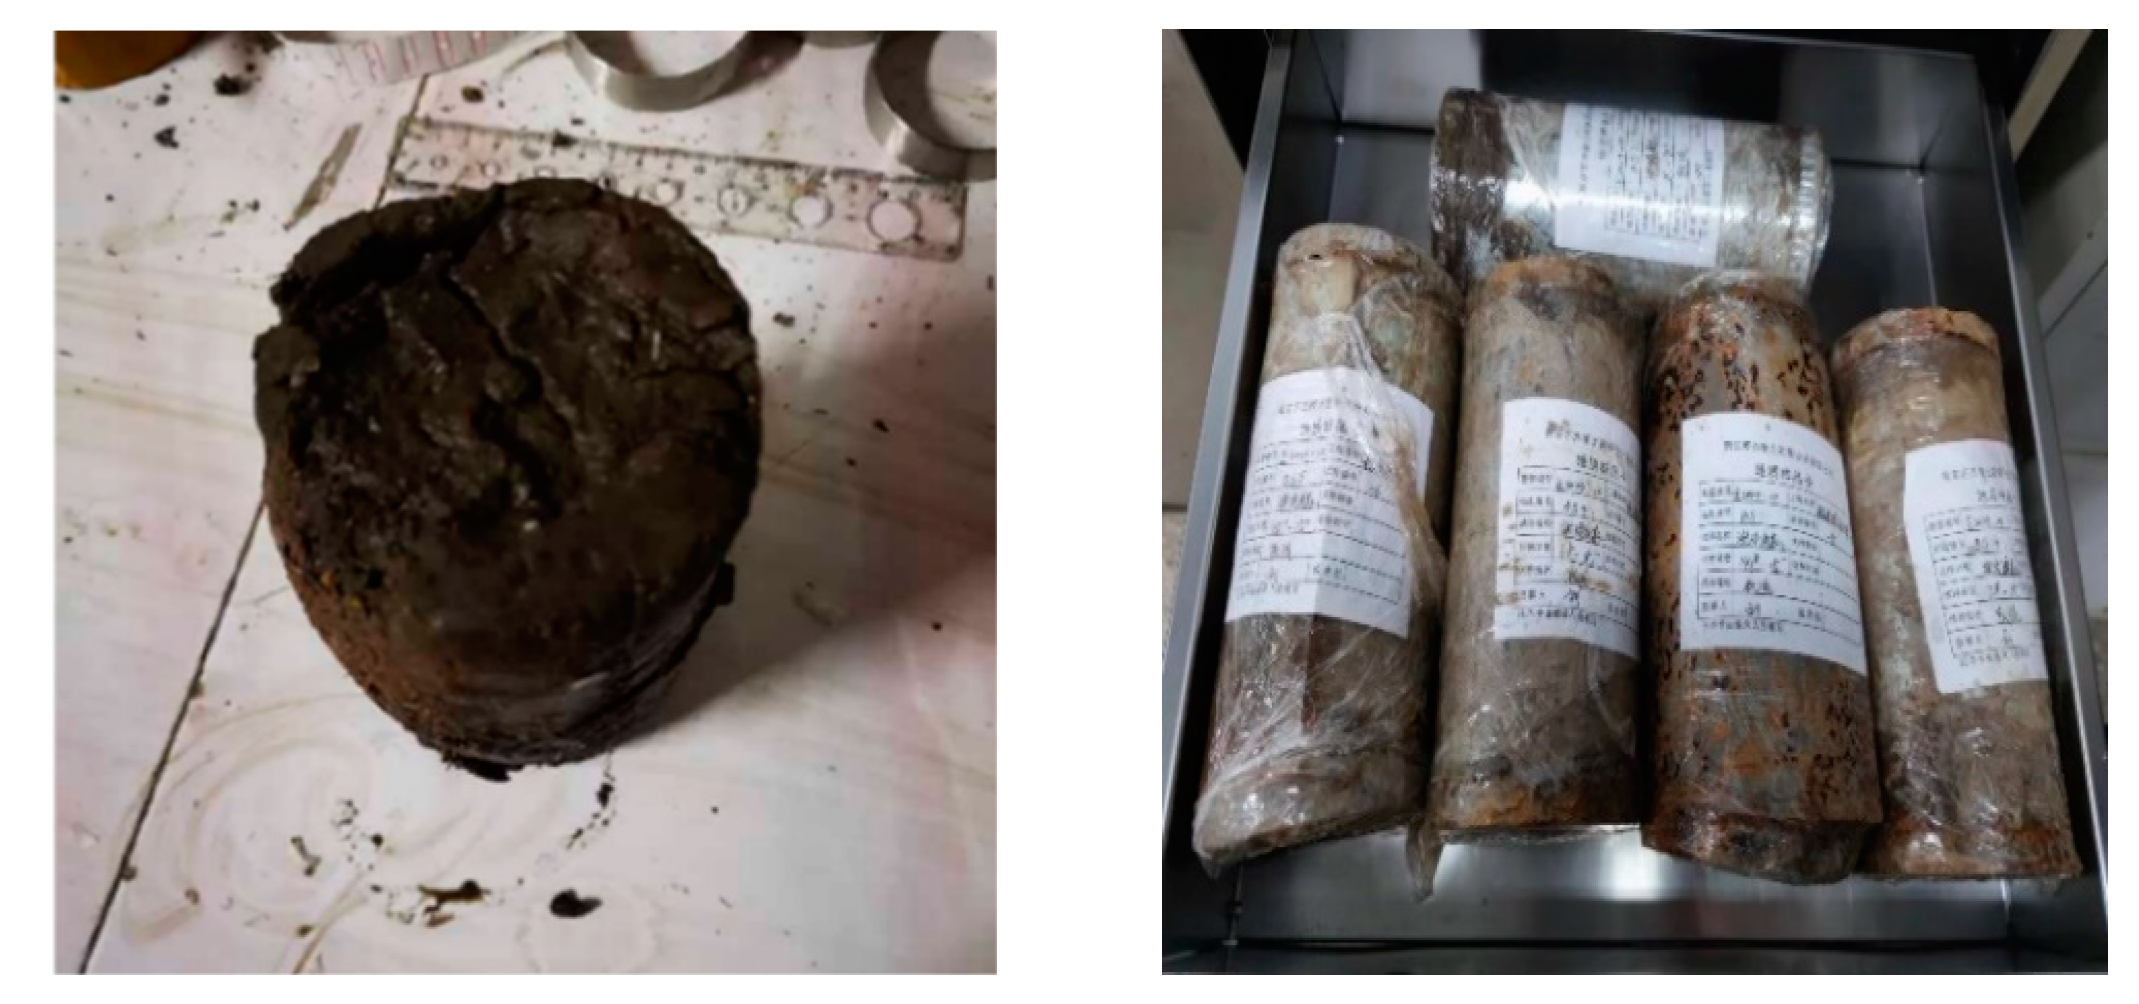
After soil samples were taken in the field, they were immediately wrapped with tape and sealed with wax to minimize disturbance to the specimens during transportation and testing. These soil samples were a typical coastal water rich soft soil, mainly composed of clay and silty clay, which is gray to grayish brown and plastic, as shown in Figure 5. Table 1 illustrates the index properties of soils at different depths.
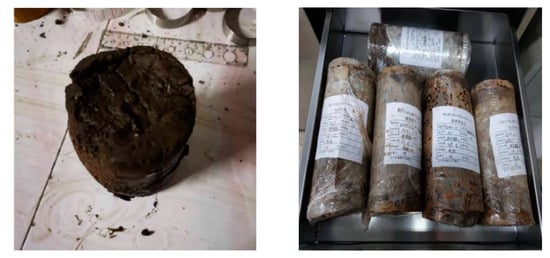
Figure 5.
Undisturbed soil specimens collected from site.

Table 1.
Index properties of soils at different depths.
2.2. Measurement Equipment
The sixteen-oedometer combined equipment, as illustrated in Figure 6, which was manufactured by Nanjing Soil Instrument Factory Co., Ltd. (Nanjing, China), was adopted for the one-dimensional consolidation tests. Using this combined equipment, specimens from the same soil sample could be simultaneously tested using different loading. The height and cross-area of soil specimens were 20 mm and 30 cm2, respectively.
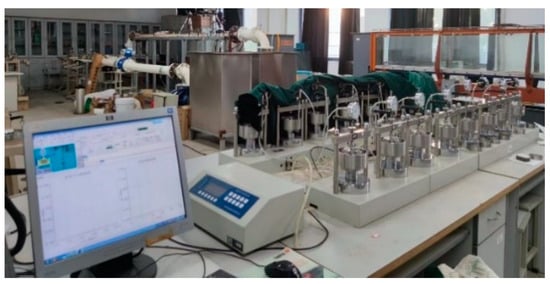
Figure 6.
Image of the one-dimensional oedometer.
2.3. Experimental Methodology
Oedometer tests were conducted following procedures described in The Standard for geotechnical testing method (GB/T 50213-2019) [6]. There were seven different loads, including 25 kPa, 50 kPa, 100 kPa, 200 kPa, 400 kPa, 800 kPa and 1600 kPa, applied to obtain the compression curve. The next level of load was applied only when the equilibrium of the previous stage was reached. The equilibrium condition was defined as the deformation of the specimen being less than 0.005 mm/d. The loading scheme for the oedometer is illustrated in Table 2.
Table 2.
Loading scheme for the oedometer test.
2.4. Specimen Preparation and the Oedometer Test
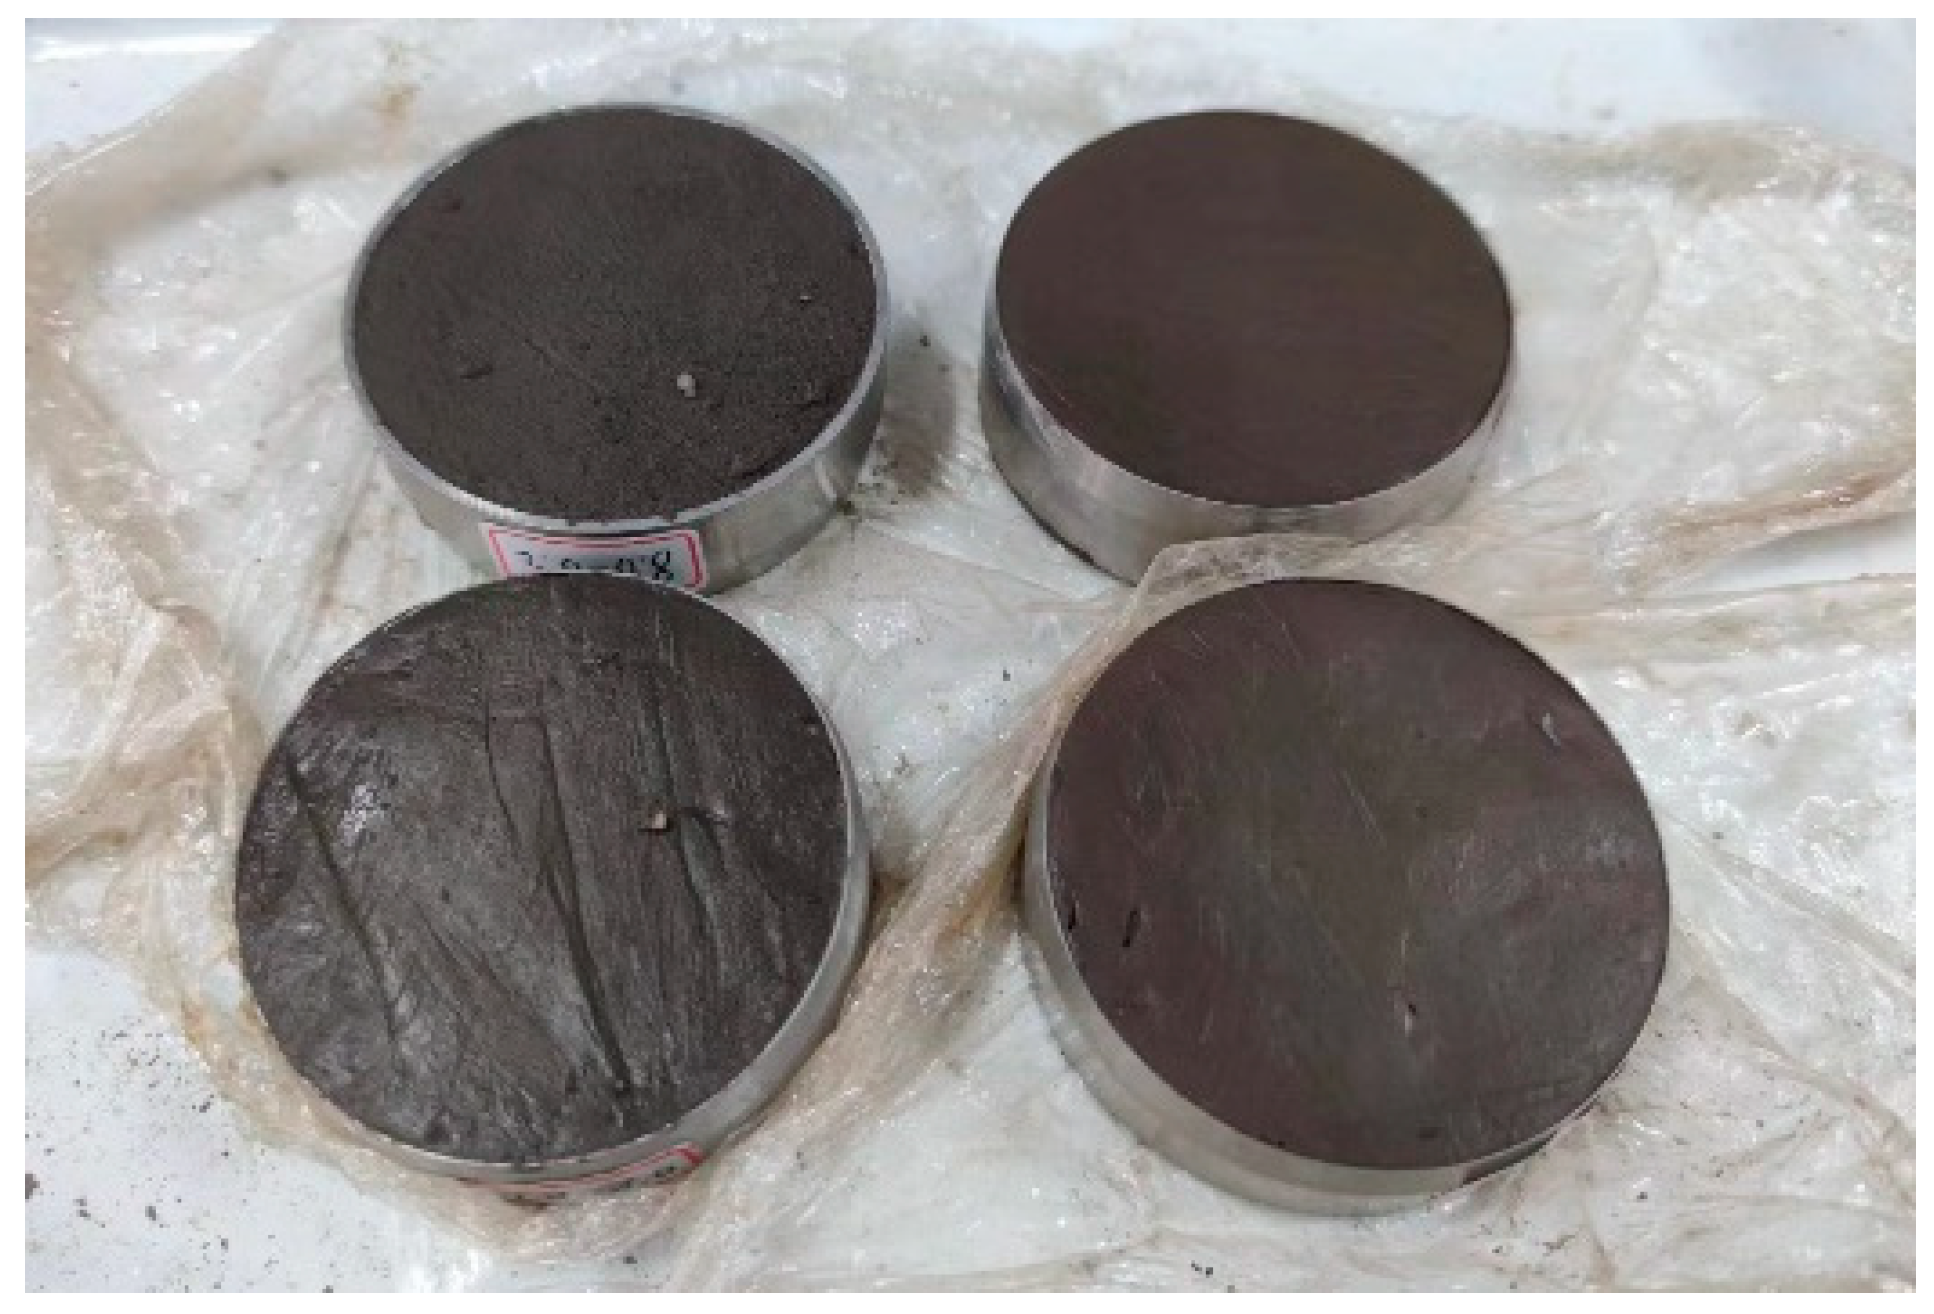
A thin sharp knife was used to prepare soil specimens to fit into the ring for the oedometer test. Prepared specimens for the oedometer test are illustrated in Figure 7.
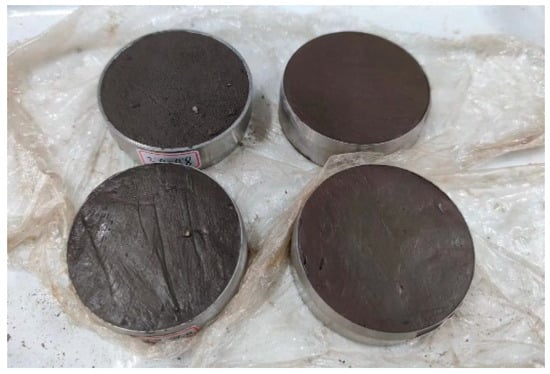
Figure 7.
Four specimens prepared for the oedometer test.
To prevent water loss due to evaporation, all specimens were covered with black plastic bags, as shown in Figure 8. In the experiment, all test data were automatically recorded by the automatic consolidator, and the next level of load was manually applied when the equilibrium condition was reached.
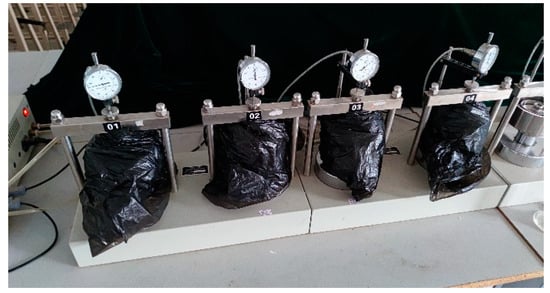
Figure 8.
Moisturizing measures.
3. Results and Discussions
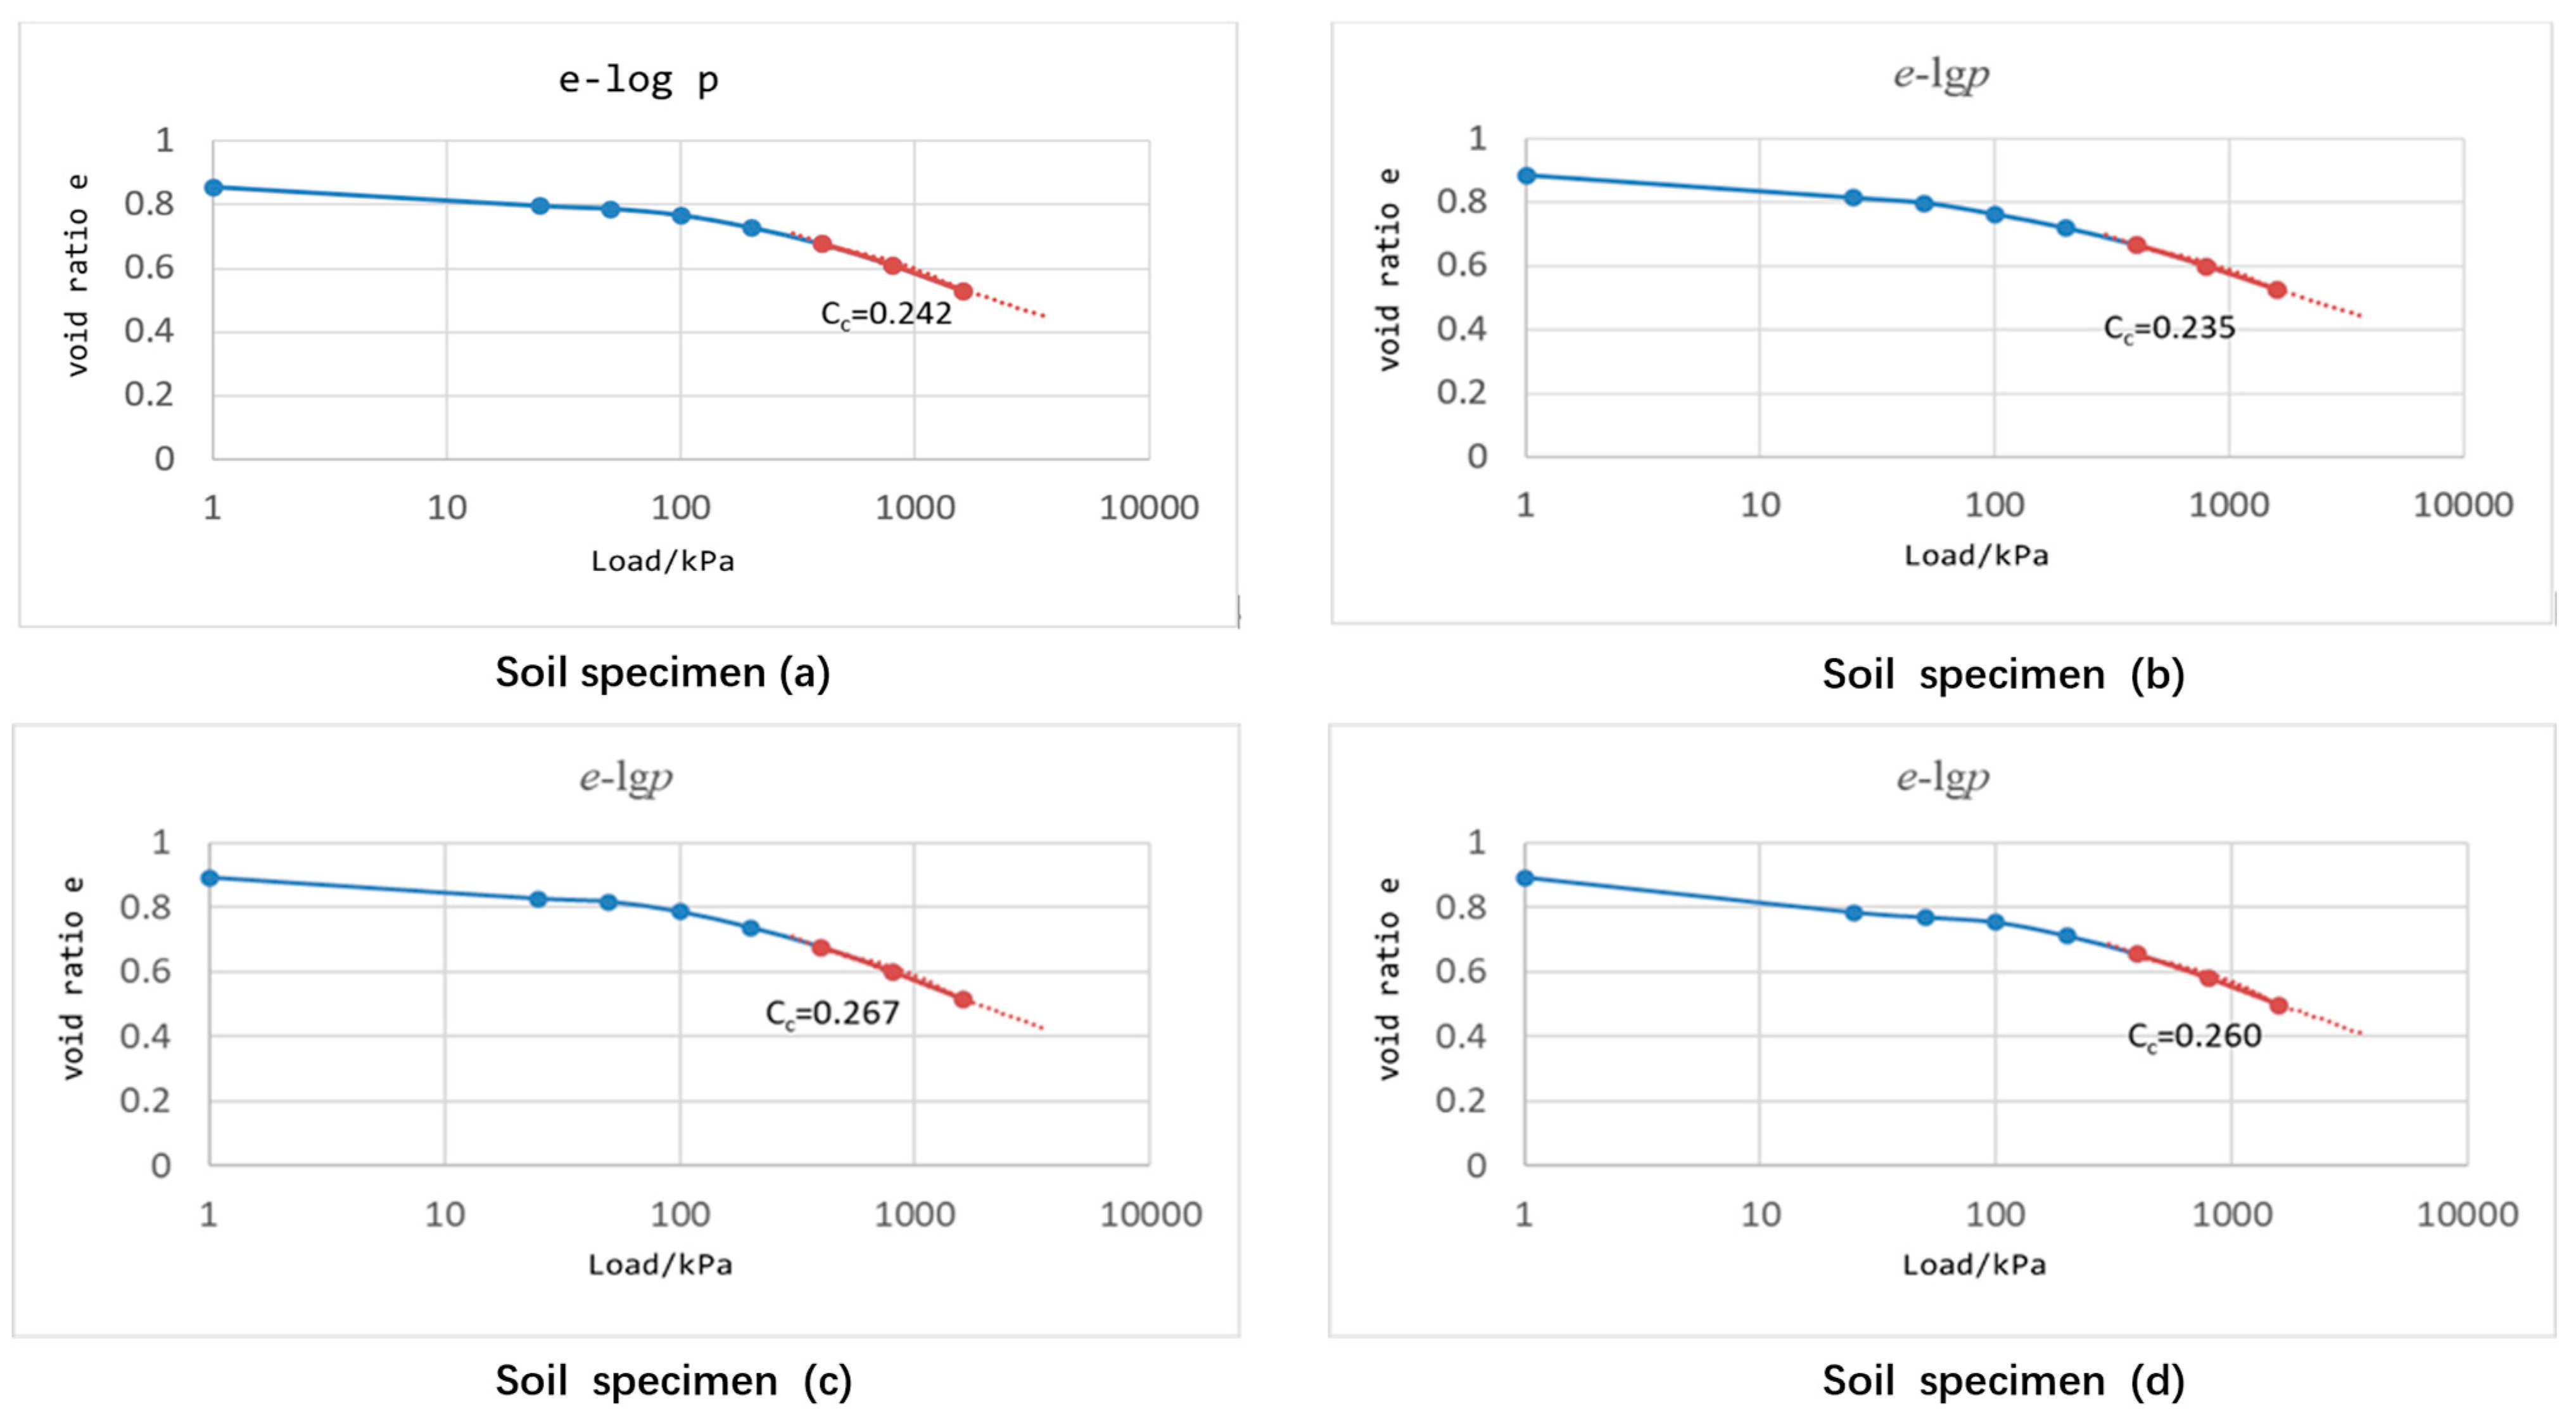
The obtained compression curves for the four specimens are illustrated in Figure 9. Experimental data were used to best fit with Equation (3). Subsequently, the pre-consolidation pressure for each specimen was computed using Zhai et al. [18]’s method, as illustrated in Table 3.
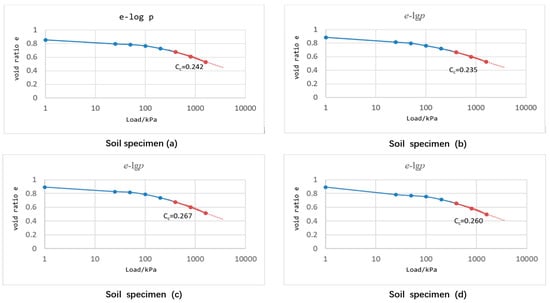
Figure 9.
Compression curves for four specimens.
Table 3.
The pre-consolidation stress of specimens.
The obtained pc, as shown in Table 3, agreed well with data from the soil investigation report. Variation in the pc, as shown in Table 3, may have been due to soil disturbance, as explained by Brumund et al. [20].
Values of Cc for different specimens, computed from experimental data illustrated in Figure 9 using Equation (1), are illustrated in Table 4.
Table 4.
Determined results of Cc for soil from different specimens.
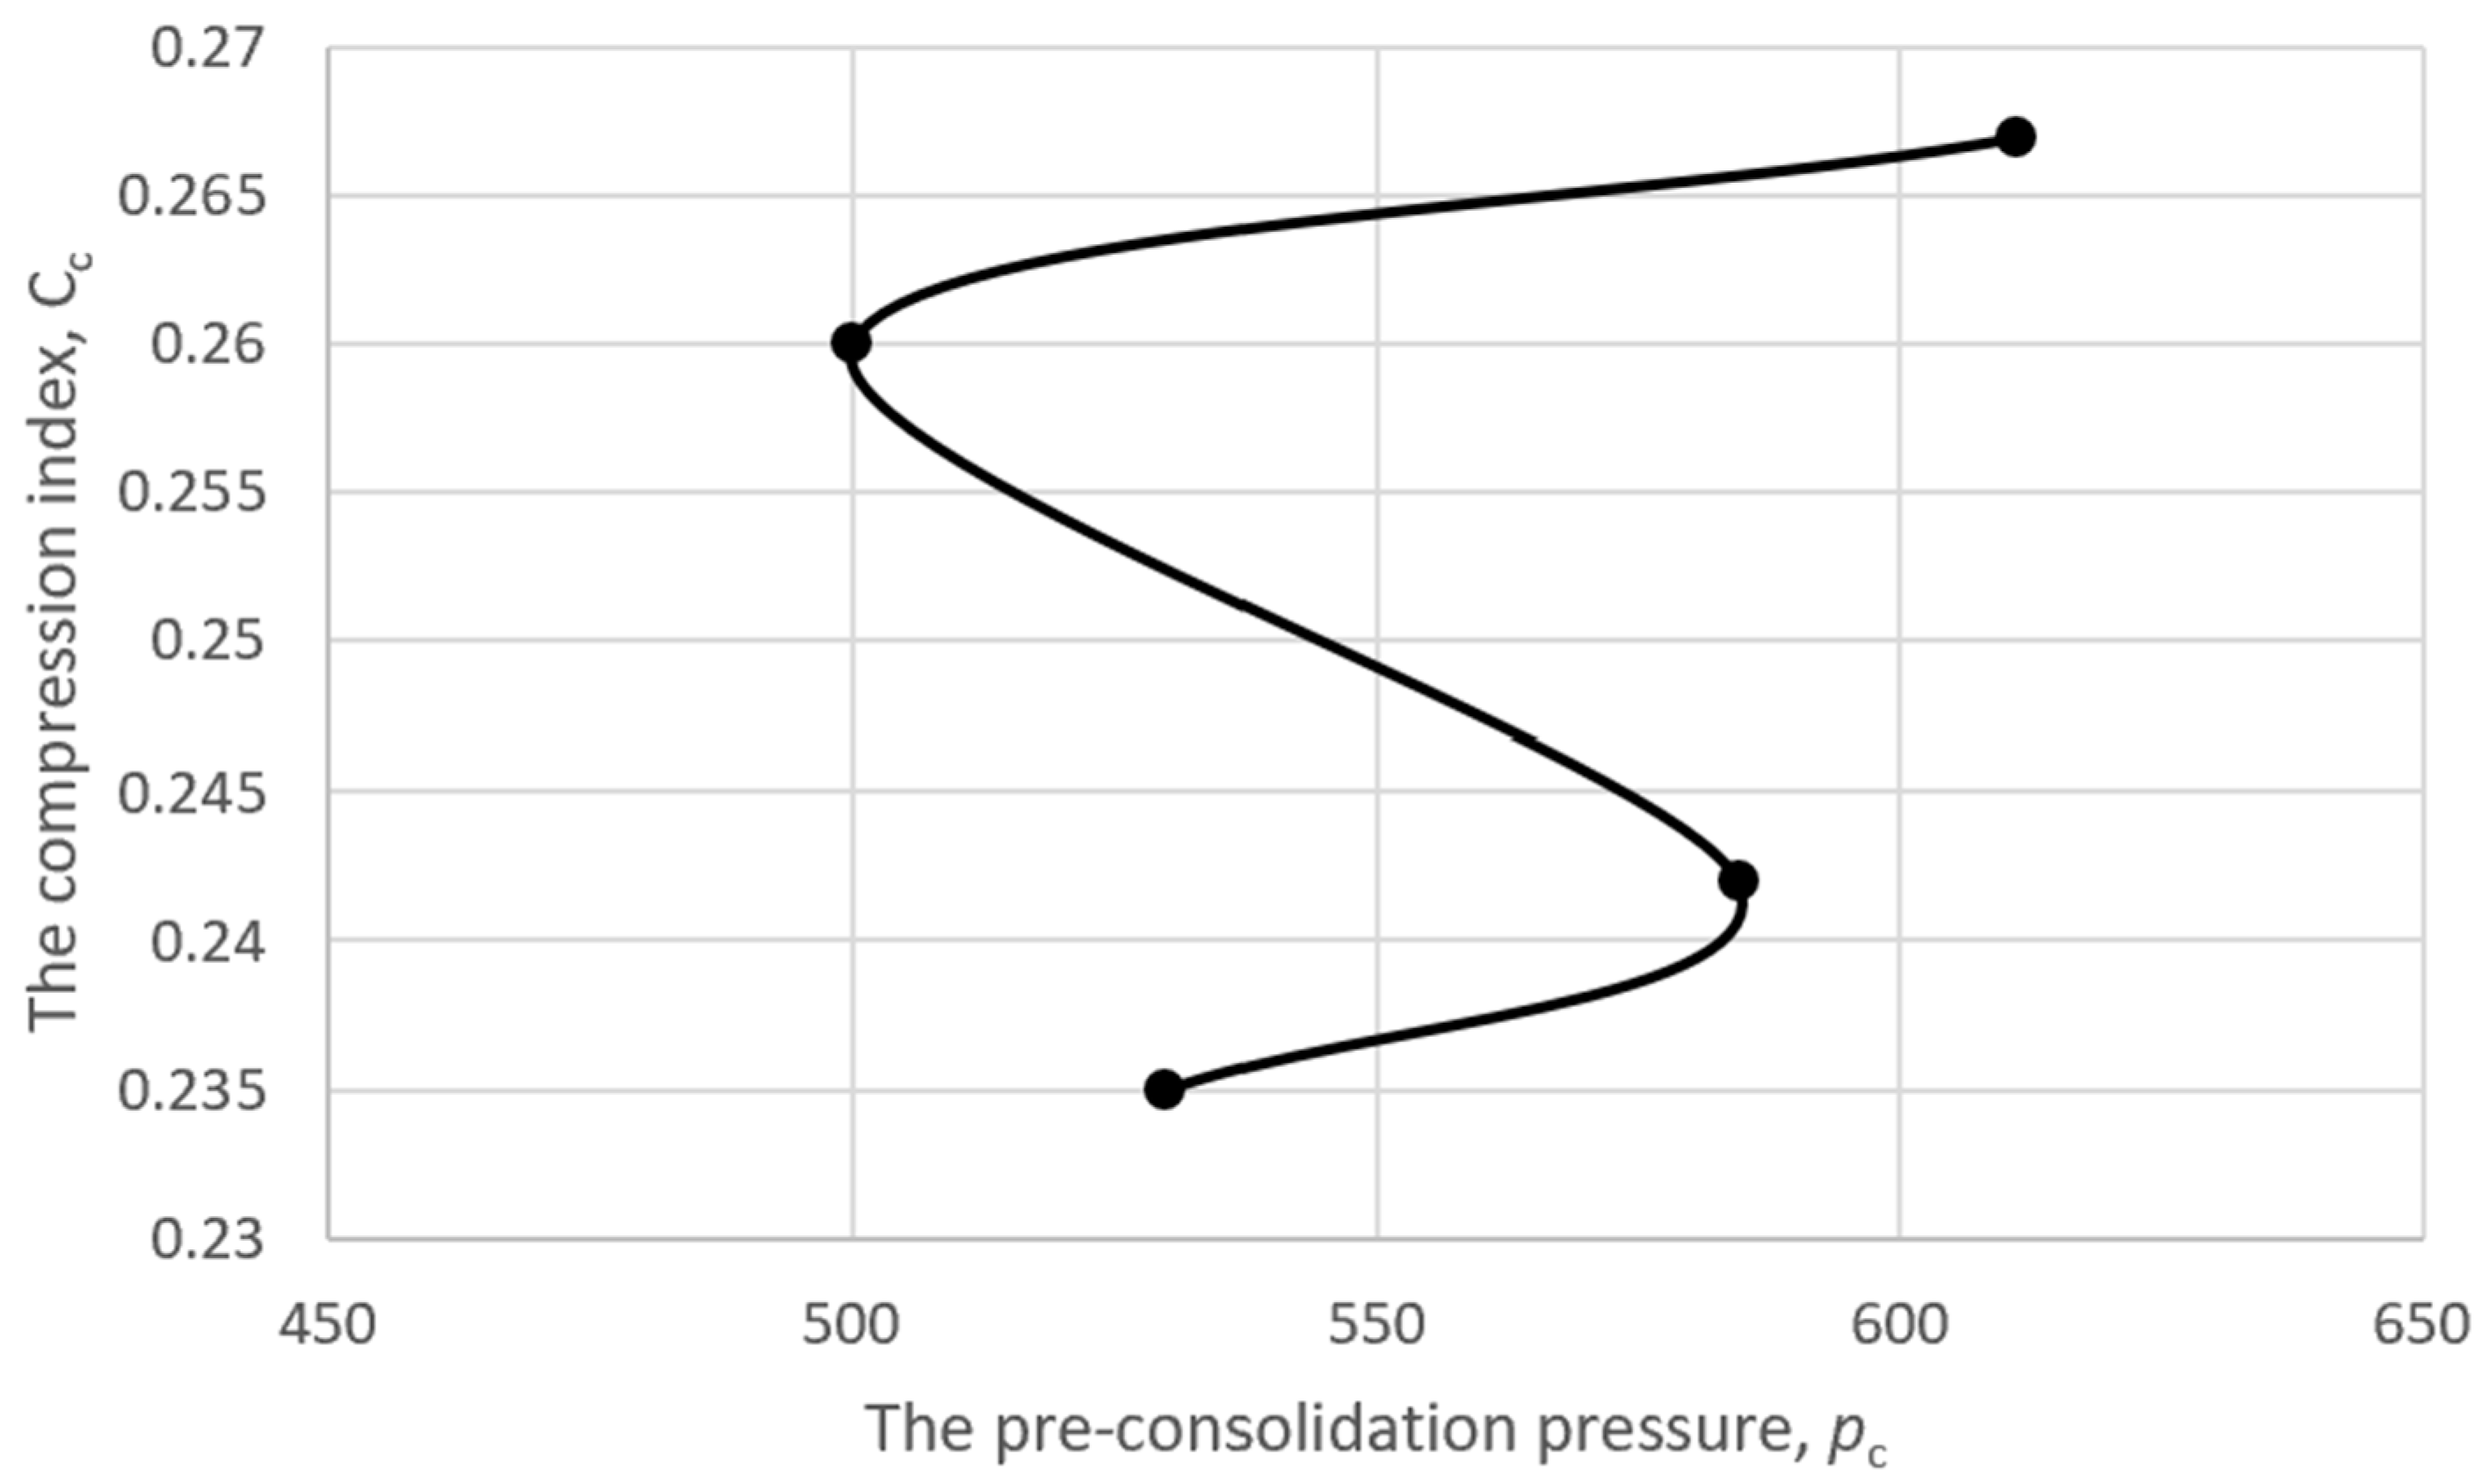
As shown in Table 4, the value of Cc varied from 0.235 to 0.267. The least and largest pre-consolidation pressures were observed for specimens d and c, respectively. It was expected that the compression index for specimen d would give the largest Cc, while that of specimen c would give the lowest Cc. However, experimental data did not match these expectations, as shown in Figure 10. This indicated that there was spatial variability in the engineering properties of the soft clay taken from the same construction site.

Figure 10.
The obtained compression index versus the pre-consolidation pressure (pc).
Deformation data of each specimen with respect to each level of loading were used to compute the Ca, as illustrated in Table 5.
Table 5.
Determination results of secondary compression ratio Ca.
The results in Table 5 indicate that the value of Ca varied with respect to specimens at different levels of applied loads. To compare the variability of the obtained Cc and Ca, the variability y is defined as follows:
where xobs denotes measured data, xave denotes average data from four specimens, and y denotes the variability of measured data.
Variabilities in obtained Cc and Ca are illustrated in Table 6, which indicates that variability in the obtained Ca using low loading levels was much larger than that obtained for the Cc. It was also observed that the variability in Ca decreased with increases in the applied loading. The results in Table 6 are interesting, and indicate that measurement of Ca was dependent on the stress level, and that a higher stress level gave more consistent results of Ca.
Table 6.
The variability in obtained Cc and Ca from different specimens.
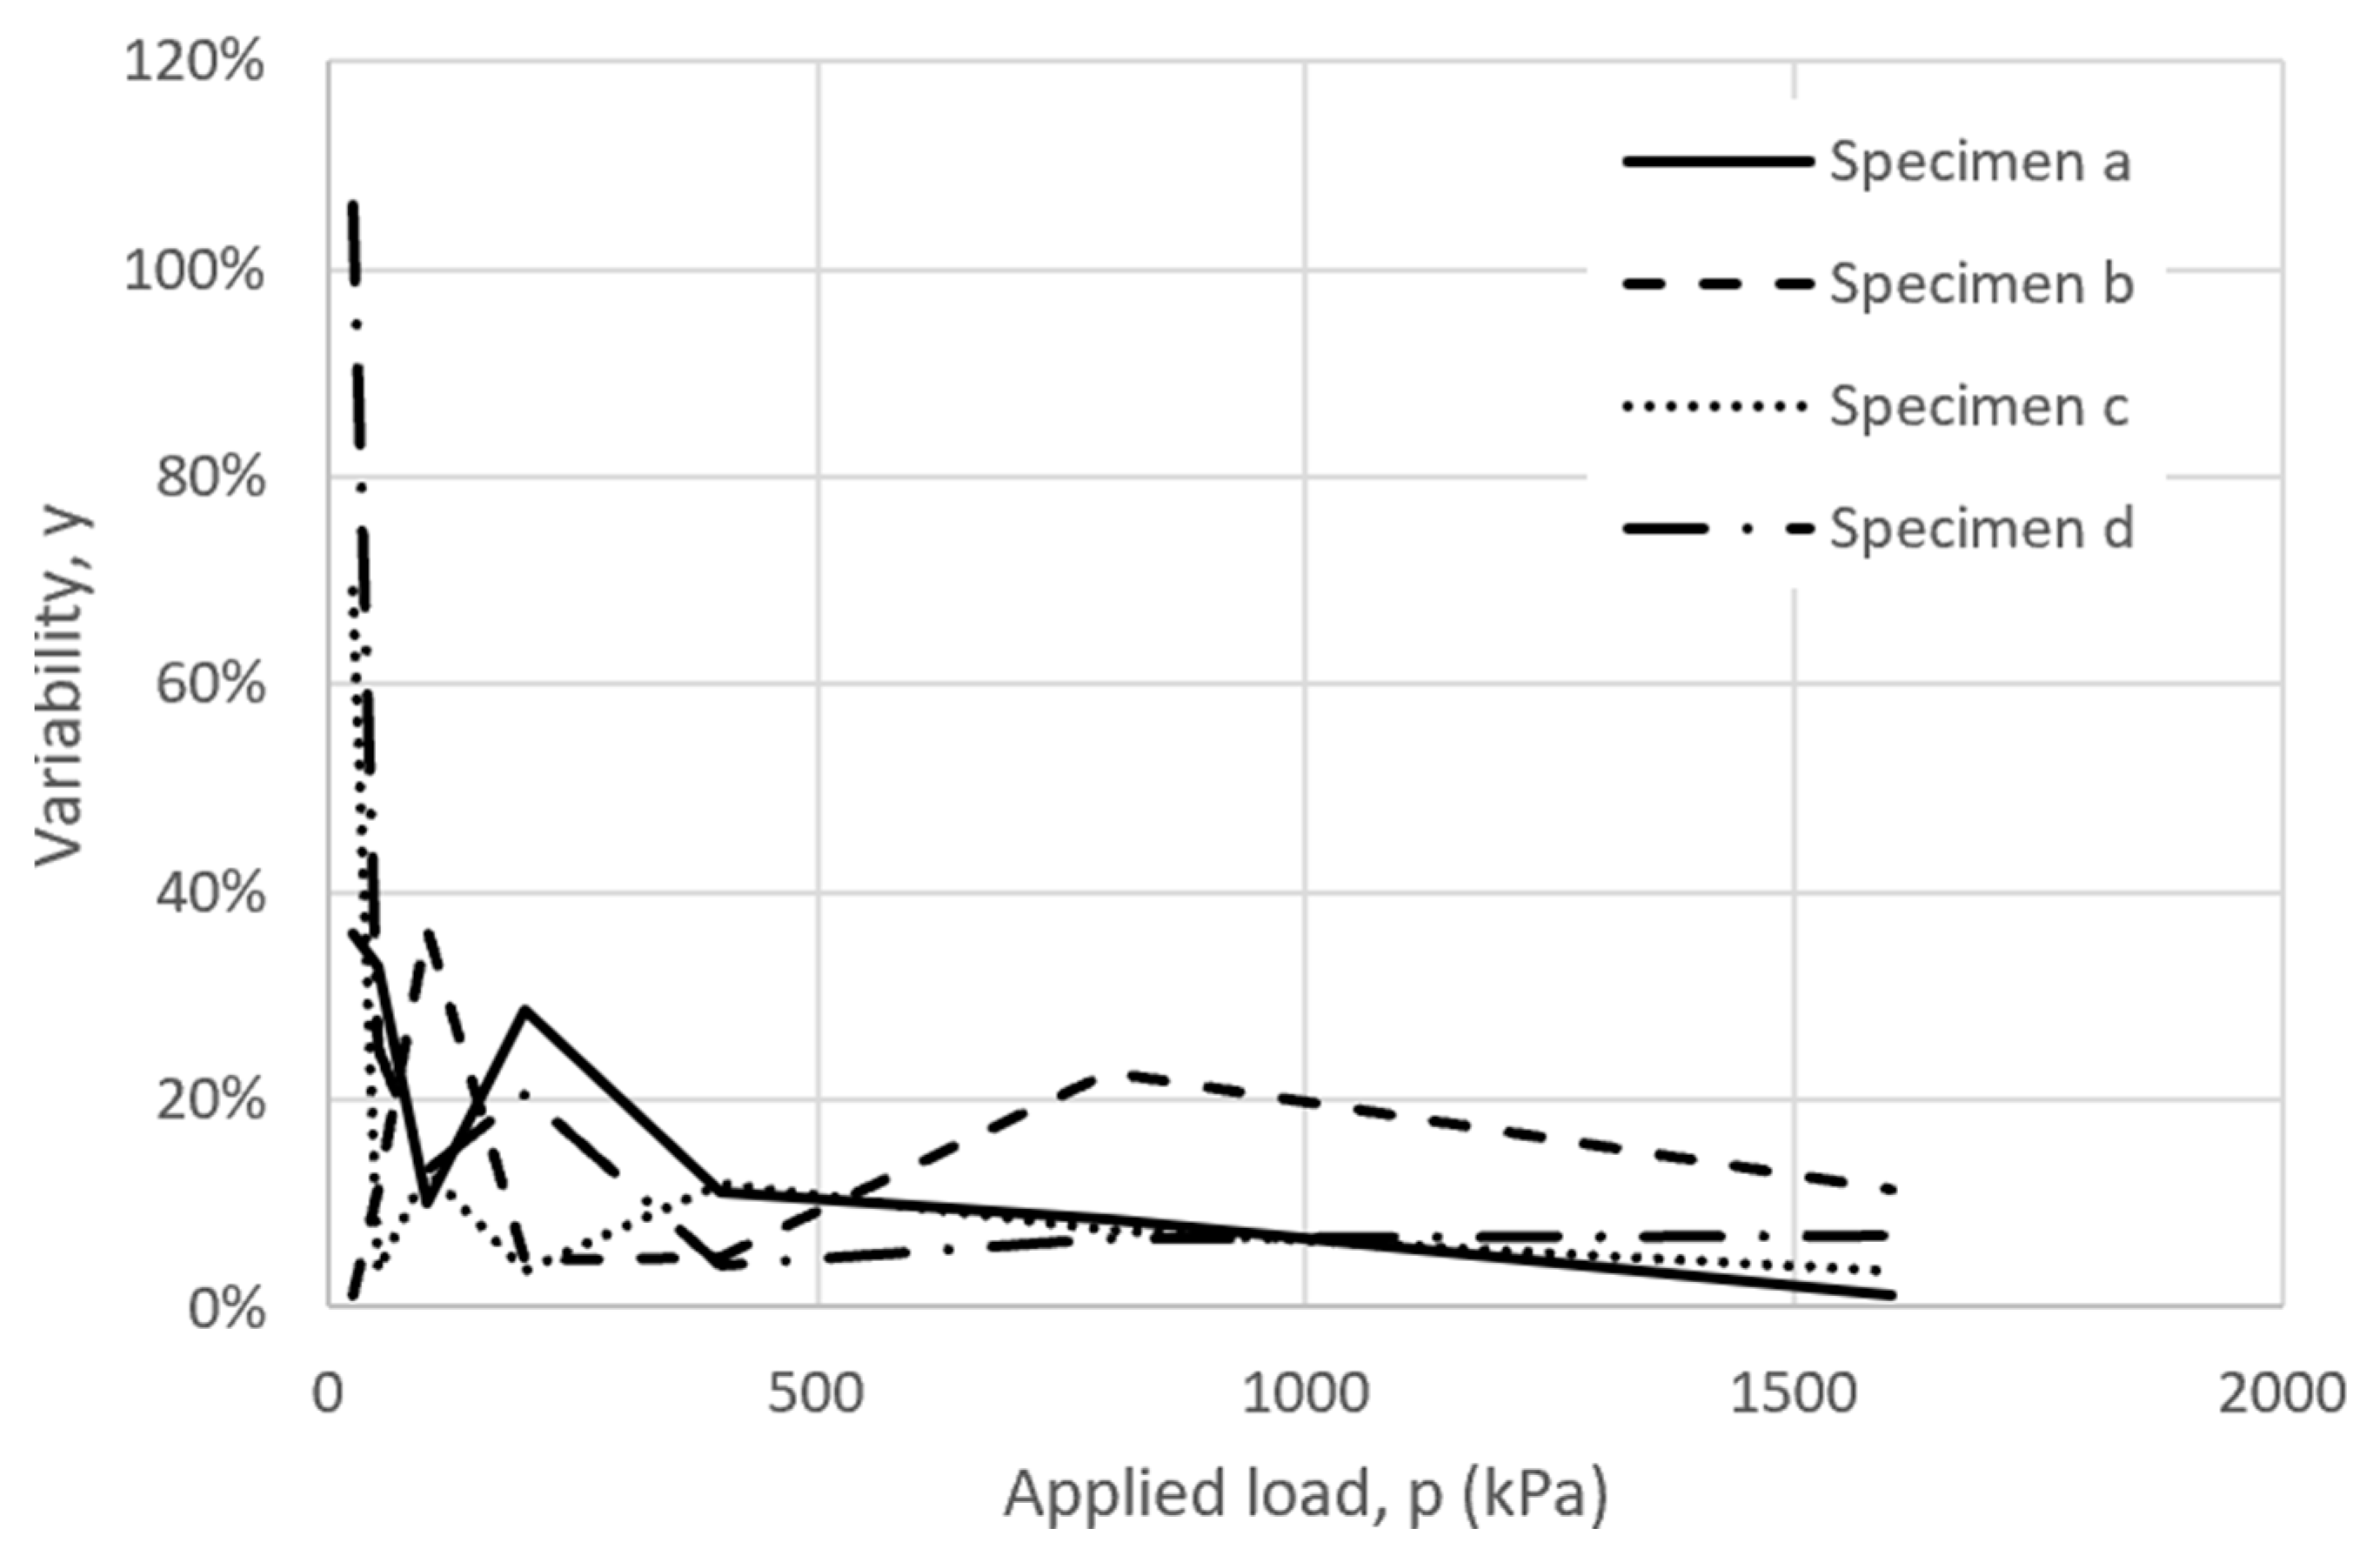
Variabilities in the calculated Ca from different specimens at different loading levels are illustrated in Figure 11.
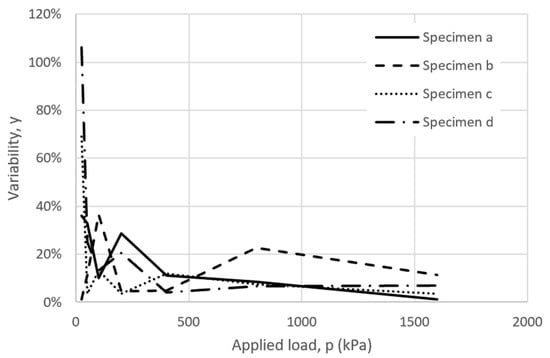
Figure 11.
Variabilities in determined Ca for different specimens at different loading levels.
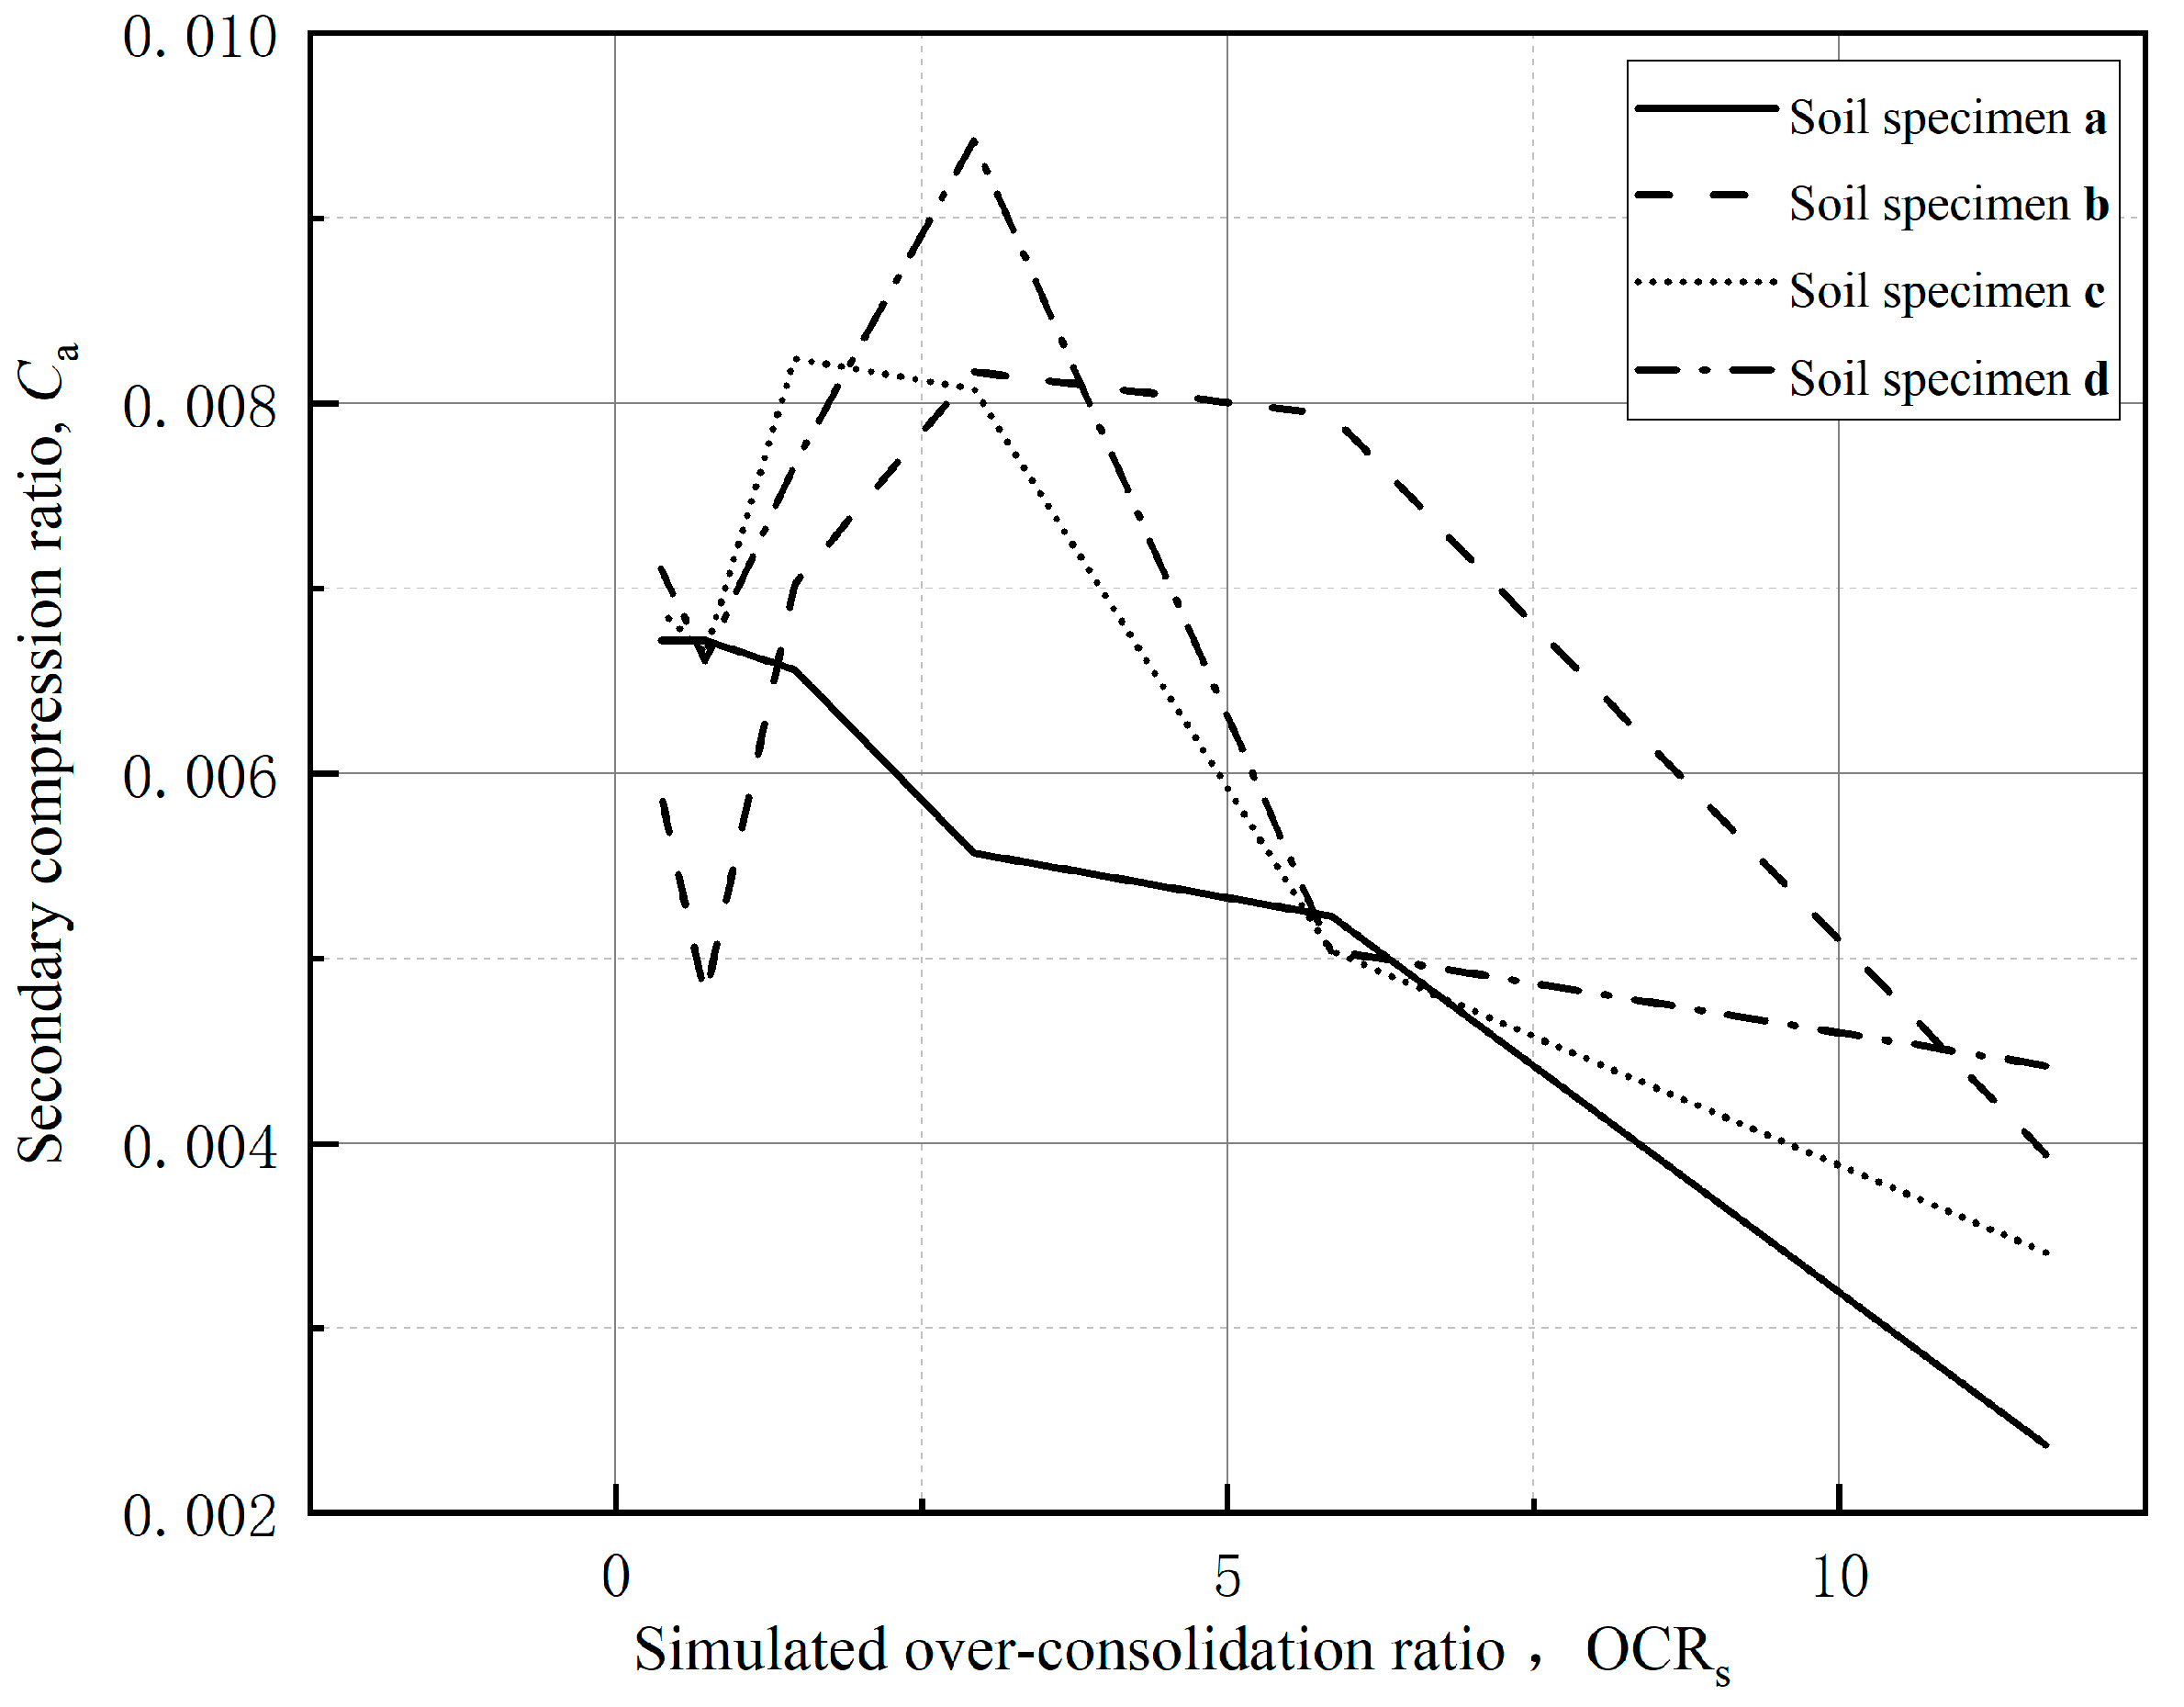
The applied load may not represent the actual in situ vertical stress level. In this case, define the ratio between the applied load and pc as the simulated over-consolidation ratio (OCRs). Next, the Ca can be replotted with respect to the OCRs, as shown in Figure 12. Figure 12 indicates that the Ca decreased with increases in the OCRs. Zhang and Cao [21] indicated that if the applied load was less than pc, the Ca of soft clay in Jiangsu decreased with increases in the applied load. On the other hand, if the applied load was larger than pc, the Ca increased with increases in the applied load. It seems that Figure 12 shows different results compared to those of Zhang and Cao [21].
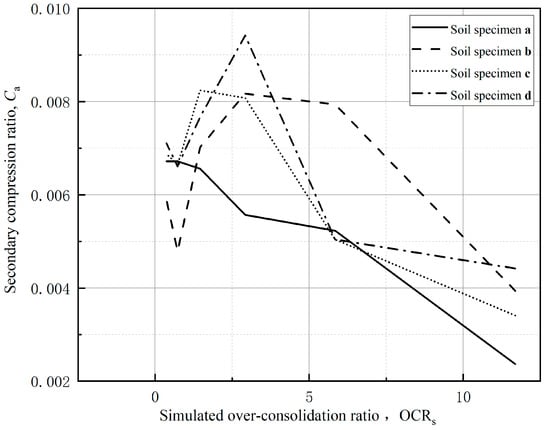
Figure 12.
Relationship curves between secondary compression ratio Ca and OCRs for soil specimens (a)–(d).
4. Conclusions
A series of oedometer tests was conducted on the soft clay of Nanjing. It was observed that variability in determined Ca was higher than that in determined Cc. The variability in Ca decreased with increases in the applied load. The determination of Ca was dependent on the applied load, and the Ca decreased with increases in the simulated over-consolidation ratio (OCRs), which defines the ratio between the applied load and the pc. The experimental results indicate that more specimens are required to determine the Ca of soil near the ground’s surface than are required for the Ca of deep ground. In addition, it seems that the effect of the creep behavior of soft clay on the ground settlement decreased with increases in the deposit depth, because the Ca decreased dramatically with increases in the OCRs.
Author Contributions
Methodology, Y.L., R.M., G.D. and Q.Z.; Validation, Y.Z.; Formal analysis, X.Y.; Investigation, Y.Z. and X.Y.; Resources, Y.L. and P.G.; Data curation, A.S. and P.G.; Writing—original draft, Y.L., R.M., Y.Z., G.D., P.G. and Q.Z.; Writing—review & editing, Y.L., A.S., G.D. and Q.Z.; Supervision, G.D. and Q.Z. All authors have read and agreed to the published version of the manuscript.
Funding
This research received no external funding.
Institutional Review Board Statement
Not applicable.
Informed Consent Statement
Not applicable.
Data Availability Statement
The data presented in this study are openly available in Qian Zhai. [Qian] [https://civil.seu.edu.cn/zq_30676/list.htm# accessed on 18 August 2024].
Conflicts of Interest
Author Peng Gao was employed by the company Jiangsu Jianyan Construction Engineering Quality and Safety Appraisal Co., Ltd. The remaining authors declare that the re-search was conducted in the absence of any commercial or financial relationships that could be construed as a potential conflict of interest.
References
- Jiang, J.; Li, X.; Gao, G.; Luo, G. Investigation on the correlation between physical mechanical parameters of clay subsoil and Nanjing metro foundation. China Railw. Sci. 2007, 28, 19–26. [Google Scholar]
- Tjong-Kie, T. Secondary time effects and consolidation of clays. Sci. China 1958, 7, 1060–1075. [Google Scholar]
- Mesri, G.; Choi, Y.K. The uniqueness of the end-of-primary (EOP): Void ratio-effective stress relationship. In Proceedings of the 11th International Conference on Soil Mechanics and Foundation Engineering, San Francisco, CA, USA, 11 August 1985; Volume 2. [Google Scholar]
- Mitchell, J.K.; Campanella, R.G.; Singh, A. Soil creep as a rate process. ASCE Soil Mech. Found. Div. J. 1968, 94, 231–253. [Google Scholar] [CrossRef]
- Leroueil, S.; Kabbaj, M.; Tavenas, F.; Bouchard, R. Stress-strain-strain rate relation for the compressibility of sensitive natural clay Geotechnique V35, N2, June 1985, P159–180. Int. J. Rock Mech. Min. Sci. Geomech. Abstr. 1985, 22, 187–188. [Google Scholar] [CrossRef]
- GB/T 50123-2019; The Hydrology and Water Resources Bureau of the Ministry of Water Resources, N.H.R.I. Standard for Geotechnical Testing Method. General Administration of Quality Supervision, Inspection and Quarantine of the People‘s Republic of China: Beijing, China, 2019; p. 717.
- Taylor, D.W.; Merchant, W. A Theory of Clay Consolidation Accounting for Secondary Compression. J. Math. Phys. 1940, 19, 167–185. [Google Scholar] [CrossRef]
- Casagrande, A.; Fadum, R.E. Notes on Soil Testing for Engineering Purposes; Harvard University: Cambridge, MA, USA, 1940; p. 74. [Google Scholar]
- Mesri, G. Coefficient of Secondary Compression. ASCE Soil Mech. Found. Div. J. 1973, 99, 123–137. [Google Scholar] [CrossRef]
- Zhou, Q.J.; Chen, X.P. Experimental study on secondary consolidation characteristics of soft soil. Rock Soil Mech. 2006, 27, 5. [Google Scholar]
- Cao, Y.P. The relationship between the coefficient of secondary consolidation of saturated cohesive soil and moisture content. China Harb. Eng. 2007, 3, 21–23. [Google Scholar]
- Yu, X.; Yin, Z.; Dong, W. Experimental Study on the Influence of Load on Secondary Consolidation of Soft Soil. Chin. J. Geotech. Eng. 2007, 29, 4. [Google Scholar]
- Shuchong, W.; Minyun, H.; Yong, Z.; Bin, X.; Kailei, C. Experimental study on secondary consolidation characteristics of silty clay. J. Hydraul. Eng. 2015, 6. [Google Scholar] [CrossRef]
- Dun, Z. Experimental Study on the Secondary Consolidation Characteristics of Soft Soil in Shanghai Area. Low Temp. Archit. Technol. 2020. [Google Scholar] [CrossRef]
- Becker, D.E.; Crooks, J.H.A.; Been, K.; Jefferies, M.G. Work as a criterion for determining in situ and yield stresses in clays. Can. Geotech. J. 1987, 24, 327–328. [Google Scholar] [CrossRef]
- Conte, O.; Rust, S.; Ge, L.; Stephenson, R. Evaluation of Pre-Consolidation Stress Determination Methods. In Proceedings of the Geohunan International Conference, Changsha, China, 9–11 June 2011; pp. 147–154. [Google Scholar]
- Casagrande, A. The determination of pre-consolidation load and its practical significance. Trans. Am. Soc. Civ. Eng. 1936, 101, 557–586. [Google Scholar]
- Zhai, Q.; Zhu, Y.; Rahardjo, H.; Satyanaga, A.; Dai, G.; Gong, W.; Zhao, X. Mathematical model for the determination of the pre-consolidation pressure using the graphical method. Arab. J. Geosci. 2023, 16, 69. [Google Scholar] [CrossRef]
- Fredlund, D.G.; Xing, A. Erratum: Equations for the soil-water characteristic curve. Can. Geotech. J. 1994, 31, 1023–1025. [Google Scholar] [CrossRef]
- Brumund, W.F.; Jonas, E.; Ladd, C.C. Estimating in situ maximum past (preconsolidation) pressure of saturated clays from results of laboratory consolidometer tests. Equipment 1976, 1, 4–12. [Google Scholar]
- Zhang, Q.X.; Chao, F.C. An experimental study on the influence of excessive consolidation ratio on subconsolidation settlement of soil. Jiangsu Agric. Res. 2000, 21, 66–68. [Google Scholar]


Disclaimer/Publisher’s Note: The statements, opinions and data contained in all publications are solely those of the individual author(s) and contributor(s) and not of MDPI and/or the editor(s). MDPI and/or the editor(s) disclaim responsibility for any injury to people or property resulting from any ideas, methods, instructions or products referred to in the content. |
© 2024 by the authors. Licensee MDPI, Basel, Switzerland. This article is an open access article distributed under the terms and conditions of the Creative Commons Attribution (CC BY) license (https://creativecommons.org/licenses/by/4.0/).