Article

Multi-Objective Optimization of Crashworthiness of Shrink Tube Energy Absorption Structure

1
School of Traffic & Transportation Engineering, Central South University, Changsha 410083, China
2
School of Intelligent Manufacturing and Mechanical Engineering, Hunan Institute of Technology, Hengyang 421002, China
3
Key Laboratory of Traffic Safety on Track, Ministry of Education, Central South University, Changsha 410083, China
*
Author to whom correspondence should be addressed.
Appl. Sci. 2024, 14(16), 7347; https://doi.org/10.3390/app14167347
Submission received: 19 July 2024 / Revised: 18 August 2024 / Accepted: 19 August 2024 / Published: 20 August 2024

Abstract

:
By means of material testing, truck testing and numerical simulation, the structural parameters of the shrink tube anti-climb device for high-speed trains were determined. The effects of cone angle, tube thickness, friction coefficient and axial length of the friction cone on the crashworthiness of the shrink tube were studied, and the main causes were analyzed. Using cone angle and tube wall thickness as input variables, and peak crush force, mean crash force and specific energy absorption as crashworthiness indexes, a proxy model was constructed using a radial basis function. The global response surface methodology was adopted to optimize the design of the shrink tube’s structural parameters. The results showed that the crashworthiness of the shrink tube was positively correlated with the cone angle, the thickness of the shrink tube and the friction coefficient, and the influence decreased successively, while the influence was negatively correlated with the axial length of the friction cone, which had the least influence. Through the optimized design, the peak force of the shrink tube increased by only 5.41%, while the specific energy absorption increased by 31.03%. Additionally, the mean force was closer to the technical requirements of 600 kN, and the crashworthiness was optimized.

1. Introduction

Improving crashworthiness can reduce injuries [1,2]; therefore crashworthiness design is a necessary means and method to improve crashworthiness. In order to reduce passenger injuries from collision impacts, energy-absorbing structures are often designed and installed in unoccupied areas at the front end of the train [3,4,5,6], where collision energy is absorbed through the deformation of circular tubes. Thin-walled circular tubes can be compressed by molds to produce a specific deformation pattern with stable reaction forces and high specific energy absorption [7,8,9], which makes them ideal energy-absorbing structures and has led to their wide use in automotive, railway transportation and aerospace industries [10,11,12,13]. Some deformation modes of circular tubes have attracted a large number of scholars, such as expansion [14,15,16,17,18,19], outward turning [20,21,22,23,24,25] and splitting [26,27,28,29,30]. Li [31] found that the energy absorption efficiency of shrink circular tubes is significantly greater than that of expanded circular tubes for different dimensional parameters by means of numerical simulation combined with experimental methods. Compared with the long rod structure of the expanding tube, the shrink tube has a more compact structure, a more stable energy absorption process, a higher mean force and a greater energy absorption efficiency, making it suitable to be used as the energy-absorption structure for the train anti-climbing device.
The deformation mechanism of the shrink circular tube is similar to that of the expanding circular tube, but there are fewer studies on shrink tubes. Yao et al. [32] proposed a straight taper shrinking (STS) tube and used quasi-static experiments and finite element simulations to study the crashworthiness of the STS tube. They found that the STS tube could form two deformation modes, shrinking (S) and buckling (B), and that matching the structural parameters, such as taper angle and tube wall thickness, could lead to different deformation modes. Additionally, the cone angle had the most significant effect on the crashworthiness of STS tubes. Liu et al. [33] proposed a theoretical model for the shrinkage of metal tubes by classifying the deformation into three modes based on the relationship between the actual mold radius, the critical mold radius and the conical vertebral angle. By comparing the results with numerical simulations over a wide range of geometrical parameters, it was found that the range of applicability of the theoretical model was conical angles less than or equal to 40° and diameter–thickness ratio greater than or equal to 10, respectively. Almeida et al. [34] investigated the shrinkage process of round tubes as a forming method to produce round tubes with specific diameters. Alves et al. [35] addressed the forming limit of aluminum tubes with expansion and contraction and observed experimentally and through simulation the occurrence of toughness fractures, wrinkles and local buckling as phenomena. They found that the geometric parameters and lubrication conditions were the key factors for the success of the shrinkage process. Guan et al. [36] proposed a novel energy absorber for high-speed trains using a combined shrinkage round tube and found that the rate of increase in the maximum crushing force was much greater than the rate of increase in specific energy absorption as the wall thickness increased. They chose to use multi-objective particle swarm optimization to obtain a Pareto bound for the dual optimization objective. Tanaskovic et al. [37] found that by combining the simultaneous action of both the shrinkage and splitting modes, the combined mode energy absorption efficiency was about 60% higher than that of a single contraction absorber.
From the above review, it can be seen that the shrink tube has high mean force and specific absorption energy, light mass and stable deformation. They have been applied to energy-absorbing structures, but the application of shrink tubes in train anti-climb devices is rare. In this paper, in view of the narrow installation space at the end of the train and the requirement for a compact but large energy-absorbing stroke in the anti-climbing device, a kind of shrink tube anti-climbing device is designed for crashworthiness optimization. The effects of the cone angle, the thickness of the shrink tube, the coefficient of friction and the axial length of the friction cone surface on the crashworthiness of the shrink tube are investigated through methods of material tests and trolley collision tests combined with numerical simulation. Then, the main causes are analyzed and the GRSM (global response surface methodology) is used to obtain the optimal configuration of its structural parameters.

2. Geometry and Finite Element Modeling

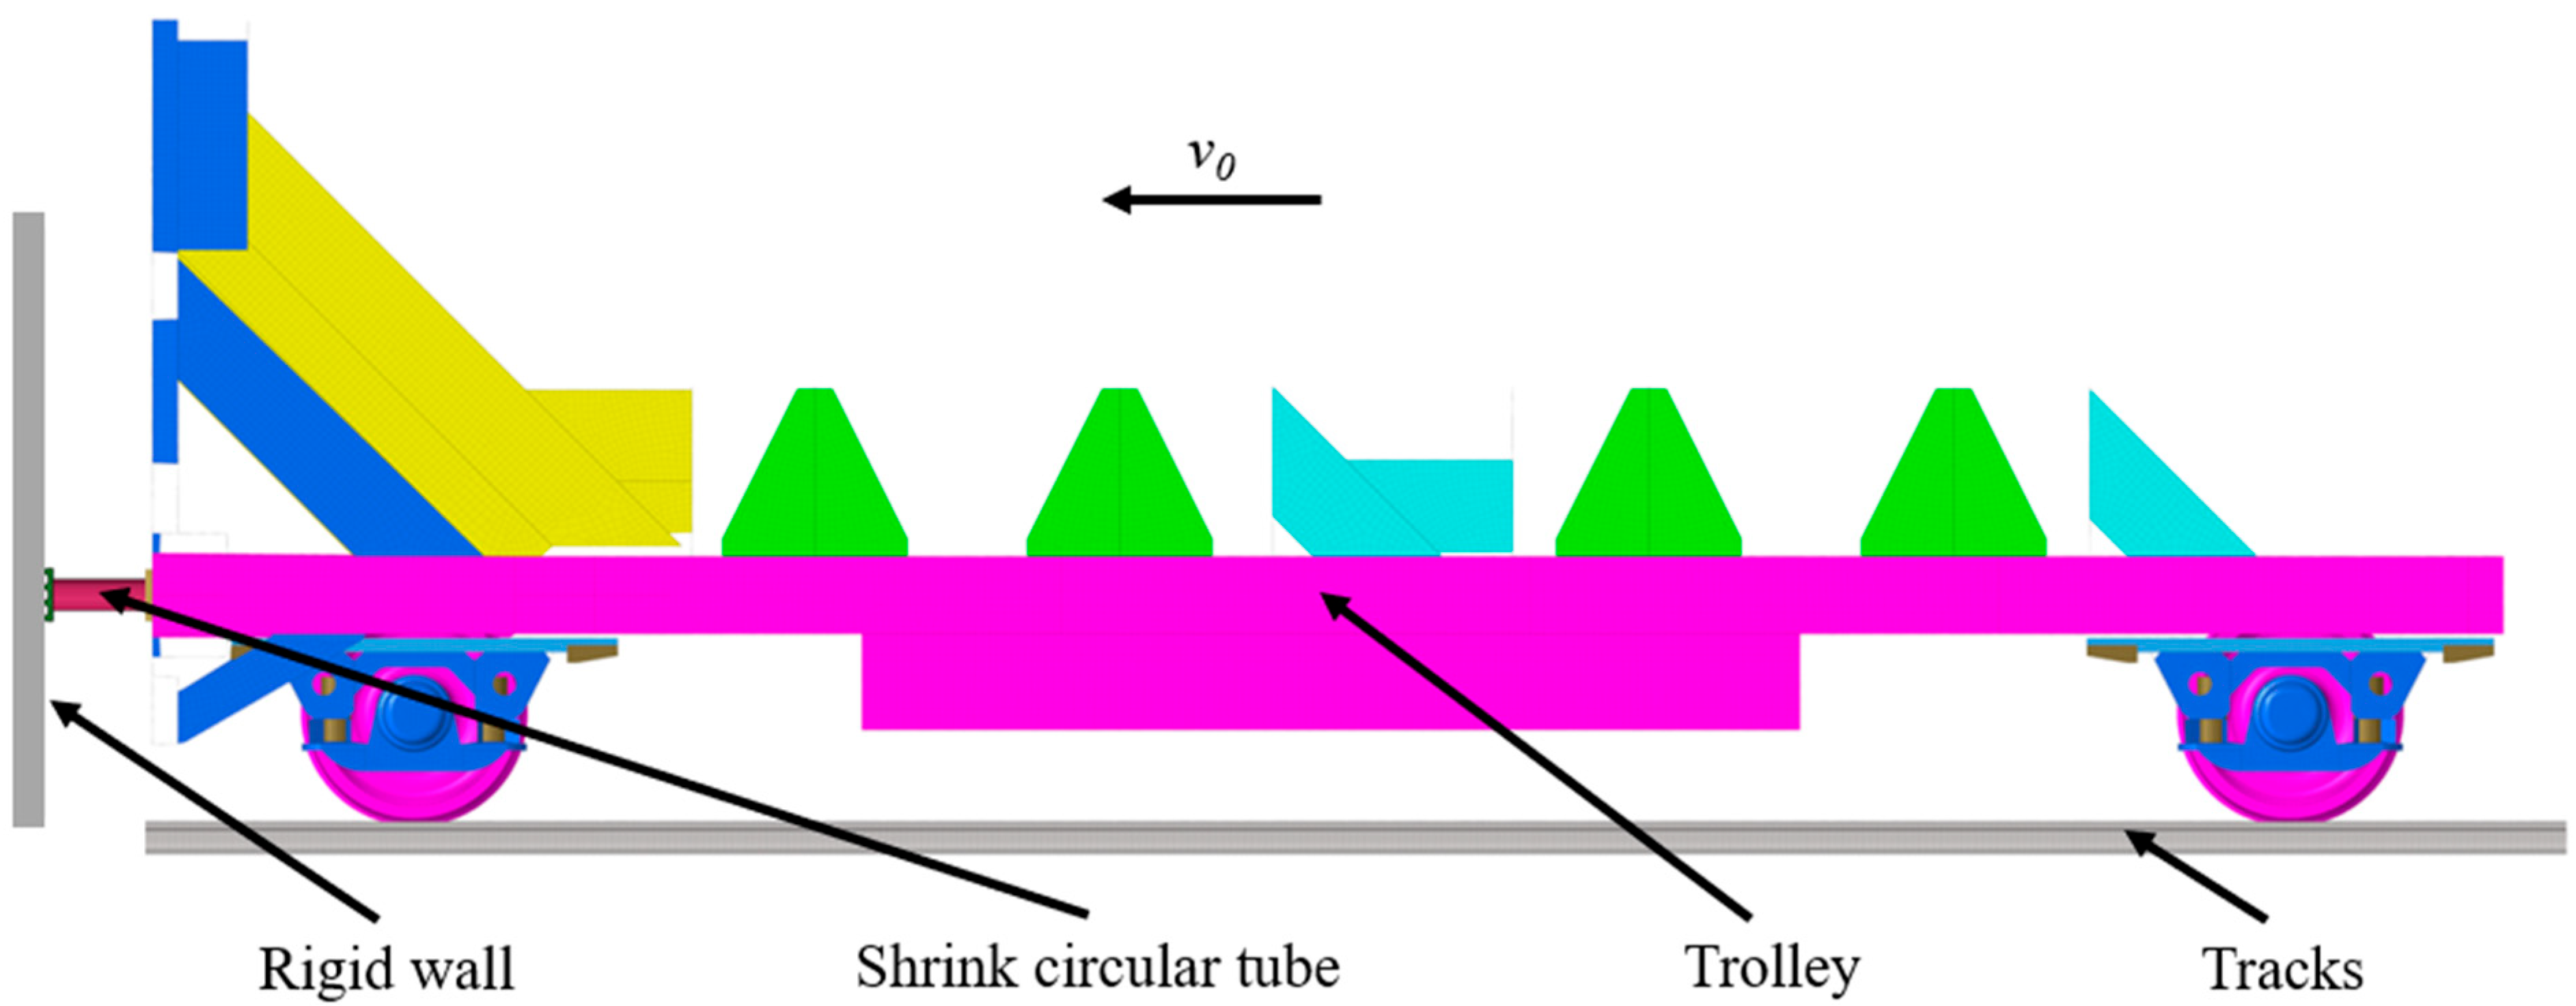
2.1. Shrink Tube Anti-Climb Structure

The anti-climb device is located at the front end of the train, as shown in Figure 1a. In a collision accident, it meshes with the anti-climb device of the opposite train to prevent the car from climbing. The structure of this shrink tube anti-climbing device is shown in Figure 1c, which consists of four parts: a shrink tube, a flange, an anti-climbing tooth plate and a fixed plate. The flange plate is fixedly installed on the front end of the train through four bolts and the fixed plate securely connects the shrink tube to the flange plate. When the anti-climbing tooth plate undergoes an impact and pushes the shrink tube to move axially, the inner conical surface of the flange squeezes the shrink tube, causing it to deform. This generates friction with the outer surface of the shrink tube, absorbing the kinetic energy of the collision and generating a stable resistance force. The shrink tube is machined from 45# steel, the flange is machined from 40 Cr steel and other parts are machined from Q235 steel. Figure 1d shows a half-section view, where L is the maximum energy absorption stroke of the shrink tube. The size design of the shrink deformation part is shown in Figure 1b, where T represents the thickness of the shrink tube and R1 and R2 are the diameters of the shrink tube before and after deformation, respectively. The difference between the large diameter and the small diameter represents the amount of shrinkage. α is the cone angle of the shrink tube and S is the axial length of the friction cone surface, where S is set to fine-tune the cone angle within a certain range and is defined as the projected length of the tapered surface in the axial direction of the shrink tube. In the initial plan, the cone angle, thickness, major diameter and minor diameter of the shrink tube are 15°, 9 mm, 65 mm and 60 mm, respectively.

2.2. Finite Element Modeling

The LS-DYNA software (R12.1) was used to simulate the mechanical behavior of the shrink tube during the collision process. The shrink tube was a deformation component. The “Mat.24” material was used to simulate 45 steel, and the “Mat.20” material was used for other components. According to the material testing standard [38] (ISO 6892-1:2009, MOD.) [39], the MTS 647 hydraulic wedge clamping tensile testing machine was used to conduct a quasi-static tensile test to obtain the mechanical property curve of 45 steel. The test equipment and specimen clamping status are shown in Figure 2a. The test was conducted at room temperature and the tensile speed was 2 mm/min. The standard size of the material sample is shown in Figure 2b, and the fracture sample and the true stress-strain curve are shown in Figure 2c. Among them, the material parameters for 45 steel were as follows: a density of 7850 kg/m3, a Poisson’s ratio of 0.3, an elastic modulus of 206 GPa and a yield strength of 367 MPa.
The finite element model was consistent with the real test scenario. An anti-climb device was installed at the front end of the test trolley, which hit a fixed rigid wall at the required mass and speed. The finite element model was established, as shown in Figure 3. In order to take into account both calculation accuracy and calculation efficiency, a convergence analysis was performed, as shown in Table 1. The size of the shrink tube and the shrink mold flange was selected to be 3 mm for meshing, a size of 5 mm was used for other parts of the anti-climb device and a size of 30 mm was used for the trolley. The collision test finite element model after meshing had a total of 518,540 nodes and 454,685 elements. Automatic face-to-face contact was set between the contact surfaces of the components, with both the kinetic friction coefficient and static friction coefficient set to 0.1. The shrinkable circular tube was also set to have automatic single-surface contact, with both the kinetic friction coefficient and static friction coefficient set to 0.05 [40].

3. Test Verification and Crashworthiness Evaluation

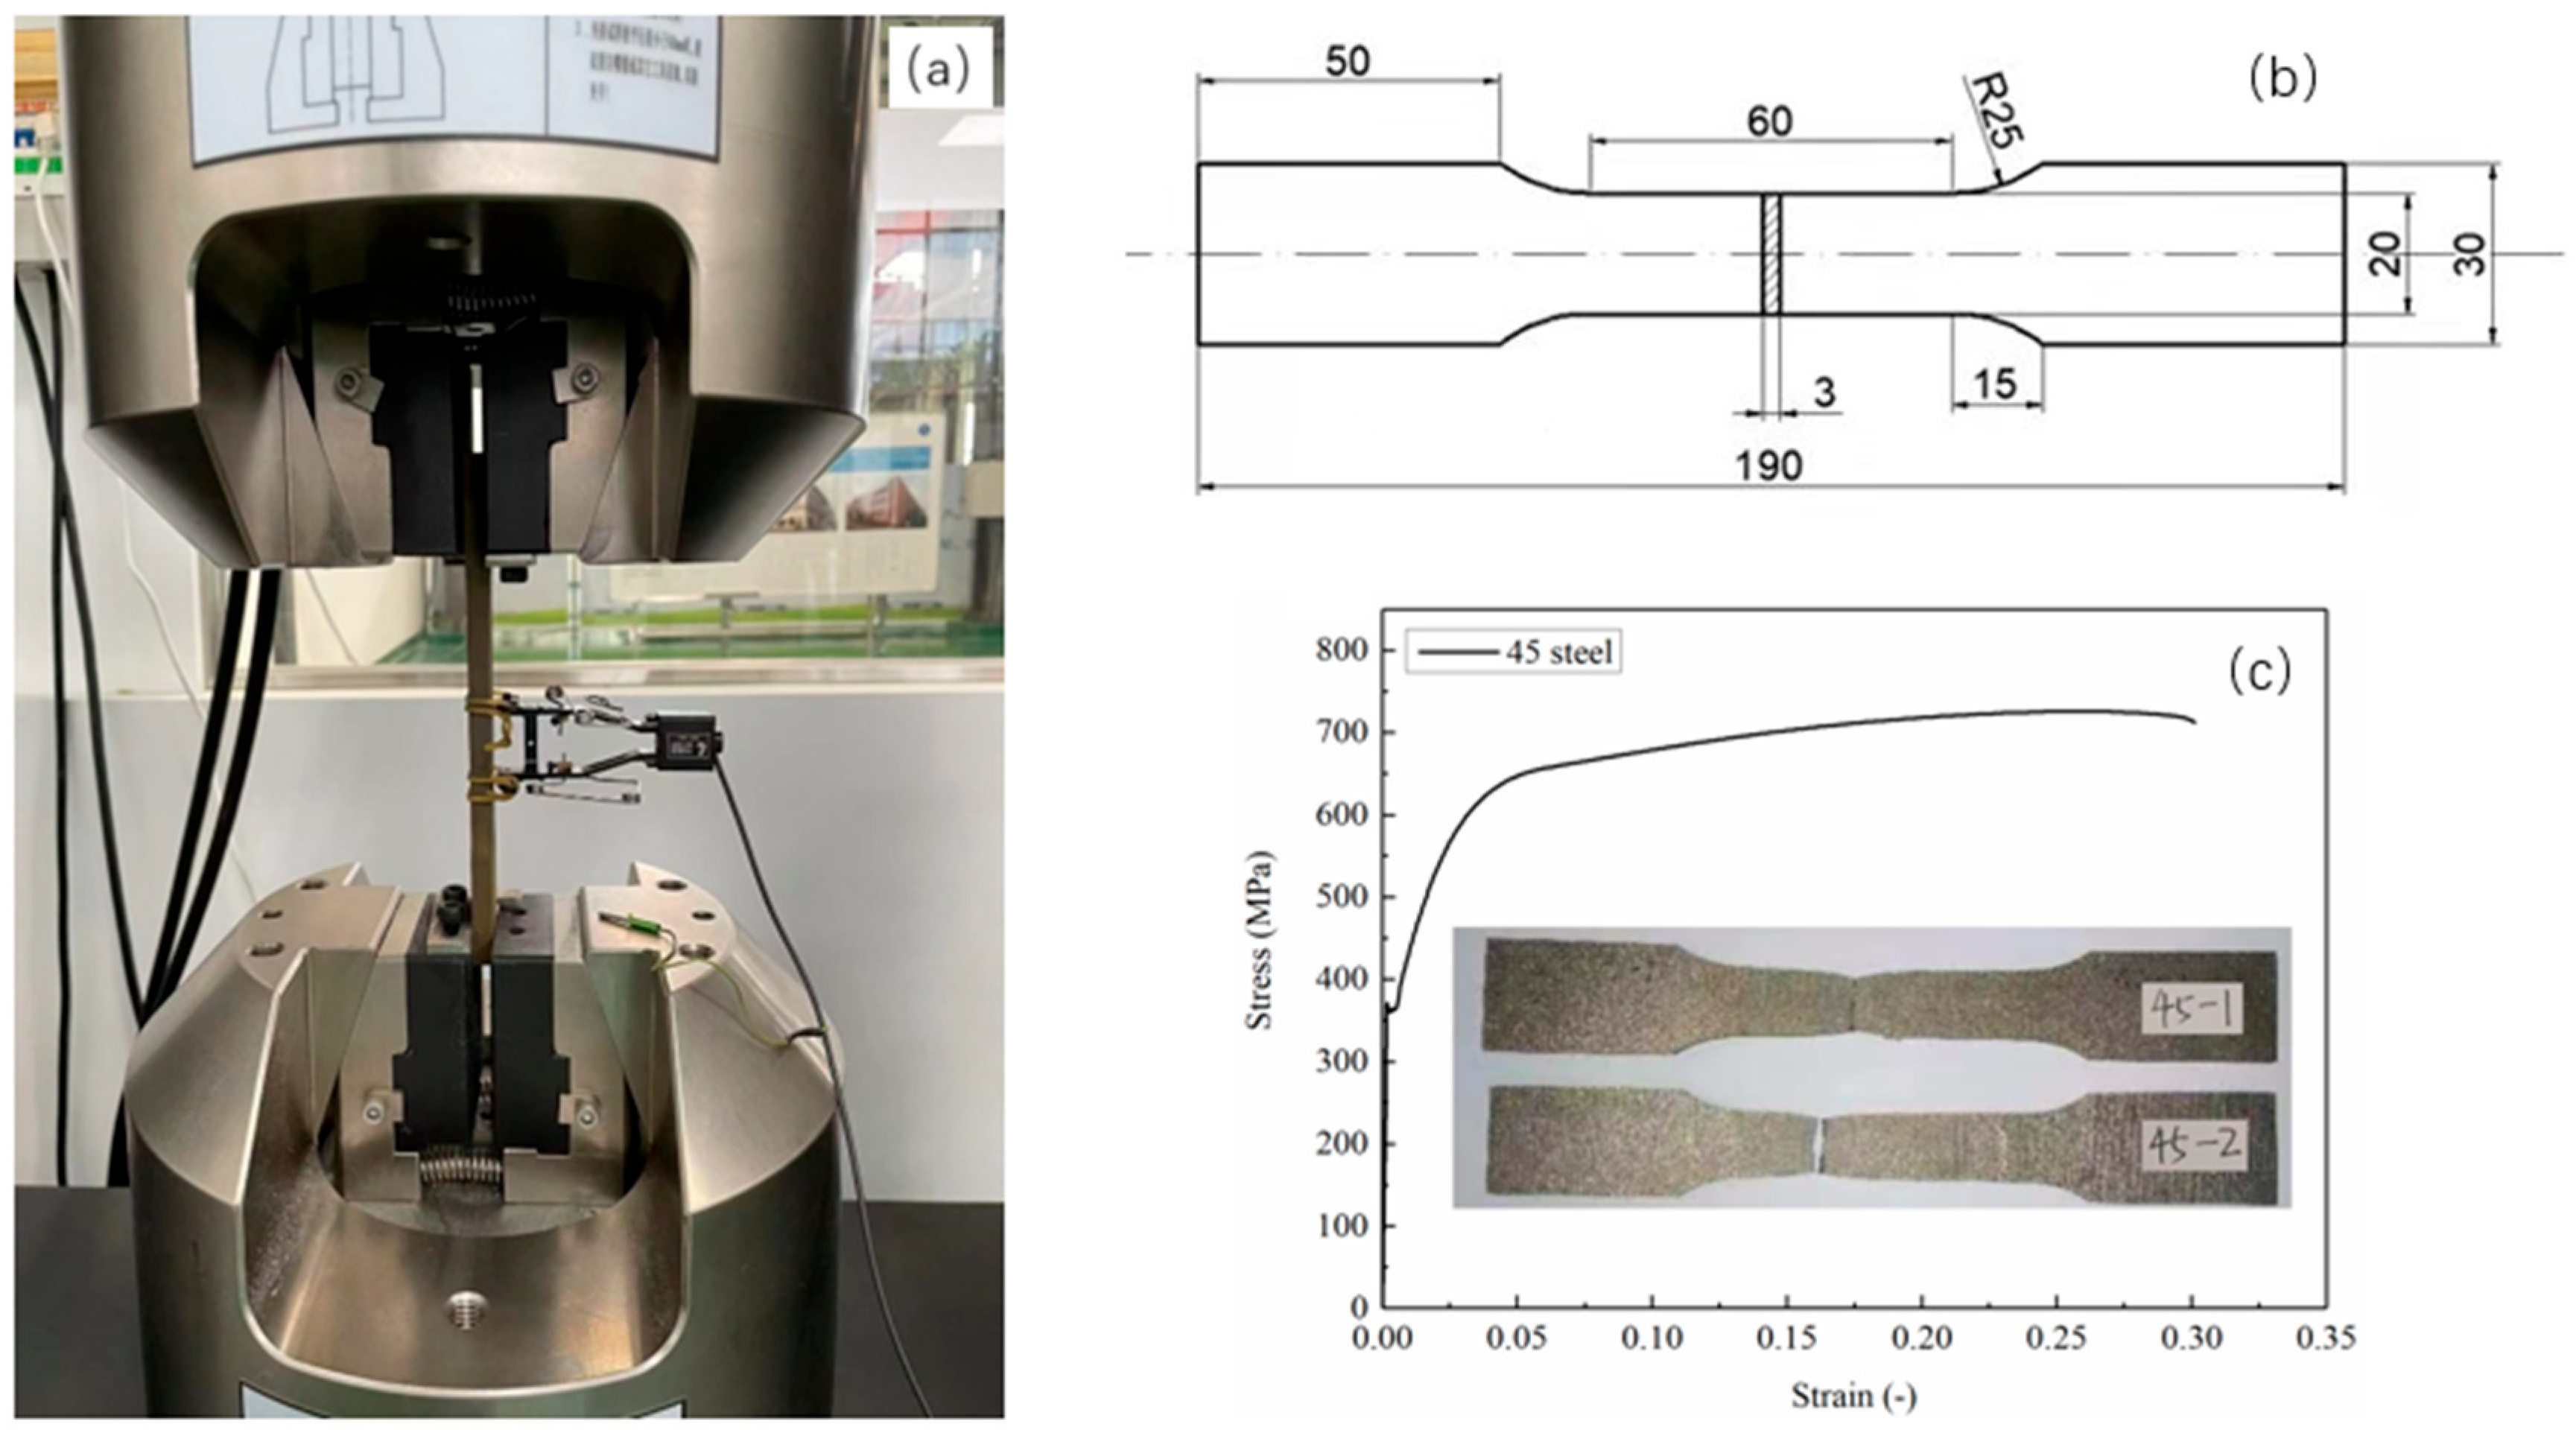
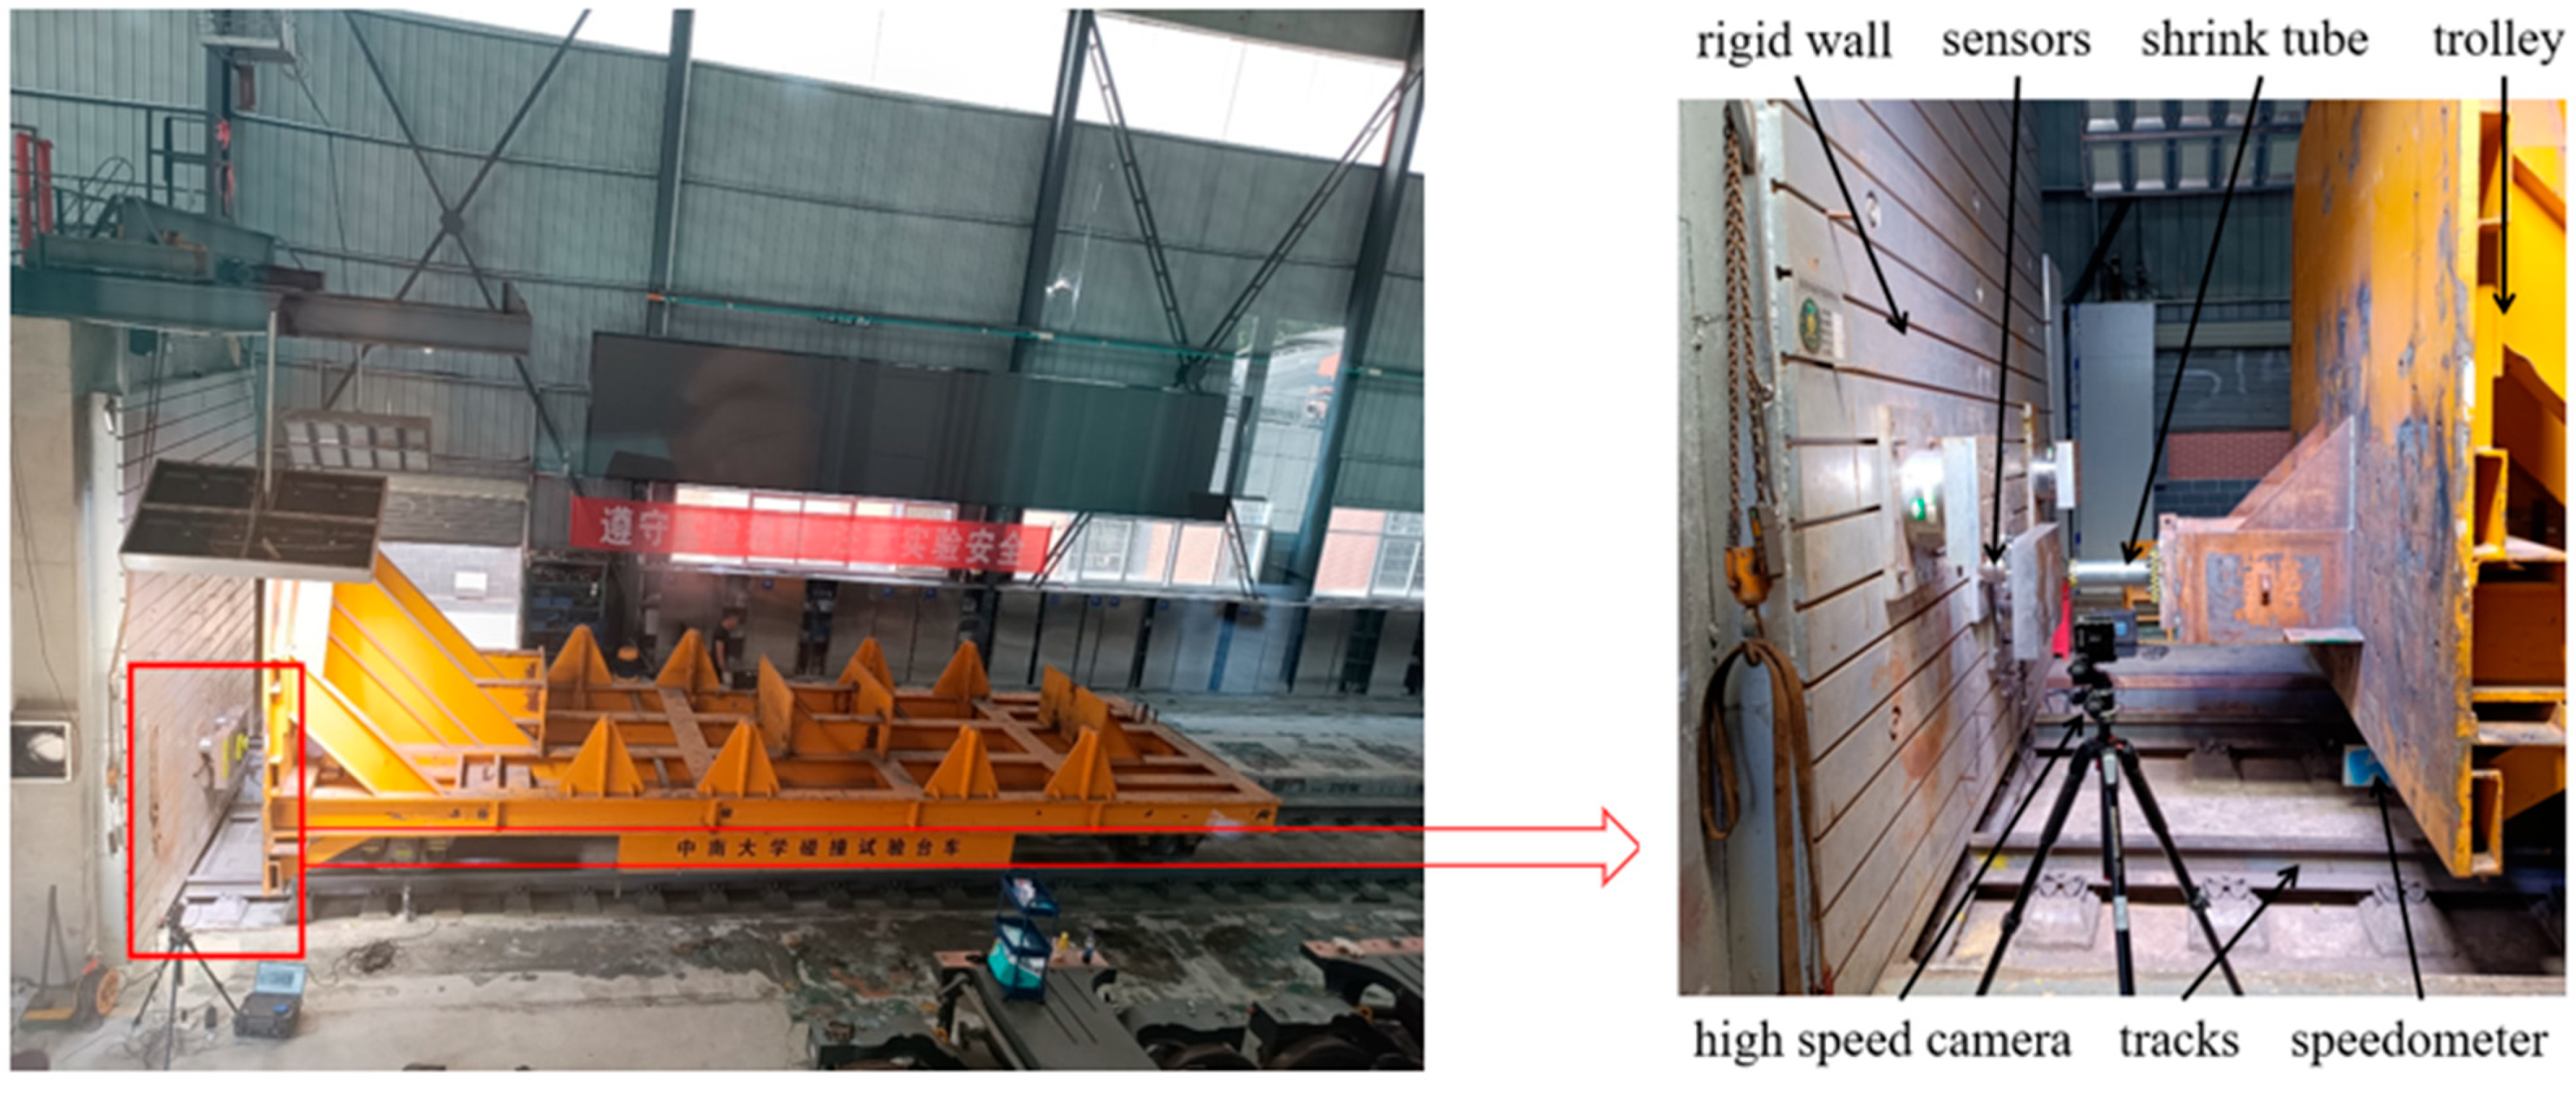
3.1. Test Verification

A trolley test was conducted on the shrink tube anti-climb device at the High-speed Train Research Center of Central South University. The test scene is shown in Figure 4. There was a trigger speedometer under the front end of the test vehicle to record the collision speed. Three pressure sensors were arranged on the rigid wall to record changes in the impact force. A high-speed photography system was installed directly above and on the side of the impact position to record deformation images and displacement data during the impact. The mass of the test vehicle was 27 t and the impact speed was 3.64 m/s.
The deformation sequence, as well as the force and displacement curves under test conditions and simulation conditions, are shown in Figure 5. It can be seen that the test curves and simulation curves were in good agreement, and the deformation process of the shrink tube was smooth and orderly. The final displacements of the test and simulation after the collision were 303.64 mm and 307.86 mm, respectively, with a relative error of 1.39%. The energy absorption values of the test and simulation were 175.55 kJ and 178.87 kJ, respectively, with a relative error of 1.89%. The average forces of the test and simulation were 578.15 kN and 581.01 kN, respectively, with a relative error of 0.49%. The results of the experimental mean force and the simulated mean force in this model were almost consistent. This indicates that the finite element model is reliable and effective and can be used for subsequent research.

3.2. Evaluation Index

The energy-absorbing structure should have maximum energy absorption and minimum peak force based on a controllable deformation mode. This article uses the following five index parameters to evaluate the crashworthiness [41,42,43]: energy absorption (EA), specific energy absorption (ESA), mean force (FMC), peak force (FPC) and impact force efficiency (EIF).
EA represents the total energy absorbed by the structure during the deformation process, which can be expressed by the following formula:
E A = 0 S max F ( s ) d s
where F(s) is the function of impact force and displacement, and s is the effective impact displacement.
ESA is an important indicator for crashworthiness evaluation. It represents the amount of energy absorbed per unit mass and directly reflects the quality of the energy-absorbing structure design. Its formula is expressed as follows:
E S A = E A W m
where Wm represents the mass of the energy-absorbing circular tube.
FPC refers to the maximum impact force during the energy absorption process, which generally occurs in the initial stage. The magnitude of the peak force has a great impact on the safety of the train structure and passenger comfort, and it is required to be as close to the mean force as possible.
FMC refers to the average impact force under a given shrinkage displacement, and its formula is expressed as follows:
F M C = E A s
EIF refers to the uniformity of impact force and displacement response during the energy absorption process, which reflects the efficiency of the mean force. The calculation formula is as follows:
E I F = F M C F P C × 100 %

4. Main Causes and Response Surface Analysis

4.1. Design of Experiments

DOE (design of experiments) is a methodology that is widely used in optimization design. The research goal of DOE is to define a series of tests, analyze the impact of the influencing factors and construct an approximation model that can be used as an alternative model to the computationally intensive real model. Analyzing the principle of energy absorption, the shrink tube anti-climbing device mainly relies on the shrinkage deformation of the shrink tube and the friction of the cone surface to absorb energy. The main factors influencing the energy absorption effect include the cone angle of the shrink tube α, the thickness of the shrink tube T, the coefficient of friction u and the axial length of the friction cone surface S. The specific range of values for these parameters is shown in Table 2. In this paper, we adopt the DOE method to screen the influencing factors on the input variables of the energy-absorbing structure of the shrink tube anti-climbing device, in order to improve the efficiency of the subsequent optimization design. According to the design parameters in Table 2, we generated 300 groups of sample points for simulation calculations using the full factorial method to determine the effects of the design parameters on peak force, mean force and specific energy absorption.

4.2. Analysis of the Main Causes

Analysis of the main causes was used to compare the extent to which each variable affects the outcome, generally ignoring the effect of other variables when examining the effect of one of them. Linear effects were calculated using a linear regression model, where the range of design variables was set to [0, 1] in proportion to the change and expressed as a linear effect. The slope of the linear regression model represents the degree of influence of the parameter on the results; the larger the slope, the greater the influence of the parameter on the results. In this paper, we analyzed the degree of influence of variables such as the shrink tube cone angle α, shrink tube thickness T, friction coefficient u, and axial length of the friction cone surface S on the three responses, peak shrink tube force FPC, mean shrink tube force FMC and the specific energy absorption ESA. The results of the main cause analysis are shown in Figure 6. The peak force FPC was positively correlated with the cone angle α, the shrinkage tube thickness T and the friction coefficient u. The degree of influence, in descending order, was the cone angle α, the shrinkage tube thickness T and the friction coefficient u, and it was negatively correlated with the axial length of the friction cone surface S. The influence was the least for the axial length of the friction cone surface S. The effects of the four variables on FMC and FPC were basically the same, with only the amplitude being slightly reduced. The cone angle α had the greatest effect on ESA, and the gap with the other influencing factors was large. The friction coefficient u had a greater effect on ESA than that of the thickness T, and the axial length of the friction cone surface S showed the same negative correlation with ESA. Through the main cause analysis, it could be seen that the main factors affecting the energy absorption index were the cone angle α and the thickness of the shrinkage tube T. The friction coefficient was related to the lubrication method used in the actual working conditions, and the axial length of the friction cone had a small influence on the collision resistance index. In this paper, the outer surface of the shrink tube was evenly coated with lithium grease for lubrication. In order to improve efficiency, the cone angle α and the thickness of the shrinkage tube T were used as the input variables in the subsequent optimal design.

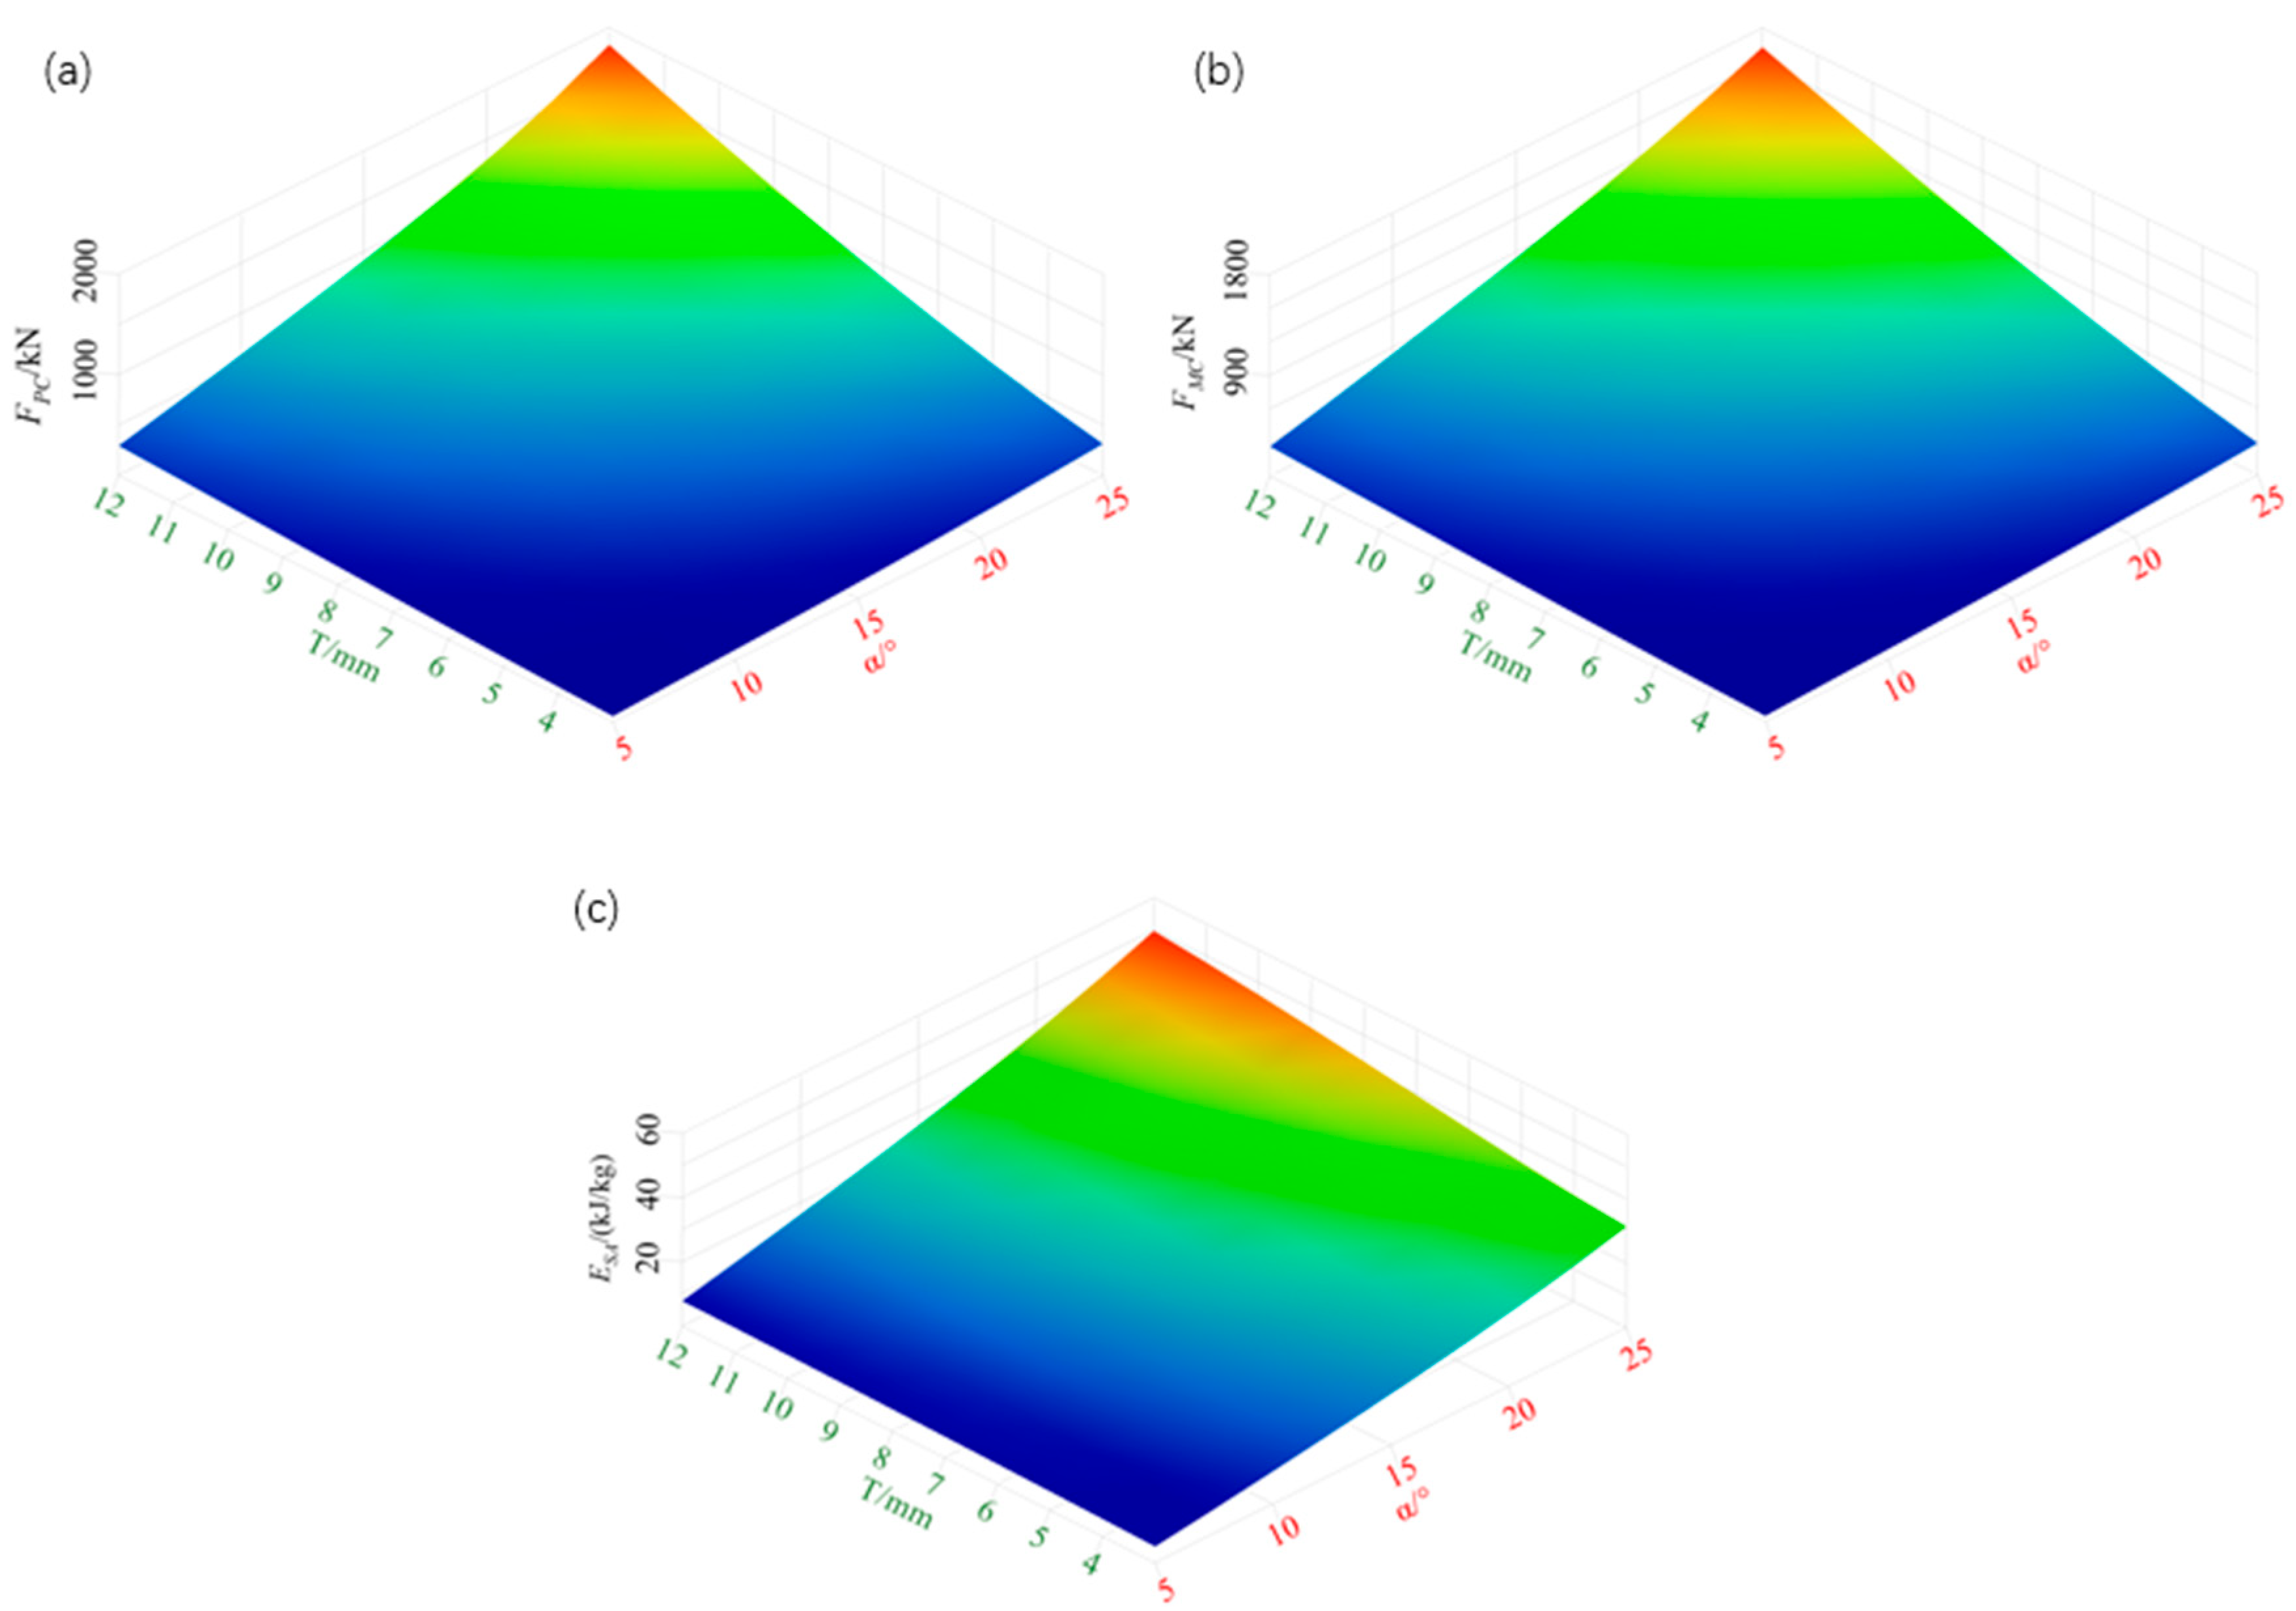
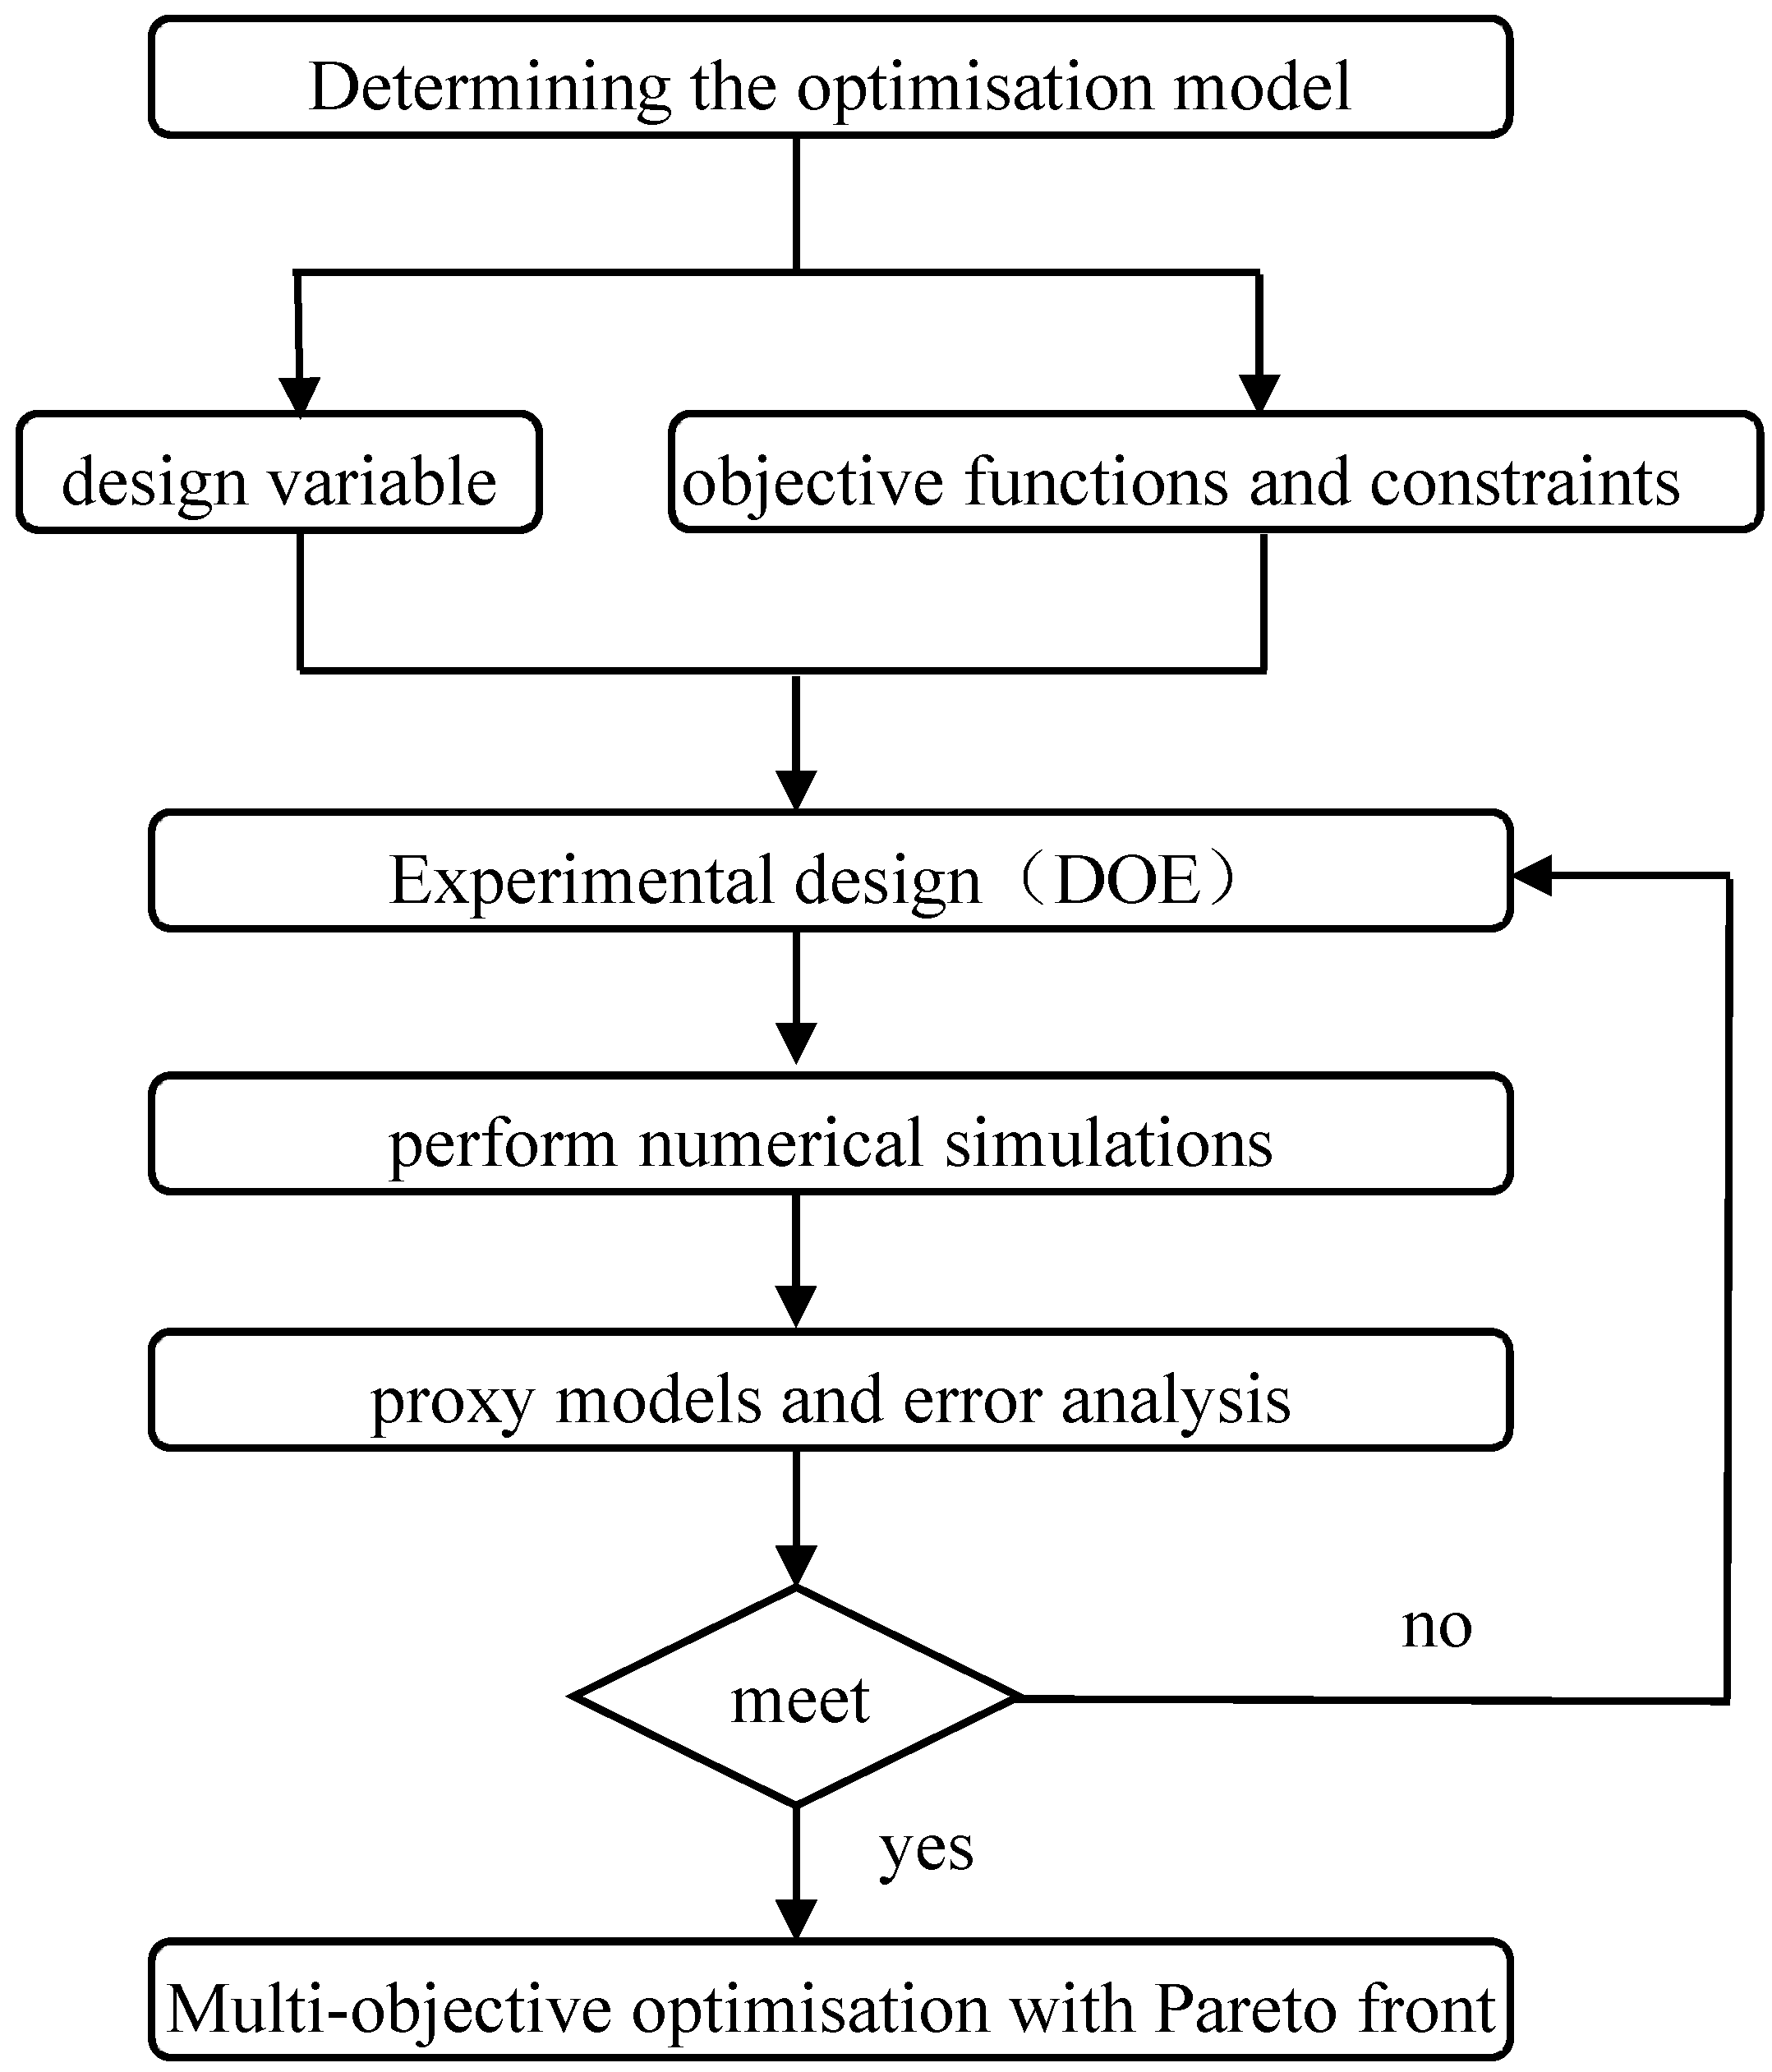
4.3. Response Surface Modelling and Agent Modelling

In order to obtain the three-dimensional cloud map of each output response, the two variables with less influence were set to the midpoint of their variation ranges. The other two design variables were both used as independent variables to construct each response surface, as shown in Figure 7, in accordance with the calculation results of the sample points in the experimental design. Figure 7 shows the response surface model of the peak force FPC, mean force FMC and specific energy absorption ESA of the energy-absorbing structure, from which we can see the impact of each variable on the response index. Both the peak force and the mean force of the shrink tube increased with the increase in the cone angle α and thickness T. The degree of influence of the two factors was relatively close, with the influence of the two factors having a greater effect on the peak force than on the average force. The specific energy absorption increased positively with the influence of the two factors. It grew faster with the increase in the cone angle α and relatively slower with the increase in the thickness T. Within the variable design interval, the mean force increased by 476.42% with thickness and by 515.72% with the angle, and the specific energy absorption increased by 58.59% with thickness and by 531.19% with the angle.
Practical engineering problems are often complex, usually do not have an explicit functional relationship between design variables and target performance, and manifest themselves as multi-parameter, high-dimensional, strongly nonlinear problems, which are difficult to compute with a simplified physical model and often need to be fitted to discrete data through a proxy model. In order to obtain optimization results efficiently and accurately, proxy methods are used to fit discrete data and build efficient models to replace the actual model without reducing the accuracy of the model. These models are also referred to as proxy models. Among them, the radial basis function is an efficient surrogate method, especially effective in predicting ESA with good accuracy. The mechanical behavior of the shrink tube anti-climb device during the impact energy absorption process is highly nonlinear; therefore, we used the radial basis function (RBF) to construct a proxy model for response surface analysis.
In order to evaluate the accuracy of the response model, corresponding error analysis and evaluation of the output indicators need to be performed using the coefficient of determination R2, the mean absolute error Eraa and the root mean square error Erms as evaluation parameters to verify the effectiveness of the proxy model [44]. These are calculated as follows:
R 2 = 1 ( y ^ i y i ) 2 ( y ^ i y ¯ i ) 2
E raa = 1 N i = 1 N y i y ^ i 1 N i = 1 N y i y ¯ i 2
E rms = ( y ^ i y i ) 2 N
where y ^ i is the predicted value of the proxy model at the point i ; y i is the actual finite element calculation value of the point; y ¯ i is the average of the actual response values of all sample points; and N is the number of sample points. When R2 is closer to 1 or Eraa and Erms are smaller, it indicates that the accuracy of the proxy model is higher. The error analysis results are shown in Table 3. It can be seen that the R2 of the agent model is above 0.99, indicating a high fitting accuracy and small error. The use of surrogate models can effectively reduce calculation time, and the high-precision fitting of FPC, FMC and ESA ensures the validity of subsequent optimization results.

5. Multi-Objective Optimization

5.1. Optimal Algorithm

Commonly used optimization algorithms include ARSM (adaptive response surface method), GRSM (global response surface method), GA (genetic algorithm) and MOGA (multi-objective genetic algorithm). Among them, GRSM can generate a response surface based on very few data points for computational optimization and will only stop optimization when the solution reaches the optimal value, unlike other algorithms that stop calculation after reaching the convergence criterion. After each iteration, GRSM generates new sampling points in the unsampled intervals of the global design domain based on the distribution of existing sampling points and constructs a new DOE. In this paper, the specific energy absorption ESA, peak force FPC and mean force FMC are taken as the optimization objectives, and the variables are designed for the cone angle α and the thickness of the shrinkage tube T. A series of sample points and their corresponding objective values of the sample points are generated through the design of experiments. The sample point data are then fitted using the Hyper-Study software (2019) to construct the agent model. Finally, the global response surface method (GRSM) is used to obtain the optimal solution for the structural parameters of the energy absorption device based on the agent model. The optimal solution of the structural parameter configuration of the device is obtained based on the proxy model using the GRSM. Due to the superior global search capability of the GRSM, computational optimization using response surfaces is well-suited for the optimal design of crashworthiness indexes for shrink tubes. The response surface fitted in this article has high accuracy, with errors generally less than 1%. This fitted response surface can be used for optimization analysis. Therefore, this article used the GRSM for multi-objective optimization, and the optimization design process is shown in Figure 8.

5.2. Optimization Objectives and Boundary Conditions

For this shrink tube anti-climb device, the technical requirements were as follows: an energy absorption of 228 kJ, an energy absorption stroke of 395mm, an average force range of 600 kN ± 7.5%, a small gap between the peak force and the average force and an original average force efficiency of more than 93%. The space for optimization of mean force efficiency was limited. In the crashworthiness design, the energy-absorbing structure is required to have the highest possible specific energy absorption ESA. Therefore, the first objective of the optimization was to maximize the specific energy absorption ESA, and at the same time, the peak force FPC needed to be reduced as much as possible in order to avoid excessive deceleration during the collision, which could lead to heavy casualties among occupants. Hence, the second objective of the optimization was to minimize the peak force FPC. In addition, for this shrink tube design, the mean force is required to be as close as possible to 600 kN while meeting the first two targets. Therefore, the third target of the optimization was to take the absolute value of the difference between the mean force FMC and 600 kN as the target of the mean force and to minimize it. Referring to the main cause analysis results, only two input variables, the cone angle α and the shrink tube thickness T, were considered in the optimal design. The friction coefficient u is related to the lubrication method used in the actual working conditions. This paper selected the original value of the friction coefficient u as 0.1 for the case of no lubrication, and the axial length of the friction cone S had a relatively small influence on the three indexes, and an intermediate value of 25 mm was used. In summary, this paper carried out the mathematical description of the multi-objective optimization problem and the boundary conditions, as shown in the following equation:
Max   E S A ( α , T ) Min   F P C ( α , T ) Min   F M C 600 5 ° α 25 ° 3   mm T 12   mm

5.3. Optimization Results

When there are multiple objectives, a solution that is best for one objective may be worse for others due to the presence of conflicting and incomparable objectives. These solutions, which necessarily weaken at least one other objective function while improving another, are called Pareto solutions. The set of optimal solutions for a set of objective functions is called a Pareto front. In a multi-objective optimization problem, there is more than one objective function to be maximized or minimized, so the ultimate goal is not to seek a single optimal solution but to seek a Pareto front. This Pareto front needs to be selected from the set of Pareto optimal solutions according to the specifics of the problem. In order to obtain an ideal shrink tube energy-absorbing structure, it is required that the peak force FPC is the minimum and the specific energy absorption ESA is the maximum. In this paper, multi-objective optimal design was carried out using the GRSM algorithm with cone angle α and pipe wall thickness T as design variables, and the obtained Pareto front solution set is shown in Figure 9. Figure 9 shows that the peak force FPC of the shrinkage tube and the specific absorption energy ESA have a positive correlation, and as the specific absorption energy ESA increases, the peak force FPC of the shrinkage tube also increases. Therefore, the two objectives of the minimum peak force FPC and the maximum specific absorption energy ESA have mutual exclusivity, which makes it difficult to select the optimal structural parameters.
Although the Pareto solution set has more advantages in solving optimal design solutions, the optimal solution must be selected to quantitatively analyze the optimization results. Combined with the technical requirements of the actual engineering problems on the mean force, a set of solutions with the mean force FMC closest to 600 kN was selected as the optimal solution when the optimization objective three took the minimum value. The optimized parameters were a cone angle α value of 20.2°, a pipe wall thickness T value of 7.1 mm, a peak force FPC of 658.16 kN, a specific energy absorption ESA of 29.73 kJ/kg and a mean force FMC of 613.23 kN. The error between the mean force and the design objective was 2.2%, which meets the requirement of a mean force error of less than or equal to 7.5%. In order to verify the reliability of the optimization prediction results, finite element simulation calculations were performed on the structural parameters obtained from the optimization results. The comparison between the optimization prediction results and the finite element simulation calculation results is shown in Table 4. It could be seen that the finite element calculation results were close to the optimization prediction results. The peak force error was 1.46%, the specific energy absorption error was 1.33%, and the mean force error was 1.31%. All errors were less than 1.5%, indicating that the optimization results have high accuracy and reliability.

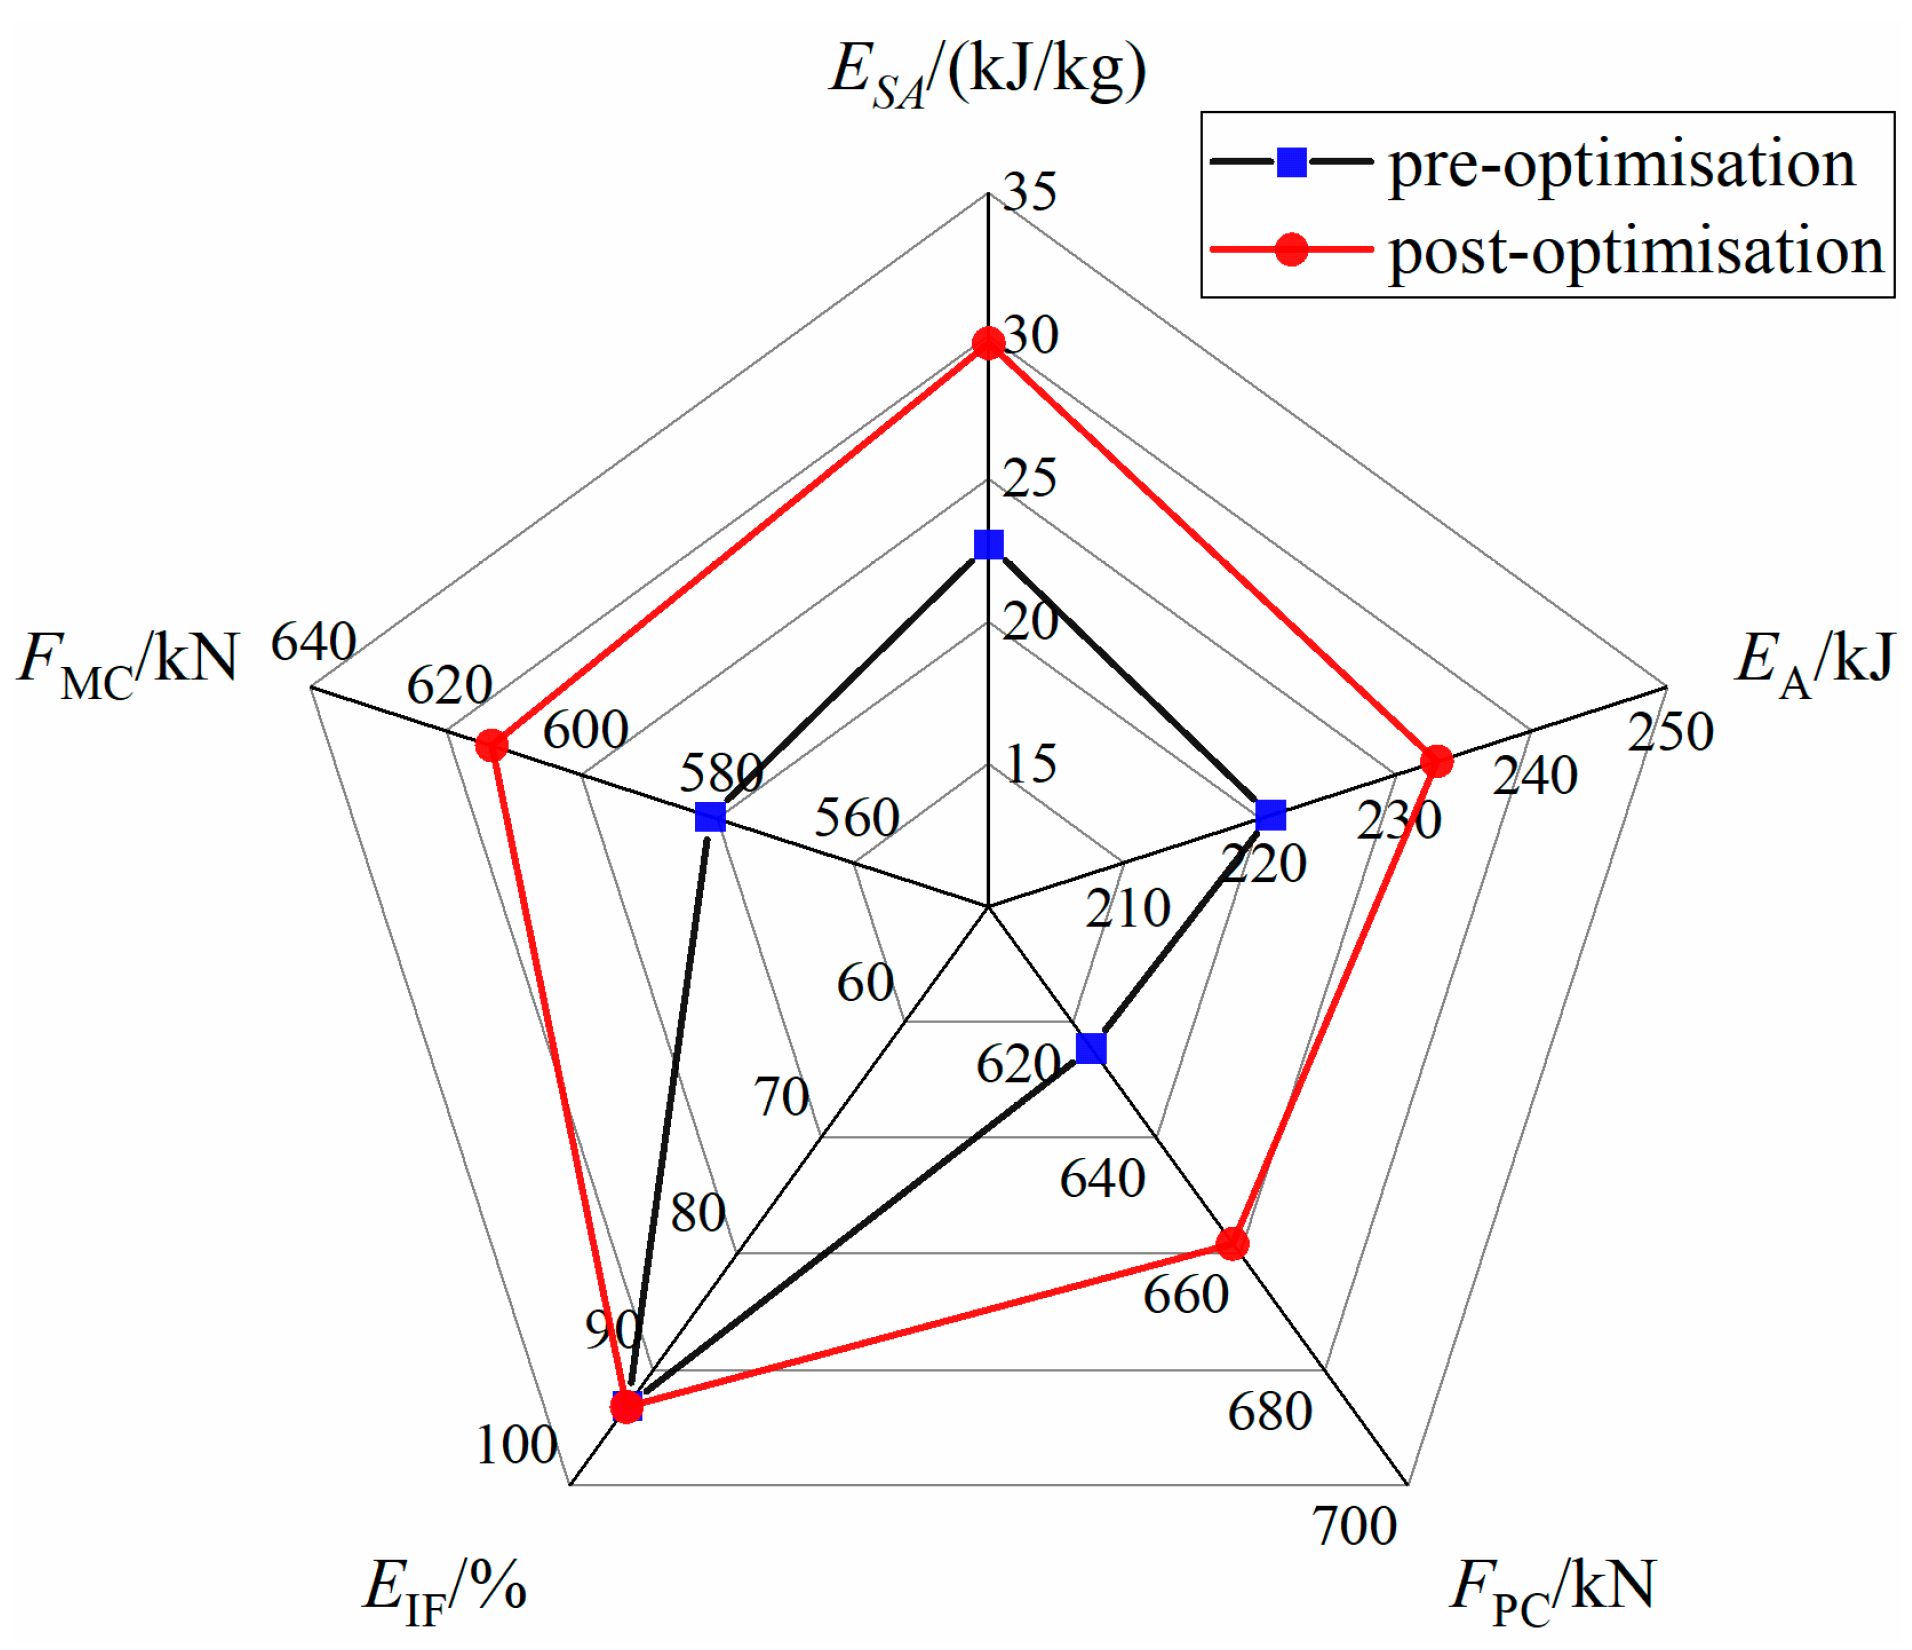
5.4. Comparison of Crashworthiness

The comparison between the optimized crashworthiness index and the original structure is shown in Table 5. In order to more intuitively show the improvement of crashworthiness, a radar chart of various crashworthiness indexes was drawn, as shown in Figure 10. The radar chart shows that, except for the average force efficiency, which remained almost unchanged, the other four indicators improved to varying degrees. The most important improvement was the specific energy absorption index, reaching 31.03%. The energy absorption, peak force and average force increased by 5.5%, 5.41% and 5.55%, respectively. The amplitudes were basically the same and the average force efficiency basically remained unchanged. This indicates that the crashworthiness of the optimized structure has been improved.

6. Conclusions

In this paper, a structural innovation for an anti-climbing energy absorption device with a shrink tube was presented, and its practical engineering application was demonstrated on the train. The effects of some structural parameters on the crashworthiness of the shrink tube were studied. A proxy model was constructed using a radial basis function, and the global response surface methodology was adopted to optimize the design of the shrink tube structure, so as to determine the optimal configuration scheme of its structural parameters. This article only selected some factors for optimizing the design variables. Further, different optimization methods can be used to conduct comparative research on all factors. The main conclusions of this study are summarized as follows:
(1)
The effects of the cone angle, shrink tube thickness, friction coefficient and friction cone axial length on the crashworthiness of the shrink tube were studied, and the main causes were analyzed. It was found that the cone angle and thickness had the greatest impact on crashworthiness. Within the variable design interval, the mean force increased by 476.42% and 515.72% with the thickness and angle, respectively, and the specific energy absorption increased by 58.59% and 531.19% with the thickness and angle, respectively.
(2)
The global response surface method was used to perform multi-objective optimization on the structural parameters of the shrink tube. Among the optimal structural parameters obtained, the cone angle was 20.2°, the tube wall thickness was 7.1 mm, the friction coefficient was 0.1 and the friction cone axial direction length was 25 mm. After optimization, the specific absorption energy was 29.73 kJ (kg)−1, which was 31.03% higher than before optimization.
(3)
The mean force obtained through surrogate model optimization was 613.23 kN. The mean force obtained by simulating the optimal structural parameters was 605.32 kN. The mean force error was 1.31%, which shows that the surrogate model has high accuracy.

Author Contributions

Conceptualization, S.Y.; Methodology, F.Z.; Software, F.Z.; Validation, F.Z.; Formal analysis, F.Z.; Investigation, F.Z.; Resources, S.Y.; Data curation, F.Z.; Writing—original draft preparation, F.Z.; Writing—review and editing, S.Y.; Visualization, F.Z.; Supervision, S.Y.; Project administration, S.Y.; Funding acquisition, S.Y. All authors have read and agreed to the published version of the manuscript.

Funding

This work was supported by the National Key Research and Development Program of China [2021YFB3703801].

Institutional Review Board Statement

Not applicable.

Informed Consent Statement

Not applicable.

Data Availability Statement

The original contributions presented in the study are included in the article, further inquiries can be directed to the corresponding author.

Conflicts of Interest

The authors declare no conflicts of interest.

References

  1. Chen, Z.; Zhai, W.; Cai, C.; Sun, Y. Safety threshold of high-speed railway pier settlement based on train-track-bridge dynamic interaction. Sci. China-Technol. Sci. 2015, 58, 202–210. [Google Scholar] [CrossRef]
  2. Wang, T.; Wang, L.; Wang, C.; Zou, X. Crashworthiness analysis and multi-objective optimization of a commercial vehicle frame: A mixed meta-modeling-based method. Adv. Mech. Eng. 2018, 10, 1687814018778480. [Google Scholar] [CrossRef]
  3. Fang, J.; Gao, Y.; Sun, G.; Zhang, Y.; Li, Q. Crashworthiness design of foam-filled bitubal structures with uncertainty. Int. J. Non-Linear Mech. 2014, 67, 120–132. [Google Scholar] [CrossRef]
  4. Xiao, Z.; Fang, J.; Sun, G.; Li, Q. Crashworthiness design for functionally graded foam-filled bumper beam. Adv. Eng. Softw. 2015, 85, 81–95. [Google Scholar] [CrossRef]
  5. He, Q.; Ma, D.; Zhang, Z.; Yao, L. Mean compressive stress constitutive equation and crashworthiness optimization design of three novel honeycombs under axial compression. Int. J. Mech. Sci. 2015, 99, 274–287. [Google Scholar] [CrossRef]
  6. Ko, Y.; Ahn, K.; Huh, H.; Choi, W.; Jung, H.; Kwon, T. Evaluation of Crash Energy Absorption Capacity of a Tearing Tube. Exp. Appl. Mech. 2011, 6, 647–654. [Google Scholar]
  7. Liu, Y.; Qiu, X. A theoretical study of the expansion metal tubes. Int. J. Mech. Sci. 2016, 114, 157–165. [Google Scholar] [CrossRef]
  8. Liu, Y.; Qiu, X.; Wang, W.; Yu, T.X. An improved two-arcs deformational theoretical model of the expansion tubes. Int. J. Mech. Sci. 2017, 133, 240–250. [Google Scholar] [CrossRef]
  9. Yang, J.; Luo, M.; Hua, Y.; Lu, G. Energy absorption of expansion tubes using a conical–cylindrical die: Experiments and numerical simulation. Int. J. Mech. Sci. 2010, 52, 716–725. [Google Scholar] [CrossRef]
  10. Yan, J.; Yao, S.; Xu, P.; Peng, Y.; Shao, H.; Zhao, S. Theoretical prediction and numerical studies of expanding circular tubes as energy absorbers. Int. J. Mech. Sci. 2016, 105, 206–214. [Google Scholar] [CrossRef]
  11. Yao, S.; Yan, K.; Lu, S.; Xu, P. Prediction and application of energy absorption characteristics of thin-walled circular tubes based on dimensional analysis. Thin-Walled Struct. 2018, 130, 505–519. [Google Scholar] [CrossRef]
  12. Hu, Y.; Liu, C.; Zhang, J.; Ding, G.; Wu, Q. Research on carbon fiber-reinforced plastic bumper beam subjected to low-velocity frontal impact. Adv. Mech. Eng. 2015, 7, 1687814015589458. [Google Scholar] [CrossRef]
  13. Tang, Z.; Liu, F.J.; Guo, S.H.; Chang, J.; Zhang, J.J. Evaluation of coupled finite element/meshfree method for a robust full-scale crashworthiness simulation of railway vehicles. Adv. Mech. Eng. 2016, 8, 1687814016642954. [Google Scholar] [CrossRef]
  14. Daxner, T.; Rammerstorfer, F.G.; Fischer, F.D. Instability phenomena during the conical expansion of circular cylindrical shells. Comput. Methods Appl. Mech. Eng. 2005, 194, 2591–2603. [Google Scholar] [CrossRef]
  15. Fischer, F.D.; Rammerstorfer, F.G.; Daxner, T. Flaring—An analytical approach. Int. J. Mech. Sci. 2006, 48, 1246–1255. [Google Scholar] [CrossRef]
  16. Shakeri, M.; Salehghaffari, S.; Mirzaeifar, R. Expansion of circular tubes by rigid tubes as impact energy absorbers: Experimental and theoretical investigation. Int. J. Crashworthiness 2007, 12, 493–501. [Google Scholar] [CrossRef]
  17. Seibi, A.C.; Al-Hiddabi, S.; Pervez, T. Structural Behavior of a Solid Tubular Under Large Radial Plastic Expansion. J. Energy Resour. Technol. 2005, 127, 323–327. [Google Scholar] [CrossRef]
  18. Seibi, A.C.; Barsoum, I.; Molki, A. Experimental and Numerical Study of Expanded Aluminum and Steel Tubes. Procedia Eng. 2011, 10, 3049–3055. [Google Scholar] [CrossRef]
  19. Karrech, A.; Seibi, A. Analytical model for the expansion of tubes under tension. J. Mater. Process. Technol. 2010, 210, 356–362. [Google Scholar] [CrossRef]
  20. Liu, Y.; Qiu, X.; Yu, T.X. A theoretical model of the inversion tube over a conical die. Thin-Walled Struct. 2018, 127, 31–39. [Google Scholar] [CrossRef]
  21. Niknejad, A.; Moeinifard, M. Theoretical and experimental studies of the external inversion process in the circular metal tubes. Mater. Des. 2012, 40, 324–330. [Google Scholar] [CrossRef]
  22. Rosa, P.; Baptista, R.; Rodrigues, J.; Martins, P. An investigation on the external inversion of thin-walled tubes using a die. Int. J. Plast. 2004, 20, 1931–1946. [Google Scholar] [CrossRef]
  23. Rosa, P.A.R.; Rodrigues, J.M.C.; Martins, P.A.F. External inversion of thin-walled tubes using a die: Experimental and theoretical investigation. Int. J. Mach. Tools Manuf. 2003, 43, 787–796. [Google Scholar] [CrossRef]
  24. Yu, X.; Qiu, X.; Yu, T.X. Analysis of the free external inversion of circular tubes based on deformation theory. Int. J. Mech. Sci. 2015, 100, 262–268. [Google Scholar] [CrossRef]
  25. Yu, X.; Qiu, X.; Yu, T.X. Theoretical model of a metal tube under inversion over circular dies. Int. J. Mech. Sci. 2016, 108–109, 23–28. [Google Scholar] [CrossRef]
  26. Huang, X.; Lu, G.; Yu, T.X. On the axial splitting and curling of circular metal tubes. Int. J. Mech. Sci. 2002, 44, 2369–2391. [Google Scholar] [CrossRef]
  27. Moreno, C.; Beaumont, R.; Hughes, D.J.; Williams, T.; Dashwood, R. Quasi-static and dynamic testing of splitting, expansion and expansion-splitting hybrid tubes under oblique loading. Int. J. Impact Eng. 2017, 100, 117–130. [Google Scholar] [CrossRef]
  28. Moreno, C.; Williams, T.; Beaumont, R.; Hughes, D.J.; Dashwood, R. Testing, simulation and evaluation of a novel hybrid energy absorber. Int. J. Impact Eng. 2016, 93, 11–27. [Google Scholar] [CrossRef]
  29. Niknejad, A.; Rezaei, B.; Liaghat, G.H. Empty circular metal tubes in the splitting process—Theoretical and experimental studies. Thin-Walled Struct. 2013, 72, 48–60. [Google Scholar] [CrossRef]
  30. Rouzegar, J.; Karimi, M. Numerical and experimental study of axial splitting of circular tubular structures. Thin-Walled Struct. 2016, 105, 57–70. [Google Scholar] [CrossRef]
  31. Li, J.; Gao, G.; Guan, W.; Wang, S.; Yu, Y. Experimental and numerical investigations on the energy absorption of shrink circular tube under quasi-static loading. Int. J. Mech. Sci. 2018, 137, 284–294. [Google Scholar] [CrossRef]
  32. Yao, S.; Li, Z.; Ma, W.; Xu, P. Crashworthiness analysis of a straight-tapered shrink tube. Int. J. Mech. Sci. 2019, 157–158, 512–527. [Google Scholar] [CrossRef]
  33. Liu, Y.; Qiu, X. A theoretical model of the shrinking metal tubes. Int. J. Mech. Sci. 2018, 144, 564–575. [Google Scholar] [CrossRef]
  34. Almeida, B.P.P.; Alves, M.L.; Rosa, P.A.R.; Brito, A.G.; Martins, P.A.F. Expansion and reduction of thin-walled tubes using a die: Experimental and theoretical investigation. Int. J. Mach. Tools Manuf. 2006, 46, 1643–1652. [Google Scholar] [CrossRef]
  35. Alves, M.L.; Almeida, B.P.P.; Rosa, P.A.R.; Martins, P.A.F. End forming of thin-walled tubes. J. Mater. Process. Technol. 2006, 177, 183–187. [Google Scholar] [CrossRef]
  36. Guan, W.; Gao, G.; Yu, Y. Crushing analysis and multiobjective crashworthiness optimization of combined shrinking circular tubes under impact loading. Struct. Multidiscip. Optim. 2021, 64, 1649. [Google Scholar] [CrossRef]
  37. Tanaskovic, J.; Milkovic, D.; Lucanin, V.; Vasic Franklin, G. Experimental investigations of the shrinking–splitting tube collision energy absorber. Thin-Walled Struct. 2015, 86, 142–147. [Google Scholar] [CrossRef]
  38. ISO 6892-1:2009; Metallic Materials—Tensile Testing. Part 1: Method of Test at Room Temperature. ISO: Geneva, Switzerland, 2009.
  39. Fang, J.; Sun, G.; Qiu, N.; Kim, N.H.; Li, Q. On design optimization for structural crashworthiness and its state of the art. Struct. Multidiscip. Optim. 2017, 55, 1091–1119. [Google Scholar] [CrossRef]
  40. Guan, W.; Gao, G. Crashworthiness analysis of shrink circular tube energy absorbers with anti-climbers under multiple loading cases. Mech. Adv. Mater. Struct. 2022, 30, 1453–1469. [Google Scholar] [CrossRef]
  41. Gao, G.; Guan, W.; Li, J.; Dong, H.; Zou, X.; Chen, W. Experimental investigation of an active-passive integration energy absorber for railway vehicles. Thin-Walled Struct. 2017, 117, 89–97. [Google Scholar] [CrossRef]
  42. Xie, S.; Zhou, H. Analysis and optimisation of parameters influencing the out-of-plane energy absorption of an aluminium honeycomb. Thin-Walled Struct. 2015, 89, 169–177. [Google Scholar] [CrossRef]
  43. Aye, C.M.; Pholdee, N.; Yildiz, A.R.; Bureerat, S.; Sait, S.M. Multi-surrogate-assisted metaheuristics for crashworthiness optimisation. Int. J. Veh. Des. 2019, 80, 223–240. [Google Scholar] [CrossRef]
  44. Peta, K.; Żurek, J. Prediction of Air Leakage in Heat Exchangers for Automotive Applications Using Artificial Neural Networks; Faculty of Mechanical Engineering and Management, Poznan University of Technology: Poznan, Poland, 2018. [Google Scholar]
Figure 1. Structure description of the shrink tube anti-climb device: (a) installation diagram; (b) size detail drawing; (c) axonometric drawing; (d) semi-sectional view.
Applsci 14 07347 g001
Figure 2. Quasi-static test: (a) test equipment; (b) standard size of material specimen; (c) test specimen and true stress-strain curve.
Applsci 14 07347 g002
Figure 3. Trolley test collision model.
Applsci 14 07347 g003
Figure 4. Test scenario.
Applsci 14 07347 g004
Figure 5. Shrink tube deformation plots and force versus displacement curves: (a) test deformation diagram; (b) simulation deformation diagram; (c) comparison of simulation and test force and displacement curves.
Applsci 14 07347 g005
Figure 6. Main cause analysis: (a) effect on peak force; (b) effect on mean force; (c) effect on specific energy absorption.
Applsci 14 07347 g006
Figure 7. Response surface model diagram: (a) effect on peak force; (b) effect on mean force; (c) effect of specific energy absorption.
Applsci 14 07347 g007
Figure 8. Multi-objective optimization process.
Applsci 14 07347 g008
Figure 9. Pareto front: (a) Pareto front of specific energy absorption versus the peak force; (b) Pareto front of mean force target value and peak force.
Applsci 14 07347 g009
Figure 10. Radar map of crashworthiness indicators before and after optimization.
Applsci 14 07347 g010
Table 1. Grid convergence analysis.
Mesh Size/mmMean Force/kNRelative Error (%)
5 × 5 × 570022.16
4 × 4 × 45872.44
3 × 3 × 3573-
Table 2. Variable values.
Variable NamesCone Angle αThicknesses T/mmFriction Coefficient uAxial Length S/mm
Variable values5, 15, 253, 6, 9, 120.02, 0.04, 0.06, 0.08, 0.121, 23, 25, 27, 29
Table 3. Error analysis results.
VariantR2EraaErms
FPC0.9990.0077.789
FMC0.9910.05218.986
ESA0.9990.0080.133
Table 4. Comparison of simulation and optimization results.
IndicatorFPC/kNESA/(kJ/kg)FMC/kN
optimal value658.1629.73613.23
simulation value648.7129.34605.32
errors1.46%1.33%1.31%
Table 5. Comparison of original design and optimization results.
IndicatorESA/(kJ/kg)EA/kJFPC/kNEIF/%FMC/kN
original value22.69220.78624.4193.05581.01
optimal value29.73233.03658.1693.17613.23
elevation31.03%5.5%5.41%0.13%5.55%
Disclaimer/Publisher’s Note: The statements, opinions and data contained in all publications are solely those of the individual author(s) and contributor(s) and not of MDPI and/or the editor(s). MDPI and/or the editor(s) disclaim responsibility for any injury to people or property resulting from any ideas, methods, instructions or products referred to in the content.

