
State Evaluation of Electrical Equipment in Substations Based on Data Mining

Abstract
:1. Introduction
- The proposed state assessment algorithm integrates the a priori algorithm with a Naive Bayes classifier. The former efficiently identifies frequent itemset, revealing operational patterns and correlations, including co-occurrence of equipment failures under specific conditions. This provides valuable input for subsequent state classification. The Naive Bayes classifier utilizes the association rules discovered by a priori to swiftly classify device states, enhancing predictive capabilities in specific contexts.
- Gaussian mixture models are employed to unify state characteristics of electrical equipment across varying environments, loads, and operating conditions. These models provide a cohesive description of state features, identifying commonalities and differences across states, offering high flexibility and adaptability. This approach minimizes the impact of environmental interference and varying working conditions on status monitoring data, enhancing the reliability of final evaluation results.
2. Methodology
2.1. Equipment Status Characteristics
2.2. Data Analysis
2.3. Association Rules
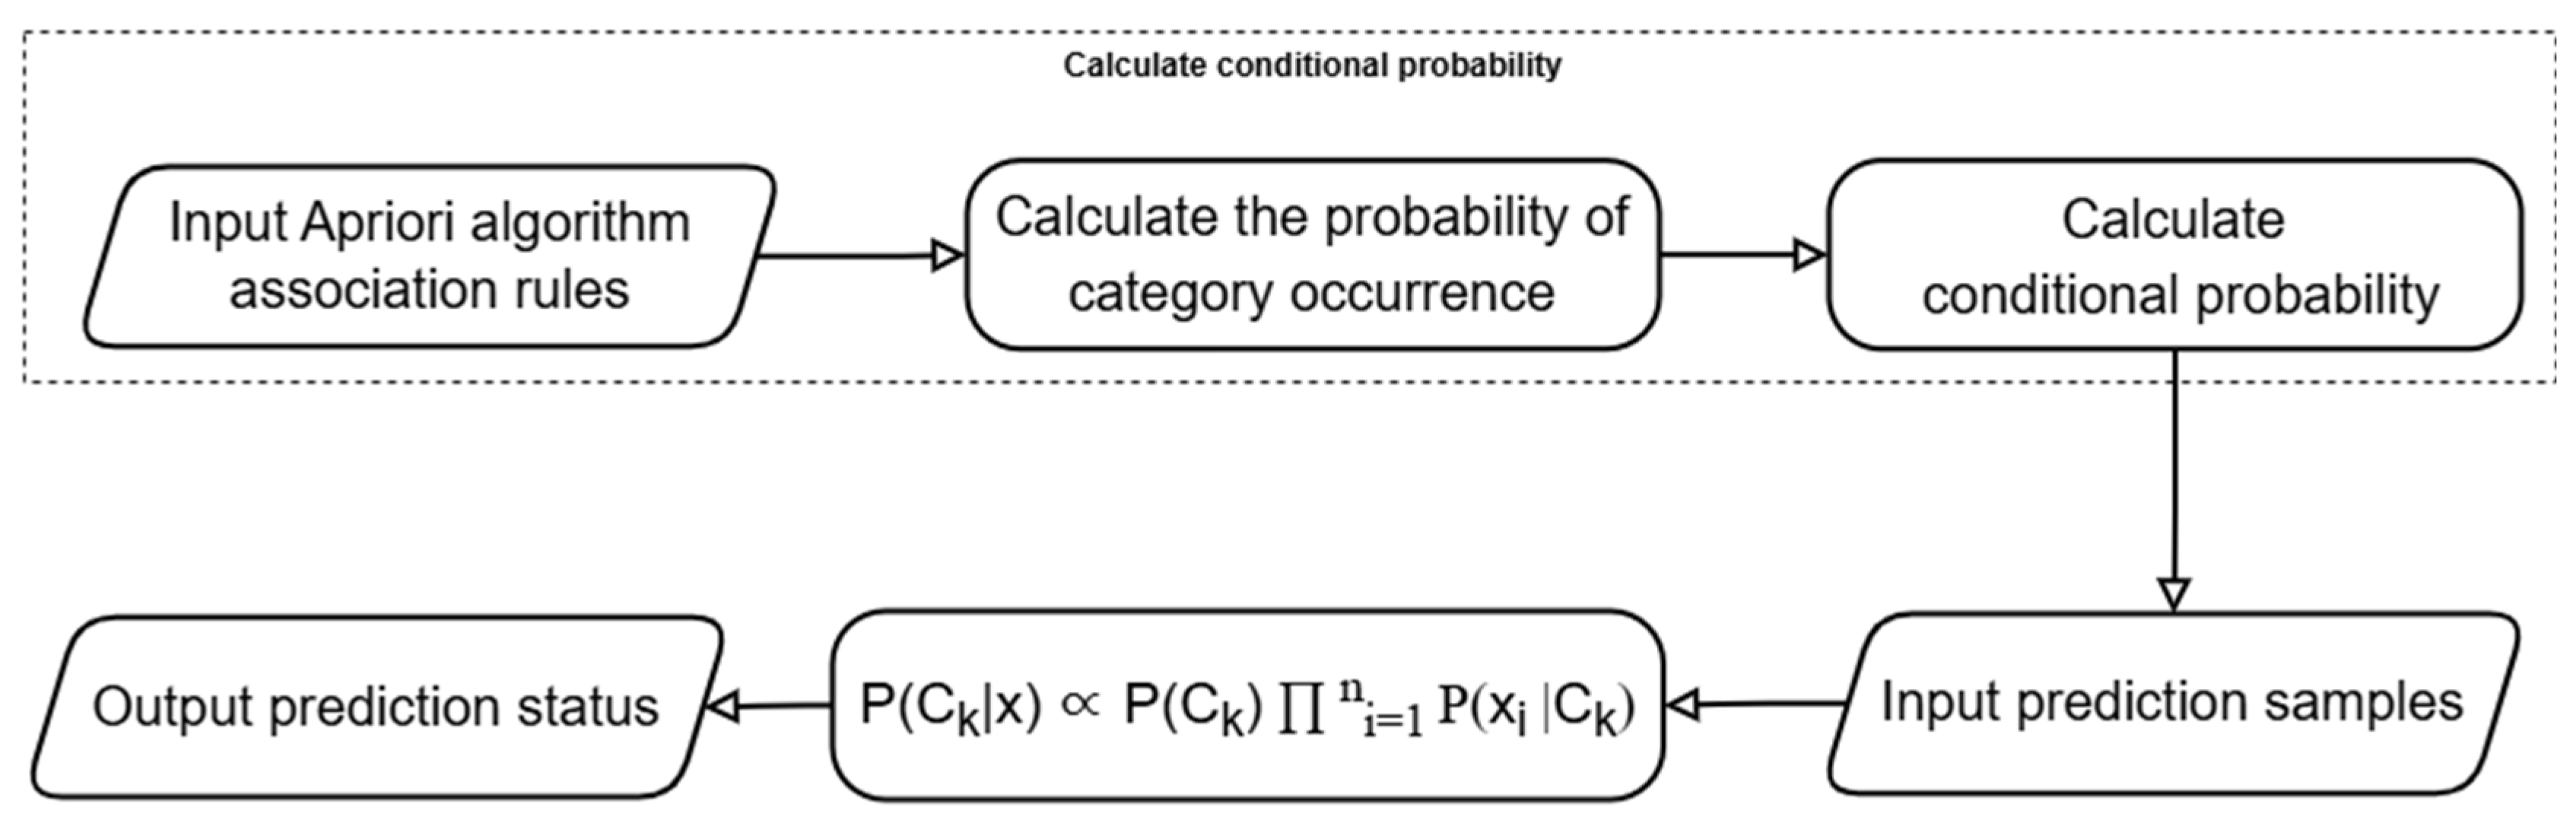
2.4. Methods of State Evaluation of Electrical Equipment
- Combine association rules with higher value for the same state.
- For rules with equal value, select the one with the highest confidence for that state.
- For rules with equal value, choose the one with higher value as the state’s association rule.
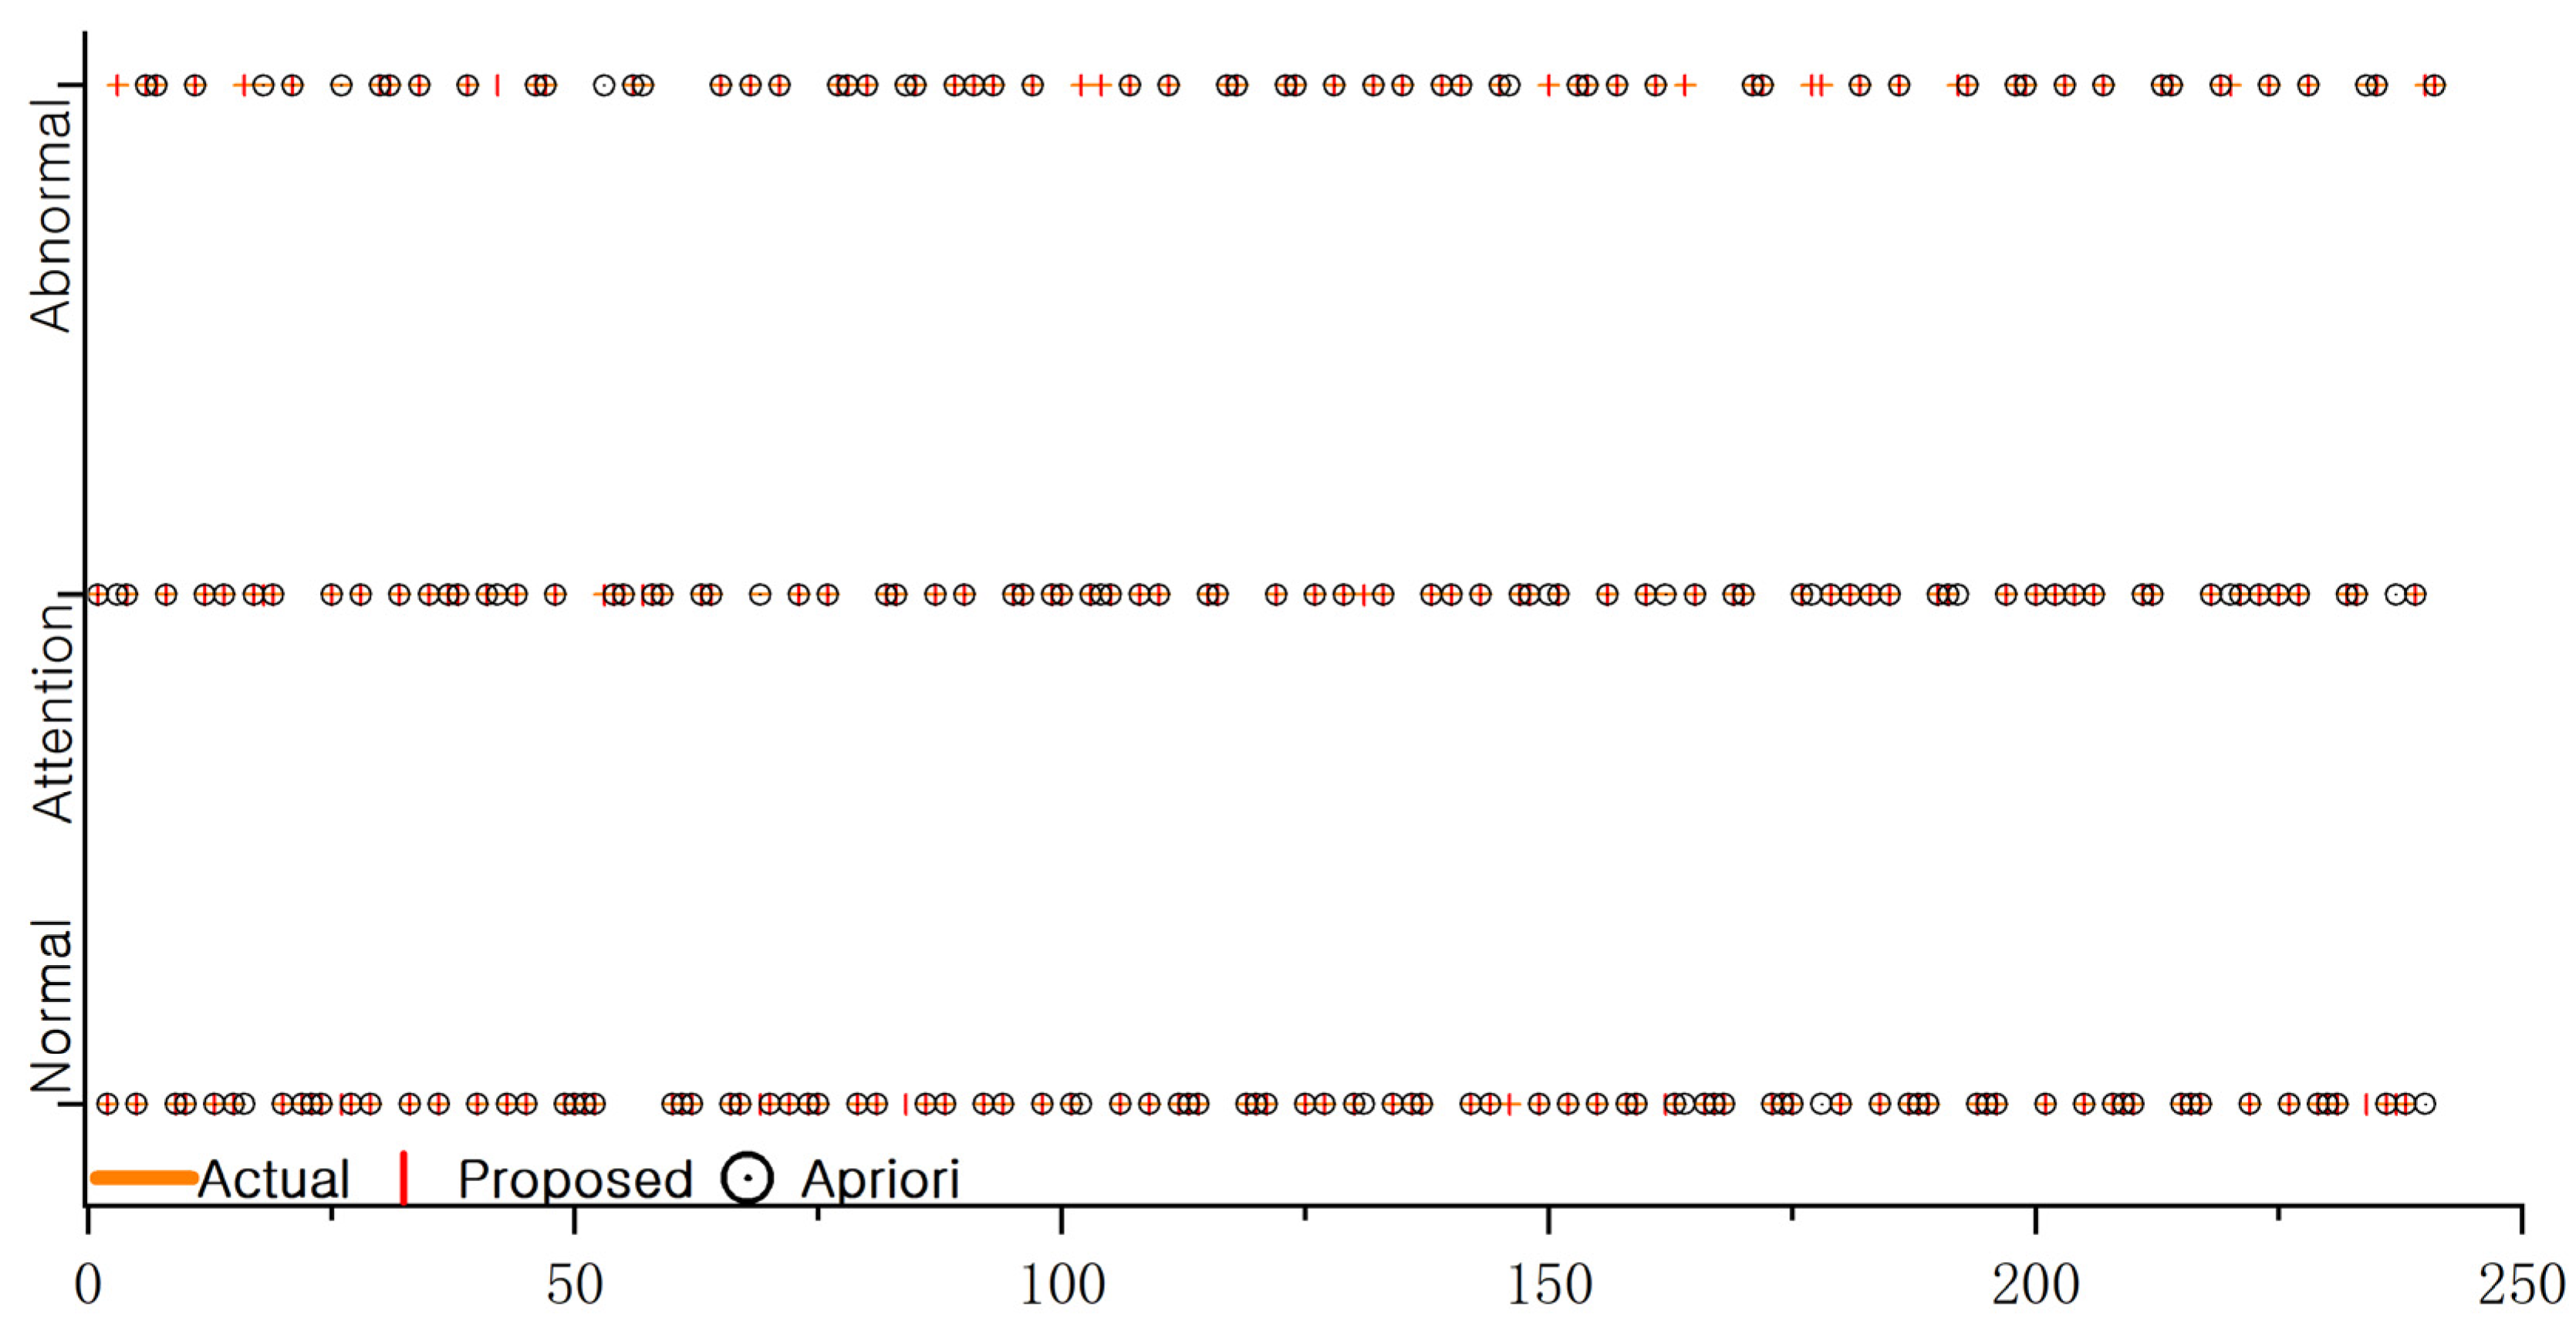
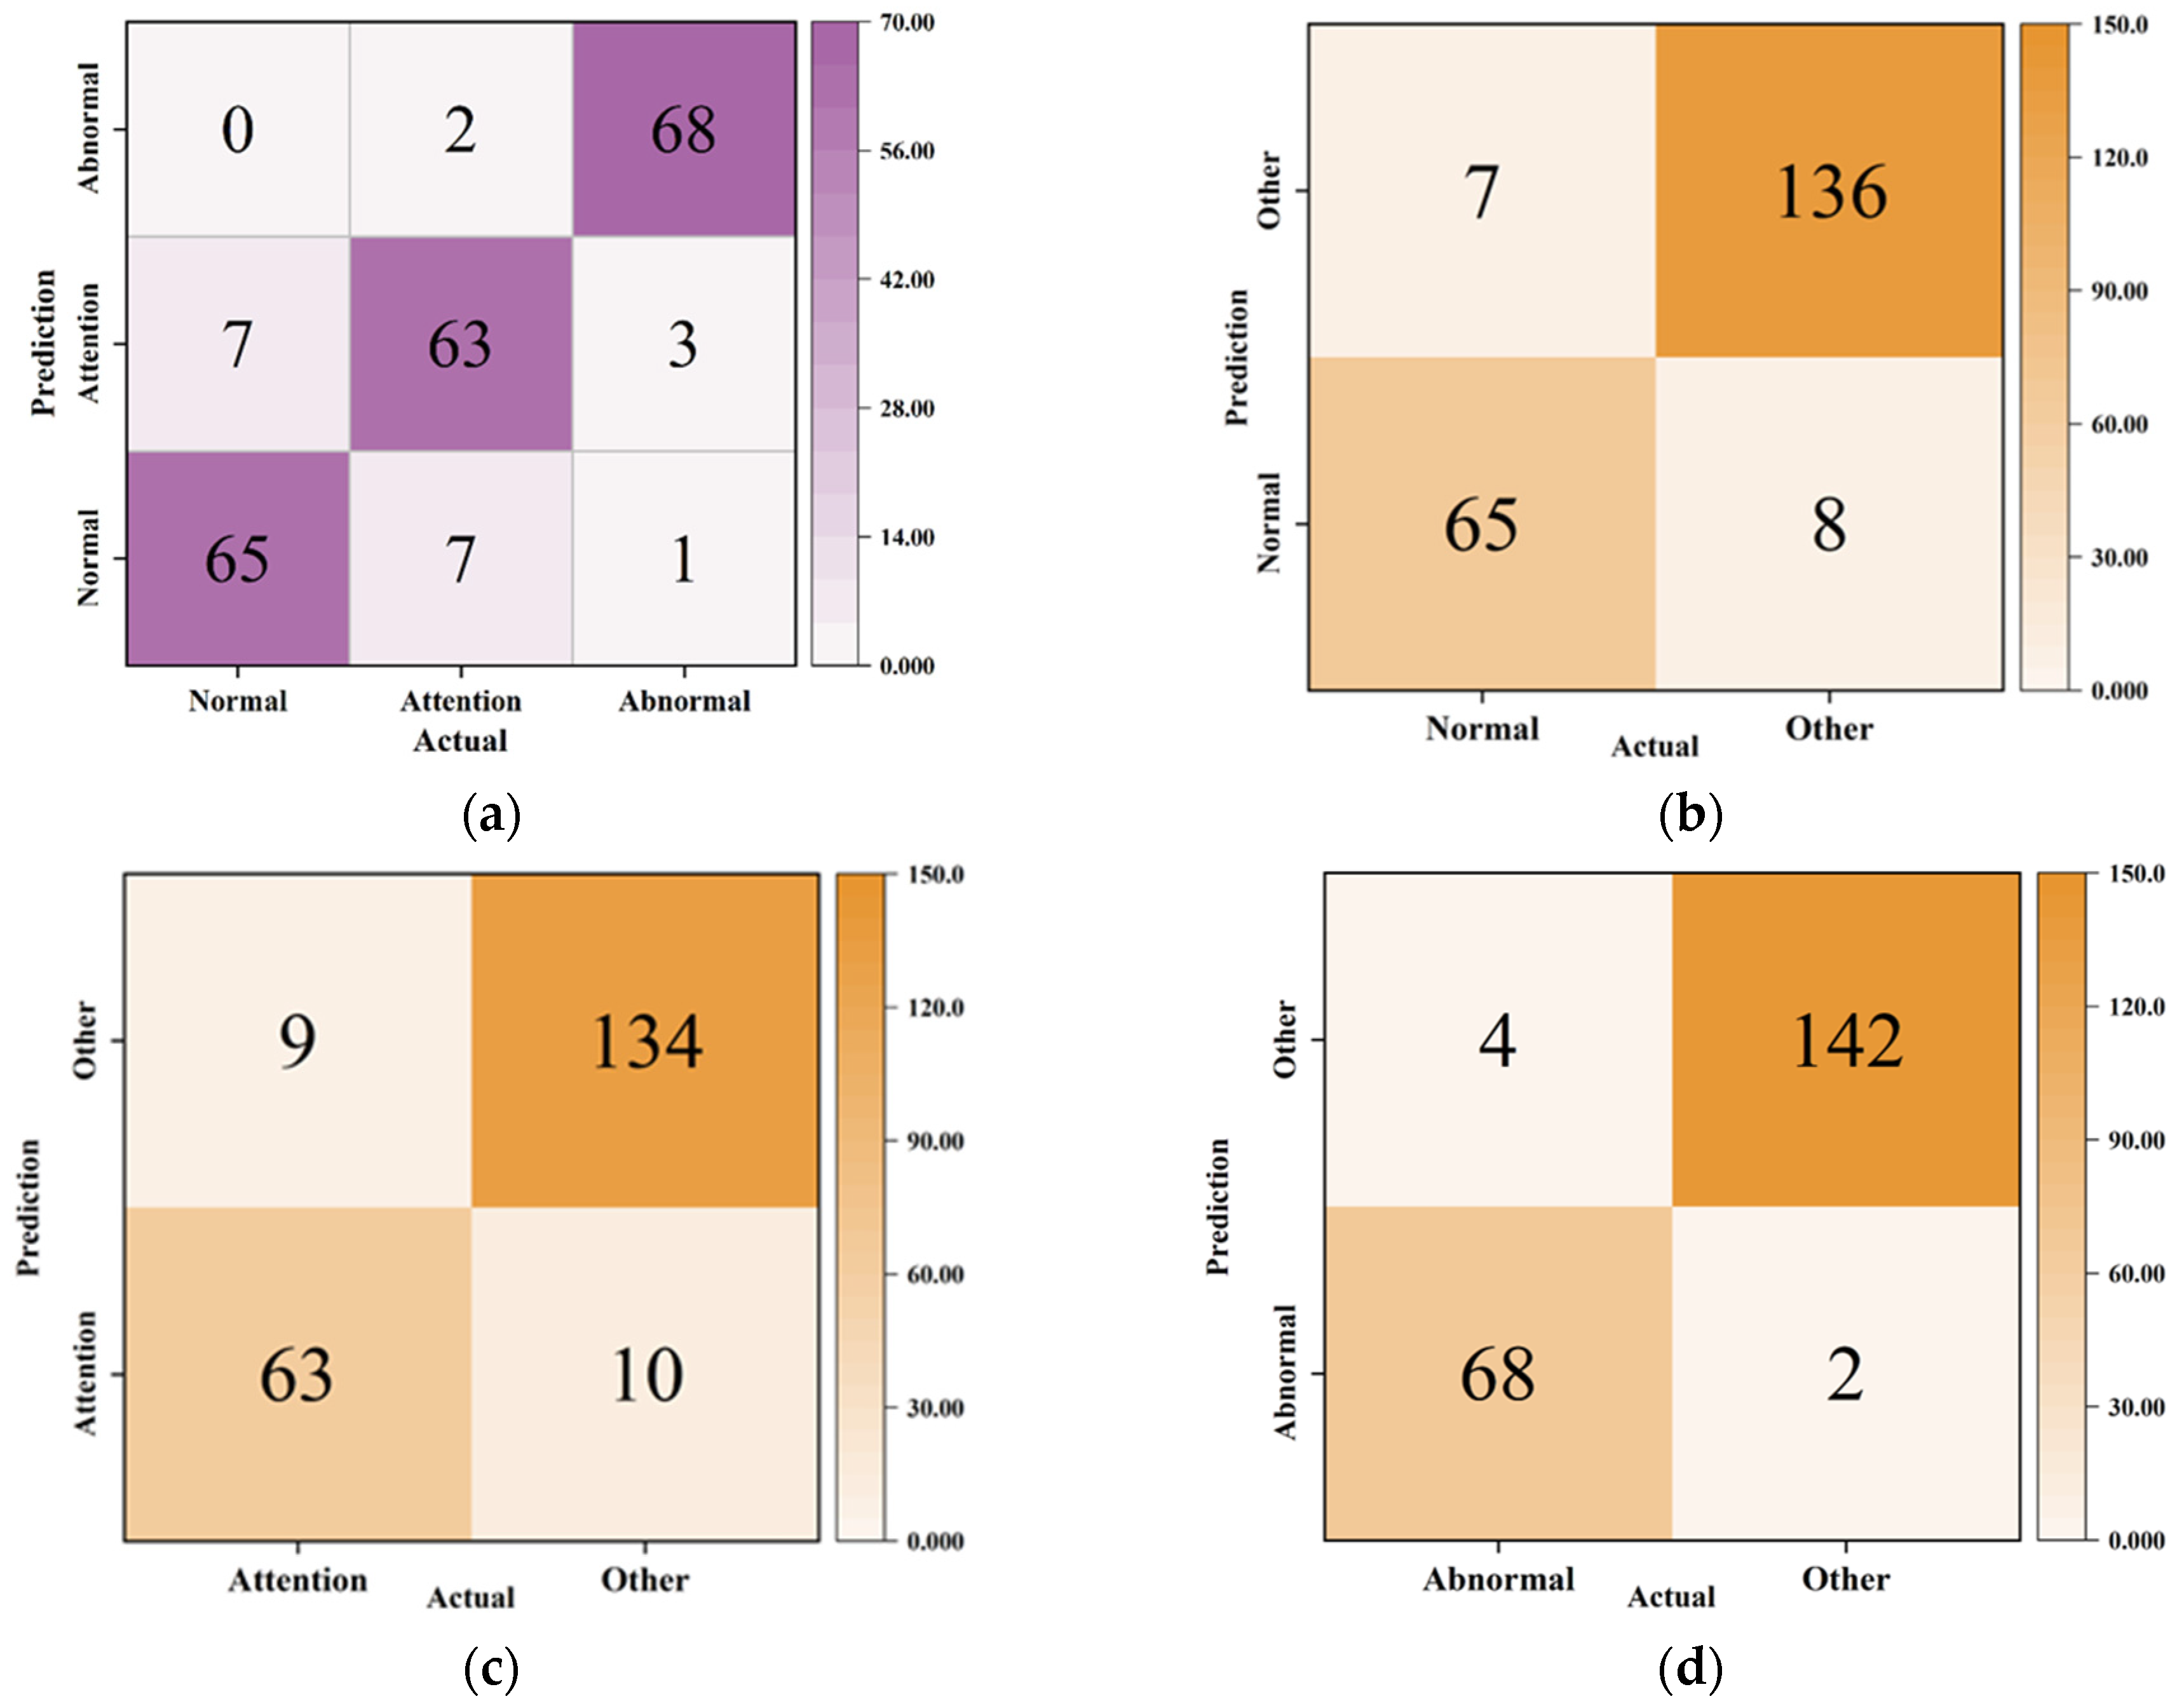
2.5. Case Study
- (1)
- Effectiveness analysis
- (2)
- Comparison and analysis of effectiveness
- True positive (TP): Both actual and predicted states belong to this state.
- True negative (TN): Neither actual nor predicted states belong to this state.
- False positive (FP): The predicted state belongs to this state, but the actual state does not.
- False negative (FN): The actual state belongs to this state, but the predicted state does not.
3. Conclusions
Author Contributions
Funding
Institutional Review Board Statement
Informed Consent Statement
Data Availability Statement
Conflicts of Interest
References
- Suan, A.B.; Al-Amer, B.; Assiri, I.A. Multi-Variate, Recurrent Neural Network in a Short-Term Time-Series Substation Demand Forecasting. In Proceedings of the 2022 Saudi Arabia Smart Grid (SASG), Riyadh, Saudi Arabia, 12–14 December 2022; pp. 1–5. [Google Scholar]
- Betti, A.; Crisostomi, E.; Paolinelli, G.; Piazzi, A.; Ruffini, F.; Tucci, M. Condition monitoring and predictive maintenance methodologies for hydropower plants equipment. Renew. Energy 2021, 171, 246–253. [Google Scholar] [CrossRef]
- Guo, Z.; Ma, H.; Liu, W. Cause Analysis of Substation Faults Based on Multimodal Fusion Detection and Knowledge Graph. In Proceedings of the 2023 10th International Forum on Electrical Engineering and Automation (IFEEA), Nanjing, China, 3–5 November 2023; pp. 1252–1256. [Google Scholar]
- Khalid, H.; Shobole, A. Existing developments in adaptive smart grid protection: A review. Electr. Power Syst. Res. 2021, 191, 106901. [Google Scholar] [CrossRef]
- Alvarez Quiñones, L.I.; Lozano-Moncada, C.A.; Bravo Montenegro, D.A. Machine learning for predictive maintenance scheduling of distribution transformers. J. Qual. Maint. Eng. 2023, 29, 188–202. [Google Scholar] [CrossRef]
- Min, Z.; Jian, S.; Li, C.; Bin, Z.; Liang, Z.S.; Zhe, H. Status evaluation of smart substation measurement and control device. In Proceedings of the IOP Conference Series: Materials Science and Engineering, Jakarta, Indonesia, 21–22 November 2019; p. 042077. [Google Scholar]
- Dehghanian, P.; Guan, Y.; Kezunovic, M. Real-time life-cycle assessment of high-voltage circuit breakers for maintenance using online condition monitoring data. IEEE Trans. Ind. Appl. 2018, 55, 1135–1146. [Google Scholar] [CrossRef]
- Fu, D.; Wang, F.; Yuan, S.; Wang, G.; Shao, M. Fuzzy Comprehensive Evaluation Method for On-Line Monitoring Data Quality of Substation Equipment. In Proceedings of the 2019 6th International Conference on Information Science and Control Engineering (ICISCE), Shanghai, China, 20–22 December 2019; pp. 753–757. [Google Scholar]
- Yang, L.; Li, W.; Zhang, S.; Wan, J.; Zhao, H. Application of Big Data and Artificial Intelligence in Substation Operation and Maintenance. In Proceedings of the Journal of Physics: Conference Series, Bengaluru, India, 23–24 November 2023; p. 012002. [Google Scholar]
- Ma, Z.-X.; Zhang, L.-S.; Gu, H.; Xin, Z.-Z.; Kang, Z.; Wang, Z.-L. Panoramic Assessment Method of Substation Equipment Health Status Based on Multisource Monitoring and Deep Convolution Neural Network under Edge Computing Architecture. J. Electr. Comput. Eng. 2023, 2023, 9194712. [Google Scholar] [CrossRef]
- Gao, Q.; Zhong, C.; Wang, Y.; Wang, P.; Yu, Z.; Zhang, J. Defect analysis of the same batch of substation equipment based on big data analysis algorithm. In Proceedings of the IOP Conference Series: Earth and Environmental Science, Surakarta, Indonesia, 24–25 August 2021; p. 022093. [Google Scholar]
- Agrawal, R.; Srikant, R. Fast algorithms for mining association rules. In Proceedings of the 20th International Conference on Very Large Data Bases, VLDB, San Francisco, CA, USA, 12–15 September 1994; pp. 487–499. [Google Scholar]
- Zhao, Z.; Jian, Z.; Gaba, G.S.; Alroobaea, R.; Masud, M.; Rubaiee, S. An improved association rule mining algorithm for large data. J. Intell. Syst. 2021, 30, 750–762. [Google Scholar] [CrossRef]
- Yuan, C.; Xu, J.; Zhou, J.; Liu, L. Correlation Analysis of Electrical Equipment Defects Based on Association Rule Algorithm and Big Data. In Proceedings of the 2023 Panda Forum on Power and Energy (PandaFPE), Chengdu, China, 27–30 April 2023; pp. 1273–1277. [Google Scholar]
- Ali, S.H.K.; Aydilek, I.B. Shopping and Basket Analysis by Using an Improved Apriori Algorithm in WEKA. J. Stud. Sci. Eng. 2021, 1, 75–85. [Google Scholar]
- Miraftabzadeh, S.M.; Colombo, C.G.; Longo, M.; Foiadelli, F. K-means and alternative clustering methods in modern power systems. IEEE Access 2023, 11, 119596–119633. [Google Scholar] [CrossRef]
- Li, X.; Wang, Y.; Li, D. Medical data stream distribution pattern association rule mining algorithm based on density estimation. IEEE Access 2019, 7, 141319–141329. [Google Scholar] [CrossRef]
- Martinez-Arroyo, M.; Sucar, L.E. Learning an optimal naive bayes classifier. In Proceedings of the 18th International Conference on Pattern Recognition (ICPR’06), Hong Kong, China, 20–24 August 2006; pp. 1236–1239. [Google Scholar]
- Yang, T.; Qian, K.; Lo, D.C.-T.; Xie, Y.; Shi, Y.; Tao, L. Improve the prediction accuracy of Naïve Bayes classifier with association rule mining. In Proceedings of the 2016 IEEE 2nd International Conference on Big Data Security on Cloud (BigDataSecurity), IEEE International Conference on High Performance and Smart Computing (HPSC), and IEEE International Conference on Intelligent Data and Security (IDS), New York, NY, USA, 9–10 April 2016; pp. 129–133. [Google Scholar]
- Long, L. Research on status information monitoring of power equipment based on Internet of Things. Energy Rep. 2022, 8, 281–286. [Google Scholar] [CrossRef]
- Shang, P.; Dong, H.; Li, X.; Ren, W. Research on fault diagnosis method of 750kV substation based on Bayesian network and fault recording information fusion. Proc. J. Phys. Conf. Ser. 2020, 1550, 052020. [Google Scholar] [CrossRef]
- Hu, B.; Guo, Q.; Zhu, Y. Key Constraint Variable Identification, Transient Stability Assessment and Feasible Region Generation of Power Grid Operation Based on Machine Learning Method. In Proceedings of the PURPLE MOUNTAIN FORUM 2019-International Forum on Smart Grid Protection and Control: Volume II, 2020; Springer: Singapore, 2020; pp. 603–612. [Google Scholar]
- Ma, J.; Zhang, G.; Zhao, Y.; Jin, L. Design of the state simulation for the primary equipment of smart substation. In Proceedings of the 2020 IEEE 5th Information Technology and Mechatronics Engineering Conference (ITOEC), Chongqing, China, 12–14 June 2020; pp. 647–651. [Google Scholar]
- Razi-Kazemi, A.A.; Niayesh, K. Condition monitoring of high voltage circuit breakers: Past to future. IEEE Trans. Power Deliv. 2020, 36, 740–750. [Google Scholar] [CrossRef]
- Meng, X.-K.; Jia, Y.-B.; Liu, Z.-H.; Yu, Z.-Q.; Han, P.-J.; Lu, Z.-M.; Jin, T. High-Voltage Cable Condition Assessment Method Based on Multi-Source Data Analysis. Energies 2022, 15, 1369. [Google Scholar] [CrossRef]
- Delalleau, O.; Courville, A.; Bengio, Y. Efficient EM training of Gaussian mixtures with missing data. arXiv 2012, arXiv:1209.0521. [Google Scholar]
- Ahmed, I.; Guan, D.; Chung, T.C. Sms classification based on naive bayes classifier and apriori algorithm frequent itemset. Int. J. Mach. Learn. Comput. 2014, 4, 183. [Google Scholar] [CrossRef]
- Soni, A.; Saxena, A.; Bajaj, P. A methodological approach for mining the user requirements using apriori algorithm. J. Cases Inf. Technol. (JCIT) 2020, 22, 1–30. [Google Scholar] [CrossRef]
- Xie, H. Research and case analysis of apriori algorithm based on mining frequent item-sets. Open J. Soc. Sci. 2021, 9, 458. [Google Scholar] [CrossRef]
- Kumbhare, T.A.; Chobe, S.V. An overview of association rule mining algorithms. Int. J. Comput. Sci. Inf. Technol. 2014, 5, 927–930. [Google Scholar]
- Kazerooni, M.; Zhu, H.; Overbye, T.J. Literature review on the applications of data mining in power systems. In Proceedings of the 2014 Power and Energy Conference at Illinois (PECI), Champaign, IL, USA, 28 February–1 March 2014; pp. 1–8. [Google Scholar]
- Morais, J.; Klautau, A.; Cardoso, C.; Pires, Y. An Overview of Data Mining Techniques Applied to Power Systems. 2009. Available online: https://citeseerx.ist.psu.edu/document?repid=rep1&type=pdf&doi=0a255dbf8bebd476ede2bab9995949265c6f7ecf (accessed on 1 July 2024).
- Xie, J.; Shu, H.; Zhang, W.; Song, Q.; Luo, L. Evaluation algorithm of high voltage switchgear based on bayesian fusion. In Proceedings of the 2018 International Conference on Power System Technology (POWERCON), Guangzhou, China, 6–8 November 2018; pp. 3129–3135. [Google Scholar]
- Available online: https://woosuk-my.sharepoint.com/:u:/g/personal/dangjong_stu_woosuk_ac_kr/EUamKUZ9FyZGnrSpWVmZ0rMBzgZmQ19F2VWBZqDG4544fQ?e=ZeWzQH (accessed on 10 July 2024).
- Hossin, M.; Sulaiman, M.N. A review on evaluation metrics for data classification evaluations. Int. J. Data Min. Knowl. Manag. Process. 2015, 5, 1. [Google Scholar]


| References | Data | Methods | Results | Shortcomings |
|---|---|---|---|---|
| [2] | Transformer fault gas | SOM | Obtain fault operating conditions and identify components that may cause fault behavior | Single-signal error may affect the final result |
| [4] | Transformer detection data | Genetic algorithm and association rule | Accurately obtain fault information | No classification when the equipment is not faulty |
| [5] | Online monitoring information | Fuzzy comprehensive evaluation | Obtain the evaluation level of online monitoring data for substation equipment | Only used online monitoring data |
| [6] | Devices’ own status and failure rate | Markov model | Learn the similarity of key points, spectral characteristics to complete cluster analysis | Only classified the fault status, lacking advance prediction |
| [7,8] | Online monitoring data | Multidimensional fuzzy comprehensive evaluation | Grade evaluation of online monitoring data based on quantitative scores | Mainly evaluate data quality without considering specific equipment |
| [9] | Substation daily inspection data | Lyapunov prediction model | Learning from historical data and similar cases to predict defects or failures | The dataset only includes inspection data, not all data |
| [10] | Image data | Multisource monitoring and deep CNN | Improved YOLOv4 network for device detection, combined with monitoring data to evaluate status | Utilizes image data, but may not be able to detect defects within the equipment |
| [11] | Data recording of equipment defects | Cluster analysis and a priori algorithm | Obtain weak links in the same batch of equipment or family defects from equipment manufacturers | Using the device manufacturer dataset without considering the actual environment |
| [16] | Environmental data and online monitoring data | K-means and alternative clustering methods | Well used in load forecasting, fault detection, power quality analysis, and system security assessment | K-means is sensitive to initialization and may be locally optimal |
| [17] | Medical data stream | Association rule mining algorithm | Using probability distribution for continuous data, ensuring the reliability of association rules | No data classification description, only searched association rules |
| [19] | Bank marketing dataset | Association rules and Naive Bayes classifier | Using a priori algorithm to combine relevant attributes to adapt independent assumptions in Naive Bayes classifier | Failed to use in determining the status of electrical equipment |
| Tests | Online Monitoring | Human Inspection | |
|---|---|---|---|
| Transformer | Winding DC resistance | Temperature and winding temperature | Level, oil color, oil temperature indicator |
| Insulation resistance | Partial discharge | Running sound | |
| Absorption ratio | Oil level | ||
| Winding dielectric loss factor | Chromatography of dissolved gases in oil | ||
| Dielectric loss factor of capacitive bushing | Water content in oil | ||
| Winding and bushing withstand voltage | Gas content in oil | ||
| Voltage ratio of all taps of the winding | Grounding current of iron core or clamp | ||
| No-load current and no-load loss | On-load tap changer monitoring | ||
| Measurement of winding deformation | |||
| No-load closing at full voltage | |||
| Circuit breaker | Insulation resistance | Gas pressure | Oil and air leakage |
| Voltage withstand test | Opening and closing time | Insulator breakage | |
| Closing resistance value and closing resistance input time | Spring pressure and stroke | Abnormal operating mechanism | |
| Synchronicity and time of circuit breaker opening and closing | Temperature of isolation switch contacts and line terminals | ||
| Conductive circuit resistance | Gas pressure | ||
| Voltage and current transformers | Insulation resistance | Primary and secondary voltage and current values | |
| Dielectric loss factor; | Insulation | ||
| Cables and bus | Insulation resistance | Partial discharge | |
| DC withstand voltage test | Joint or busbar temperature | ||
| GIS equipment | SF6 gas concentration | ||
| Partial discharge monitoring | |||
| Lightning arrester | Insulation resistance | AC leakage current under operating voltage | Operation status of discharge counter |
| Leakage current at DC 1ma voltage u1ma and 0.75 u1ma | Operation status of discharge counter | ||
| Capacitor bank | Capacitors insulation resistance capacitance | Shell intact | |
| Inductor insulation resistance DC resistance | Secure wiring | ||
| Discharge coil insulation resistance winding DC resistance | Fuse |
| Type | Label | Description | Number Range |
|---|---|---|---|
| Test | Operation time | Breaking time refers to the interval between the initiation of the breaking operation and the complete separation of all pole contacts. Closing time is defined as the interval from the energization of the closing circuit to the complete contact of all pole contacts. Synchronicity of operations encompasses the timing of opening and closing actions, three-phase breakage, and the instantaneous time differences between contacts. | Opening: [27.4, 104.7] Closing: [53.2, 126.8] Synchronism: [0.4%, 7.2%] |
| Loop resistance | Contact resistance in a circuit breaker is measured between its movable and static contacts, representing the resistance of the conductive circuit. | [87.3, 245.8] | |
| SF6 moisture content | If SF6 moisture content meet the required standards. | [63, 160] | |
| Online monitoring | SF6 gas pressure | SF6 gas pressure, indicator of arc extinguishing capability. | [0.58, 0.7] |
| Ambient temperature | Testing device temperature sensor to measure ambient temperature. | [−3, 42] | |
| Ambient humidity | Testing device humidity sensor to measure ambient humidity. | [22, 93] | |
| Inspection | SF6 gas pressure | Circuit breaker gas pressure, measured by the supplied gauge. | [0.58, 0.7] |
| External contact temperature | Infrared thermometer measurements: quantifies temperature at contact surfaces, indicating potential oxidation or poor contact. | [12, 128] | |
| Ambient temperature | Thermometer measurements. | [−12, 40] | |
| Ambient temperature | Hygrometer measurements. | [26, 96] |
| Label | Parameters | Classification | |
|---|---|---|---|
| L1 | Opening and closing time (Test) | Closing < 70, opening < 35, synchronism < 2% | Normal (1A) |
| 70 < closing < 90, 35 < opening < 45, synchronism < 4% | Attention (1B) | ||
| Closing ≥ 70, opening ≥ 35, synchronism ≥ 4% | Abnormal (1C) | ||
| L2 | Circuit resistance (Test) | <130 | Normal (2A) |
| [130, 160] | Attention (2B) | ||
| >160 | Abnormal (2C) | ||
| L3 | SF6 moisture content (Test) | <90 | Normal (3A) |
| [90, 150] | Attention (3B) | ||
| >150 | Abnormal (3C) | ||
| L4 | Gas pressure (Online monitoring) | >0.68 | Normal (4A) |
| [0.65, 0.68] | Attention (4B) | ||
| <0.65 | Abnormal (4C) | ||
| L5 | Gas pressure (Inspection) | >0.68 | Normal (5A) |
| [0.65, 0.68] | Attention (5B) | ||
| <0.65 | Abnormal (5C) | ||
| L6 | External contact temperature (Inspection) | <20 | Normal (6A) |
| [20, 50] | Attention (6B) | ||
| >50 | Abnormal (6C) | ||
| L7 | Ambient temperature (Inspection) | [10, 30] | Moderate temperature (7A) |
| >30 | High temperature (7B) | ||
| <10 | Low temperature (7C) | ||
| L8 | Ambient humidity (Inspection) | [30, 80] | Moderate (8A) |
| >80 | Moist (8B) | ||
| <30 | Dry (8C) | ||
| Rule | (%) | Reasons | Result |
|---|---|---|---|
| 1 | 91.556 | L1 = 1A and L7 = 7A and L8 = 8A | A |
| 2 | 89.784 | L1 = 1B and L7 = 7A and L8 = 8A | B |
| 3 | 81.846 | L1 = 1B and L7 = 7C and L8 = 8B | C |
| 4 | 100 | L1 = 1C | C |
| 5 | 92.485 | L2 = 2A and L7 = 7A and L8 = 8A | A |
| 6 | 82.31 | L2 = 2B and L7 = 7B and L8 = 8A | A |
| 7 | 85.661 | L2 = 2B and L8 = 8A | B |
| 8 | 100 | L2 = 2C | C |
| 9 | 92.766 | L3 = 3A and L7 = 7A and L8 = 8A | A |
| 10 | 81.523 | L3 = 3A and L8 = 8B | B |
| 11 | 100 | L3 = 3C | C |
| 12 | 100 | L4 = 4C and L5 = 5C | C |
| 13 | 100 | L4 = 4A and L5 = 5A | A |
| 14 | 100 | L4 = 4B and L5 = 5B | B |
| 15 | 95.647 | L6 = 6A and L7 = 7A | A |
| 16 | 90.112 | L6 = 6B and L7 = 7C and L8 = 8A | B |
| Label | Description | Parameter | Classification | |
|---|---|---|---|---|
| L1 | Absorptance (Test) | Insulation resistance ratio: measured using a 2500 V megger, comparing winding resistance at 60 s and 15 s of pressurization. | >1.8 | Normal (1A) |
| [1.3, 1.8] | Attention (1B) | |||
| <1.3 | Abnormal (1C) | |||
| L2 | DC resistance (Test) | Phase winding DC resistance: calculated as the deviation of each phase from the three-phase average value. | <1% | Normal (2A) |
| [1%, 2%] | Attention (2B) | |||
| >2% | Abnormal (2C) | |||
| L3 | Ratio test (Test) | Tap changer voltage ratio: expressed as the deviation from the rated tapping voltage ratio for each tap position. | <0.5% | Normal (3A) |
| [0.5%, 1%] | Attention (3B) | |||
| >1% | Abnormal (3C) | |||
| L4 | Gas content of oil (Online monitoring) | Volume fraction of gases in transformer oil, resulting from thermal and moisture effects. | <2% | Normal (4A) |
| [2%, 5%] | Attention (4B) | |||
| >5% | Abnormal (4C) | |||
| L5 | Oil temperature (Inspection) | Measured at the upper oil level during transformer operation. | <85 | Normal (5A) |
| [85, 100] | Attention (5B) | |||
| >100 | Abnormal (5C) | |||
| L6 | Ground current (Online monitoring) | Measured on the iron core lead wire at the single grounding point of the transformer core. | <55 | Normal (6A) |
| [55, 80] | Attention (6B) | |||
| >80 | Abnormal (6C) | |||
| L7 | External contact temperature (Inspection) | Infrared thermometer measurements: quantifies temperature at contact surfaces, indicating potential oxidation or poor contact. | <20 | Moderate temperature (7A) |
| [20, 50] | High temperature (7B) | |||
| >50 | Low temperature (7C) | |||
| L8 | Oil indicator (Inspection) | Readings from the transformer’s oil level gauge and oil thermometer. | Oil temperature < 85, oil level [35%, 75%] | Normal (8A) |
| Oil temperature [85, 100], oil level < 35%, or >75% | Attention (8B) | |||
| Oil temperature > 100, oil level < 25%, or >90% | Abnormal (8C) | |||
| L9 | Ambient temperature (Inspection) | Thermometer measurements. | [10, 30] | Moderate temperature (9A) |
| >30 | High temperature (9B) | |||
| <10 | Low temperature (9C) | |||
| L10 | Ambient humidity (Inspection) | Hygrometer measurements. | [30, 80] | Moderate (10A) |
| >80 | Moist (10B) | |||
| <30 | Dry (10C) | |||
| Rule | (%) | Reasons | Result |
|---|---|---|---|
| 1 | 95.442 | L1 = 1A and L9 = 9A and L10 = 10A | A |
| 2 | 80.124 | L1 = 1B and L9 = 9B | C |
| 3 | 100 | L1 = 1C | C |
| 4 | 100 | L2 = 2C | C |
| 5 | 94.358 | L4 = 4A and L9 = 9A and L9 = 9A | A |
| 6 | 89.951 | L4 = 4B and L9 = 9B | A |
| 7 | 82.022 | L4 = 4C and L5 = 5C | C |
| 8 | 93.573 | L7 = 7A and L9 = 9A and L10 = 10A | A |
| 9 | 86.559 | L7 = 7C and L9 = 9B | A |
| 10 | 82.537 | L7 = 7C and L9 = 9C | A |
| Classifiers | State | Accuracy | Precision | Recall | F1-Score |
|---|---|---|---|---|---|
| This method | Normal | 93.06% | 89.04% | 90.28% | 89.66% |
| Attention | 91.20% | 86.30% | 87.50% | 86.90% | |
| Abnormal | 97.22% | 97.14% | 94.44% | 95.77% | |
| SVM | Normal | 92.59% | 86.84% | 91.67% | 89.19% |
| Attention | 90.74% | 87.14% | 84.72% | 85.91% | |
| Abnormal | 98.13% | 97.14% | 94.44% | 95.77% | |
| KNN | Normal | 92.59% | 91.18% | 86.11% | 88.57% |
| Attention | 90.74% | 83.12% | 88.89% | 85.91% | |
| Abnormal | 96.76% | 95.77% | 94.44% | 95.10% |
Disclaimer/Publisher’s Note: The statements, opinions and data contained in all publications are solely those of the individual author(s) and contributor(s) and not of MDPI and/or the editor(s). MDPI and/or the editor(s) disclaim responsibility for any injury to people or property resulting from any ideas, methods, instructions or products referred to in the content. |
© 2024 by the authors. Licensee MDPI, Basel, Switzerland. This article is an open access article distributed under the terms and conditions of the Creative Commons Attribution (CC BY) license (https://creativecommons.org/licenses/by/4.0/).
Share and Cite
Dang, D.; Liu, Y.; Lee, S.-K. State Evaluation of Electrical Equipment in Substations Based on Data Mining. Appl. Sci. 2024, 14, 7348. https://doi.org/10.3390/app14167348
Dang D, Liu Y, Lee S-K. State Evaluation of Electrical Equipment in Substations Based on Data Mining. Applied Sciences. 2024; 14(16):7348. https://doi.org/10.3390/app14167348
Chicago/Turabian StyleDang, Ding, Yi Liu, and Seon-Keun Lee. 2024. "State Evaluation of Electrical Equipment in Substations Based on Data Mining" Applied Sciences 14, no. 16: 7348. https://doi.org/10.3390/app14167348