Abstract
Once public transport is fully automated, human operators will no longer be needed for tasks like manoeuvring, paying, and boarding. Interfaces must evolve to cover the entire interaction chain from booking to boarding. We present a user-centred design of a mobile-based booking application and an LED-based boarding interface for automated shuttles. Our approach included comprehensive requirements and feasibility analyses to ensure technical viability and user satisfaction. Laboratory study results highlight the advantages and challenges of the boarding interface, underscoring the importance of early user requirements and feasibility assessments in designing automated shuttle systems.
1. Introduction
Over the last years, the automation of mobility, including public transport, has made rapid progress [1]. Today, automated transport systems have different levels of automation, including high (SAE level 4) or even full (SAE level 5) automation [2]. While metros and buses [3,4,5,6] have largely adopted these technologies, small automated shuttles with low capacity are actually also part of this change. The problem with these so-called low-capacity shuttles [7,8] is that they have very low seating capacity.
One of the main characteristics of such an automated driving system is the absence of a human driver. Traditionally, public transportation involves interaction with a human driver or attendant, who can assist passengers with issues. The lack of this human element in fully automated shuttles could lead to potential problems for passengers who may need assistance [9,10]. In non-automated trains, buses, or shuttles, there are usually train conductors or bus drivers who can handle all kinds of problems. However, in automated shuttles, such problem solvers are missing.
A specific challenge for low-capacity shuttles is ticket purchase and seat reservations. Existing booking applications serve as a good foundation but must be adapted to the context of automated shuttles. With low-capacity shuttles, which typically offer six to twelve seats and do not provide standing space for safety reasons, effective capacity management becomes crucial [11]. Capacity management ensures that the limited number of seats are organised efficiently and flexibly, similar to existing non-automated public transport systems [11].
This brings us to the importance of capacity management. In automated low-capacity shuttles, adequate capacity management is essential to avoid overbooking, reduce waiting times, and maximise shuttle utilization. When the number of seats is limited, and more passengers are waiting, effective capacity management ensures optimal seat allocation and passenger satisfaction.
There are existing solutions for some of these challenges, as seen in other transport services. Uber (https://www.uber.com (accessed on 18 April 2023)) and Lyft (https://www.digitaltrends.com/cars/lyft-amp/ (accessed on 22 August 2023)) display car models of booked vehicles in their apps, with Lyft using coloured ambient lights for easy vehicle identification. Certain railways provide a “relax or comfort check-in” option (https://www.bahn.com/en/booking-information/komfortcheckin (accessed on 22 August 2023)), (https://westbahn.at/en/checkin/ (accessed on 22 August 2023)) for seat selection and ticket validation. Passengers can board and scan the chosen seat via an app for ticket validation, but this relies on the availability of seats in the vehicle. These innovations address critical questions in the boarding procedure, such as how the passenger finds the right shuttle, how the ticket is validated, and how a passenger finds the right seat. Implementing similar strategies in automated low-capacity shuttles could significantly enhance capacity management and overall user experience.
In our work, we address the problems of booking, boarding and capacity management in automated low capacity shuttles with no driver or conductor onboard. We designed and prototyped a solution that includes a booking and boarding system for such shuttles. We evaluated the system in a lab study (N = 27) using experience prototyping methods [12,13] with respect to usability and user experience (UX) factors. Based on the results we derived requirements for capacity management in driverless low-capacity shuttles. Specifically, we focused on the following research questions:
- RQ1: what additional information or interactions are needed when using an automated low-capacity shuttle (six to twelve seats), as opposed to using manually operated, high-capacity means of transport during boarding?
- RQ2: what is the usability and user experience of a capacity management solution consisting of a visual in-shuttle support interface and mobile booking application with additional seat management capabilities?
- RQ3: what recommendations can be derived for the design of a booking and boarding systems for fully automated, driverless low-capacity shuttles?
Our contribution to HCI is twofold: We present the design and prototypical implementation of a colour-based, ambient light booking and boarding interface. Additionally, we provide user requirements for booking and boarding driverless low-capacity shuttles with a focus on capacity management.
2. Related Work
2.1. Driverless Public Transport
The lack of a human element [14] is an influencing factor, often underestimated in fully automated public transport. When passengers can no longer expect to interact with a human for service purposes, such as resolving difficulties or unexpected occurrences, many problems may arise [15,16]. Salonen and Haavisto [15] researched passenger perceptions and emotions using a driverless bus. Nordhoff et al. [16] showed the relation between perceived safety and the acceptance of such shuttles. In general, acceptance towards these shuttles is high, but their capacity and efficiency are poor compared to normal transportation. Automated shuttles are considered suitable for last-mile solutions in both urban and rural contexts [9]. According to Kou et al. [8] rural areas are characterised by high distribution costs of last-mile delivery due to factors such as low information levels, poor distribution of service, long distribution times, etc. These hinder the further development of rural logistics, rendering the deployment of last-mile solutions in rural areas particularly challenging. The motivation behind this research is to address these issues and enhance the user experience and operational efficiency of driverless shuttles.
2.2. Capacity Management
Due to low seat numbers in most driverless shuttles, capacity management is an important factor [17,18,19]. Fröhlich et al. [9,10] predicted that mobile applications will be important for modern public transport. Ensuring sufficient capacity management for seating spots and ticket verification in low-capacity shuttles poses a non-trivial challenge. Reservations are mandatory, and spontaneous boarding is no longer possible. Mirnig et al. [11,20,21,22] conducted studies to determine suitable solutions for capacity management and security management. They tested technical tools to give passengers a sense of security within the shuttle and provided suggestions on how to implement effective capacity management. The research presented in this paper aims to build on the above findings and develop a robust capacity management system that ensures optimal seat allocation and passenger satisfaction.
2.3. Information Design
Previous research has shown that current tools for in- and outdoor communication design in automated shuttles are insufficient and need adaptation. Riener et al. [23] highlighted this gap, emphasising the need for better information design. There are quite a few research projects focusing on the outdoor communication [24,25] of automated transport and also the role of lights [26,27,28], but there is limited research on using colours as a communication tool in this context [29]. Effective information design in automated shuttles presents several challenges, such as ensuring clear communication through visual cues and integrating these cues seamlessly into the user interface. Lights are frequently used for communication in automated driving, with studies exploring how external light displays can inform people about situations in automated vehicles [22,30,31,32,33]. This research will analyse these challenges and propose solutions to improve the usability and user experience of automated shuttle systems through improved information design.
3. Implementation of the Booking and Boarding System
To address our research questions, we implemented a system comprising a mobile-based booking application and an LED-based boarding interface designed for use with automated shuttles. The booking interface enables the passengers to book their seat in advance and matches the seat assignment on the ticket to the information in the shuttle via colour-coding. The boarding interface includes a QR-based access system and an ambient light-based guiding interface implemented via LED stripes. The development process followed a user-centred design approach, incorporating comprehensive requirement analysis and feasibility studies to ensure that the system meets user needs and operates within technical constraints.
3.1. Booking App
The mobile booking application was designed to be intuitive and user-friendly, allowing passengers to book rides, manage payments, and receive notifications about shuttle availability and boarding instructions.The interface was implemented as a mobile-based click-dummy, with the logic shown in Figure 1 in mind. For the visualisation and interaction design, we followed an approach suggested by Wallner et al. [19] and Mirnig et al. [11,20]. Figure 2 provides screen shots of the interactive prototype. The click-dumm, had no backend integration but provided an interaction experience similar to a fully integrated booking system. It was implemented in Adobe XD (https://www.adobe.com/at/products/xd.html (accessed on 16 September 2022)).
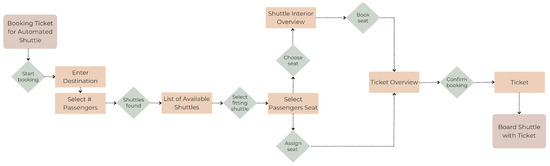
Figure 1.
This UML diagram describes the use case and the activities required to book a ticket in a designed booking application.
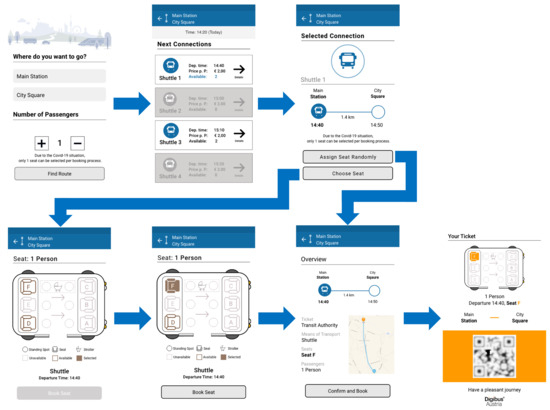
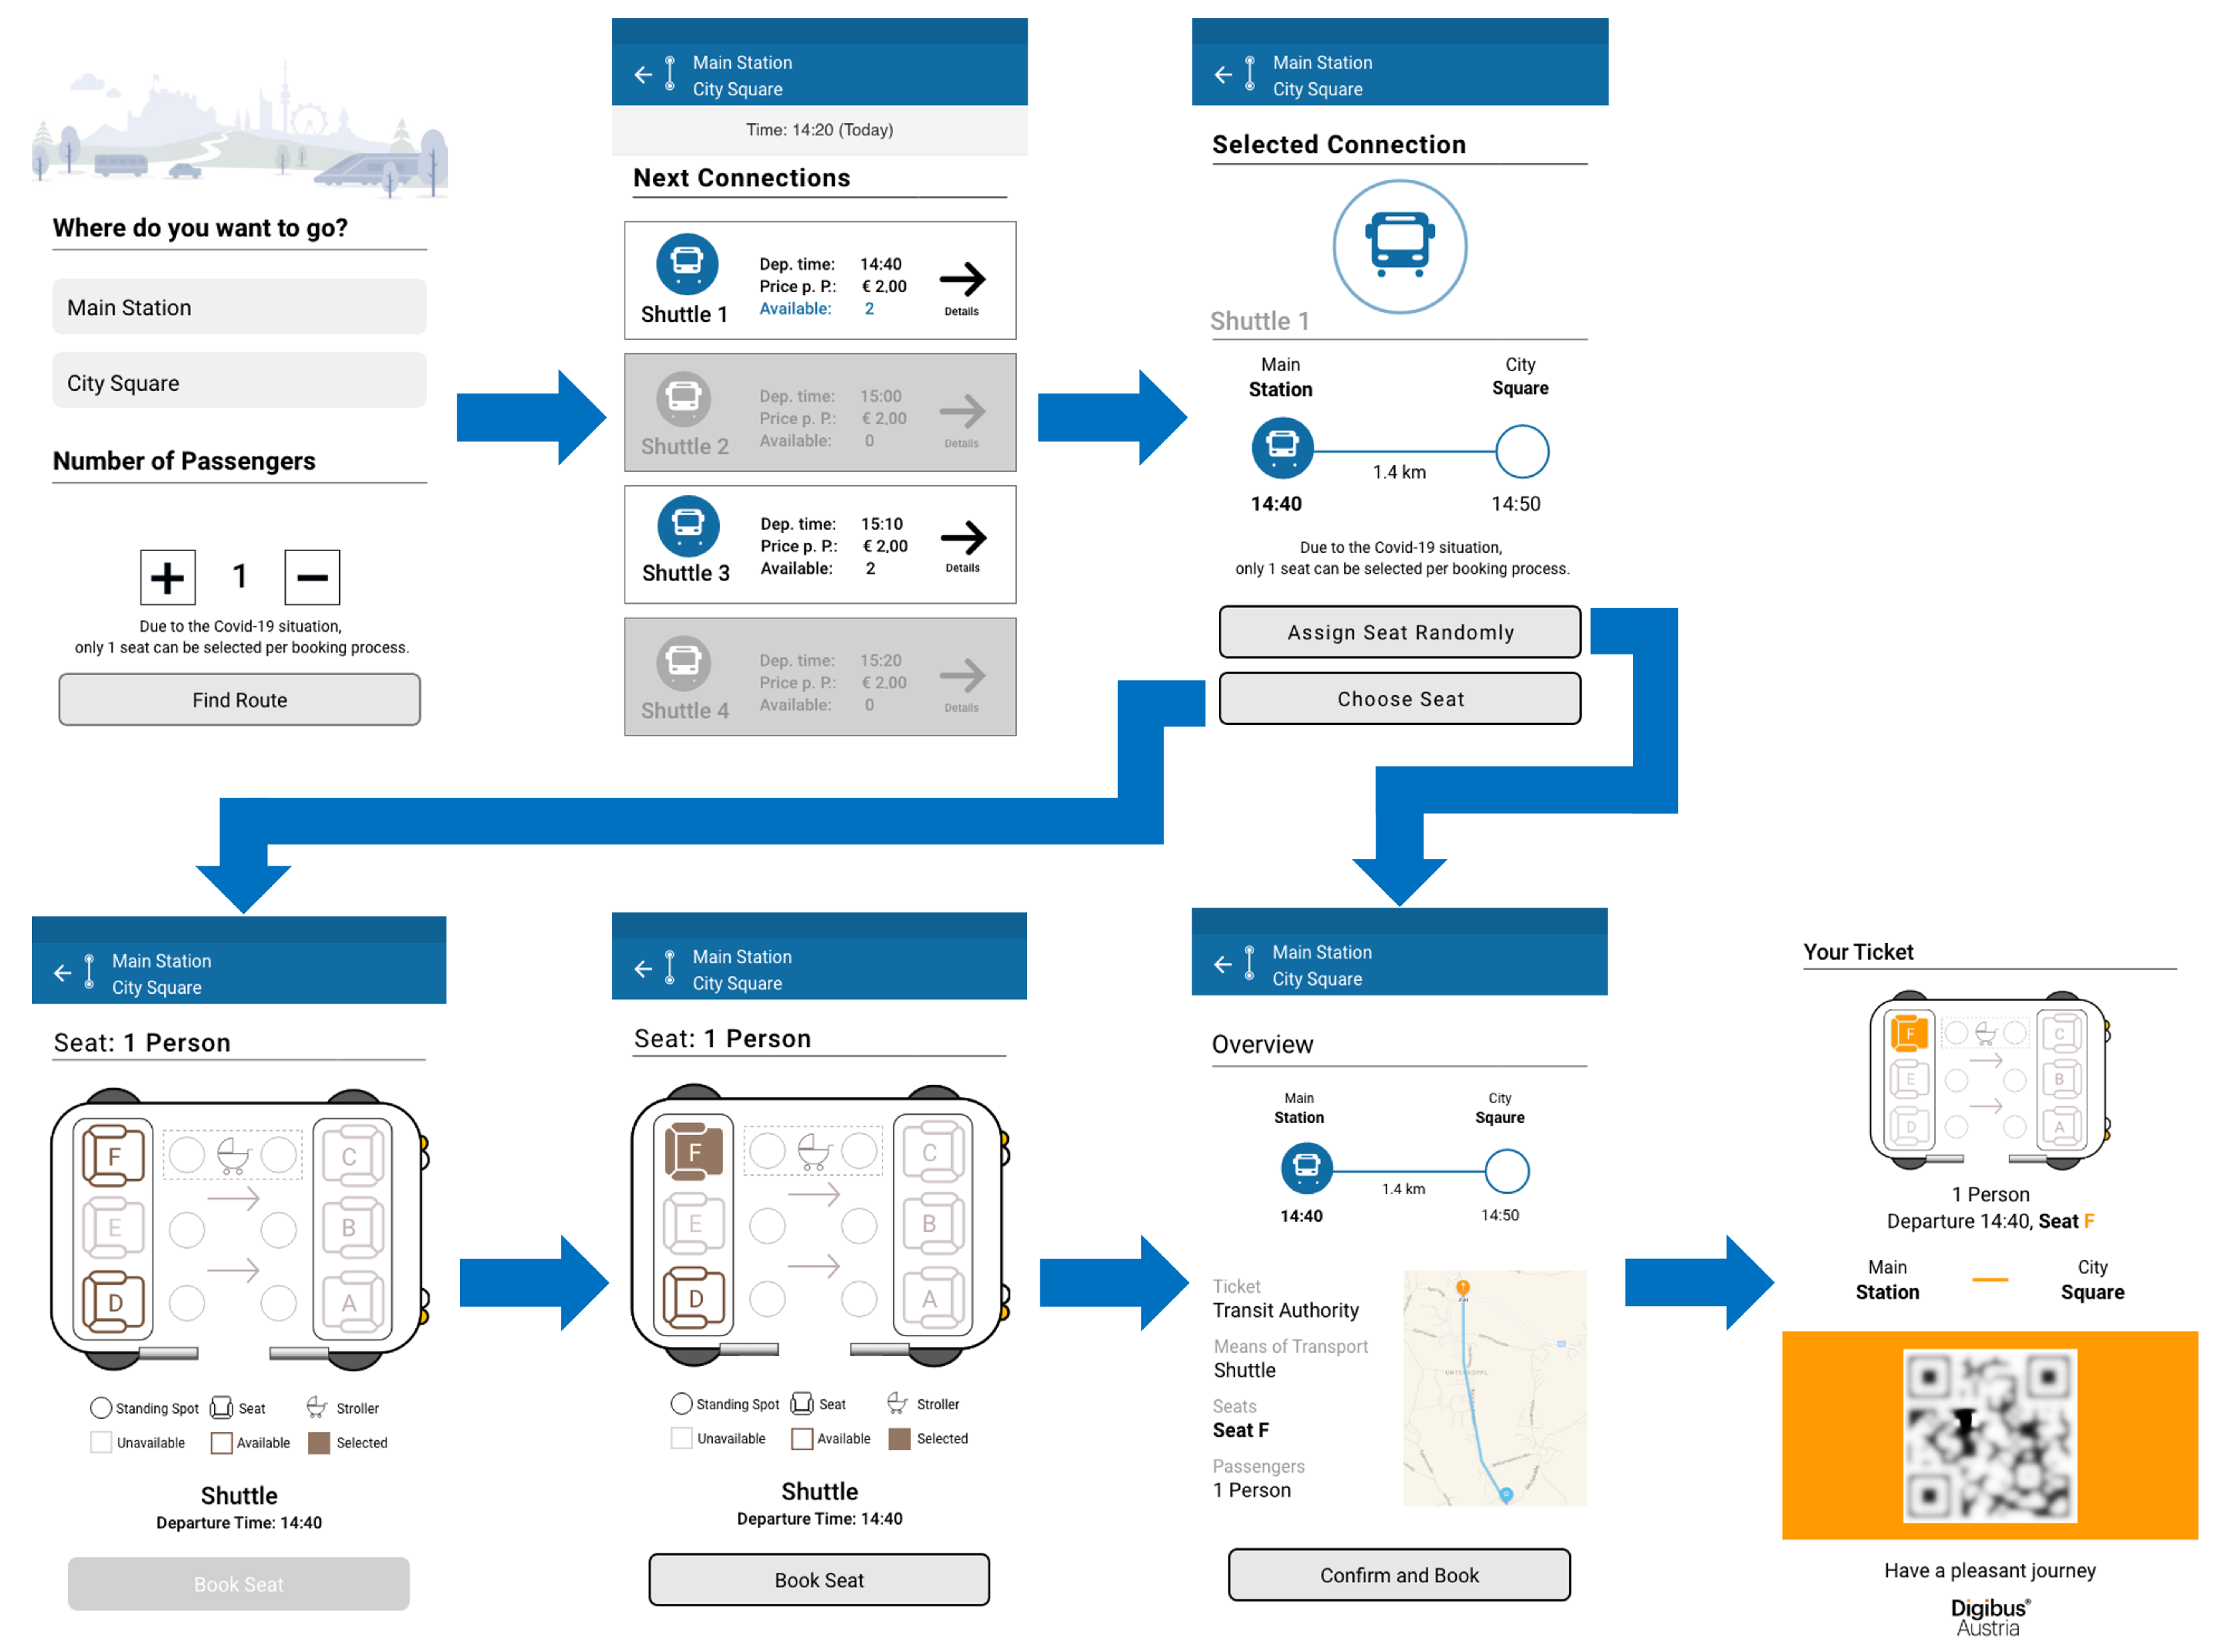
Figure 2.
Screenshots from the booking app. From top left to bottom right: First, it starts with choosing the direction and number of passengers, followed by the selection of next buses. Afterwards, an overview of the chosen bus can be seen and buttons for the selection of a seat versus random seating are available. If ”Choose Seat” is selected, available seats and are displayed. Before confirming the ticket, an overview of the booking is presented. Finally, a QR code is generated and the chosen seat is highlighted in a specific colour. This colour-coding is then also used for the boarding process.
The screen design was based on an existing booking application called Wegfinder (https://wegfinder.at/ (accessed on 16 September 2022)). Designs and assets were provided by the app developers and used with permission. Since the Wegfinder app did not include support for booking specific seats, this functionality was added (see Figure 2), including the possibility to randomly assign a seat. After confirmation of the booking, a ticket with a QR code and relevant information for the boarding process (i.e., number of passengers, departure time, seat label, and route) was displayed. Here, we want to mention that the colour-coding of the final ticket was later on used for the boarding procedure. Each of the different seats had their own colour representation. The QR code on the ticket was used to board the bus and to activate the boarding interface (i.e., ambient light) inside the bus.
A critical aspect of the application design was capacity management, which ensures that the limited number of seats in low-capacity shuttles are used to best effect. Effective capacity management is essential to prevent overbooking, minimise waiting times and maximise shuttle utilisation.
The booking system was specifically designed for small automated shuttles, but, if the shuttle was full, an alternative of the next small automated shuttle was suggested. However, the architecture and user flow planning allows for future integration into centralised public transport systems. As more passengers use the service and the shuttles reach capacity, alternative shuttles can be deployed, centralising the system for traffic and overall transport management. The app can act as a central instance through which users can book multiple shuttles.
3.2. Boarding Interface
The boarding interface used ambient coloured light behind each seat to represent the booked seat. For the experience design, a prototype was implemented using an Arduino-Uno board and a two-metre RGB-LED strips (144 Leds per metre). Since the study took place during the COVID-19 pandemic, we designed the experience to address certain limitations of that time. For instance, instead of the six seats in the shuttle, only the four seats in the corners were available for selection. The middle seats had to stay empty, but this gave us the opportunity to create the feeling that there were already occupied seats in the shuttle. All four seats were assigned another colour (turquoise, orange, purple, and green), and the two-metre LED-strip used was cut in four parts with approximately 60 LEDs per seat. The smaller parts of the LEDs were mounted below the seat and soldered together.
We also implemented two visualisations for the ambient seat light: static and blinking. Colour selection followed traditional recommendations for visibility (e.g., easy to distinguish from each other; good visibility on a smartphone screen and LED stripe). Additionally, we avoided colours that fell within the warning spectrum (e.g., red) (https://www.creativesafetysupply.com/articles/safety-colors (accessed on 16 September 2022)). Figure 3 visualises tickets with all colour variations and corresponding ambient seat lighting.
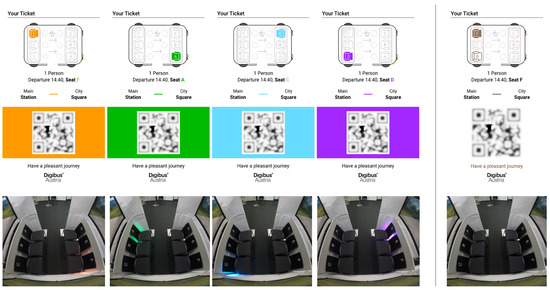
Figure 3.
Top: tickets with different colours including a visualisation of the seat within the bus and seat label (i.e., a letter from A to F and the QR code that is needed to board the bus). Bottom: visualisation of ambient seat lighting in respective colours. Right: For the control condition, the seat was filled in with the app colour (i.e., brown) and no light was visualised in the shuttle.
For each seat, there were three scenarios in the Arduino code implemented (static light, blinking light, and no light). To make the Wizard of OZ setup [34] possible, these scenarios were triggered with a remote control for activating the different seats and colour schemes.
4. Study Setup
The study was conducted in a controlled laboratory setting and followed a within-subject design approach. The room was equipped with replica of the automated shuttle and video recording equipment. In order to enhance the experience design, a bus stop sign was installed at which participants had to wait for the bus. Participants had to book tickets and board the shuttle in three different conditions: static LED, animated LED, and no LED (i.e., the control condition). Each condition had to be experienced twice. Ordering was randomised. So, overall, each participant booked and boarded for six “trips” (i.e., runs).
4.1. Questionnaires
Before, during, and after the interaction with the app and the boarding system, several questionnaires were used. The pre-questionnaire consisted of items regarding demographic data, visual impairments, smartphone experience, preferences regarding booking different means of transport, as well as experiences in using public automated transportation. Between different booking and boarding conditions, the short user experience questionnaire (UEQ) [35] was used. In total, each person received six short UEQs (one per run). As a post-questionnaire, we utilised the long version of the UEQ [36], which measures usability aspects as well as user experience aspects. Participants filled it in for each of the three conditions. Animated gifs of the respective (per condition) in-shuttle view were also shown as a reminder while answering the questionnaires.
4.2. Interviews
Finally, a semi-structured interview was conducted to gain qualitative data and opinions from the participants. Each of the following questions were asked regarding the (a) booking and the (b) boarding interface.
- In general, how was your feeling about (a) booking a ticket, (b) boarding the bus?
- What did you like, where did you encounter problems? Do you feel, that there was anything left out which you would have found useful in (a) the booking interface, and in (b) the boarding interface. What did you find helpful/useful/pointless/meaningful?
- Would you want to use an automated bus (where there is no human driver) with that kind of booking and boarding system? If no, how would it have to be or what has to be improved for you to use it?
- Would you feel able to book and use an automated shuttle (without assistance) with (a) and/or (b)?
- Did you find the interface (a), and (b) easy to use or was it tedious?
- Do you have any suggestions for improvement (colours, animations, and other suggestions)?
4.3. Procedure
Participants were recruited via different channels (e.g., social media and mailing lists). It took place in our research lab with one researcher and one participant being present at the same time. COVID-19 preventive measures were applied (i.e., national 3G-regulations and FFP-2 masks). Procedures with respect to ethics and data protection outlined in the University of Salzburgs’ ethics committee guidelines for studies with participants were followed.
Upon arrival, participants were informed about the topics of the study and the tasks they would be required to perform. After signing an informed consent form, they filled in the pre-questionnaire. The overall task for each run was to book a seat in a driverless shuttle (see in Figure 2) and board it with the ticket they received (see Figure 3). Participants were asked to find their booked seat.
In order to simulate the public transport feeling as realistically as possible, participants received an interaction scenario to orientate themselves on how they would behave in normal public transport. They had to (1) book a ticket for themselves using the booking app while standing at the bus station sign, (2) wait for the arrival of the shuttle announced by an audio signal, (3) board the bus by scanning the ticket at the QR scanner, and (4) find the booked seat and sit down. Thereafter, they filled in the short-UEQ while sitting in the shuttle.
After exiting the shuttle, the next run would start. This was repeated six times, twice for each of the three conditions. Conditions were randomised to minimise ordering effects. The researcher led the experiment and served as a wizard [34] to activate the booked seat in the according condition via a remote control. Selected seats were known, since the smartphone screen was mirrored to a researcher’s smartphone.
Once participants completed all six rounds, they were asked to complete three post-experience questionnaires about the different light conditions, and a final interview was conducted. Booking and boarding procedures were video recorded as well as the final interview. The entire study took 30 to 40 min.
4.4. Participants
A total of 27 subjects (12 men and 15 women) participated in the laboratory study. We initially aimed for 25 participants, with two additional recruits as backups in case of no-shows. However, all recruited participants were able to take part. The goal of having 25 participants was to ensure a diverse range of age groups and a balanced gender distribution. Additionally, the UEQ yields stable results with 20 to 30 participants [37]. Participants’ ages ranged from 23 to 52 years (M = 30.4 years, SD = 6.1 years). Twelve participants were myopic, and one had a mild red-green colour vision deficiency.
All subjects except one were experienced or very experienced in using a smartphone; one participant stated to be moderately experienced. Participants reported that they used public transport daily (3p), once a week (2p), several times a month (9p), once in a month (7p), more seldom (4p), or never (1p). One participant did not answer this question. Regarding regularly using forms pubic transport, the answers were as follows: buses (22p), trains (20p), subways (9p), trams (6p), and others (2p). With respect to buying tickets on their smartphones, we obtained the following answers: always (4p), very often (6p), often (1p), sometimes (3p), rarely (4p), and never (9p). With respect to experiences with automated transport systems 70% (19p) of the participants had never used one and 30% (8p) already had used subways, trains, or even an automated shuttle.
5. Results
5.1. Qualitative Results
All interviews were transcribed, transferred to Microsoft Excel Version 16 (2019), and grouped per question [38]. Subsequently, the answers were separated into individual statements regarding booking and boarding. After that, similar statements were grouped together by coding statements [39]. This task was completed by one researcher; unclear statements to code were discussed with other team-members. Responses were analysed to gather additional information regarding needs during the booking and boarding of an automated shuttle, as well as the usability and user experience of the two interfaces used. The following points can be summarised from the interview responses.
General usage issues: The booking interface was described as being easy to use (20 out of 27 participants) and well designed (11 out of 27 participants). The presentation of information in the app was very clear (five out of twenty-seven), tidy (four out of twenty-seven), straightforward (three out of twenty-seven), and fast (three out of twenty-seven). Some participants (four out of twenty-seven) mentioned that they needed one round to familiarise themselves with the app. The QR code on the ticket was characterised as being helpful (two out of twenty-seven). The fact that a seat was colour-coded was perceived by three participants as better than using no colour. The distinction between assigning a seat and selecting a seat function was stated as good (two out of twenty-seven) but caused some confusion for some participants (two out of twenty-seven) because it was not clear to them what the difference was. The boarding interface was also described as good (ten out of twenty-seven) and easy to use (six out of twenty-seven). Twenty out of twenty-seven participants found the light (whether static or flashing) to be supportive. Three out of twenty-seven participants mentioned that, without light, it was more irritating to find a seat than with lights. Twelve participants favoured the animated light, but eight participants were annoyed by them. Nine participants found the static light better, as it had a more calming effect (three out of twenty-seven). The colour-coding (in the app and during boarding) was thought to be useful for this bus (three out of twenty-seven) but could be confusing if several people boarded at the same time (two out of twenty-seven). Other participants indicated that the lights helped minimally but the app (illustration of the seat) or reading the letters (in the bus) was the factor that was most helpful (five out of twenty-seven). It was also mentioned that it could be supportive for elderly passengers or supportive for people with other visual impairments.
Ability to book and board a shuttle: All participants indicated that they felt able to use and automated shuttle with the presented booking and boarding system. Mentioned problems that could occur were being tied to a ticket or fearing that it would expire and that it is difficult to use for people without smartphones, internet, or mobile data.
Usability: A total of 23 people found the booking system user-friendly and 25 participants found the boarding interface user-friendly. Most of the participants stated that the system was very simple. Regarding the booking interface, participants stated that it was comparable to other booking systems. They mentioned that it is fast and that the information in the system is clearly presented. Two participants noted that it was a bit likeearning by doing. One person said that it was easy to use because it lacked the difficult part of such applications, which is the payment. One subject stated that the seat selection part felt unfamiliar because it was not similar to other booking applications. Comments on the boarding interface were that the lighting was helpful (four out of twenty-seven). “The QR scanner is an important component, it should be upgraded and more attention should be paid to it, because it is easy to miss.” One participant mentioned that the animated light was a bit confusing. Another participant asked: “What could happen in the worst case if you are sitting in the wrong seat?”.
Likes and problems: For the booking interface, fourteen out of twenty-seven participants stated that the application was easy to use, intuitive (seven out of twenty-seven), familiar (four out of twenty-seven), and fast (three out of twenty-seven). Participants (two out of twenty-seven) liked that it had a clear presentation; subjects said that it was nicely designed (two out of twenty-seven), the graphics were very helpful (four out of twenty-seven), and the colour choice (four out of twenty-seven) was good. The freedom of choice between choosing a seat by themselves vs. the assignment of a seat was good (five out of twenty-seven); however, the difference was not clear to some (two out of twenty-seven). There were statements (eight out of twenty-seven) that some of the information presented in the applications were a bit confusing (e.g., legend), but three subjects felt that all important information was included. The driving direction was always clear for at least two participants. Four out of twenty-seven participants mentioned that the fundamental step in a booking application was missing, namely, the payment process. For the boarding interface, participants, again, underpinned that they liked the system. Ten out of twenty-seven found that the lights are generally helpful, whether animated or static. Six out of twenty-seven participants thought that the light conditions were still useful when several people boarded at the same time. A small number (five out of twenty-seven) thought that the animated was confusing but the static light helped (four out of twenty-seven). The QR scanning was very easy (five out of twenty-seven), everything worked well (three out of twenty-seven), and others mentioned that it would also work without the lights (three out of twenty-seven). Some participants (three out of twenty-seven) wished to have a floor marking for their seats, or lit-up letters (two out of twenty-seven). Two people liked that the colours of the seats in the app were duplicated on the colours of the seats in the bus. One participant did not like the colour orange, since it was perceived as alarming.
Improvements: Approximately 40% of participants (eleven out of twenty-seven) indicated that they did not want to make any further improvements to the booking interface and nearly 30% of participants (eight out of twenty-seven) felt that the boarding interface did not need to be improved. Regarding the booking interface, five out of twenty-seven participants thought that the colour theme in the application should be changed. Two participants stated that it would be useful to colour the seats in the selection part in the same colour as they were at the end on the ticket. Other participants (three out of twenty-seven) mentioned that there was an overload of information and steps in the application and that this should be reduced. Voice control would be useful (three out of twenty-seven), and people with disabilities were mentioned in this context. It was also stated that it would be helpful to mark the way where to find the seat in the bus. Other comments were made about missing information (arrival time and payment process) or features such as a zoom function. Regarding the boarding interface five participants mentioned that the animated-light pattern should be altered, as it is perceived as exhausting (four out of twenty-seven). In general, nearly half of the participants (11 out of 27) stated that it would be a good idea to change the position of the lights or add additional lights in the bus. Other ideas were to light up seat indications (five out of twenty-seven) and add floor lighting (three out of twenty-seven). Static lights were perceived to be good (four out of twenty-seven), colours, in general, were mentioned as being nice (three out of twenty-seven), but some preferred different colours (four out of twenty-seven).
5.2. Quantitative Results
All data from questionnaires were analysed using IBM SPSS Statistics Version 25, 2017 and Microsoft Excel Version 16, 2019. A mean total score and mean values per participant for each UEQ factor were calculated: attractiveness, transparency, efficiency, controllability, stimulation, originality for the UEQ, and pragmatic and hedonic quality for the short-UEQ.
Short-UEQ: Six conditions, and, thus, short-UEQs were analysed for each participant. These six conditions consisted of two sub-conditions for each factor, i.e., control (C), static LED (S), and animated LED (A). Comparing the sub-conditions depending on their main condition, we found no big differences. In the control conditions, some difference occurred with respect to the hedonic quality and in the overall ranking. No significant differences between Control Condition 1 (C1) and Control Condition 2 (C2) were found.
A Friedman test [40] was performed to uncover any significance between the three conditions. This was followed by a pairwise comparison with a Wilcoxon signed-rank test [41] to distinguish between conditions and in which UEQ items the differences occur.
All values related to the conditions with lights were consistently good. The pragmatic quality [35] also performed well in the control condition. The hedonic quality [35] and the overall quality of the control condition were in the neutral range. No major differences between the two light conditions were found. In none of the following high qualities was there a significant difference between static lighting and animated lighting. In contrast, there were always significant differences between the control condition and these two conditions (see Table 1).

Table 1.
Comparison of Conditions with short-UEQ items based on Wilcoxon signed-rank test results; no-light condition shows significant differences compared to all other conditions. There are no significant differences in static-light and animated-light conditions regarding the short-UEQ items.
With respect to the pragmatic quality, the Friedman test showed a statistical significance ( (2) = 24.277, p < 0.001). The significant differences occurred between the static-lighting (S) condition compared with the control (C) (z = −3.859, p < 0.001) and the animation condition (A) compared with the control (C) (z = −3.930, p < 0.001). With respect to the hedonic quality, the Friedman test showed a statistical significance ( (2) = 13.865, p < 0.001). Moreover, significant differences were found between the static-lighting condition (S) compared to the control (C) (z = −3.270, p < 0.001) and the animation condition (A) compared to the control (C) (z = −3.862, p < 0.001). With respect to overall quality, the Friedman test showed statistical significance ( (2) = 17.906, p < 0.001). As expected, significant differences were, again, found between the static-lighting condition (L) compared with the control (C) (z = −3.747, p < 0.001) and the animation condition (A) compared with the control (C) (z = −4.073, p < 0.001).
These results support our hypothesis that aight is more supportive in the boarding process than no help. Results showed that the control condition is rated significantlyower compared to the two light conditions in all qualities.
Standard UEQ The calculated mean values were used to determine factors of the UEQ score. The comparisons among the three conditions provided insights regarding the differences among them and were analysed to determine the usability of the system.
In the evaluation of these UEQs, there were significant differences between the two light conditions and the control condition in each category, just as before. In the categories controllability and originality, slightly significant differences between the static-light condition (S) and the animated-light condition (A) were found. Table 2 shows an overview of the data.
Table 2.
Comparison of Conditions with UEQ items based on Wilcoxon signed-rank test Results, no-light condition shows significant differences to all other conditions. There are slightly significant differences in static-light compared to animated-light conditions in controllability and originality.
Attractiveness: In this category, a Friedman test showed statistical significance ( (2) = 27.515, p < 0.001). For this factor, the significant differences occurred between the static-lighting condition (S) compared with the control (C) (z = −4.459, p < 0.001) and the animation condition (A) compared with the control (C) (z = −3.557, p < 0.001). A total of 26 out of 27 participants found the static-light condition more attractive than the control condition; one person found that it was equal. The difference between animated light and control was also very high; twenty participants found that this animation was more attractive than control, five persons saw this the other way around, and two had no preference.
Transparency: A performed Friedman test showed statistical significance ( (2) = 33.158, p < 0.001) regarding this factor. Here, again, significant differences occurred between the static-lighting condition (L) compared with the control (C) (z = 4.789, p < 0.001) and the animation condition (A) compared with the control (C) (z = −3.744, p < 0.001). Twenty-four users rated the light conditions higher regarding transparency than the control condition; three people had no preference. For twenty-three persons, the animation condition performed better when it came to transparency than the control condition, two people found the transparency of the control condition better, and two had no opinion on that.
Efficiency: A Friedman test showed statistical significance ( (2) = 22.396, p < 0.001). Furthermore, analysing this factor, a comparison of the three conditions revealed a significant difference between the control (C) compared to static-light (z = −4.097, p < 0.001) and also to animated-light (z = −3.379, p < 0.001) conditions. The static light was, for twenty-three people, more efficient than no light (C), two found it to be the other way around, and two other had no preference. Nineteen people found the animated light more efficient than no light (C), five rated the control condition higher, and three had no preference.
Controllability: A Friedman test again showed statistical significance ( (2) = 18.468, p < 0.001). Here, significant differences between all three conditions were found, for animated light compared to static light (z = −2.269, p < 0.023) and also, again, for the control condition compared to the static light (z = −3.722, p < 0.001) and animation (z = −3.174, p < 0.002). A total of 15 participants preferred the controllability of the static-light condition over the controllability of the animated-light condition. Seven participants found animated light better regarding this factor than the static-light condition; five had no preference. For the comparison of static light to the control condition, twenty-one people thought static light performed better in controllability, three rated it the other way around, and three had no opinion on this. Eighteen participants graded that animated lights had a higher controllability than no lights (C), four had a reversed perception about this, and five had no preference.
Stimulation: A Friedman test showed statistical significance ( (2) = 43.920, p < 0.001) in that item. Like in all other factors, a comparison of the three conditions gave a significant difference between the control (C) compared to static light (z = −4.545, p < 0.001) and to animated light (z = −4.546, p < 0.001). For each of the two conditions (animation and static light), 27 participants found that the lights were more stimulating than no lights.
Originality: For that category, a performed Friedman test showed statistical significance ( (2) = 37.140, p < 0.001). In the last category, significant differences between all three conditions were also found. It was detected in the comparison of animated light to static light (z = −2.124, p < 0.034). Additionally, as in all other factors, there was also a significant difference between the control condition compared to static-light (z = −4.352, p < 0.001) and animated-light (z = −4.345, p < 0.001) conditions. Fourteen people found that the animated lights were more original than the static lights, six people rated this the other way around, and seven had no preference according to one of the two conditions. A total of 26 out of 27 participants found that staticight was more original than no light (C); 25 rated it the same way for animated light. For each of the two, one person found that noight (C) was more original than lights (L, A). Another person had no preference about whether animated light was better than no light.
Comparison between conditions: There was a trend in the results that the performance of the two light conditions was higher than in the no-light conditions, as shown in Figure 4. This supports our hypothesis that light can serve as support and provide a much better user experience than no support.
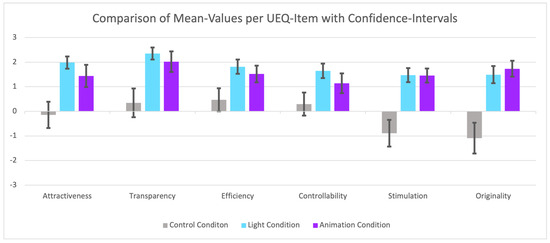
Figure 4.
Comparison of conditions with adjectives given by standard UEQ. Values between −0.8 and 0.8 represent a neutral evaluation. If the values are >0.8, they are positive but if they are <−0.8, they are negative. The range of the rating scales is between −3 (horribly bad) and +3 (extremely good). However, only values in a limited range are considered (−2 < 0 < 2), which means that a value of, e.g., 1.5 is quite a good value.
5.3. Results Summary
Results showed that the designed boarding system is a suitable tool to assist people in booking, boarding, and using an automated bus. The differences between the two lighting conditions (animated and static light) were not big enough to detect statistical significance. Nonetheless, static light received higher ratings overall compared to animated light, with the exception for originality.
In terms of motivation, the interviews indicated that all three conditions were accepted. The condition without lights (C) is similar to the situation known from public transport, so it is not surprising that it has a high acceptance. Nevertheless, the other two conditions (static lighting and animated lighting) showed better performance for an automated shuttle. However, the interview data also showed that animated lights were more often perceived as annoying than static ones. Almost all participants found the lights (whether animated or static) to be more helpful than no lights, suggesting good usability and user experience for both.
6. Discussion
The following section discusses the results of the study with respect to our research questions. We were able to find additional needs and factors that should be addressed to ensure a smooth deployment of an automated shuttle in public transportation. In the discussion, we will elaborate on these needs, factors, and lessons learned.
Capacity Management
Recent literature [9,10] endorses the need for an adequate reservation system for a low-capacity automated shuttle (six to twelve seats). However, we argue that it is not enough to make sure that people can obtain and find their seats in such a shuttle; there needs to be a restriction that people without a booked seat or ticket cannot board. In this context, it will also be important to create a combination of an appropriate booking and boarding system so that passengers obtain a place on the bus. Results of our study have shown that, e.g., through the means of colour-coding and ambient light, such a system can be designed. Eden et al. [42] discovered that additional needs such as safety, comfort, and convenience are important factors for people using these shuttles. We argue that one way to address those factors is by guaranteeing a reserved seat. Having a seat reserved or booked in advance ensures that there is enough room for you on the bus so that you do not have to worry about not being able to use it; this brings an element of safety, comfort, and confidence to the travel process.
Urban vs. Rural Public Transport Systems: The capacity management support needed may be different in certain areas because the frequency is not the same. A process of seat management must be designed to avoid overcrowding on these small shuttles, but also to ensure that passengers can be sure of obtaining a seat at their desired time. If there are no free places in the bus are available, the bus cannot be used and capacity management will fail. This problem especially occurs in rural areas. In urban areas this is not quite a big issue because of the higher density of public transport; it allows quickly to find an alternative transport. In rural areas, there are mostly only a few buses (each 1–2 h) available and there are no substitutes because of the low frequency. In areas where last-mile transportation is required, buses are mostly only driving three to five times a day. The problem is, then, if it is, for some people, not possible to obtain a seat or place in one of the public transports, they have problems to reach their destination, if there is no guarantee to get a space. If people are not able to use buses to reach destinations, those kinds of shuttles make no sense because the usability is significantly limited.
While often considered to be equally a challenge for urban and rural contexts [9,43,44], the participants in this study expressed last-mile transportation to be a greater problem in rural areas were traditional means of transport are either too big to use or not needed because of their capacity. Traditional buses in these areas are usually used by a few to no people. The frequency of operation there is generally quite low, as mentioned before. People drive to work and return home afterwards, which mostly only happens two times a day (mornings and evenings). The rest of the day (outside of rush hours), these buses are used by a small number of passengers. Many of the big buses drive their routes almost empty regarding capacity in these areas. This is not environmentally friendly and not essential as there are other means of transport available that can solve that issue. So, while the deployment of such shuttles may be more challenging in rural areas [8], our qualitative data did show that participants viewed these shuttles as a fairly good solution for last-mile transportation in rural areas.
Size of Buses and Shuttles While the problem of overcrowding and lack of space is eliminated on larger buses, it still remains on these smaller buses. Regardless of size, it is important for passengers to get a seat when they need one. Bus timing differences have a more pronounced impact in rural areas, because finding alternatives is harder compared to urban areas, and not having space on the bus makes it impossible to reach the destination. If all automated transport had the same capacity as existing regular buses, the already known systems could be reused. However, as long as small shuttles and similar options exist, capacity management tools are required. Fröhlich et al. [10] mentioned that this would be a non-trivial challenge in such small shuttles to ensure sufficient space for passengers who would need to use such buses. Unlike large buses, smaller shuttle buses must have a guarantee of getting a seat, especially during rush hours, but also at other times of the day. If automated low-capacity transports persist, then this will be important not only in the transition phase, but will then be an important additional solution in the countryside as well as (physically-constrained) urban environments.
Another aspect to be considered is that people in rural or peripheral areas do not have the ability to switch between different modes of transportation if they need to get somewhere at a certain time. This could lead to many problems and transportation related anxiety among passengers. This means that capacity is likely to be one of the most important acceptance factors, especially compared to attitude towards automation, high as it may be in general [45,46,47]. This runs in tandem with reliability, which needs to be especially high when there are few to no alternatives, if the technology is to be used and accepted.
Usability and User Experience of Booking and Boarding System Booking a seat in advance and indicating where the booked seats are located on the bus is already available in various booking apps. Some of the apps we found have greater advantages than others, but they are all designed for public transport (buses, trains, and subways) with a high capacity. These systems are designed for larger means of transport, where there are usually free seats or standing spaces. However, the smaller the shuttle, the more additional effort is required for capacity management. This is a point that must be considered in booking applications: if I have no seat or place in a small automated shuttle, I cannot use it. In the found literature of Mirnig et al. [11,20], booking apps which fit that context were designed; these booking apps are quite similar to existing ones. However, the most important thing is that existing systems must be adapted with further information and functions to address the needs those kind of shuttles bring (e.g., seat selection and adapted ticket) to ensure that such shuttles are usable.
Our results showed that a seating system is a good support to ensure that people get a seat. People have the assurance that they can use the bus because they have the opportunity to reserve a seat in the booking app beforehand. Participants stated that the designed booking application prototype worked well and felt familiar compared to already existing ones. The implemented visual boarding system seemed to serve its purpose and was highly accepted by the users, confirming colours to work well as an additional means of indication [29] to bridge the gap of currently available systems [23]. All participants were able to find their seat easily and they also mentioned that they could see themselves using such a shuttle without any problems.
However, it was noted that, in some cases, such a boarding system could be very annoying. This was mainly mapped to the use in large public transport systems, but, as mentioned above, these systems are not designed for traditional means of transport, since those boarding systems are not really necessary there, as we do not have capacity management problems there. In traditional means of transport, there are always people available who can help, unlike in an automated low-capacity shuttle. Participants also mentioned that having more than one person boarding at a time can cause confusion (especially in larger shuttles); the same was said for colour-coding: it might also not scale well to larger-sized buses, especially with multiple passengers boarding at the same time. As previously stated, these findings hold particular relevance for smaller shuttles and moderate population densities. In normal-sized buses in the urban contexts where capacity is not an issue, these considerations might not be essential. However, they are crucial for smaller automated shuttles in rural areas, where alternatives are limited, and using such transportation matters significantly.
7. Conclusions
In this paper, a booking and boarding system was presented to improve automated public transportation with small automated shuttles. In particular, the lack of a contact person such as a driver or attendant was addressed. An applicable interface was created that gives users the confidence to book and use such an automated shuttle without any assistance. Besides the booking app, the most important interface of this work was a boarding assistance system. It was tested to provide passengers with an easy and stress-free boarding experience. In particular, the the ambient visual cues and the colour-matching between booking and boarding have been shown to be a suitable approach.
Based on the data obtained, it was found that both systems (booking and boarding interface) were a useful help, but there were still suggestions for improvements and adjustments to the different designs. The main issues mentioned were the fear that, in the future, it would not be possible to use the bus at all if one does not own a smartphone. In particular, older people who have a smartphone but do not use it that often might feel overwhelmed or have difficulty booking. However, participants felt that the boarding system was an appropriate solution for these populations. In addition, the important issue of accessibility was frequently raised, namely that none of the systems were accessible to people with disabilities.
Limitations and Future Work
The study we presented had certain limitations, primarily due to the inability to test it in a real public transportation system because of the pandemic. Additionally, there were constraints in the choice of colours in the application and the boarding interface, as not all colours were equally visible, thus limiting the range of usable colours. The colour-coding system may not be as effective for larger transport shuttles, where exhausting the available colours could be a problem, though this might be less critical than in smaller shuttles with limited seating. The data acquired in this paper were mainly based on qualitative statements, supported by quantitative data. Further research is needed to improve capacity management for highly automated public transportation, including evaluations in a real public transportation environment with more users to generate better quantitative data. It was also important to consider accessibility for participants with vision impairments. To address issues with colour-coding for people with colour vision deficiencies, alternative methods of conveying information, such as patterns or symbols, were used, including seat labels to support them. Further exploration is necessary to address barriers encountered in this work and to make automated public transportation accessible to all populations, including people with disabilities, the elderly, and children. Additional studies should focus on identifying problems and expanding solutions to ensure accessibility for these vulnerable populations and achieve the shared vision of a mobile future.
Author Contributions
V.W. was the primary author and was responsible for conceptualisation, methodology, software, formal analysis, investigation, data curation, writing the original draft, and visualisation. She coordinated and edited all inputs. A.M. contributed to writing, particularly in reviewing and editing, and was also involved in supervision, validation, providing resources, project administration, and acquiring funding. A.G.M. played a significant role in conceptualisation, writing (review and editing), supervision, validation, and funding acquisition. All authors have read and agreed to the published version of the manuscript.
Funding
This research was funded by the Austrian Federal Ministry for Climate Action, Environment, Energy, Mobility, Innovation and Technology (BMK) and the Austrian Research Promotion Agency (FFG) under grant number 865110 (Project: Digibus® Austria). Open access publication supported by the Paris Lodron University of Salzburg Publication Fund.
Institutional Review Board Statement
Not Applicable.
Informed Consent Statement
Informed consent was obtained from all subjects involved in the study. The patients/participants provided their written informed consent to participate in this study. Written informed consent has been obtained from the patient(s) for the publication of any potentially identifiable images or data included in this article.
Data Availability Statement
The datasets presented in this article are not readily available because the sharing of datasets requires the agreement of the respective consortia, which needs to be negotiated with the respective contributing authors. These decisions can be mediated but not fully made by the corresponding author alone. Requests to access the datasets should be directed to vivien.wallner@plus.ac.at.
Acknowledgments
Open-access publication is supported by the Paris Lodron University of Salzburg Publication Fund (Open Access Funding by the University of Salzburg.) We extend our gratitude to Magdalena Gärtner for her invaluable feedback and assistance in evaluation and design matters. We also thank our former intern, Maximilian Spannring, for their early research contributions and prototype support. Additionally, we appreciate the assistance of Jakub Sypniewski and Hanna Braun for their help with hardware and statistical evaluation questions.
Conflicts of Interest
The authors declare no conflicts of interest.
Abbreviations
The following abbreviations are used in this manuscript:
| HCI | Human–computer Interaction |
| SAE | Society of Automotive Engineers |
| UX | User experience |
| UEQ | User experience questionnaire |
| QR | Quick response |
| LED | Light-emitting diode |
| RGB | Red, green, and blue |
| COVID-19 | Coronavirus Disease of 2019 |
| Pre-questionnaire | Preliminary questionnaire |
| 3G-regulation | Vaccinated, recovered, or tested (COVID-19) |
| FFP-2 Mask | Filtering face-piece |
| M | Mean |
| SD | Standard deviation |
| p | Participants |
| C | Control condition |
| S | Static LED condition |
| A | Animated LED condition |
References
- Menon, A. Top 8 Automation Trends in 2022 to Know; TechFunnel: Frisco, TX, USA, 2021. [Google Scholar]
- Hopkins, D.; Schwanen, T. Talking about automated vehicles: What do levels of automation do? Technol. Soc. 2021, 64, 101488. [Google Scholar]
- Zasiadko, M. Fully Automated Metros Run in Six EU Countries; ProMedia Group: Rotterdam, The Netherlands, 2019. [Google Scholar]
- Sato, N. The World’s First Automated Driverless Railway Opened in Kobe in 1981; Human Resocia: Tokyo, Japan, 2020. [Google Scholar]
- Das, M. India’s First Driverless Metro Takes Off; THG Publishing: Chennai, India, 2020. [Google Scholar]
- Menesplier, P.; Gue, A.; Naoufal, J.; Longo, J.; Benoit, F. World’s Best Driverless Metro Lines 2017; Wavestone: Saint-Cloud, France, 2017. [Google Scholar]
- Fourtané, S. Self-Driving Vehicles for Urban Mobility Deployed in European Smart Cities; Interesting Engineering, Inc.: New York, NY, USA, 2020. [Google Scholar]
- Kou, X.; Zhang, Y.; Long, D.; Liu, X.; Qie, L. An investigation of multimodal transport for last mile delivery in rural areas. Sustainability 2022, 14, 1291. [Google Scholar]
- Fröhlich, P.; Millonig, A.; Frison, A.K.; Trösterer, S.; Baldauf, M. User Interfaces for Public Transport Vehicles: Future Opportunities and Challenges. In Proceedings of the Adjunct Proceedings of the 10th International Conference on Automotive User Interfaces and Interactive Vehicular Applications, Toronto, ON, Canada, 23–25 September 2018; pp. 50–55. [Google Scholar]
- Fröhlich, P.; Baldauf, M.; Mirnig, A.G. 2nd workshop on user interfaces for public transport vehicles: Interacting with automation. In Proceedings of the 11th International Conference on Automotive User Interfaces and Interactive Vehicular Applications: Adjunct Proceedings, Utrecht, The Netherlands, 21–25 September 2019; pp. 19–24. [Google Scholar]
- Mirnig, A.G.; Gärtner, M.; Wallner, V.; Füssl, E.; Ausserer, K.; Rieß, J.; Meschtscherjakov, A. Mind the Seat Limit: On Capacity Management in Public Automated Shuttles. Front. Hum. Dyn. 2021, 3, 689133. [Google Scholar]
- Buchenau, M.; Suri, J.F. Experience Prototyping. In Proceedings of the 3rd Conference on Designing Interactive Systems: Processes, Practices, Methods, and Techniques, DIS ’00, New York, NY, USA, 17–19 August 2000; pp. 424–433. [Google Scholar] [CrossRef]
- Hassenzahl, M. Experience design: Technology for all the right reasons. Synth. Lect.-Hum.-Centered Inform. 2010, 3, 1–95. [Google Scholar]
- Iantorno, M.; Doggett, O.; Chandra, P.; Yujie Chen, J.; Steup, R.; Raval, N.; Khovanskaya, V.; Lam, L.; Singh, A.; Rotz, S.; et al. Outsourcing Artificial Intelligence: Responding to the Reassertion of the Human Element into Automation. In Proceedings of the CHI Conference on Human Factors in Computing Systems Extended Abstracts, New Orleans, LA, USA, 29 April–5 May 2022; pp. 1–5. [Google Scholar]
- Salonen, A.O.; Haavisto, N. Towards autonomous transportation. Passengers’ experiences, perceptions and feelings in a driverless shuttle bus in Finland. Sustainability 2019, 11, 588. [Google Scholar] [CrossRef]
- Nordhoff, S.; Stapel, J.; van Arem, B.; Happee, R. Passenger opinions of the perceived safety and interaction with automated shuttles: A test ride study with ‘hidden’ safety steward. Transp. Res. Part A Policy Pract. 2020, 138, 508–524. [Google Scholar]
- Csiszár, C.; Zarkeshev, A. Demand-capacity coordination method in autonomous public transportation. Transp. Res. Procedia 2017, 27, 784–790. [Google Scholar]
- Pelikan, H.R. Why autonomous driving is so hard: The social dimension of traffic. In Proceedings of the Companion of the 2021 ACM/IEEE International Conference on Human-Robot Interaction, Boulder, CO, USA, 8–11 March 2021; pp. 81–85. [Google Scholar]
- Wallner, V.; Mirnig, A.G.; Gärtner, M.; Meschtscherjakov, A. Chatting up an Automated Vehicle: Does a Text-based Chatbot Bring Back the Human Element into the Travel Experience? In Proceedings of the 14th International Conference on Automotive User Interfaces and Interactive Vehicular Applications, Seoul, Republic of Korea, 17–20 September 2022. [Google Scholar] [CrossRef]
- Mirnig, A.G.; Wallner, V.; Gärtner, M.; Meschtscherjakov, A.; Tscheligi, M. Capacity Management in an Automated Shuttle Bus: Findings from a Lab Study. In Proceedings of the 12th International Conference on Automotive User Interfaces and Interactive Vehicular Applications, AutomotiveUI ’20, Online, 21–22 September 2020; pp. 270–279. [Google Scholar] [CrossRef]
- Mirnig, A.G.; Gärtner, M.; Füssl, E.; Ausserer, K.; Meschtscherjakov, A.; Wallner, V.; Kubesch, M.; Tscheligi, M. Suppose your bus broke down and nobody came. Pers. Ubiquitous Comput. 2020, 24, 797–812. [Google Scholar]
- Mirnig, A.G.; Gärtner, M.; Wallner, V.; Gafert, M.; Braun, H.; Fröhlich, P.; Suette, S.; Sypniewski, J.; Meschtscherjakov, A.; Tscheligi, M. Stop or Go? Let me Know! A Field Study on Visual External Communication for Automated Shuttles. In Proceedings of the 13th International Conference on Automotive User Interfaces and Interactive Vehicular Applications, Leeds, UK, 9–14 September 2021; pp. 287–295. [Google Scholar]
- Riener, A.; Schlackl, D.; Malsam, J.; Huber, J.; Homm, B.; Kaczmar, M.; Kleitsch, I.; Megos, A.; Park, E.; Sanverdi, G.; et al. Improving the UX for Users of Automated Shuttle Buses in Public Transport: Investigating Aspects of Exterior Communication and Interior Design. Multimodal Technol. Interact. 2021, 5, 61. [Google Scholar] [CrossRef]
- Carmona, J.; Guindel, C.; Garcia, F.; de la Escalera, A. eHMI: Review and guidelines for deployment on autonomous vehicles. Sensors 2021, 21, 2912. [Google Scholar] [CrossRef]
- Mirnig, A.G.; Gärtner, M.; Fröhlich, P.; Wallner, V.; Dahlman, A.S.; Anund, A.; Pokorny, P.; Hagenzieker, M.; Bjørnskau, T.; Aasvik, O.; et al. External communication of automated shuttles: Results, experiences, and lessons learned from three European long-term research projects. Front. Robot. AI 2022, 9, 239. [Google Scholar]
- Guevara, L.; Auat Cheein, F. The role of 5G technologies: Challenges in smart cities and intelligent transportation systems. Sustainability 2020, 12, 6469. [Google Scholar] [CrossRef]
- Shut, V.; Kasyanik, V. Mobile Autonomous robots–a new type of city public transport. Transp. Telecommun. J. 2013, 14, 39–44. [Google Scholar]
- Löcken, A.; Wintersberger, P.; Frison, A.K.; Riener, A. Investigating user requirements for communication between automated vehicles and vulnerable road users. In Proceedings of the 2019 IEEE Intelligent Vehicles Symposium (IV), Paris, France, 9–12 June 2019; pp. 879–884. [Google Scholar]
- Dey, D.; Habibovic, A.; Pfleging, B.; Martens, M.; Terken, J. Color and animation preferences for a light band eHMI in interactions between automated vehicles and pedestrians. In Proceedings of the 2020 CHI Conference on Human Factors in Computing Systems, Honolulu, HI, USA, 25–30 April 2020; pp. 1–13. [Google Scholar]
- Borojeni, S.S.; Chuang, L.; Heuten, W.; Boll, S. Assisting drivers with ambient take-over requests in highly automated driving. In Proceedings of the 8th International Conference on Automotive User Interfaces and Interactive Vehicular Applications, Ann Arbor, MI, USA, 24–26 October 2016; pp. 237–244. [Google Scholar]
- Fotios, S.; Robbins, C.J. Effect of Ambient Light on the Number of Motorized Vehicles, Cyclists, and Pedestrians. Transp. Res. Rec. 2021, 2676, 593–605. [Google Scholar]
- Louw, T.; Madigan, R.; Lee, Y.M.; De Marco, C.; Mallada, J.L.; Merat, N. Do not Worry, I’m in Control! Is Users’ Trust in Automated Driving Different When Using a Continuous Ambient Light HMI Compared to an Auditory HMI? In Proceedings of the 13th International Conference on Automotive User Interfaces and Interactive Vehicular Applications, Leeds, UK, 9–14 September 2021; pp. 220–222. [Google Scholar]
- Colley, M.; Bajrovic, E.; Rukzio, E. Effects of pedestrian behavior, time pressure, and repeated exposure on crossing decisions in front of automated vehicles equipped with external communication. In Proceedings of the CHI Conference on Human Factors in Computing Systems, New Orleans, LA, USA, 29 April–5 May 2022; pp. 1–11. [Google Scholar]
- Dahlbäck, N.; Jönsson, A.; Ahrenberg, L. Wizard of Oz studies—why and how. Knowl.-Based Syst. 1993, 6, 258–266. [Google Scholar]
- Schrepp, M.; Hinderks, A.; Thomaschewski, J. Design and evaluation of a short version of the user experience questionnaire (UEQ-S). Int. J. Interact. Multimed. Artif. Intell. 2017, 4, 103–108. [Google Scholar]
- Schrepp, M.; Hinderks, A.; Thomaschewski, J. Applying the user experience questionnaire (UEQ) in different evaluation scenarios. In Proceedings of the International Conference of Design, User Experience, and Usability, Heraklion, Greece, 22–27 June 2014; pp. 383–392. [Google Scholar]
- Schrepp, M. User experience questionnaire handbook. In All You Need to Know to Apply the UEQ Successfully in Your Project; UEQ: Weyhe, Germany, 2015; pp. 50–52. [Google Scholar]
- Bree, R.T.; Gallagher, G. Using Microsoft Excel to code and thematically analyse qualitative data: A simple, cost-effective approach. All Irel. J. High. Educ. 2016, 8. [Google Scholar]
- Ruona, W.E. Analyzing qualitative data. Res. Organ. Found. Methods Inq. 2005, 223, 263. [Google Scholar]
- Pereira, D.G.; Afonso, A.; Medeiros, F.M. Overview of Friedman’s test and post hoc analysis. Commun.-Stat.-Simul. Comput. 2015, 44, 2636–2653. [Google Scholar]
- Rosner, B.; Glynn, R.J.; Lee, M.L.T. The Wilcoxon signed rank test for paired comparisons of clustered data. Biometrics 2006, 62, 185–192. [Google Scholar]
- Eden, G.; Nanchen, B.; Ramseyer, R.; Evéquoz, F. Expectation and experience: Passenger acceptance of autonomous public transportation vehicles. In Proceedings of the IFIP Conference on Human–Computer Interaction, Mumbai, India, 25–29 September 2017; pp. 360–363. [Google Scholar]
- Trommer, S.; Kolarova, V.; Fraedrich, E.; Kröger, L.; Kickhöfer, B.; Kuhnimhof, T.; Lenz, B.; Phleps, P. The Impact of Vehicle Automation on Mobility Behaviour. Auton. Driv. 2016, 94. [Google Scholar]
- Urry, J. What Is the Future? John Wiley & Sons: Cambridge, UK, 2016. [Google Scholar]
- Garidis, K.; Ulbricht, L.; Rossmann, A.; Schmäh, M. Toward a user acceptance model of autonomous driving. In Proceedings of the 53rd Hawaii International Conference on System Sciences, Maui, HI, USA, 7–10 January 2020. [Google Scholar]
- Madigan, R.; Louw, T.; Dziennus, M.; Graindorge, T.; Ortega, E.; Graindorge, M.; Merat, N. Acceptance of automated road transport systems (ARTS): An adaptation of the UTAUT model. Transp. Res. Procedia 2016, 14, 2217–2226. [Google Scholar]
- Madigan, R.; Louw, T.; Wilbrink, M.; Schieben, A.; Merat, N. What influences the decision to use automated public transport? Using UTAUT to understand public acceptance of automated road transport systems. Transp. Res. Part F Traffic Psychol. Behav. 2017, 50, 55–64. [Google Scholar]


Disclaimer/Publisher’s Note: The statements, opinions and data contained in all publications are solely those of the individual author(s) and contributor(s) and not of MDPI and/or the editor(s). MDPI and/or the editor(s) disclaim responsibility for any injury to people or property resulting from any ideas, methods, instructions or products referred to in the content. |
© 2024 by the authors. Licensee MDPI, Basel, Switzerland. This article is an open access article distributed under the terms and conditions of the Creative Commons Attribution (CC BY) license (https://creativecommons.org/licenses/by/4.0/).