Article

The Noise Exposure of Urban Rail Transit Drivers: Hazard Classification, Assessment, and Mitigation Strategies

1
School of Urban Railway Transportation, Shanghai University of Engineering Science, Shanghai 201620, China
2
School of Transportation and Logistics, Southwest Jiaotong University, Chengdu 611756, China
3
Urban Mobility Institute, Tongji University, Shanghai 201804, China
4
Intelligent Transportation System Research Center, Hangzhou City University, Hangzhou 310015, China
*
Author to whom correspondence should be addressed.
Appl. Sci. 2024, 14(16), 7388; https://doi.org/10.3390/app14167388 (registering DOI)
Submission received: 30 July 2024 / Revised: 13 August 2024 / Accepted: 15 August 2024 / Published: 21 August 2024
(This article belongs to the Special Issue Noise and Vibration Hazards from Transportation Systems)

Abstract

:
Prolonged exposure to high-intensity noise environments in urban rail transit systems can negatively impact the health and work efficiency of drivers. However, there is a lack of comprehensive understanding of the noise pattern and, therefore, effective mitigation strategies. To control the noise in urban rail transit systems, this study proposes a comprehensive noise assessment framework, including metrics such as average sound pressure level, peak sound pressure level, percentile sound pressure levels, dynamic range, main frequency component, and cumulative time energy to evaluate the noise characteristics. We also employ a density-based spatial clustering of applications with noise (DBSCAN) method to identify the noise patterns with the evaluation of their hazard to urban rail transit drivers. The results have revealed that: (1) The equivalent continuous sound pressure level (Leq) in the cab of Lanzhou Urban Rail Transit Line 1 averages 87.12 dB, with a standard deviation of 8.52 dB, which reveals a high noise intensity with substantial fluctuations. (2) Ten noise patterns were identified, with frequencies varying from 14.47 Hz to 69.70 Hz and Leq varying from 60 dB to 115 dB. (3) The major noise sources from these patterns are inferred to be the train’s mechanical systems, wheel–rail interaction, aerodynamic effects, and braking systems. Combined with the noise patterns and urban rail transit’s operation environment, this study proposes tailored mitigation strategies for applications aimed at protecting drivers’ hearing health, enhancing work efficiency, and ensuring driving safety.

1. Introduction

The construction and networked operation of urban rail transit systems in cities around the world has promoted the sustainable development of urban public transportation [1,2]. However, the operation noise has also negatively affected the riders’ comfort [3], drivers’ health [4], and even operational safety [5]. Studies have indicated that noise in urban rail transit systems generally exceeds 85 decibels, which has far surpassed the standard 55 dB recommended by the World Health Organization [6,7]. Furthermore, prolonged exposure to urban rail transit noise can lead to driver’s hearing disorders and increase their psychological stress, anxiety, and depression [8,9,10,11]. Additionally, noise also interferes with drivers’ attention and reaction times, which increases the probability of errors and accidents [12]. Therefore, effective noise control and mitigation strategies are essential for ensuring the safety of both drivers and passengers [13].
Urban rail transit noise predominantly originates from track–wheel friction, electrical system operations, and carriage structural resonance and generally converges in the driver’s cab [14,15]. Previous noise assessment research primarily utilizes sound level meters and spectrum analyzers to identify noise sources and characteristics through the measurement and analysis of noise intensity and spectral distribution [16,17,18]. Recent studies also incorporated numerical simulation techniques such as finite element analysis or computational fluid dynamics to accurately model the distribution of urban rail transit noise [19,20].
However, the inadequate understanding of nuanced noise characteristics in existing urban rail transit noise control strategies leads to suboptimal mitigation effectiveness. Different noise sources usually exhibit distinct characteristics in their spectral distributions, yet existing control measures often fail to address these differences in a tailored manner. Specifically, Zhao et al. found that elastic mats and various noise barriers exhibit limitations in controlling wheel–rail noise [21]. Liu et al. demonstrated that although the overall noise in air-conditioning ducts is managed, consequential noise issues persist at the front end of the cabin [22]. Furthermore, existing studies predominantly focus on controlling the sound pressure levels, with insufficient attention to the spectral characteristics of noise, including the specific impacts of different frequency components on human health [23]. Therefore, in-depth research into the detailed characteristics of urban rail transit noise and the development of more precise noise control strategies are essential to improving the effectiveness of noise control measures.
To overcome the above shortcomings, we propose a systematic noise control framework for urban rail transit driver cabs. Specifically, we proposed a set of noise evaluation metrics, employed density-based spatial clustering of applications with noise (DBSCAN) clustering algorithms for noise pattern identification and noise source derivation, and designed tailored control measures based on the identified noise patterns. Our contributions to the driver’s cab noise control are threefold: (1) The metric we developed comprehensively reflects both frequency domain and intensity information, enabling a more accurate assessment of noise levels in the driver’s cab. (2) We applied clustering algorithms to the analysis of noise source signals and detected distinct noise patterns. (3) We proposed targeted noise control strategies based on the inferred noise sources tailored to the actual operational conditions of Lanzhou Urban Rail Transit Line 1. Field experiments validated the application value of these methods.
The remainder of this study is organized as follows. Section 2 reviews the mechanisms of urban rail transit noise generation and summarizes the research paradigms for noise assessment. Section 3 elaborates on the research methodology, including the mathematical models utilized in noise data processing, the definition of the urban rail transit noise evaluation metrics, and the noise pattern clustering algorithm. Section 4 provides a detailed account of the noise data collection process, the calculation results of noise evaluation indicators, and the identification of several noise patterns through the clustering algorithm. Section 5 proposes customized control strategies based on the characteristics of different noise categories and presents the results of field tests on the effectiveness of noise mitigation measures.

2. Literature Review

2.1. Mechanisms of Urban Rail Transit Noise

The noise generation mechanisms in urban rail transit systems are relatively complex, with multiple noise sources interacting to produce diverse noise characteristics [24]. The overview of metro noise research and mitigation strategies is presented in Table 1.
One of the primary noise sources is the friction between the rails and the wheelsets [10]. Rail–wheel friction noise encompasses both high-frequency vibration noise from direct contact and impact noise due to track irregularities, as well as rail and wheelset wear [33]. These noise sources exhibit markedly distinct spectral characteristics, necessitating comprehensive spectral analysis to accurately delineate and identify their specific properties [30].
Aerodynamic noise is particularly pronounced in high-speed trains and becomes markedly intensified during tunnel ingress and egress, where fluctuations in airflow precipitate substantial increases in noise levels [34,35]. The substantial increase in aerodynamic drag at high speeds generates noise originating from the friction between the airflow and the train’s surface, turbulence at the front and rear of the train, and sudden changes in air pressure as the train moves through tunnels [31]. The intensity and spectral characteristics of aerodynamic noise are influenced by factors such as the shape of the train body, train speed, tunnel design, and weather conditions [23]. Structural resonance noise of train carriages constitutes a pivotal factor [26]. During train operation, the carriage structure resonates due to external vibrations and internal sound waves, engendering structural noise [20]. The spectral characteristics of this noise are intricately linked to factors such as the materials composing the carriages, the structural design, and the train speed [32,36].
The aforementioned analysis illustrates that urban rail transit noise encompasses intricate generation mechanisms and is influenced by a multitude of factors. Evaluating and mitigating this noise based solely on overall sound pressure levels cannot provide enough evidence for customizing mitigation strategies. Hence, effective noise abatement strategies necessitate meticulous spectral analysis and a profound understanding of the characteristics of various noise sources.

2.2. Urban Rail Transit Noise Assessment and Control
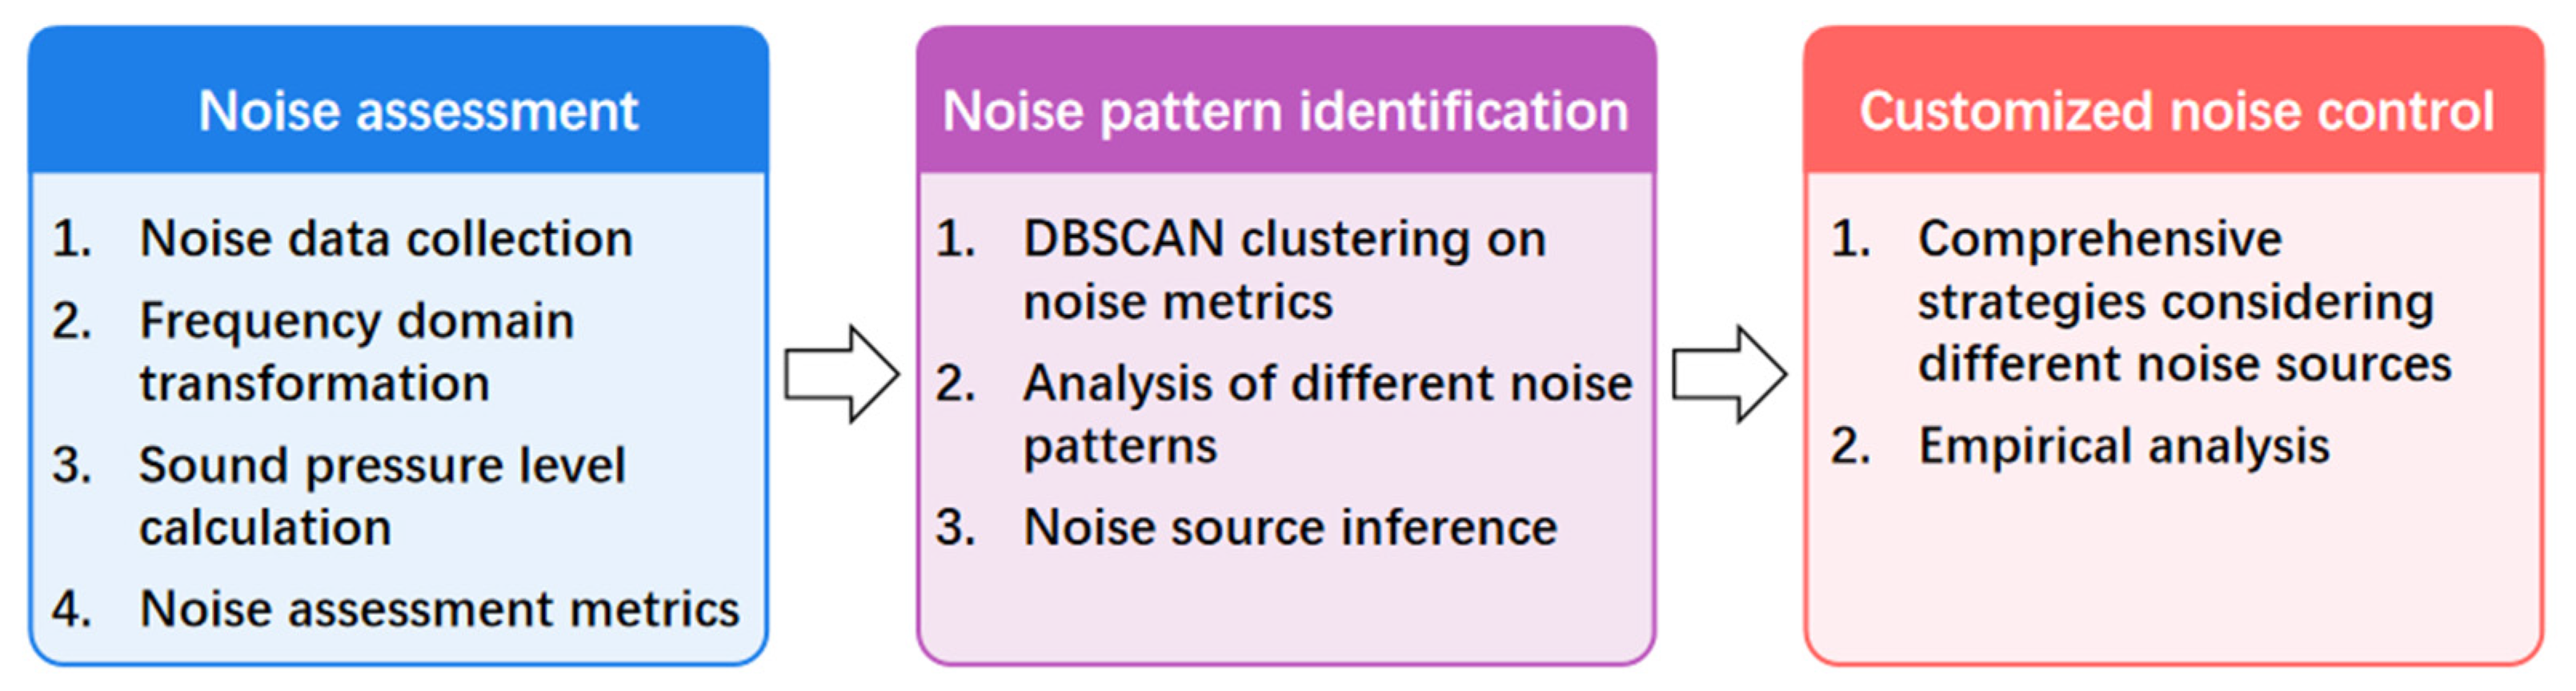
Urban rail transit noise assessment conventionally employs indicators such as A-weighted sound pressure level (A-weighted SPL), Z-weighted sound pressure level (Z-weighted SPL), equivalent continuous A-weighted sound pressure level (LeqA), and 1/3 octave band center frequencies [16,17,18,37,38,39]. A-weighted SPL reflects the sensitivity of the human ear to different frequencies by applying A-weighting to the raw sound pressure level [7]. Z-weighted SPL provides a flat frequency response from 20 Hz to 20 kHz, accurately representing the sound without any gain or attenuation at any frequency [40]. Equivalent continuous A-weighted SPL describes the average sound level over a specified period, facilitating the evaluation of the overall impact of noise [40]. The 1/3 octave band center frequency method divides the frequency range into narrower bands, offering more detailed noise information compared to broad-band analysis [41]. Each indicator suits a different scenario, with A-weighted SPL for human auditory perception, Z-weighted SPL for precise sound measurement, equivalent continuous A-weighted SPL for long-term noise exposure, and the 1/3 octave band method for detailed frequency analysis.
Evaluation methods in the research paradigms primarily include sound level measurement, spectral analysis, and temporal analysis [7,40,42]. Sound level measurement employs sound level meters to capture real-time sound pressure levels at designated locations and offers instantaneous and quantitative noise indicators, which are commonly utilized for routine environmental noise monitoring or preliminary noise assessments [18]. Spectral analysis allows researchers to identify and quantify the sound pressure levels within specific frequency bands by decomposing sound into its frequency components, revealing its frequency composition and providing a foundation for the in-depth analysis of noise sources, propagation characteristics, and their potential impacts on humans [36]. The temporal analysis concentrates on the temporal evolution of sound characteristics and capturing transient or prolonged variations in sound signals, which makes it well-suited for investigating non-stationary, intermittent, or transient noise patterns [43].
Exposure assessment is an essential subfield of urban rail transit noise evaluation research. By estimating the noise exposure levels of individuals or groups over long or short periods in specific environments, researchers can quantify cumulative noise exposure [17]. Data collection typically involves the use of wearable sound level meters or specialized noise dosimeters [43]. Propagation simulation employs computational methods to simulate and predict noise propagation in complex environments, providing preliminary insights for experiments that are challenging to conduct in real-world settings [44]. These simulations rely on acoustic modeling software and specialized knowledge for model development, validation, and analysis, thereby offering a scientific basis for formulating noise control strategies [20].
Despite their widespread use in urban rail transit noise research, existing studies predominantly emphasize overall noise levels and macroscopic characteristics, lacking in-depth analysis of the spectral properties and temporal variability of different noise sources, which hampers the effectiveness of current noise assessment methods and mitigation strategies in addressing complex noise environments and renders precise noise control challenging. Therefore, conducting comprehensive studies on the specific characteristics of various noise patterns and integrating spectral and temporal analyses of multi-source noise is essential for enhancing the effectiveness of noise control.

3. Methodology

The original noise signals collected by the sound equipment contain substantial interference and may lead to biases in the calculation. Therefore, we applied frequency domain transformation and band-stop filtering to remove the background noise. Considering the sound pressure level (SPL) more intuitively reflects the noise intensity perceived by the human ear than amplitude signals, we further converted the filtered sound signals into SPL metrics. However, SPL metrics only reflect the instantaneous noise intensity and cannot describe the noise characteristics over continuous periods. To address this issue, we developed a set of noise evaluation metrics, which includes frequency domain attributes, noise intensity attributes, and the number of specific sound events (e.g., high-frequency noise squeals), which provide a holistic perspective for noise assessment. Since the noise evaluation metrics only describe the current state of noise, we also employed noise pattern clustering algorithms to further investigate their sources and characteristics and provide customized noise control strategies. The framework we proposed for urban rail transit noise control is illustrated in Figure 1, and the specific mathematical model will be elaborated in detail in the subsequent section.

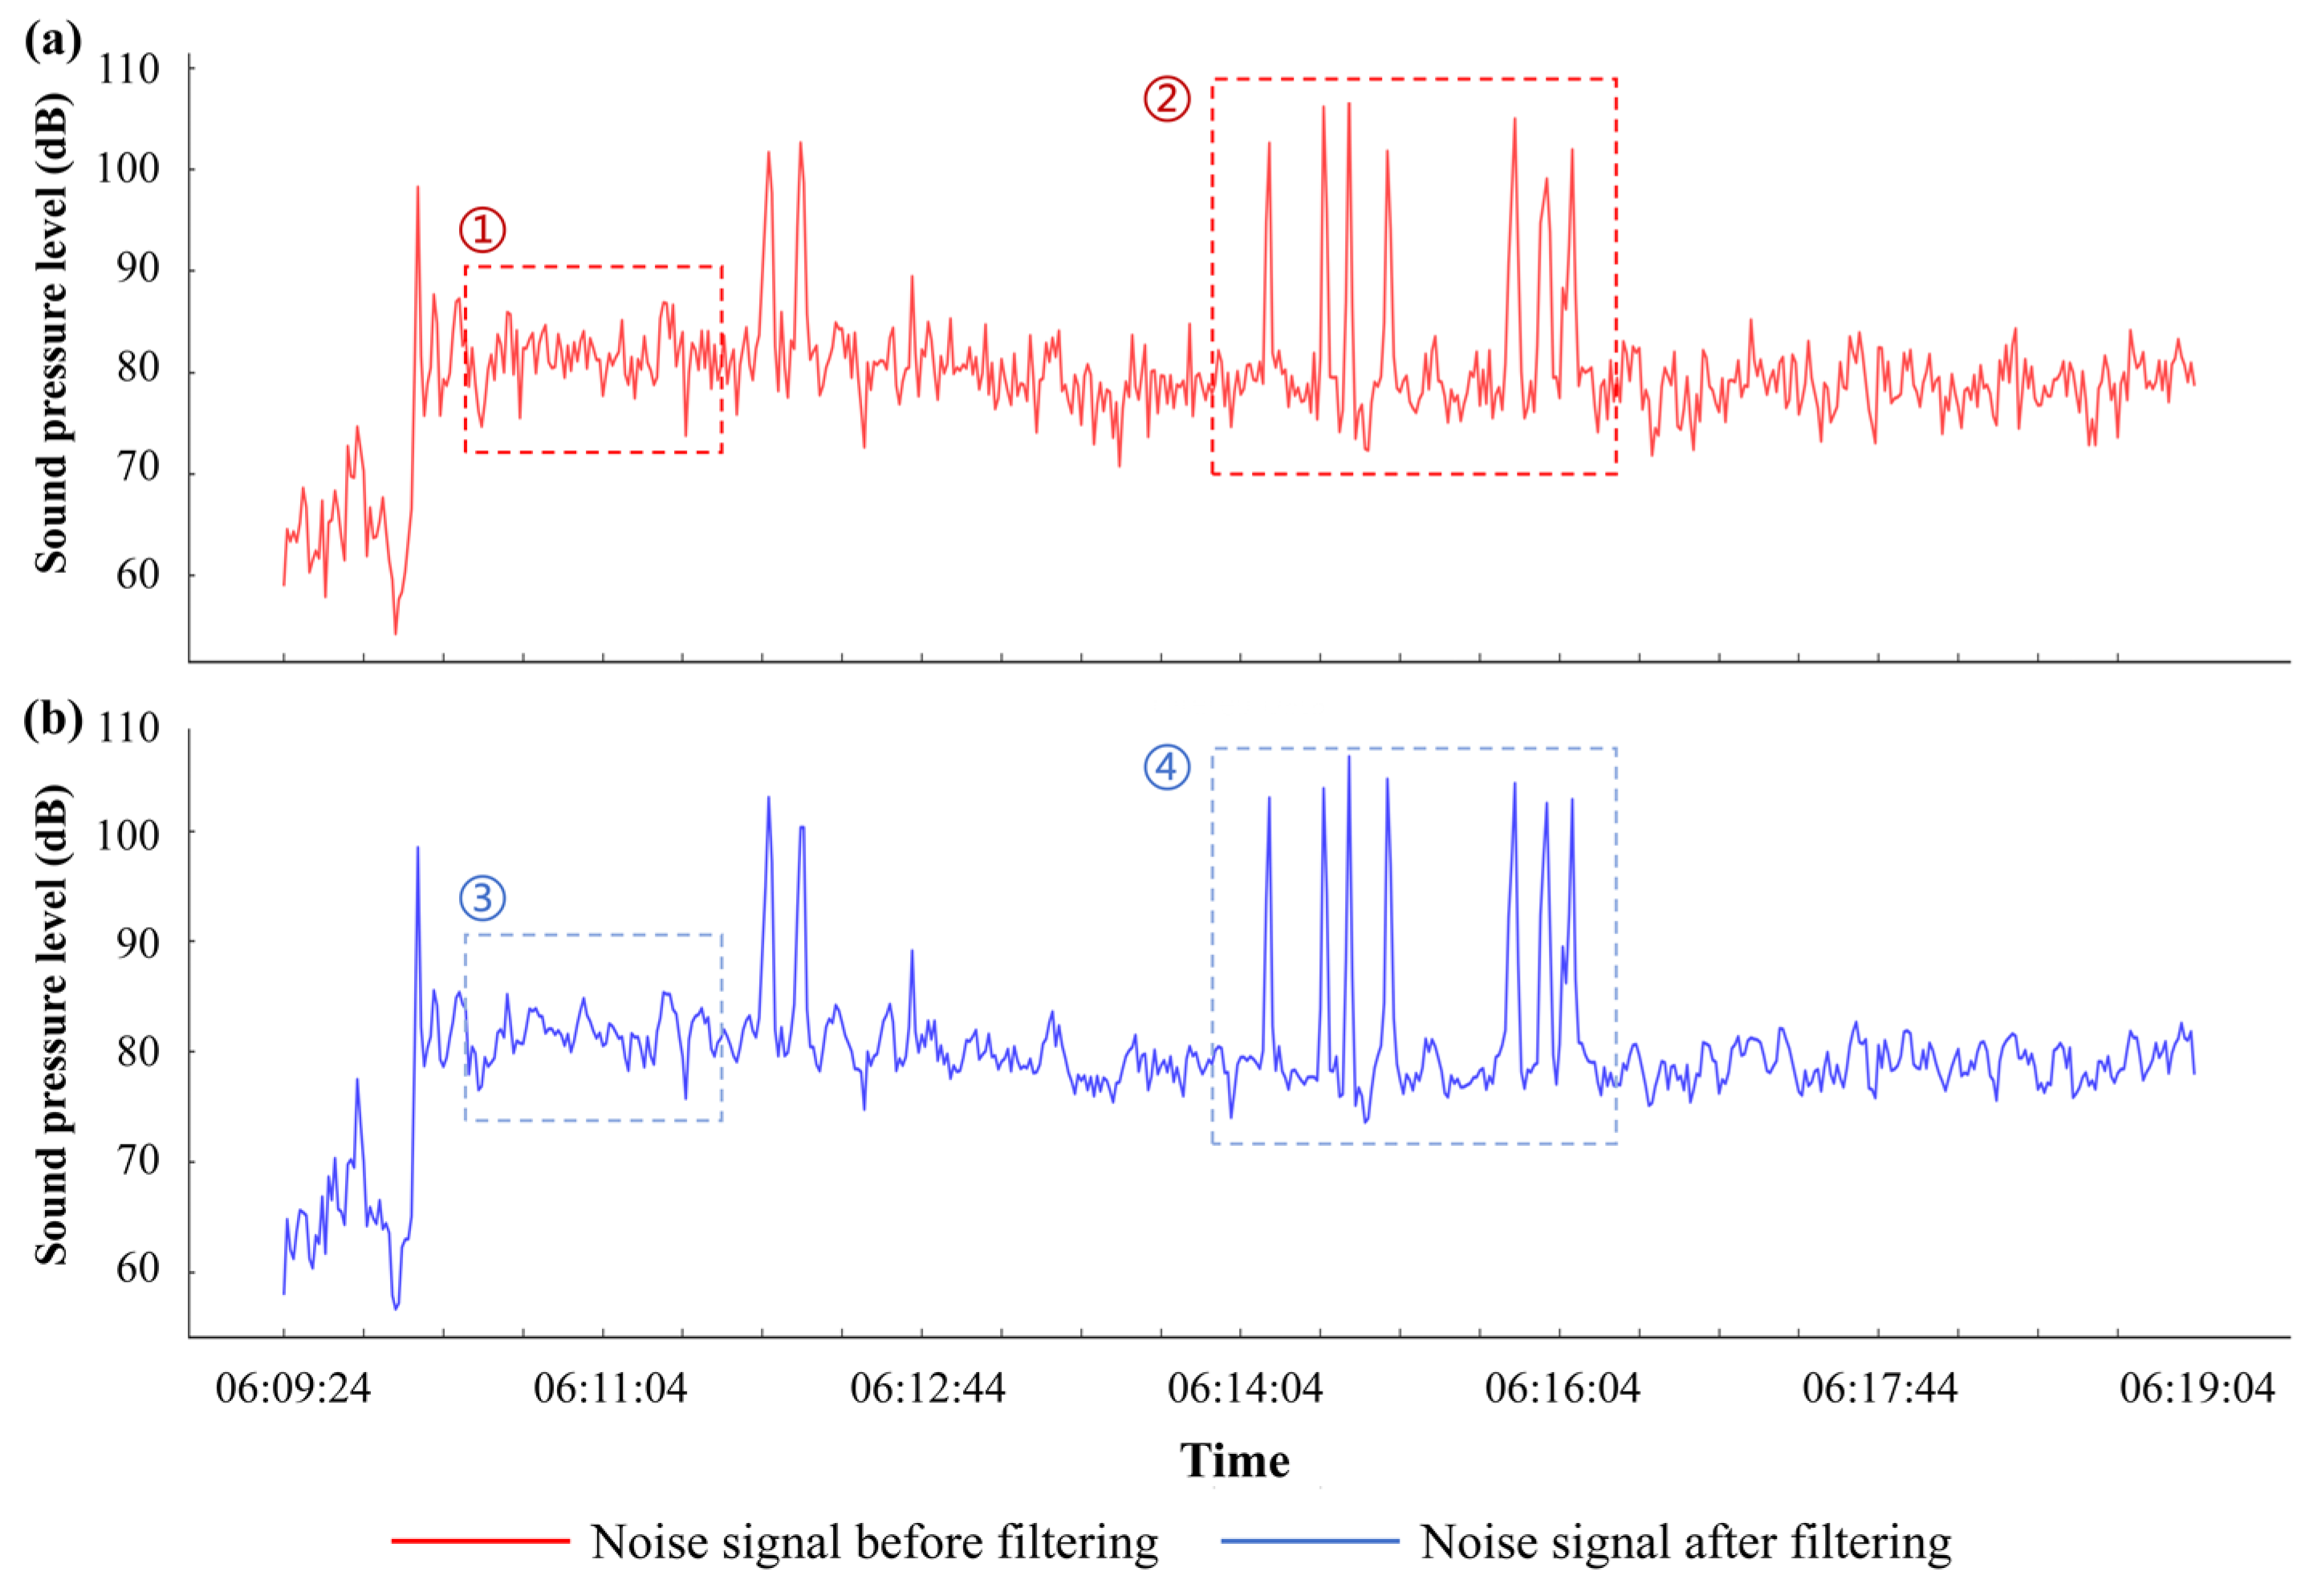
3.1. Noise Signal Processing and Assessment

The transformation of time–domain signals into frequency–domain signals is a fundamental technique in acoustics that reveals the spectral characteristics of sound. Our study employs the fast Fourier transform (FFT), an efficient algorithm for computing the discrete Fourier transform (DFT), to convert finite-length sequences into frequency–domain representations [45]. This process allows for a detailed analysis of noise signals by decomposing them into frequency components, with the amplitude and phase of each reflecting the signal’s energy distribution across frequencies. We also applied a band-stop filter to remove interference from specific frequency ranges, typically background noise. This filtering is essential for isolating noise characteristics impacting metro drivers. The band-stop filter attenuates signals within a targeted frequency band while preserving others, thus enhancing the clarity of the noise profile relevant to our study [46].
To evaluate the impact of cabin noise on drivers, we converted filtered signals into sound pressure levels (SPLs), measured in decibels (dBs). SPL is essential for assessing auditory experiences and provides a basis for noise exposure evaluation. Key metrics include the equivalent continuous sound pressure level (Leq) since the average sound pressure over a period is essential for assessing long-term exposure. Maximum (Lmax) and minimum (Lmin) sound pressure levels identify the highest and lowest noise levels, reflecting both peak noise events and background noise [47].
Additional metrics such as percentile sound pressure levels (L10, L25, L50, L75, L90) capture the distribution of noise over time, while the dynamic range (LR) measures fluctuations in noise levels. The main frequency component (MF) identifies dominant noise frequencies, and the time accumulation of energy (TE) provides a comprehensive view of total noise exposure. We also tracked noise events exceeding specific thresholds (NE70, NE75, NE80) to assess the frequency of potentially harmful noise peaks [48]. The noise assessment metrics are shown in Table 2.

3.2. Noise Pattern Identification

In this study, we utilized a clustering approach to identify distinct noise types in the driver’s cabin of the metro system. This method involves comparing the frequency spectra and intensity levels of different noise clusters with those documented in existing literature to infer the potential noise sources. By correlating these clusters with known noise sources, we could efficiently categorize them without extensive sensor deployment across the train. Specifically, we employed the DBSCAN (density-based spatial clustering of applications with noise) algorithm to discern noise patterns in the driver’s cab [49]. The noise data are usually characterized by its high dimensionality, diversity, and irregular distribution. Traditional clustering algorithms, such as k-means or hierarchical clustering, predominantly rely on Euclidean distances or other rudimentary distance measures, rendering them suboptimal for the nuanced handling required by high-dimensional data. Conversely, DBSCAN defines clusters based on density, thereby facilitating the identification of noise clusters of arbitrary shapes and sizes. This algorithm eschews reliance on predefined distance metrics, opting instead for local density to delineate cluster boundaries, thereby enhancing its robustness in identifying noise patterns.
Furthermore, the noise data from the driver’s cab frequently include anomalous high-intensity noise and background noise, often stemming from sporadic incidents (e.g., track impacts) or equipment malfunctions. Traditional clustering methods tend to erroneously incorporate these outliers within a cluster, thus compromising the integrity of the clustering results. DBSCAN, however, excels in recognizing these anomalies as noise points (i.e., outliers), effectively excluding them from any cluster. This feature ensures the purity of the clustering outcomes, rendering the identified noise patterns more precise and representative.
Moreover, the driver’s cab noise is an amalgamation of multiple noise sources. Traditional clustering methodologies like K-means necessitate the predefinition of the number of clusters (noise sources), an impractical requirement in complex and indeterminate noise environments. DBSCAN obviates the demand for a preset cluster count, utilizing parameters ε (neighborhood radius) and minPts (minimum number of points) to adaptively uncover the actual number of clusters present in the data. This adaptability empowers DBSCAN to adeptly identify distinct noise patterns in uncertain noise data.
Specifically, the core of the DBSCAN algorithm is based on the concept of the ε -neighborhood. For a given noise signal dataset D , the ε -neighborhood of a point p is defined as:
N ε p = q D | d i s t p , q ε
where d i s t p , q represents the distance between signals p and q , which is calculated by sound pressure level indicators, main frequency components, time accumulation of energy, and events exceeding specific sound pressure levels. The pseudocode for the noise pattern identification DBSCAN algorithm is shown in Algorithm 1.
Algorithm 1: Pseudocode for the noise pattern identification DBSCAN algorithm
Input: Dataset (D), neighborhood radius (ε), minimum points (minPts)
Output: Clusters of different noise patterns
1: clusterID = 0
2: for each unvisited signal Sig in dataset D do
3:   mark Sig as visited
4:   NeighborSignals = regionQuery(Sig, ε)
5:   if size of(NeighborSignals) < minPts then
6:     mark Sig as noise
7:   else
8:     clusterID = clusterID + 1
9:     expandCluster(Sig, NeighborSignals, clusterID, ε, minPts)
10:  end if
11: end for
12: function expandCluster(Sig, NeighborSignals, clusterID, ε, minPts)
13:  add Sig to cluster clusterID
14:  for each signal Sig′ in NeighborSignals do
15:    if Sig′ is not visited then
16:      mark Sig′ as visited
17:      NeighborSignals′ = regionQuery(Sig′, ε)
18:      if sizeof(NeighborSignals′) ≥ minPts then
19:        NeighborSignals ± NeighborSignals′
20:      end if
21:    end if
22:    if Sig′ is not yet part of any cluster then
23:      add Sig′ to cluster clusterID
24:    end if
25:  end for
26: end function
27: function regionQuery(Sig, ε)
28:  NeighborSignals = []
29:  for each signal Sig′ in dataset D do
30:    if signalDistance(Sig, Sig′) ≤ ε and signalSimilarity(Sig, Sig′) then
31:      NeighborSignals.add(Sig′)
32:    end if
33:  end for
34:  return NeighborSignals
35: end function
36: function signalDistance(Sig, Sig′)
37:  return sqrt((Sig.x − Sig′.x)2 + (Sig.y − Sig′.y)2 + (Sig.frequency − Sig′.frequency)2)
38: end function
39: function signalSimilarity(Sig, Sig′)
40:  return four types of similarity metrics
41: end function
42: function soundPressureLevelSimilarity(Sig, Sig′)
43:  return abs(Sig.SPL − Sig′.SPL) ≤ ε_SPL
44: end function
45: function mainFrequencyComponentSimilarity(Sig, Sig′)
46:  return abs(Sig.MF − Sig′.MF) ≤ ε_MF
47: end function
48: function timeAccumulationOfEnergySimilarity(Sig, Sig′)
49:  return abs(Sig.TE − Sig’.TE) ≤ ε_TE
50: end function
51: function eventsExceedingSpecificSoundPressureLevelsSimilarity(Sig, Sig′)
52:  return abs(Sig.NE − Sig′.NE) ≤ ε_NE
53: end function

4. Results Analysis

4.1. Noise Data Collection and Assessment

Lanzhou Rail Transit Line 1 is the first operational urban rail transit line in Lanzhou, Gansu Province, China, with a total length of 25.9 km. This study chose the driver’s cab of Lanzhou Rail Transit Line 1 as the case for detailed analysis. The sound measurement equipment used in this study includes the Sound Level Meter 2270-S, Microphone Brüel & Kjær 4189-A-021, and Acoustic Calibrator 4231, all manufactured by Brüel & Kjær in Nærum, Denmark. Additionally, the Cloud Intelligence Acquisition System INV3062A is produced by Beijing Leike Technology Co., Ltd. in Beijing, China. The equipment is illustrated in Figure 2. To ensure the collected noise data accurately reflect what the driver hears, the equipment was installed at a height of 1.2 m, aligning with the driver’s ear level during normal operation, as demonstrated in Figure 3.
Based on the collected original noise data, the fast Fourier transform (FFT) was applied to convert the data into the frequency domain. Following this, a band-stop filter was utilized to remove interference within specific frequency ranges, thereby reducing background noise. Figure 4 presents a comparison of the noise signals before and after filtering. The results demonstrate that the filtering process effectively minimizes background noise interference in non-essential intervals (such as regions 1 and 3) while preserving significant information during essential intervals where high-noise events occur (regions 2 and 4). This method enhances the extraction of key information from the noise signal.
Subsequent to the filtering, the hourly sound pressure level (SPL) of the whole day was calculated, as shown in Figure 5. The data illustrate that noise levels in the driver’s cabin exhibit consistent patterns across different hours. Nonetheless, the long-term time series analysis revealed periodic characteristics, suggesting regular variations in noise levels throughout the day. These findings underscore the stability and inherent regularity of metro noise signals.
We further calculated the noise evaluation metrics proposed in Section 3.1 for the driver’s cab of Lanzhou Urban Rail Transit Line 1 and analyzed its noise environment. The estimation results of noise assessment metrics are shown in Table 3. The acoustic environment within the metro train driver’s cabin poses significant health risks to drivers. The equivalent continuous sound level (Leq) of 87.12 dB exceeds the WHO’s recommended threshold of 85 dB (as shown in Appendix A Table A2), above which prolonged exposure can result in hearing damage. Furthermore, the maximum recorded noise level (Lmax) of 101.11 dB indicates that drivers are subjected to intermittent peaks that can cause immediate discomfort and contribute to cumulative auditory stress. This noise exposure not only risks hearing loss but can also lead to increased stress levels, fatigue, and impaired concentration, adversely impacting the drivers’ performance and safety.
The minimum sound pressure level (Lmin) averages 29.54 dB, with a range from 0.00 dB to 78.78 dB, showing that the noise level can be extremely low during certain periods, possibly when the train is stationary or coasting at low speeds. Percentile noise levels (such as L10, L25, L50, L75, and L90) further reveal the distribution of noise over time. The L10 (96.72 dB) and L90 (74.97 dB) demonstrate that even during relatively quieter periods, the noise level remains within a high range, denoting the persistence of the noise environment. The dynamic range (LR) is 71.57 dB, which reflects a substantial difference between the maximum and minimum sound pressure levels and demonstrates considerable noise variability during train operation.
For frequency metrics, the main frequency (MF) averages 24.68 Hz, which suggests that low-frequency noise predominates in the driver’s cab. The total energy accumulation (TE) is 7,753,212 joules and reveals a high cumulative noise energy over the observation period. The frequency of specific sound pressure level events (NE70, NE75, NE80) shows frequent occurrences of noise events exceeding 70 dB, 75 dB, and 80 dB, respectively. The above results show that the noise levels are generally high and exhibit significant fluctuations; low-frequency noise predominates, and there are frequent occurrences of high-intensity noise events, potentially posing long-term health risks and operational safety concerns for the driver.

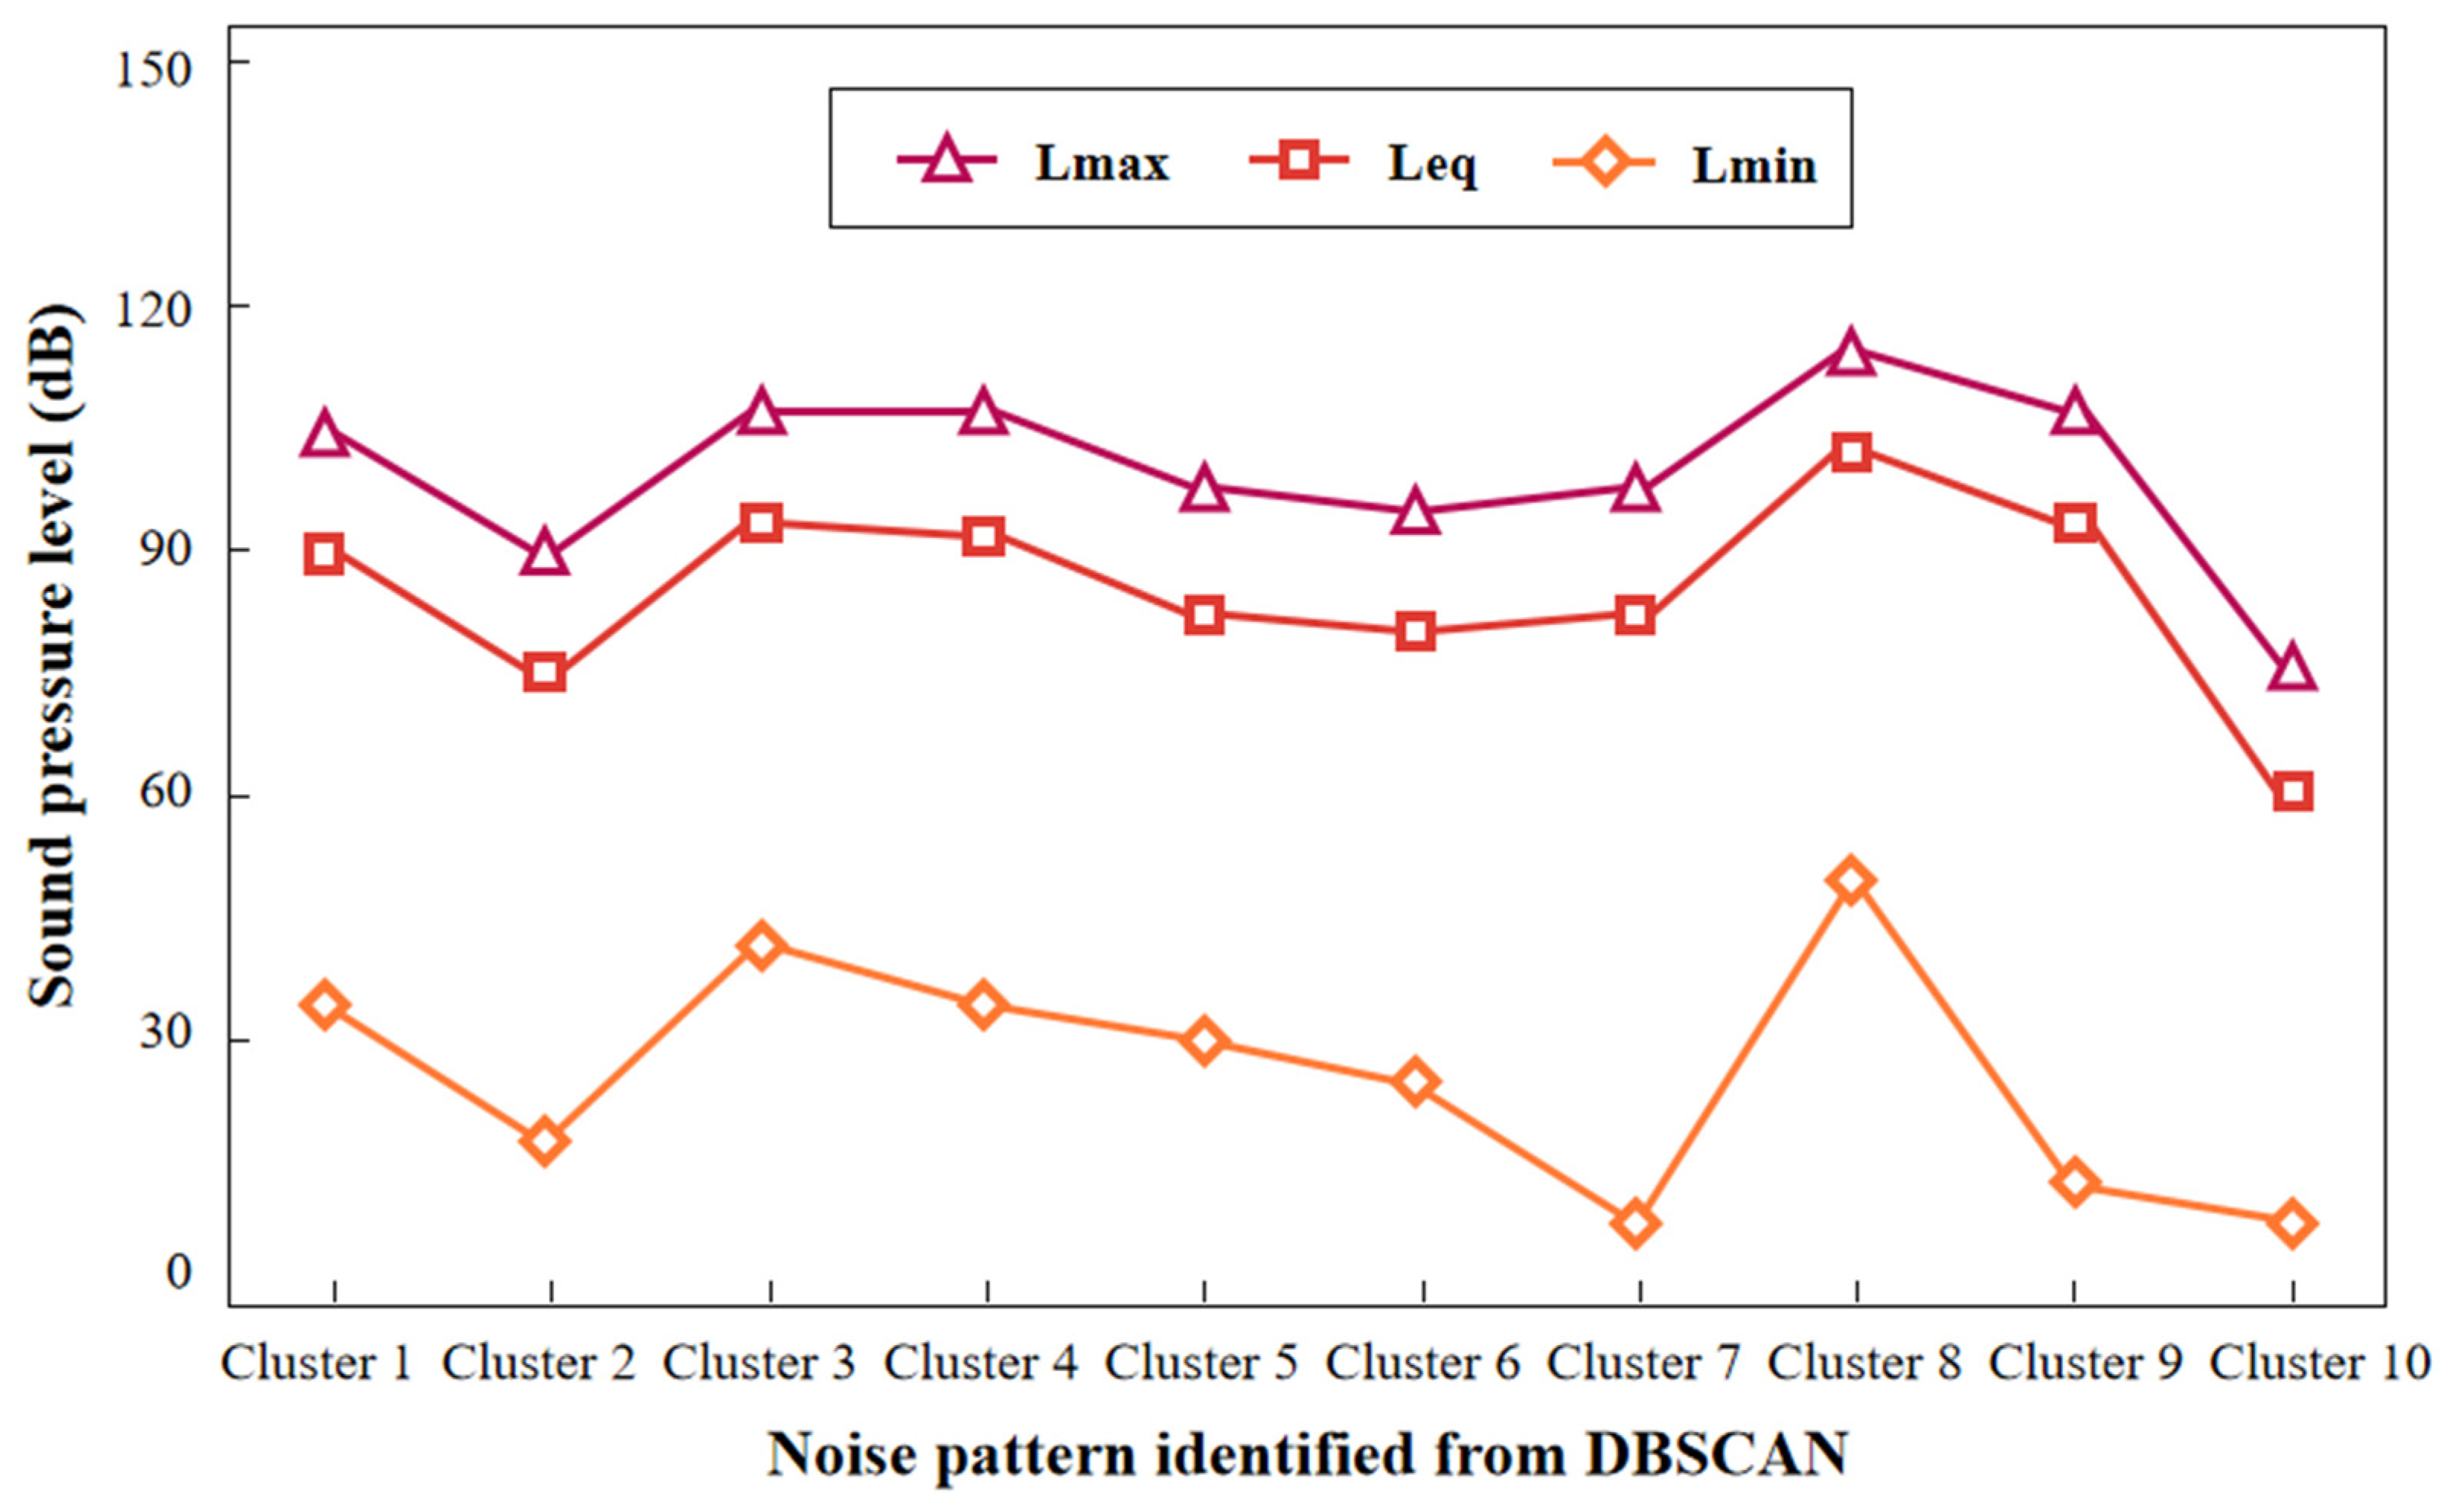
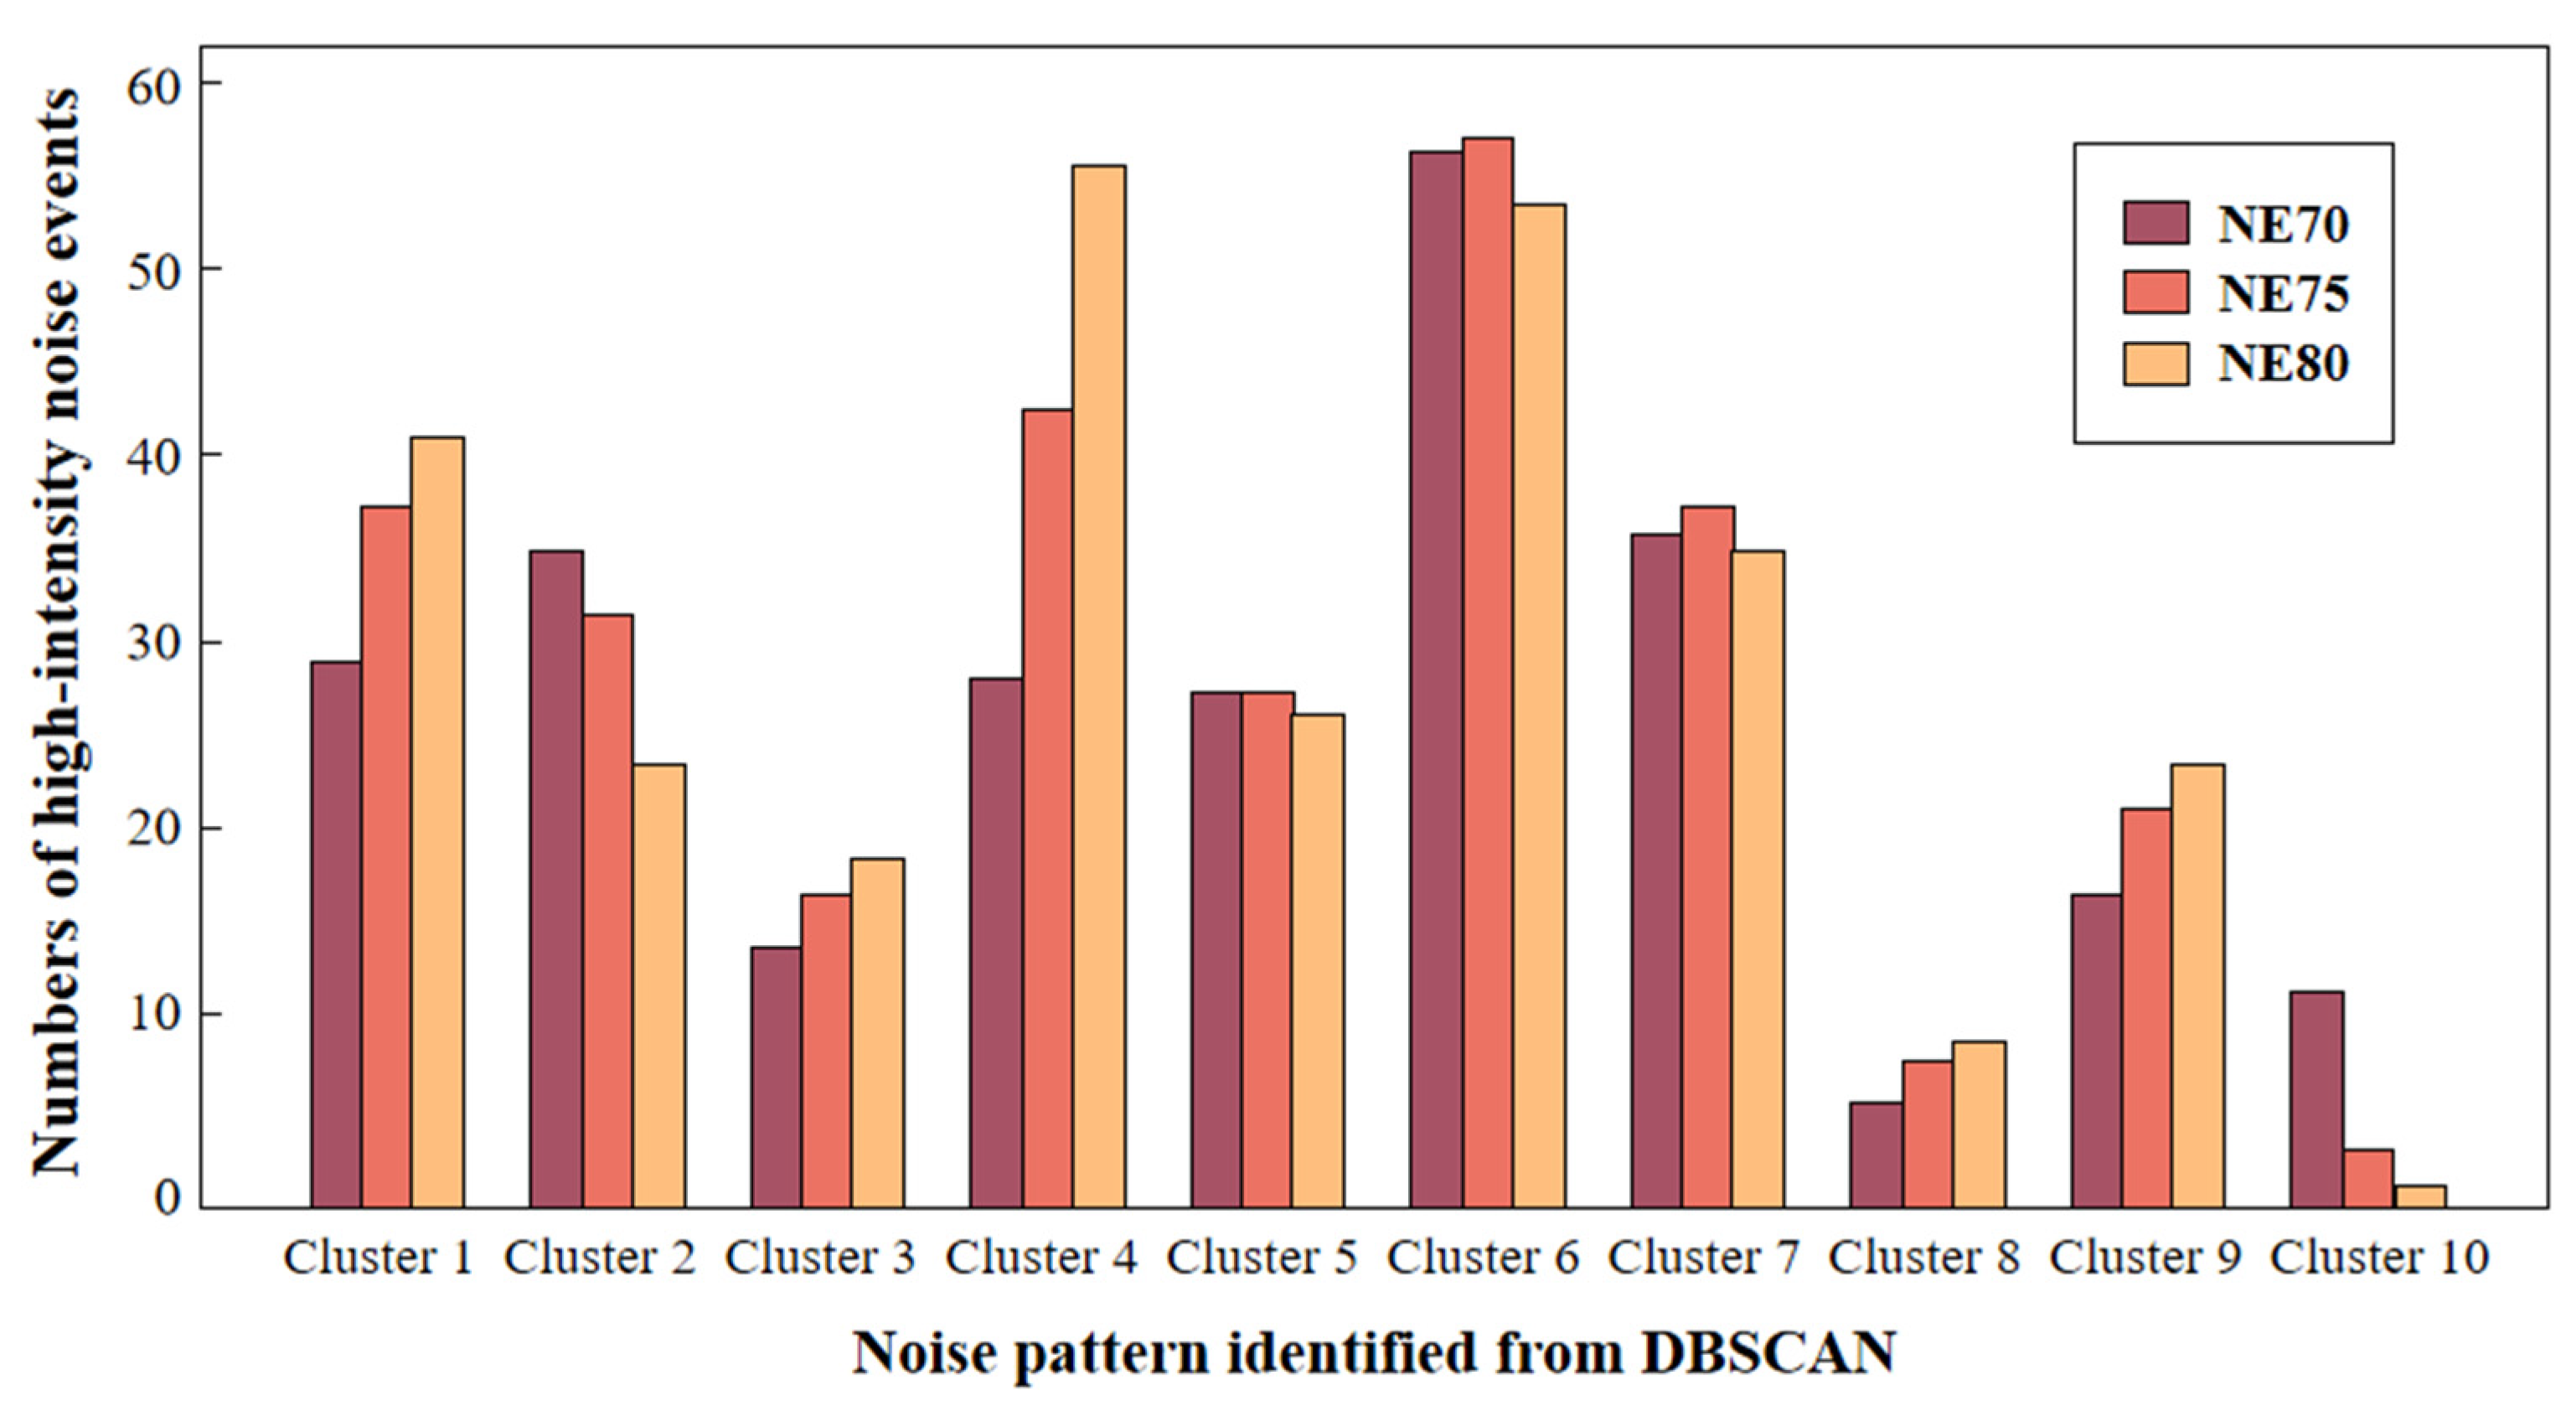
4.2. Noise Pattern Analysis

We utilized the DBSCAN algorithm to perform a clustering analysis on the noise assessment metrics of the driver’s cab of Lanzhou Urban Rail Transit Line 1. In total, we found 10 distinct types of noise, which can be approximately categorized into two major groups: high-intensity and low-intensity. The high-intensity noise clusters include Cluster 1, Cluster 3, Cluster 4, Cluster 8, and Cluster 9, all of which exhibit higher average sound pressure levels and could potentially harm the driver’s hearing. The average noise assessment metrics of different noise clusters are shown in Figure 6 and Figure 7 and Table 4.
Among the high-intensity noise clusters, Cluster 1 and Cluster 4 exhibit similar Leq values (90.12 dB and 91.87 dB) and significant fluctuations. Cluster 1’s main frequency component (MF) is 14.47 Hz, while Cluster 4’s MF is 69.70 Hz, indicating a distinct frequency divergence. This pattern suggests that the noise originates from mechanical operations and wheel–rail interactions, especially during acceleration and deceleration, as these processes are known to produce both low-frequency and high-frequency noise. The frequent high-frequency components and noise events (NE70, NE75, NE80) in Cluster 4 likely correlate with the operation of traction motors and braking systems, which are characteristic sources of high-frequency noise [50].
The characteristics of Cluster 3 and Cluster 8 indicate they likely originate from wind noise and track noise generated at high speeds. Cluster 3 has a Leq of 94.20 dB, a Lmax of 106.98 dB, and a main frequency component of 15.76 Hz, while Cluster 8 has a Leq of 101.92 dB, a Lmax of 114.07 dB, and a main frequency component of 18.78 Hz. The observed characteristics align with typical noise patterns from these sources, where aerodynamic and frictional forces at high speeds generate substantial noise levels within these frequency ranges [42].
The noise characteristics of Cluster 9 indicate an Leq of 93.75 dB, an Lmax of 107.73 dB, a dynamic range of 94.10 dB, a main frequency component of 17.89 Hz, and an energy accumulation of 8,900,800.27 joules. This type of noise is likely associated with the noise generated when the train passes through track crossings or switches since the complexity of track structures and the diverse operating conditions of trains in these areas may generate high-intensity and frequent low-frequency noise.
In contrast, the low-intensity noise clusters include Cluster 2, Cluster 5, Cluster 6, Cluster 7, and Cluster 10. These clusters exhibit comparatively lower average and maximum sound pressure levels, larger dynamic ranges, and lower energy accumulations. Cluster 2 has an Leq of 75.60 dB, with a dynamic range of 70.91 dB and a main frequency component of 17.60 Hz. It is primarily attributed to background noise generated by the air conditioning system or other electrical equipment within the train carriage [22]. These devices produce continuous but relatively low-frequency noise during operation, with significant fluctuations in noise intensity, reflecting the operational instability and complexity of the noise sources.
The noise in Cluster 5 and Cluster 7 might be categorized as the operational noise of the train at low speeds. Specifically, Cluster 5 has an Leq of 83.01 dB, a dynamic range of 65.99 dB, and a main frequency component of 17.18 Hz, while Cluster 7 has an Leq of 82.05 dB, a dynamic range of 87.82 dB, and a main frequency component of 20.13 Hz. These clusters exhibit fluctuations in Leq and relatively low intensity, consistent with the low-frequency echo characteristics produced by the tunnel reflection effect when the train is running at low speeds [33].
The above results indicate that the sources of noise in the driver’s cab are diverse and have substantial disparities in their impact on the acoustic environment, which provides a basis for developing tailored noise control strategies.

5. Discussion of the Noise Control Strategies

Derived from the clustering analysis of noise in the driver’s cabin of Line 1 of the Lanzhou Urban Rail Transit, the noise patterns can be categorized into four distinct types based on intensity and frequency, as illustrated in Figure 8. This section delineates targeted and practicable noise control strategies for each specific category to effectively address the noise issues in the driver’s cabin.
Low-frequency, high-intensity noise (Cluster 1 and Cluster 3) primarily originates from mechanical structure and wheel–rail contact, particularly during the train’s acceleration and deceleration phases. The friction between mechanical systems and the track generates high-intensity, low-frequency noise. To effectively address this issue, it is essential to apply advanced vibration dampers and elastic fasteners to diminish mechanical vibrations and friction noise, employ high-efficiency lubricants and technologies to minimize friction between mechanical components, and consistently maintain traction motors and braking systems to ensure their smooth operation. Specifically, the introduction of rail dampers and elastic fasteners across the track network can significantly reduce vibrations and noise, particularly in areas with frequent acceleration and deceleration. This involves installing dampers directly on the rails to absorb vibrational energy and reduce noise transmission. Optimizing train acceleration by improving traction motor control systems can also help minimize noise generation during these phases by ensuring smoother transitions and reducing mechanical stress on the components.
High-frequency and high-intensity noise (Cluster 4 and Cluster 8) primarily originates from wind noise and track noise generated during high-speed travel, while the aerodynamic effects and wheel-rail friction may also exacerbate it. The implementation of noise control measures such as optimizing train and track design, utilizing seamless rails, and incorporating vibration reduction technologies are essential to minimize track vibration and noise. The application of vibration-dampening and sound insulation techniques, such as elastic pads and sound-absorbing materials at track crossings and switches, can notably reduce noise propagation. Additionally, regular rail grinding practices are also essential to effectively reduce wheel–rail contact noise, as illustrated in Figure 9 and Figure 10. Regular rail grinding is important to maintain smooth wheel–rail contact surfaces, effectively reducing high-frequency noise caused by surface irregularities. This process involves precision grinding to remove surface irregularities and maintain a smooth rail profile, minimizing noise. Additionally, maintaining the quality of wheel treads is necessary, as it profoundly impacts wheel–rail noise, requiring regular inspections and resurfacing to ensure optimal contact surfaces.
Low-frequency and low-intensity noise (Cluster 5 and Cluster 7) primarily originates from the operational noise of the train at low speeds and the environmental noise encountered while passing through tunnels or over bridges. The tunnel reflection effect can produce noticeable low-frequency echoes, while the mitigation of these noises can be achieved by installing soundproof covers or panels on the air conditioning systems and electrical equipment within the train carriages. The adoption of low-noise designs for these systems and equipment, along with regular inspections and maintenance, can ensure their optimal operation and reduce noise generation. Additionally, the application of sound-absorbing materials such as acoustic panels and soundproof mats in tunnel and bridge areas can effectively reduce echoes and the reflection of environmental noise. Soundproofing the interior of the train carriages by installing acoustic panels and insulating materials can further reduce noise levels, especially when traversing enclosed spaces such as tunnels and bridges. Additionally, the application of sound-absorbing materials such as acoustic panels and soundproof mats in tunnel and bridge areas can effectively reduce echoes and the reflection of environmental noise.
To make a comprehensive noise control strategy, it is necessary to integrate advanced technological solutions with regular maintenance and operational optimization to address noise issues in the metro driver’s cabin effectively. Implementing state-of-the-art monitoring systems that utilize real-time data analytics can enhance the effectiveness of noise mitigation measures by adapting strategies based on current conditions. For example, employing deep learning algorithms to predict high-noise events can enable pre-emptive actions, such as adjusting train speeds or modifying track conditions, thereby reducing noise at its source. Regular maintenance and inspections are essential to ensure that all components function optimally, preventing noise escalation due to wear and tear. By focusing on technological advancements and continuous maintenance efforts, these measures not only improve the acoustic environment for drivers and passengers but also significantly protect the drivers’ health and enhance safety within urban rail systems.

6. Conclusions

Urban rail transit is an essential component for advancing sustainable urban transportation [51,52]. The implementation of proactive noise mitigation measures in urban rail transit is essential for ensuring operational safety and enhancing environmental sustainability [53,54,55]. In this study, we propose a systematic noise control framework for urban rail transit driver cabs, propose detailed noise evaluation metrics, identify the noise pattern based on the DBSCAN algorithm, infer the potential noise source, and recommend several noise control strategies tailored to the characteristics of different noise sources. The application value of this approach was validated through field experiments conducted in the driver’s cab of Lanzhou Urban Rail Transit Line 1.
The primary findings of this study include the following aspects: First, the equivalent continuous sound pressure level (Leq) in the cab of Lanzhou Urban Rail Transit Line 1 averages 87.12 dB with a standard deviation of 8.52 dB, which reveals a high noise in-tensity with substantial fluctuations, which pose a risk of hearing damage to the drivers. Second, we identified ten distinct noise patterns, which can be categorized into four main types: low-frequency high-intensity noise, high-frequency high-intensity noise, low-frequency low-intensity noise, and high-frequency low-intensity noise. The primary sources of these noise types are inferred to be the train’s mechanical system, wheel–rail contact, aerodynamic effects, and braking system, respectively. Third, we proposed comprehensive noise control strategies, including optimizing the train’s deceleration process, installing vibration dampers and elastic fasteners, regularly grinding the rails, and covering air conditioning and certain equipment with sound-absorbing materials.
This study also has several limitations. Specifically, the data primarily come from Lanzhou Urban Rail Transit Line 1, which may have regional limitations, as the noise characteristics and sources in urban rail transit systems of other cities are diverse. Therefore, future research should expand the dataset to contain more cities and multiple types of urban rail transit lines to validate the generalizability of the proposed noise control framework. Additionally, while the clustering methodology provides a simple and cost-effective means of identifying noise sources in the metro driver’s cabin, it has inherent limitations regarding the precision of noise source analysis. This approach relies on inferred associations between observed noise patterns and noise sources in literature, which may not capture all of the variability present in real-world conditions. For a more precise understanding of the contribution of various noise sources, installing sensors at different positions within the train body is necessary. Such an arrangement allows for detailed spatial analysis and accurate identification of specific noise sources, thereby enhancing the reliability of the noise assessment. Lastly, the noise control strategies in this study mainly focus on short-term effects and lack an assessment of long-term consequences. Future studies should investigate the long-term stability and adaptability of noise control measures, especially under different environmental conditions and operational states.

Author Contributions

Conceptualization, Z.S. and B.Y.; Methodology, C.Y.; Software, L.H.; Validation, Z.S. and B.Y.; Formal analysis, L.H.; Investigation, L.H.; Resources, Z.S.; Writing—original draft, B.Y.; Writing—review & editing, C.Y.; Visualization, Y.Z.; Project administration, B.Y.; Funding acquisition, Y.Z. All authors have read and agreed to the published version of the manuscript.

Funding

Dual-carbon Research Center of Hangzhou City University [Grant No.: 2023ST04].

Institutional Review Board Statement

Not applicable.

Informed Consent Statement

Not applicable.

Data Availability Statement

The data presented in this study are available on request from the corresponding author. The data are not publicly available to prevent the disclosure of metro operational information, thereby ensuring its operation security.

Conflicts of Interest

The authors declare no conflicts of interest.

Appendix A

Table A1. Equipment for noise measurement in the metro driver’s cabin. The sound measurement equipment used in this study includes the Sound Level Meter 2270-S, Microphone Brüel & Kjær 4189-A-021, and Acoustic Calibrator 4231, all manufactured by Brüel & Kjær in Nærum, Denmark. Additionally, the Cloud Intelligence Acquisition System INV3062A is produced by Beijing Leike Technology Co., Ltd. in Beijing, China.
EquipmentModel/TypeApplication and Specifications
Sound Level Meter2270-SThe 2270-S is a Type 1 dual-channel sound level meter that integrates the features of models 2250-S and 2250-W. It is capable of simultaneous measurements using two microphones, two accelerometers, or one of each, allowing for efficient data collection. This meter complies with ISO 7196:1995 and ANSI S1.42-2001 (R2011) standards for infrasonic measurements.
MicrophoneBruel & Kjaer 4189-A-021The Bruel & Kjaer 4189-A-021 is a high-sensitivity, precision free-field microphone designed for accurate sound measurements. It features a sensitivity of 50 mV/Pa, a frequency range of 6.3 Hz to 20 kHz, a dynamic range of 14.6 to 146 dB, and can operate in temperatures ranging from −30 to +150 °C (−22 to +302 °F).
Acoustic Calibrator4231The 4231 Acoustic Calibrator is a portable sound source used for calibrating sound level meters and other acoustic measurement instruments. It meets the specifications of EN/IEC 60942 Class LS and Class 1, as well as ANSI S1.40-1984, ensuring reliable and precise calibration.
Cloud Intelligence Acquisition SystemINV3062AThe INV3062A is a versatile cloud intelligence acquisition system that supports remote measurement and monitoring via LAN and internet connectivity. It allows for external USB connections and features GPS/Beidou and IEEE1588 synchronization.
Table A2. Sound pressure levels and their impacts on human health from WHO.
Sound Pressure (dB)Effects on Human Health
30Very quiet, suitable for restful sleep; little to no health impact.
40Quiet, comfortable sound level; no significant health effects.
50Moderate noise, suitable for a normal conversation; no health issues.
60Normal conversation level; prolonged exposure can be annoying.
70Above this level, prolonged exposure may cause stress and hearing discomfort.
80Long-term exposure can lead to increased risk of hearing damage and stress.
85Prolonged exposure without protection can cause hearing damage.
90Hearing protection recommended for prolonged exposure; risk of hearing loss.
100Hearing loss risk increases significantly without protection; uncomfortable.
110Regular exposure can lead to permanent hearing loss.
120Threshold of pain; immediate harm to hearing possible.

References

  1. Yu, C.; Deng, Y.; Qin, Z.; Yang, C.; Yuan, Q. Traffic volume and road network structure: Revealing transportation-related factors on PM2.5 concentrations. Transp. Res. Part D Transp. Environ. 2023, 124, 103935. [Google Scholar] [CrossRef]
  2. Yang, C.; Yu, C.; Dong, W.; Yuan, Q. Substitutes or complements? Examining effects of urban rail transit on bus ridership using longitudinal city-level data. Transp. Res. Part A Policy Pract. 2023, 174, 103728. [Google Scholar] [CrossRef]
  3. Burdzik, R.; Konieczny, Ł.; Figlus, T. Concept of On-Board Comfort Vibration Monitoring System for Vehicles. In Proceedings of the Activities of Transport Telematics, Katowice, Poland, 23–26 October 2013; Mikulski, J., Ed.; Springer: Berlin/Heidelberg, Germany, 2013; pp. 418–425. [Google Scholar]
  4. Figlus, T.; Gnap, J.; Skrúcaný, T.; Szafraniec, P. Analysis of the influence of different means of transport on the level of traffic noise. Sci. J. Silesian Univ. Technology. Ser. Transp. 2017, 97, 27–38. [Google Scholar]
  5. Zhu, Z.; Zhu, S.; Sun, L.; Mardan, A. Modelling changes in travel behaviour mechanisms through a high-order hidden Markov model. Transp. A Transp. Sci. 2022, 20, 2130731. [Google Scholar] [CrossRef]
  6. Wang, A.L.; Bista, S.; Can, A.; Chaix, B. Personal noise exposure during daily commutes and subjectively reported stress: A trip stage level analysis of MobiliSense data. J. Transp. Health 2023, 30, 11. [Google Scholar] [CrossRef]
  7. Yan, L.; Chen, Z.; Zou, Y.F.; He, X.H.; Cai, C.Z.; Yu, K.H.; Zhu, X.J. Field Study of the Interior Noise and Vibration of a Metro Vehicle Running on a Viaduct: A Case Study in Guangzhou. Int. J. Environ. Res. Public Health 2020, 17, 2807. [Google Scholar] [CrossRef] [PubMed]
  8. Li, H.; Thompson, D.; Squicciarini, G.; Liu, X.W.; Rissmann, M.; Bouvet, P.; Denia, F.D.; Baeza, L.; Jarillo, J.M.; García-Loygorri, J.M. A framework to predict the airborne noise inside railway vehicles with application to rolling noise. Appl. Acoust. 2021, 179, 108064. [Google Scholar] [CrossRef]
  9. Kowalczyk, K.; Opala, M. Commuter Experience: An Assessment of Metro-Train Comfort Amidst Operational Vibroacoustic Conditions. Appl. Sci. 2024, 14, 6137. [Google Scholar] [CrossRef]
  10. Peng, H.; Yao, Y.; Cai, X.; Zhong, Y.; Sun, T. Field Measurement Analysis and Control Measures Evaluation of Metro Vehicle Noise Caused by Rail Corrugation. Appl. Sci. 2021, 11, 11190. [Google Scholar] [CrossRef]
  11. Yu, B.; Chai, Y.; Wang, C. Effect of the Exterior Traffic Noises on the Sound Environment Evaluation in Office Spaces with Different Interior Noise Conditions. Appl. Sci. 2024, 14, 3017. [Google Scholar] [CrossRef]
  12. Golmohammadi, R.; Darvishi, E.; Faradmal, J.; Poorolajal, J.; Aliabadi, M. Attention and short-term memory during occupational noise exposure considering task difficulty. Appl. Acoust. 2020, 158, 9. [Google Scholar] [CrossRef]
  13. Liu, X.L.; Han, J.; Liu, M.K.; Wang, J.N.; Xiao, X.B.A.; Wen, Z.F. Rail Roughness Acceptance Criterion Based on Metro Interior Noise. Chin. J. Mech. Eng. 2022, 35, 12. [Google Scholar] [CrossRef]
  14. Lázaro, J.; Costa, P.A.; Godinho, L. Experimental Light Rail Traffic Noise Assessment in a Metropolitan Area. Appl. Sci. 2024, 14, 969. [Google Scholar] [CrossRef]
  15. Cao, X.; Yang, L.; Li, P.; Xu, J.; Zhang, X. Influence of Fastener Stiffness and Damping on Vibration Transfer Characteristics of Urban Railway Bridge Lines Using Vibration Power Flow Method. Appl. Sci. 2023, 13, 12543. [Google Scholar] [CrossRef]
  16. Garg, N.; Sharma, O.; Maji, S. Noise impact assessment of mass rapid transit systems in Delhi city. Indian J. Pure Appl. Phys. 2011, 49, 257–262. [Google Scholar]
  17. Tao, Z.Y.; Wang, Y.M.; Zou, C.; Li, Q.; Luo, Y. Assessment of ventilation noise impact from metro depot with over-track platform structure on workers and nearby inhabitants. Environ. Sci. Pollut. Res. 2019, 26, 9203–9218. [Google Scholar] [CrossRef]
  18. Zou, C.; Wang, Y.M.; Wang, P.; Guo, J.X. Measurement of ground and nearby building vibration and noise induced by trains in a metro depot. Sci. Total Environ. 2015, 536, 761–773. [Google Scholar] [CrossRef] [PubMed]
  19. Hsu, W. Structure-borne noise of steel and concrete box girders in an urban metro system: A hybrid evaluation and parametric study. J. Low Freq. Noise Vib. Act. Control 2023, 42, 1560–1577. [Google Scholar] [CrossRef]
  20. Zhang, Y.F.; Li, L.; Li, H.X. Interior Noise Prediction of Metro Train in a Tunnel Caused by Wheel/Rail Rolling. Acoust. Aust. 2024, 52, 161–173. [Google Scholar] [CrossRef]
  21. Zhao, C.Y.; Ping, W. Minimizing noise from metro viaduct railway lines by means of elastic mats and fully closed noise barriers. Proc. Inst. Mech. Eng. Part F J. Rail Rapid Transit 2018, 232, 1828–1836. [Google Scholar] [CrossRef]
  22. Liu, X.B.; Jiang, Z.C.; Wang, X.F.; Li, D.K. Noise distribution law of air-conditioning ducts for metro vehicles. Noise Control Eng. J. 2020, 70, 376–383. [Google Scholar]
  23. Li, X.M.; Chen, Y.K.; Zou, C.; Wang, H.; Zheng, B.K.; Chen, J.L. Building structure-borne noise measurements and estimation due to train operations in tunnel. Sci. Total Environ. 2024, 926, 16. [Google Scholar] [CrossRef]
  24. Han, J.; Xiao, X.B.; Wu, Y.; Wen, Z.F.; Zhao, G.T. Effect of rail corrugation on metro interior noise and its control. Appl. Acoust. 2018, 130, 63–70. [Google Scholar] [CrossRef]
  25. Wang, Q.C.; Hongwei, W.; Yang, C.X.; Zhang, G.Y. Developing multivariate models for predicting the levels of multi- dimensional critical perceptions due to metro noise inside buildings. Appl. Acoust. 2022, 200, 14. [Google Scholar] [CrossRef]
  26. Zhang, Y.F.; Li, L.; Zhu, Q. Structure-borne Noise Differences of Metro Vehicle Running on Different Tracks. KSCE J. Civ. Eng. 2023, 27, 3861–3871. [Google Scholar] [CrossRef]
  27. Song, X.; Yin, L.; Xiong, W.; Wu, H.; Cai, C.S.; Li, X. Underwater noise prediction and control of a cross-river subway tunnel: An experimental and numerical study. Int. J. Environ. Sci. Technol. 2024, 21, 4045–4062. [Google Scholar] [CrossRef]
  28. Zhu, W.Z.; Shi, S.G.; Luo, L.; Sun, J.W. A novel adaptive state detector-based post-filtering active control algorithm for Gaussian noise environment with impulsive interference. Appl. Sci. 2019, 9, 1176. [Google Scholar] [CrossRef]
  29. Zhang, L.B.; Kang, J.; Luo, H.B.; Zhong, B.T. Drivers’ physiological response and emotional evaluation in the noisy environment of the control cabin of a shield tunneling machine. Appl. Acoust. 2018, 138, 1–8. [Google Scholar] [CrossRef]
  30. Bal Kocyigit, F.; Kocyigit, A. Sound control in mass transit stations: With case study from Central Anatolia. J. Acoust. Soc. Am. 2010, 128 (Suppl. S4), 2296. [Google Scholar] [CrossRef]
  31. Laffitte, P.; Sodoyer, D.; Tatkeu, C.; Girin, L. Deep neural networks for automatic detection of screams and shouted speech in subway trains. In Proceedings of the 2016 IEEE International Conference on Acoustics, Speech and Signal Processing (ICASSP), Shanghai, China, 20–25 March 2016; pp. 6460–6464. [Google Scholar]
  32. Ghotbi, M.R.; Monazzam, M.R.; Baneshi, M.R.; Asadi, M.; Fard, S.M.B. Noise pollution survey of a two-storey intersection station in Tehran metropolitan subway system. Environ. Monit. Assess. 2012, 184, 1097–1106. [Google Scholar] [CrossRef]
  33. Yao, C.M.K.L.; Ma, A.K.; Cushing, S.L.; Lin, V.Y.W. Noise exposure while commuting in Toronto—A study of personal and public transportation in Toronto. J. Otolaryngol. Head Neck Surg. 2017, 46, 62. [Google Scholar] [CrossRef]
  34. Jiang, S.; Zou, Y.F.; He, X.H.; Cai, C.Z.; Zhai, L.H.; Nong, X.Z. Wind Tunnel Study on Aerodynamic Characteristics of the Train on Viaducts with a New Type of Wind-Noise Barrier under Cross Wind. Int. J. Struct. Stab. Dyn. 2022, 22, 23. [Google Scholar] [CrossRef]
  35. Lee, D.; Kim, G.; Han, W. Analysis of Subway Interior Noise at Peak Commuter Time. J. Audiol. Otol. 2017, 21, 61–65. [Google Scholar] [CrossRef]
  36. He, X.H.; Yu, K.H.; Cai, C.Z.; Zou, Y.F. Dynamic Responses of the Metro Train’s Bogie Frames: Field Tests and Data Analysis. Shock Vib. 2020, 2020, 10. [Google Scholar] [CrossRef]
  37. Aly, M.E. Noise assessment inside the second-line of the Greater Cairo Underground Metro. Sadhana-Acad. Proc. Eng. Sci. 2005, 30, 47–55. [Google Scholar] [CrossRef]
  38. Bhattacharya, S.K.; Bandyopadhyay, P.; Kashyap, S.K. Calcutta metro: Is it safe from noise pollution hazards? Ind. Health 1996, 34, 45–50. [Google Scholar] [CrossRef]
  39. Li, X.M.; Hu, Z.H.; Zou, C. Noise annoyance and vibration perception assessment on passengers during train operation in Guangzhou Metro. Environ. Sci. Pollut. Res. 2022, 29, 4246–4259. [Google Scholar] [CrossRef]
  40. Wang, Q.C.; Wang, H.W.; Cai, J.L.; Zhang, L. The multi-dimensional perceptions of office staff and non-office staff about metro noise in commercial spaces. Acta Acust. 2022, 6, 14. [Google Scholar] [CrossRef]
  41. Ma, M.; Li, M.H.; Qu, X.Y.; Zhang, H.G. Effect of passing metro trains on uncertainty of vibration source intensity: Monitoring tests. Measurement 2022, 193, 19. [Google Scholar] [CrossRef]
  42. Wang, J.P.; Ren, C.L.; Liu, Z.; Mao, M.Y. Research on Direct Drive Technology of the Permanent Magnet Synchronous Motor for Urban Rail Vehicles. Math. Probl. Eng. 2022, 2022, 13. [Google Scholar] [CrossRef]
  43. Tao, Y.H.; Chai, Y.W.; Kou, L.R.; Kwan, M.P. Understanding noise exposure, noise annoyance, and psychological stress: Incorporating individual mobility and the temporality of the exposure-effect relationship. Appl. Geogr. 2020, 125, 14. [Google Scholar] [CrossRef]
  44. Vogiatzis, K.; Vanhonacker, P. Noise reduction in urban LRT networks by combining track based solutions. Sci. Total Environ. 2016, 568, 1344–1354. [Google Scholar] [CrossRef] [PubMed]
  45. He, L.; Feng, B. Fundamentals of Measurement and Signal Analysis; Springer: Berlin/Heidelberg, Germany, 2022. [Google Scholar] [CrossRef]
  46. Tuzlukov, V. Signal Processing Noise; CRC Press: Boca Raton, FL, USA, 2018. [Google Scholar]
  47. Fahy, F.; Walker, J. Advanced Applications in Acoustics, Noise and Vibration; CRC Press: Boca Raton, FL, USA, 2018. [Google Scholar]
  48. Havelock, D.I.; Kuwano, S.; Vorländer, M. Handbook of Signal Processing in Acoustics; Springer: Berlin/Heidelberg, Germany, 2008; Volume 1. [Google Scholar]
  49. Amami, R.; Smiti, A. An incremental method combining density clustering and support vector machines for voice pathology detection. Comput. Electr. Eng. 2017, 57, 257–265. [Google Scholar] [CrossRef]
  50. Kim, S.K. Improvements for reduction of the brake squeal noise at Seoul metro rolling stock on tracks. J. Mech. Sci. Technol. 2009, 23, 2206–2214. [Google Scholar] [CrossRef]
  51. Yu, C.; Qin, Z.; Lu, Y.; Lin, H.; Yang, C.; Yuan, Q.; Wu, Q. Integrated strategies for road transportation-related multi-pollutant control: A cross-departmental policy mix. Transp. Res. Part D Transp. Environ. 2024, 132, 104257. [Google Scholar] [CrossRef]
  52. Yu, C.; Lin, H.; Chen, Y.; Yang, C.; Yin, A.; Yuan, Q. Creating most needed customized bus services: A collaborative analysis of user-route dynamics. Transp. Res. Part D Transp. Environ. 2024, 133, 104312. [Google Scholar] [CrossRef]
  53. Shi, Z.; Xu, M.; Song, Y.; Zhu, Z. Multi-Platform dynamic game and operation of hybrid Bike-Sharing systems based on reinforcement learning. Transp. Res. Part E Logist. Transp. Rev. 2024, 181, 103374. [Google Scholar] [CrossRef]
  54. Song, Y.; Luo, K.; Shi, Z.; Zhang, L.; Shen, Y. Nonlinear Influence and Interaction Effect on the Imbalance of Metro-Oriented Dockless Bike-Sharing System. Sustainability 2024, 16, 349. [Google Scholar]
  55. Song, Y.; Zhang, L.; Luo, K.; Wang, C.; Yu, C.; Shen, Y.; Yu, Q. Self-loop analysis based on dockless bike-sharing system via bike mobility chain: Empirical evidence from Shanghai. Transportation 2024. [Google Scholar] [CrossRef]
Figure 1. The proposed research framework for urban rail transit noise control from assessment to pattern identification and customized noise control strategy.
Applsci 14 07388 g001
Figure 2. Noise collection equipment: (a) sound level meter; (b) free-field microphone; (c) acoustic calibrator.
Applsci 14 07388 g002
Figure 3. Position of noise collection equipment: (a) floor plan; (b) actual position.
Applsci 14 07388 g003
Figure 4. The noise signal before and after filtering. (a) Noise signal before filtering. (b) Noise signal after filtering. Region 1 represents background noise before filtering, region 2 represents squeal before filtering, region 3 represents background noise after filtering, and region 4 represents squeal after filtering.
Applsci 14 07388 g004
Figure 5. Hourly average sound pressure level (dB).
Applsci 14 07388 g005
Figure 6. Leq, Lmin, Lmax metrics of different noise clusters.
Applsci 14 07388 g006
Figure 7. NE70, NE75, and NE80 metrics of different noise clusters.
Applsci 14 07388 g007
Figure 8. Noise control strategies for different intensity and frequency categories.
Applsci 14 07388 g008
Figure 9. Rail grinding operations on Lanzhou Urban Rail Transit Line 1.
Applsci 14 07388 g009
Figure 10. Comparison of rail grinding effects. (a) Before grinding; (b) after grinding.
Applsci 14 07388 g010
Table 1. Overview of metro noise research and mitigation strategies.
ResearchTargetEmpirical CaseConclusions
(Mitigation Measures)
Zhao et al., (2018) [21]Minimizing noise from urban rail transit viaduct railway lines using elastic mats and noise barriersHangzhou Urban Rail Transit Line 1Elastic mats reduce bridge-borne noise; fully enclosed barriers control wheel–rail noise
Liu et al., (2020) [22]Noise distribution in air-conditioning ducts for urban rail transit vehiclesAir-conditioning ducts in urban rail transit vehiclesThe exponential increase inside hole area ensures uniform air supply; focus on the front end for noise control
Wang et al., (2022) [25]Direct drive technology for permanent magnet synchronous motors in urban rail vehiclesSuzhou Urban Rail Transit Line 3Hollow shaft structure reduces vibration and noise; optimized mass distribution improves performance
Zhang et al., (2023) [26]Structure-borne noise differences of urban rail transit vehicles on various tracksField measurements and numerical simulationFloating-slab track increases noise; recommendations include track condition monitoring and design adjustments
Zhang et al., (2024) [20]Low-frequency noise inside urban rail transit: contribution analysis and noise controlUrban rail transit vehicle interiorIdentifying essential elements contributing to low-frequency noise; damping optimization reduces noise peaks
Hsu, (2023) [19]Structure-borne noise in steel and concrete box girders in urban rail transit systemsUrban rail transit systemsPre-stressed concrete box girders are recommended for lower noise levels; optimize track conditions and train speed
Song et al., (2024) [27]Underwater noise prediction and control for a cross-river urban rail transit tunnelNanjing Urban Rail Transit Line 10Lower stiffness rail fasteners reduce underwater noise, mitigating impact on aquatic species
Tao et al., (2019) [17]Ventilation noise impact from urban rail transit depot with over-track platform structureGuangzhou Urban Rail Transit Line 6Noise control measures for ventilation systems; traditional methods insufficient for low-frequency noise
Liu et al., (2022) [13]Rail roughness acceptance criterion based on urban rail transit interior noiseUrban rail transit interior noise analysisRail roughness control limits based on interior noise; combined test and simulation method used
Zhu et al., (2019) [28]Adaptive state detector-based active control algorithm for Gaussian noise with impulsive interferenceUrban rail transit air-conditioner systemsThe new algorithm enhances noise control performance; effective for varying impulsive noise
Peng et al., (2021) [10]Analysis and evaluation of urban rail transit vehicle noise caused by rail corrugationUrban rail transit vehicle interior noiseRail grinding and increasing track stiffness reduce interior noise significantly
Zhang et al., (2018) [29]Drivers’ physiological and emotional responses to noisy environments in shield tunneling machine cabinsUrban rail transit systemsAddressing driver stress and emotional impact due to noise; recommendations for noise reduction measures
Han et al., (2018) [24]Impact of rail corrugation on urban rail transit interior noise and its mitigationUrban rail transit trains in tunnelsRail grinding standards based on interior noise limits; addressing short-wavelength corrugations
Zhang et al., (2024) [20]Prediction of interior noise in urban rail transit trains due to wheel/rail rolling in tunnelsUrban rail transit trains in tunnelsSEA model predicts interior noise; noise control treatment on tunnel walls reduces interior noise
Kocyigit et al., (2010) [30]Sound control in mass transit stationsAnkara Metro System The use of sound-absorbing materials on ceilings and sidewalls is confirmed as important for metro noise control
Laffitte et al., (2016) [31]Automatic detection of screams and shouts in subway trainsParis Metro, FranceRecommend to implement real-time audio monitoring systems that use deep neural networks to detect abnormal sounds such as screams and shouts
Ghotbi et al., (2012) [32]Noise pollution in Tehran metro stationImam Khomeini Station, TehranNoise levels ranged from 68.35 to 79.54 dB(A), exceeding limits; recommended improved design and materials to reduce noise exposure
Yao et al., (2017) [33]Noise exposure in urban transportationToronto Mass Transit systemMean average noise levels are within safe limits, but peak noise exposures, especially on public transit routes, pose a risk for noise-induced hearing loss
This studyNoise assessment and mitigation in driver cabUrban rail transit systemsTailored strategies such as optimizing the train’s deceleration process, installing vibration dampers and elastic fasteners, regularly grinding the rails, and covering air conditioning and certain equipment with sound-absorbing materials are effective
Table 2. The noise assessment metrics.
MetricDescription
LeqAverage sound pressure level over a specific period
LmaxMaximum sound pressure level over a specific period
LminMinimum sound pressure level over a specific period
L10Sound pressure level exceeded 10% of the time
L25Sound pressure level exceeded 25% of the time
L50Sound pressure level exceeded 50% of the time
L75Sound pressure level exceeded 75% of the time
L90Sound pressure level exceeded 90% of the time
LRDifference between the maximum (Lmax)
and minimum (Lmin) sound pressure levels
MFDominant frequency component over a specific period
TEThe total energy of the signal over a specific period
NE70Number of events exceeding a specific sound level (70 dB)
NE75Number of events exceeding a specific sound level (75 dB)
NE80Number of events exceeding a specific sound level (80 dB)
Table 3. The estimation results of noise assessment metrics.
MetricMeanStdMaxMin
Leq87.128.52117.3353.43
Lmax101.118.15132.0567.98
Lmin29.5414.2178.780.00
L1096.728.39126.0563.01
L2593.718.41124.2459.83
L5089.198.51119.7455.34
L7582.878.71115.7648.73
L9074.978.95110.1440.68
LR71.5711.88124.8736.32
MF24.6820.26100.0010.00
TE7,753,212.221,480,296.5313,831,022.732,948,416.30
NE7027.7615.8197.000.00
NE7530.7216.4399.000.00
NE8030.9717.90109.000.00
Table 4. L10, LR, MF, and TE metrics of different noise clusters.
ClusterL10LRMFTENoise Type
1100.0469.9814.478,219,631.64Wheel–rail noise during acceleration
285.3970.9117.605,813,206.67Air conditioning system noise
3103.3965.3115.768,963,234.54Wind noise and track noise
4101.5071.5669.708,539,070.76Braking system noise
592.6165.9917.186,983,686.88Train noise at low speeds
690.5770.1434.106,637,823.11Mechanical noise
791.9887.8220.136,837,665.92Train noise at low speeds
8110.7465.3818.7810,475,325.30Wind noise and track noise
9103.6894.1017.898,900,800.27Railway track crossing noise
1071.0067.5019.333,859,957.45Other noise
Disclaimer/Publisher’s Note: The statements, opinions and data contained in all publications are solely those of the individual author(s) and contributor(s) and not of MDPI and/or the editor(s). MDPI and/or the editor(s) disclaim responsibility for any injury to people or property resulting from any ideas, methods, instructions or products referred to in the content.

