Article

Novel Gas Supply System for Multi-Chamber Tri-Gas Cell Culture: Low Gas Consumption and Wide Concentration Range

1
Suzhou Institute of Biomedical Engineering and Technology, Chinese Academy of Sciences, Suzhou 215163, China
2
School of Biomedical Engineering (Suzhou), University of Science and Technology of China, Hefei 230026, China
3
Jinan Guokeyigong Science and Technology Development Company Ltd., Jinan 250103, China
*
Authors to whom correspondence should be addressed.
Appl. Sci. 2024, 14(16), 7411; https://doi.org/10.3390/app14167411 (registering DOI)
Submission received: 22 July 2024 / Revised: 16 August 2024 / Accepted: 19 August 2024 / Published: 22 August 2024

Abstract

:
Gas plays a crucial role in cell culture as cells require a specific gas environment to maintain their growth, reproduction, and function. Here, we propose a gas supply system for tri-gas multi-channel cell incubators to meet the specific needs of various cells. The system utilizes a circulating gas supply method powered by air pumps for each chamber. Gas inflow from the cylinder is independently controlled by Mass Flow Controllers (MFCs), and a quantitative step-by-step adjustment control strategy is employed to calculate the volume of different gases being introduced. Through mixing simulations and experiments, we identified the SV static mixer with an L/D ratio of 2.5 as the optimal choice. To evaluate the concentration accuracy and gas consumption of the gas system, we conduct gas mixing and distribution experiments under different conditions. The results show that the system could achieve a concentration range of 0–100% for O2 with an accuracy of ±0.5%, and a concentration range of 0–10% for CO2 with an accuracy of ±0.1%. The daily gas consumption during cultivation is 3570 mL of N2, 330 mL of CO2, and 115 mL of O2, significantly lower than conventional incubators. Overall, our system can effectively manage dynamic gas concentration changes, particularly in high O2 concentration environments. It offers advantages such as low gas consumption, a wide concentration range, and high accuracy compared to existing incubators.

1. Introduction

Mixed gas is one of the essential conditions for the development of mammalian cells in vitro, and, normally, the main components of the mixed gas are oxygen (O2), carbon dioxide gas (CO2), and nitrogen (N2). CO2 plays a key role in regulating and maintaining the pH of the culture medium within the optimal range of 7.2–7.4 [1,2]. Generally, the standard concentration of CO2 in mixed gas is 5%. However, different cells have varying demands for oxygen at different stages of development [3,4]. For instance, embryos grow best under 6% O2 before the early blastocyst stage but require over 20% O2 after the gastrula stage [5,6]. Oxygen availability also influences organogenesis and tissue development [7,8]. The early development of organoids often relies on physiological hypoxia, while in later phases of growth, a sufficient supply of oxygen is required to support proliferation, final differentiation, and maturation [9,10]. Therefore, it is of great significance to support wide-range oxygen concentration regulation for an excellent cell culture system.
In cell laboratories, two types of incubators are commonly used for cell culture: CO2 incubators and tri-gas incubators. CO2 incubators utilize CO2 as the sole gas source, while tri-gas incubators use a combination of CO2, O2, and N2. CO2 incubators typically allow for adjusting the CO2 concentration from 0–20%, regardless of the O2 level, suitable for general cell culture requirements. On the other hand, tri-gas incubators offer the flexibility to adjust both CO2 and O2 concentrations, ranging from 0 to 20% and 0 to 90%, respectively, catering to the needs of hypoxia and hyperoxia cell culture. Both types of incubators have an internal volume of approximately 180 L, resulting in a gas concentration recovery time of over 60 min after opening and closing the door, leading to gas environment disruption and high gas consumption [11].
In recent years, with the increasing requirements for specialization and customization in cell culture, multi-channel incubators have become more and more popular [12,13,14]. These incubators can consist of either single or multiple small culture chambers, offering superior temperature and gas control capabilities due to the smaller interior volume of each chamber. To maintain the internal gas environment of the chamber, a small flow of gas is usually used for continuous gas supply. One common approach involves releasing mixed gas into the chamber and then venting it into the atmosphere, such as Genea Biomedex Geri [15]. As a result, this method results in significant gas consumption over time. A more efficient alternative is to circulate the gas within the system for reuse, such as ESCO medical Miri TL [16]. Although the circulation method can reduce gas consumption, it imposes higher demands on gas control and still represents relatively high levels.
To establish an ideal gas environment to meet the hypoxia and hyperoxia requirements of cell culture, we propose a tri-gas supply system and method for the multi-channel incubator. The system allows for gas circulation inside to supply gas to multiple chambers simultaneously and achieves control of gas concentration through a quantitative step-by-step adjustment strategy. This method enables the system to achieve a wide range of gas concentrations with low gas consumption while maintaining high control accuracy. Consequently, we offer an exceptional gas system for cell culture that can accommodate nearly all applications.

2. Materials and Methods

2.1. Gas Mixing and Distribution System

The proposed gas supply system is shown in Figure 1. Three Mass Flow Controllers (MFCs) are used to accurately regulate the flow rate and volume of N2, O2, and CO2 from the high-pressure cylinders to the gas mixer [17,18]. The gas mixer facilitates the mixing of gases within the system. Each individual chamber in the system is connected to a micro pump and a check valve. These pumps circulate gas from the mixer to the culture chambers and back, creating a closed-loop gas supply system. The check valve prevents air from entering the system when a chamber lid is opened. The state of each chamber lid (open or closed) can be identified by a switch sensor. The pump is automatically deactivated when the chamber lid is open and only operates when the chamber lid is closed. The gas sensor is positioned downstream of the gas mixer and upstream of the chambers, along the flow direction, to measure the gas concentrations (volume fraction). Additionally, a solenoid valve, which is a three-way valve, is positioned between the gas sensor and the culture chambers. It can be controlled to switch between two positions: either to the atmosphere or the system.
The proposed system calculates the required volume of various gases using real-time gas concentrations obtained from gas sensors. It then accurately regulates the gas volume entering the system from the gas cylinder through MFC. Mixing and distribution processes are subsequently conducted within the system. By employing automatic control and adjustment mechanisms, the gas concentration within the system can be maintained within the acceptable error range of the desired value. In summary, to enhance mixing efficiency and accuracy, the system raises two main concerns: determining the optimal mixing parameters and calculating the inflow volume of N2, O2, and CO2.

2.2. Numerical Simulation for Mixers

As a key component of the gas system, the mixer plays an important role in enhancing gas mixing efficiency and the concentration uniformity of the output gas [19,20,21,22]. Here, a static mixer is utilized instead of a dynamic one. The static mixer has no moving parts and can realize movements such as diversion, confluence, and rotation to achieve effective dispersion and thorough mixing of different fluids by its mixing unit assembled in the pipe. Static mixers can be categorized into various types based on the structure of the mixing units [23]. Among them, the SV mixer is particularly suitable for gas mixing. Hence, the SV mixer is chosen for use in this study.
The static mixer consists of a closed thin-walled cylindrical tube filled with SV mixing units. The length–diameter ratio (L/D) is a crucial parameter for the design and selection of the mixing chamber in addition to internal volume. To investigate the optimal L/D of the mixer for the gas system, three mixer structures with L/D ratios of 0.75, 2.5, and 6 are developed, all with an internal volume of 800 mL, as shown in Figure 2. In each mixer, the thickness of the spoiler elements is 1 mm, and three groups of SV units are arranged along the length at a dislocation angle of 60°. To compare the mixing efficiency of mixers with different L/D ratios, a binary gas mixing simulation is employed as a research model to simplify numerical analysis and reduce computational load. Each mixer includes two gas inlets and one gas outlet.
The mixer structure model is created using 3D software (UG NX 10.0) and then imported into the COMSOL multi-physics software (v.6.1) for simulating gas mixing. The simulation is conducted in coupled physical fields involving single-phase fluid—turbulent flow and chemical species transport—concentrated species transport. The mesh is automatically generated with tetrahedral elements and a general element size. The Realizable k-ε model is selected in the turbulence flow physics field with default parameters [24]. The inlet flow rate is set at 2 L/min and the outlet pressure at 0 kPa. The Maxwell–Stefan model is used for the diffusion model in the concentrated species transport physics field [25], with a mass diffusion coefficient of 1 × 10⁻⁵ (m2/s). The initial gas mass fraction at the two inlets is set to 100% and 0, respectively. The properties of the gas under study are based on air properties, selected directly from the system material library.

2.3. Calculation Method of Inflow Volume

The theoretical inflow volume of N2, O2, and CO2 passing through the MFC can be derived using the following method. For a single gas in the circulation part, the calculation involves adding the volume of the original gas to the volume of the newly introduced gas and then subtracting the volume of the gas discharged from the relief valve. This resulting volume should be equal to the product of the total volume of the circulation part and the target concentration. Therefore, the calculation for the inflow volume of CO2 or O2 passing through the MFC can be represented as:
(Volume of original gas + Volume of new gas − Volume of discharged gas) = (Total volume of circulation
part) × (Target concentration).
Consequently, the inflow volume of CO2, O2 and N2 satisfies the following formulas, respectively:
C c V + X ( X + Y + Z ) C c = C c s V
C o V + Y ( X + Y + Z ) C o = C o s V
When X, Y, and Z are all positive, it is feasible to achieve the target concentrations of CO2 and O2 by introducing the corresponding volume. However, the two formulas mentioned have three unknowns and cannot be directly solved.
In practical applications, a quantitative step-by-step adjustment control strategy is adopted, as illustrated in Figure 3. The following agreements are made:
(1)
Prioritize ensuring the CO2 concentration through a step-by-step adjustment strategy;
(2)
When the CO2 concentration is normal, the subsequent gas introduced always contains the target proportion of CO2 in order to reach the target O2 concentration while keeping the CO2 concentration constant;
(3)
If the CO2 concentration is higher, N2 is used to dilute its concentration to the target level instead of O2.
The specific control process, outlined in the figure, is divided into different scenarios.
(1)
If the original CO2 concentration is higher than the target concentration, i.e., Cc > Ccs:
In this case, N2 is introduced to dilute the gas, and the inflow volume of N2 (Z1) must satisfy the following formula:
C c V C c Z 1 = C c s V
The inflow volume of N2 (Z1) is determined by the following formula:
Z 1 = ( C c C c s ) V C c
Then, the theoretical O2 concentration Co1 after mixing is:
C o 1 = C o ( 1 Z 1 V ) = C o C c s C c
At this point, the intermediate concentration of O2 (Co1) is compared with the target concentration of O2.
1)
If the intermediate concentration of O2 is higher, i.e., Co1 > Cos
Then, N2 and CO2 are filled using MFC simultaneously, with the CO2 concentration in the mixed gas already at the target concentration,
X X + Z 2 = C c s
In this scenario, according to the equilibrium requirements of O2 (Formula (2)),
C o 1 V X + Z 2 C o 1 = C o s V
Then, the inflow volume of N2 (Z2) and CO2 (X) can be calculated according to the following formulas:
Z 2 = ( 1 C o s C c C o C c s ) ( 1 C c s ) V
X = ( 1 C o s C c C o C c s ) C c s V
2)
If the intermediate concentration of O2 is lower, i.e., Co1 < Cos
Then, O2 and CO2 are filled using MFC simultaneously, with the CO2 concentration in the mixed gas already at the target concentration,
X X + Y = C c s
In this scenario, according to the equilibrium requirements of O2,
C o 1 V + Y ( X + Y ) C o 1 = C o s V
Then, the inflow volume of O2 (Y) and CO2 (X) can be calculated according to the following formulas:
Y = V ( 1 C c s ) ( C o s C c C o C c s ) ( C c C c C c s C o C o s )
X = V C c s ( C o s C c C o C c s ) ( C c C c C c s C o C o s )
(2)
If the original concentration of CO2 is lower than the target concentration, i.e., Cc < Ccs,
According to the strategy above, CO2 is filled and the inflow volume of CO2 (X1) must satisfy the following formula:
C c V + X 1 X 1 C c = C c s V
The inflow volume of CO2 (X1) is obtained
X 1 = V ( C c s C c ) ( 1 C c )
Then, the theoretical O2 concentration Co1 after mixing is
C o 1 = C o ( 1 X 1 V ) = C o ( 1 C c s ) 1 C c
At this point, the intermediate concentration of O2 (Co1) is compared with the target concentration of O2.
(1)
If the intermediate concentration of O2 is higher, i.e., Co1 > Cos
Then, N2 and CO2 are filled using MFC at the same time, and the concentration of CO2 in the introduced mixed gas is the target concentration already,
X 2 ( X 2 + Z ) = C c s
In this scenario, according to the equilibrium requirements of O2,
C o 1 V ( X 2 + Z ) C o 1 = C o s V
Then, the inflow volume of N2 (Z) and CO2 (X2) can be calculated according to the following formulas:
Z = V [ 1 C c s C o s ( 1 C c ) C o ]
X 2 = V [ C c s C c s C o s ( 1 C c ) C o ( 1 C c s ) ]
(2)
If the intermediate concentration of O2 is lower, i.e., Co1 < Cos
Then, O2 and CO2 are filled using MFC simultaneously, with the CO2 concentration in the mixed gas already at the target concentration,
X 2 X 2 + Y = C c s
In this scenario, according to the equilibrium requirements of O2,
C o 1 V + Y ( X 2 + Y ) C o 1 = C o s V
Then, the inflow volume of O2 (Y) and CO2 (X2) can be calculated according to the following formulas:
Y = V ( C o s C c C o s C o + C o C c s ) ( 1 C c C o )
X 2 = V C c s ( C o s C c C o s C o + C o C c s ) ( 1 C c C o ) ( 1 C c s )
After determining the method for calculating gas inflow volume, the gas supply and distribution process is illustrated in Figure 3. The standard operational procedure of the system, starting from the initial gas condition, comprises four stages:
(1)
Initially, all pumps operate at a high flow rate for a few minutes to enhance rapid gas flow and mixing through the gas mixer. This step ensures the proper distribution of gas across the chambers and minimizes gas concentration gradients to achieve uniformity. Monitoring gas concentrations over time can provide insights into the effectiveness of the mixing process.
(2)
If post-mixing gas concentrations are outside the acceptable range, Mass Flow Controllers (MFCs) regulate the flow of CO2, O2, or N2 into the gas mixer at specific volumes. Simultaneously, the existing gas in the mixer is slowly released through the relief valve until the MFCs are closed, with a small amount of new gas potentially escaping. Inflow volumes of CO2, O2, and N2 can be calculated based on system parameters and measured gas concentrations. It is essential to keep the pumps off during this stage to ensure thorough replacement of the original gas with the new gas.
(3)
Similar to stage 1, all pumps are activated to blow for a few minutes to facilitate the mixing of new gas with any remaining original gas, aiming for consistent gas concentration throughout the system.
(4)
All pumps are initially set to a low flow rate, known as breezing, to prevent air leakage into the chamber and potential disruption of cell development. This breezing state is maintained as long as the lid remains closed unless there is a change in gas concentration. Upon opening and closing the lid, a blowing operation is triggered instead of breezing, enabling the system to swiftly revert to the previous atmosphere within a brief timeframe. In case of abnormal gas concentration, the system automatically re-regulates to the initial stage.

2.4. Gas Mixing Experiment on Multi-Chamber Cell Incubator

A multi-chamber cell incubator is fabricated and assembled based on the gas supply system, as shown in Figure 4. The incubator is a compact device containing 12 chambers arranged in two rows. The gas system components are mainly installed at the rear of the incubator, including air pumps (Thomas Diaphragm pump, model 2002 VD BLDC, Monroe, LA, USA), CO2 sensor (Novasis Innovazione Novagas2, model NG2-A-2, Pont-Saint-Martin AO, Italy), O2 sensor (Figaro, model KE-25LF, Maxell, Tokyo, Japan), MFCs (AITOLY, model MFC300_RS485, Wuxi, China), gas mixer (Henan Xingchao Electromechanical Equipment Co., Ltd., Xinxiang, China), check valve (SMC, model AKH06, Tokyo, Japan), and solenoid valve (AVIC ZEMIC, model FOA-3T24, Xi’an, China). The gas mixer is designed as an enclosed thin-walled cylinder, filled with three SV static mixing units each positioned at a 60-degree angle to the adjacent units. The total volume of the gas circulation part is 1800 mL, with 950 mL for the gas mixer and 850 mL for the rest.
The gas experiment is carried out in two phases. The first phase aims to determine the optimal mixer for the system. Three mixers with different L/D ratios are separately connected to the device for testing. Each mixer is initially filled with the same mixed gas, and the remaining space of the system is filled with air. Subsequently, all the air pumps are activated to allow the gas to circulate, while monitoring changes in gas concentration. In the second phase, the optimal mixer identified in phase one is connected to the device. Gas mixing and distribution control are performed according to the workflow illustrated in Figure 3, followed by the measurement of CO2 and O2 concentrations over time.

2.4.1. Mixer Performance Experiment

To assess the mixing performance of different gas mixers, three SV static mixers with different L/D ratios of 0.75, 2.5, and 6 were constructed, each having a volume of approximately 950 mL. The selection of a mixer should consider both gas mixing concentration uniformity and mixing efficiency. To evaluate the concentration uniformity of mixers with different L/D ratios, an open system experiment was conducted where three different gases were passed through the mixer via MFCs and released into the atmosphere, with the changing concentration of the discharged gas being monitored over time. Additionally, a circulatory system experiment was performed to evaluate mixing efficiency. In this experiment, the gas mixer was reconnected to the circulation system, excluding the gas source. Initially, the mixing chamber and culture chamber was filled with different gases, followed by activating all pumps to initiate operation. Subsequently, the concentrations of CO2 and O2 were monitored over time.

2.4.2. Three-Gas Mixing Experiment

Following the mixer performance experiment, an optimal mixer was selected for the subsequent three-gas mixing experiment. All components were connected to the circulation system as illustrated in Figure 1. As depicted in Figure 3, the gas system of the incubator predominantly remains in a breezing state; therefore, there are three different operating scenarios to be considered, on which the gases need to be consumed more. Then, the three-gas mixing experiments were conducted in the following scenarios:
  • Initialization
At the onset, when the mixing chamber and incubation chamber are initially filled with air, it is essential to regulate the gas concentration in the culture environment, for example, 5% O2 and 5% CO2. This process is known as initialization. Following the gas inflow volume method outlined above, CO2 must first be replenished to achieve a set concentration of 5%. Then, the O2 concentration should be regulated to 5% by the addition of N2 and CO2, and the newly introduced gas should maintain a CO2 concentration of 5% to ensure that both CO2 and O2 reach the desired concentration levels. Multiple adjustments may be necessary if the initial adjustment is unsuccessful.
  • O2 concentration changes
During the actual culture process, the CO2 concentration is typically maintained at 5% (to stabilize pH), while varying O2 concentrations are required at different stages to meet the dynamic concentration demands of cell culture. The O2 concentration progressively increases as cells proliferate. In the experiment, the CO2 concentration was held constant at 5%, while the O2 concentration was incrementally raised from 5% to 80%, with gas concentrations recorded at different set values. To ensure thorough mixing after each gas inflow, a mixing time of 2 min is recommended.
  • Chamber lids open
Chamber lids are opened during the culture process to facilitate observation or exchange of culture solutions. When the lid is opened, the gas within the chamber is replaced by air. To restore the previous gas environment, the gas system must be recirculated, new gas replenished, and a portion of the gas discharged to establish a gas concentration balance. To simulate this process, the chambers were fully opened and closed in a gas atmosphere of 5% O2 and 5% CO2. The pumps were activated to thoroughly mix the gas, resulting in low CO2 concentration and high O2 concentration. CO2 and N2 were then introduced to restore the initial gas environmental conditions.

3. Results

3.1. Numerical Simulation Results of Mixers

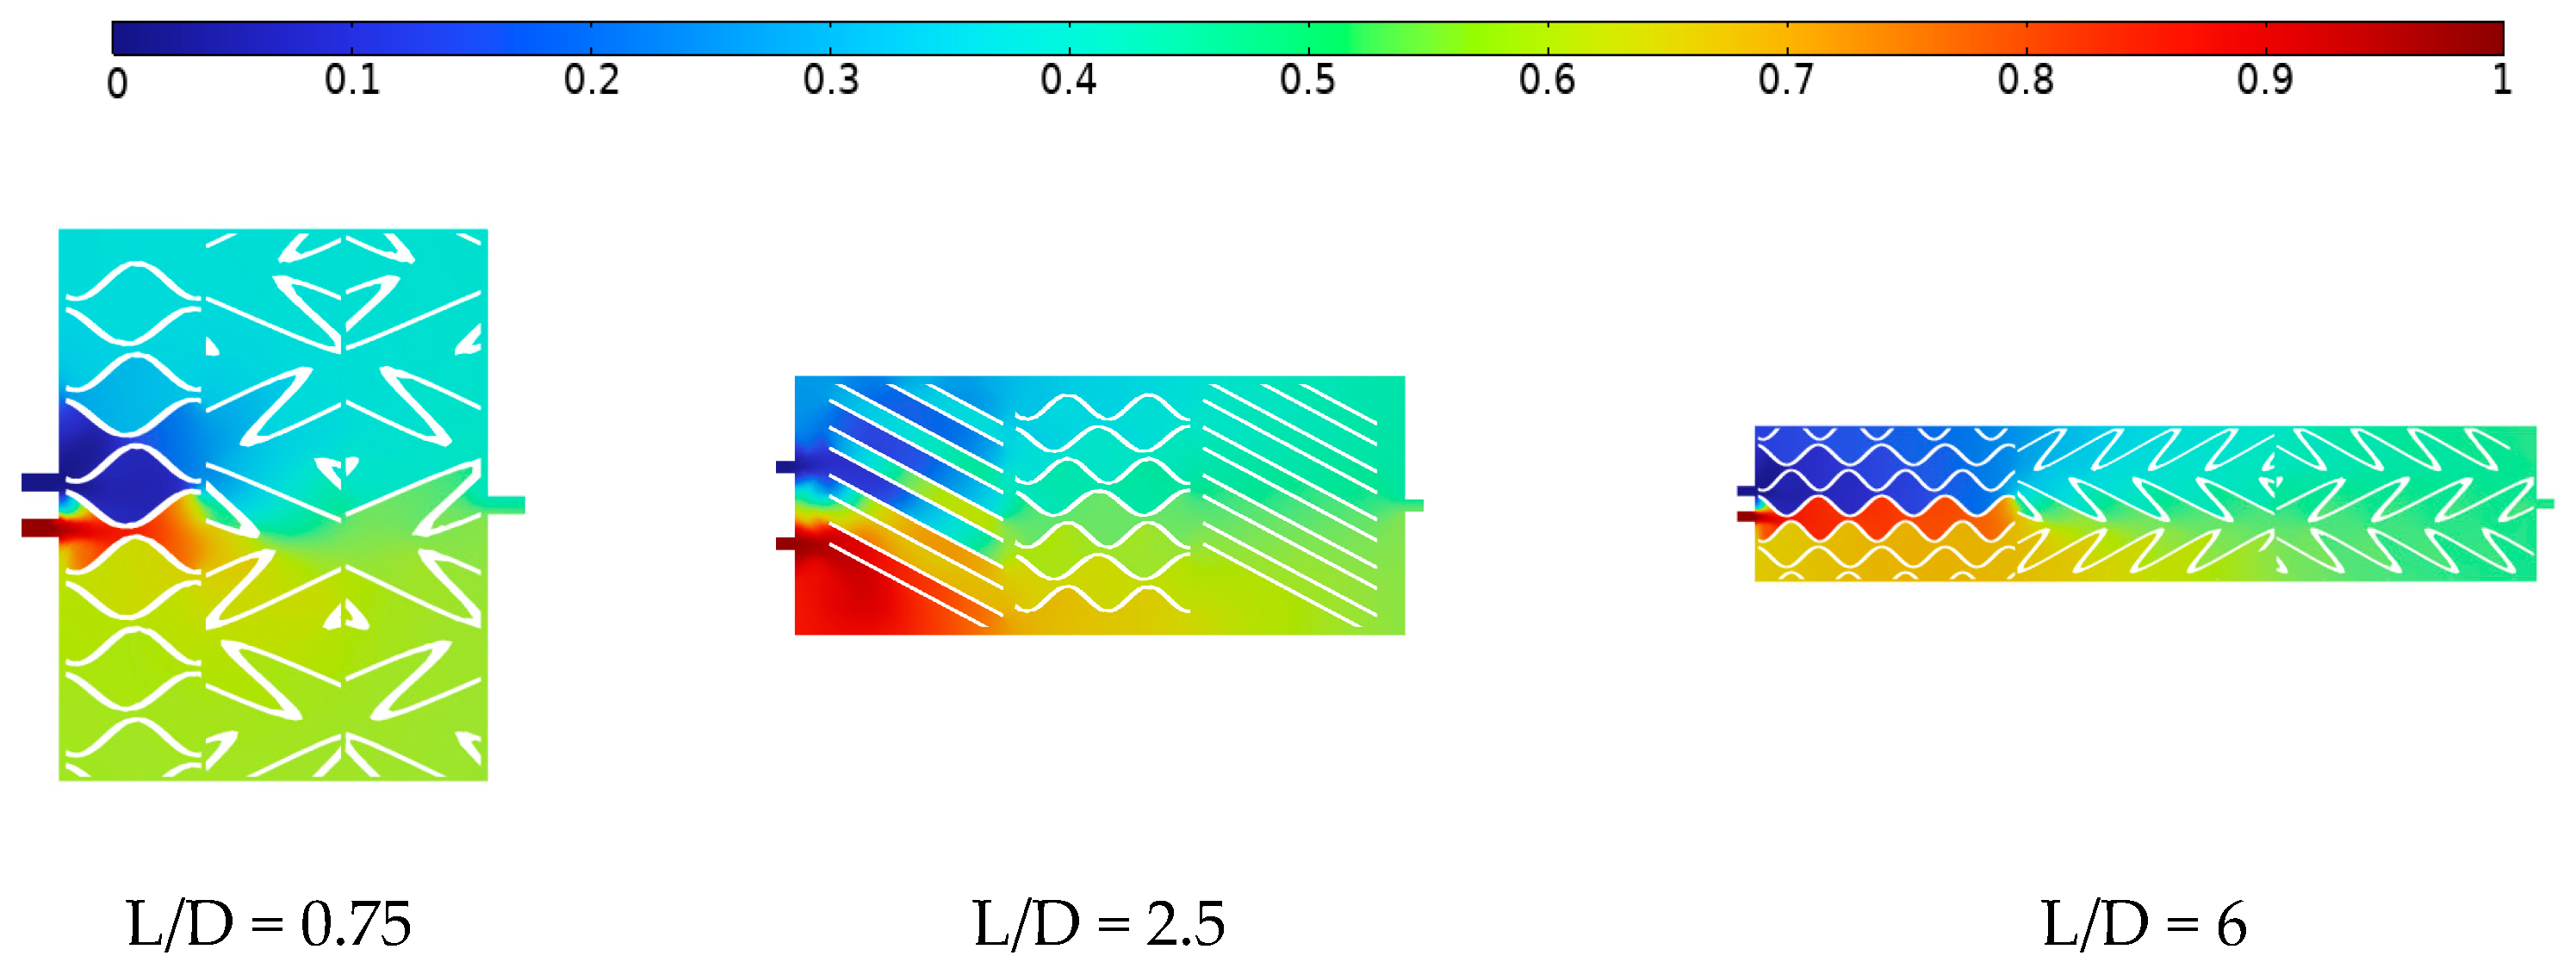
The simulation of a gas mixer can generate velocity and concentration fields, with the concentration field being the main focus for evaluating the mixing effect. The concentration field distribution results of the static mixer with various L/D ratios under identical operating conditions are shown in Figure 5 and Figure 6. Upon reaching a steady state, it is observed that the gas concentration gradient inside the SV mixer with different L/D ratios of 0.75, 2.5, and 6 are approximately 20%, 8%, and 2%, respectively. It is noted that a higher L/D ratio results in improved gas phase uniformity and enhanced gas mixing efficiency within the mixer.
The simulation results of mixers with various L/D ratios indicate that a larger L/D ratio leads to a longer gas flow path within the mixer, enhancing turbulence effects due to turbulence elements. This increased path length and narrower space can further improve the convective diffusion of substances in both time and space dimensions. However, it is important to consider the limitations of installation space and manufacturing processes when determining the optimal L/D ratio for a mixer, as increasing it indefinitely is not feasible and should be balanced with actual test results.

3.2. Experiment Results of Mixer

3.2.1. Open System Experiment

In an open system experiment, N2, O2, and CO2 gases are simultaneously introduced into a mixer with different L/D ratios through MFCs, flowed through a gas sensor, and discharged into the atmosphere. The molar fractions of the three gases are 5%, 5%, and 90%, with a total flow of 1000 sccm. The concentration of the discharged gas after the mixer changed with time is tested as shown in Figure 7. Therefore, the larger the L/D, the shorter the numerical stability time of the gas concentration, which is consistent with the simulation results, and conversely, the smaller the L/D, the longer the gas concentration stability time.

3.2.2. Circulatory System Experiment

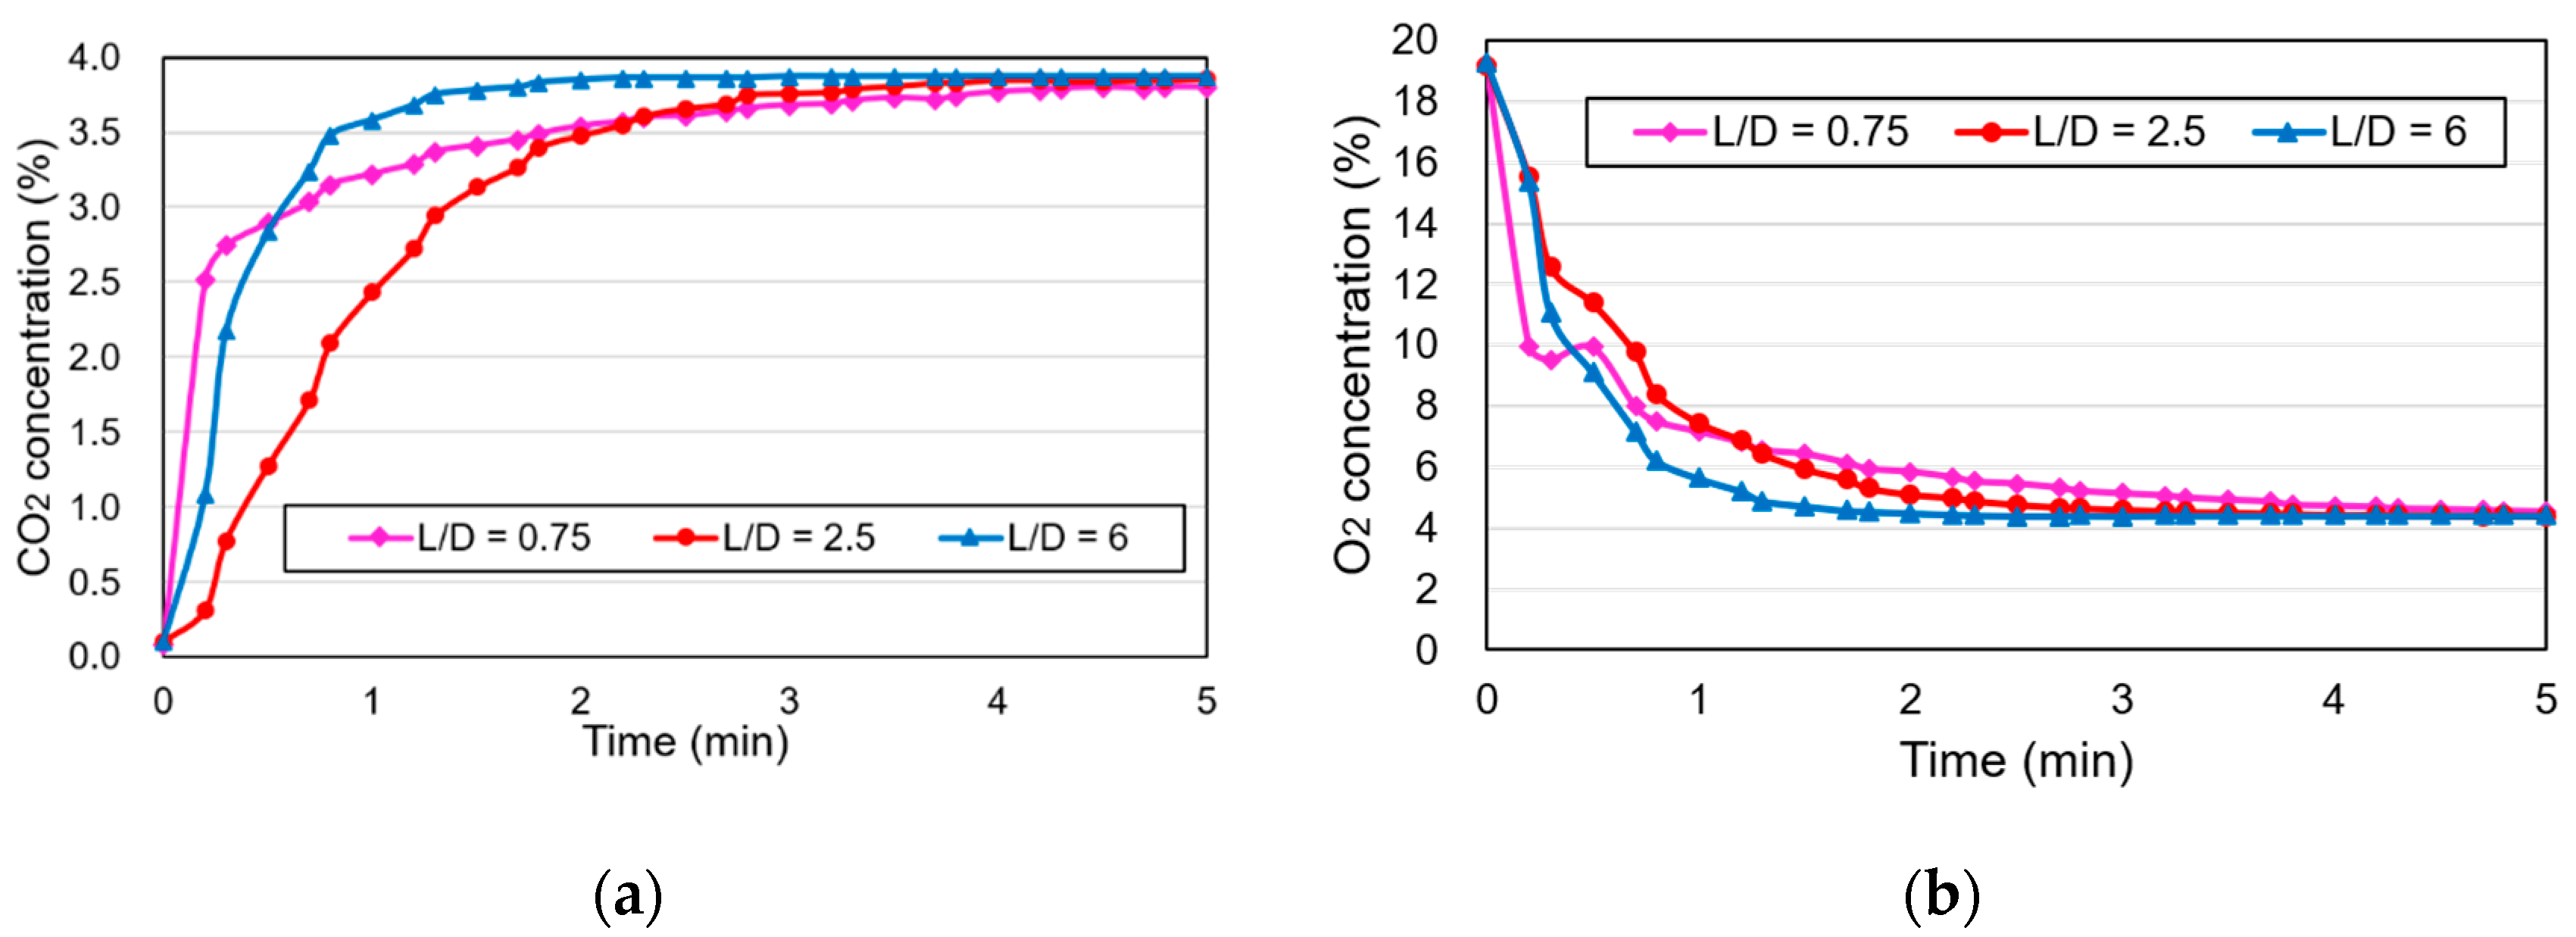
The experiment begins with a gas mixture of 5% CO2 and 5% O2 in the mixer, while the culture chamber is filled with air and all pumps are activated at a total flow rate of approximately 1 L/min. The changes in CO2 and O2 concentrations are monitored during various mixer tests, and the results are depicted in Figure 8.
The figure illustrates that the mixer with an L/D ratio of 0.75 has a stability time of around 0.5 min, the L/D 2.5 mixer has a stability time of about 1 min, and the L/D 6 mixer has a stability time of roughly 2 min. This suggests that lower L/D ratios result in shorter gas concentration stability time, whereas higher L/D ratios lead to longer stability time.
Based on considerations of concentration uniformity and mixing efficiency, the static mixer with an L/D ratio of 2.5 is chosen as the optimal mixer and utilized in further gas mixing and distribution experiments.

3.3. Gas Concentration and Consumption under Different Scenarios

3.3.1. Initialization

The gas concentrations from the initial air condition to 5% CO2 and 5% O2 are depicted in Figure 9a, with the gas consumption for each concentration adjustment shown in Figure 9b. After three phases of concentration adjustments, the adjustment time is approximately 15 min. The first adjustment results in a decrease in O2 concentration from 19.2% to 10.7% and an increase in CO2 concentration from 0.1% to 4.6%, primarily due to a large volume of incoming N2 (1250 mL) and some gas being discharged to the atmosphere via the relief valve, preventing a complete exchange. The second adjustment brings O2 concentration to 6.3% and CO2 concentration to 4.75%, while the third adjustment achieves the target concentrations of 4.99% O2 and 5.01% CO2. The gas consumption is 233 mL of CO2 and 2580 mL of N2 in total.

3.3.2. O2 Concentration Changes

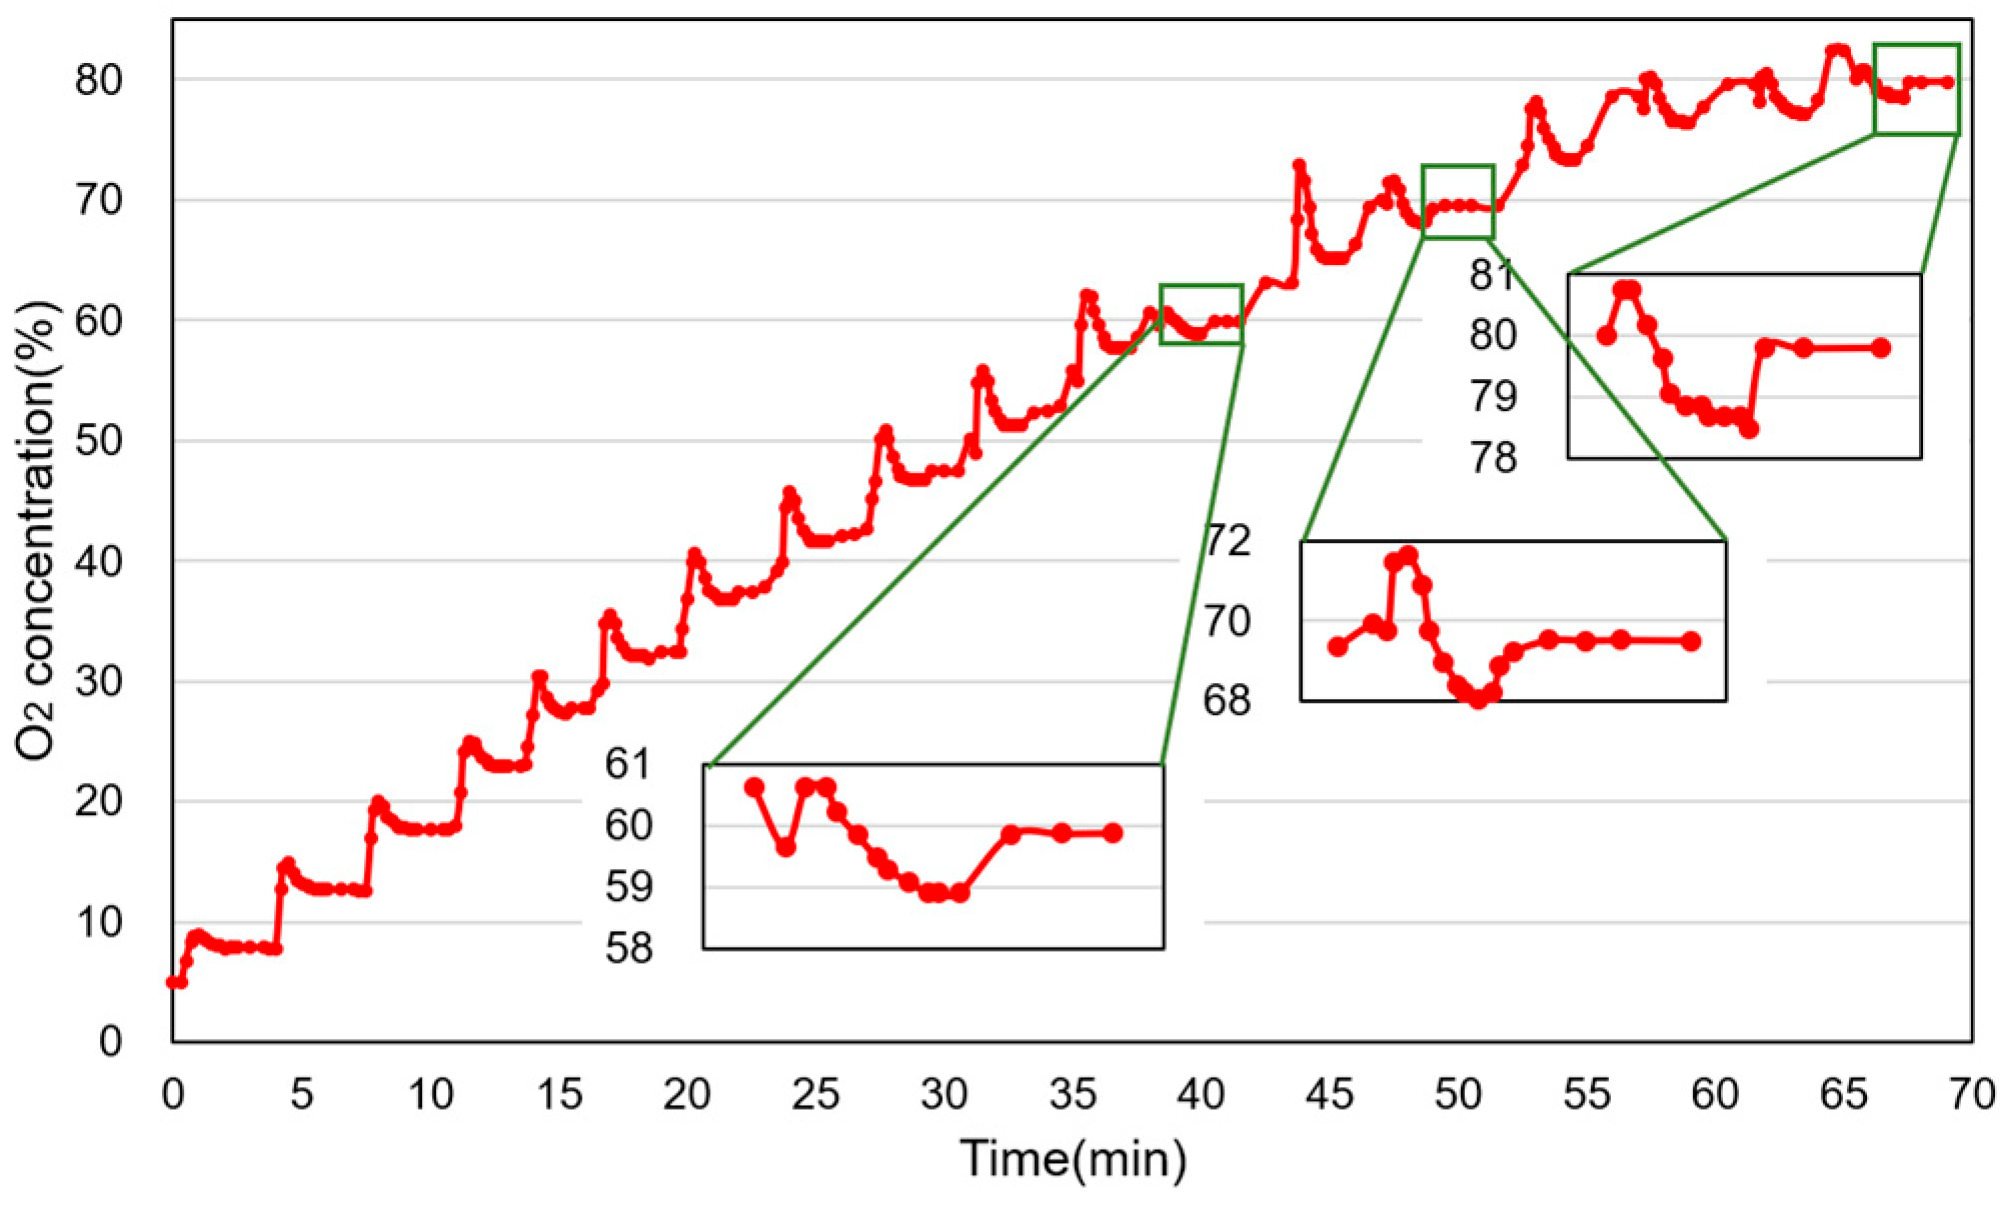
The experiment involves maintaining a constant CO2 concentration while gradually increasing the O2 concentration from 5% to 80% in incremental steps (5%, 8%, 13%, 18%, 23%, 28%, 33%, 38%, 43%, 48%, 53%, 60%, 70%, and 80%). Gas concentrations at various set values are recorded, and the resulting curves are depicted in Figure 10 and Figure 11. The volume of gas consumed with each concentration change is illustrated in Figure 12. Results indicate that smaller changes in O2 concentration, like 5%, require only one adjustment to reach the target concentration, with CO2 consumption ranging from 6 to 13 mL and O2 consumption increasing gradually from 101 mL to 202 mL. However, for larger O2 concentration changes, particularly at high concentrations, multiple adjustments are often required to reach the target concentration due to increased gas inflow. This leads to significant fluctuations in CO2 concentration and higher gas consumption as shown in Figure 11 and Figure 12.
The experiment results and deviation data are detailed in Table 1. The system demonstrates an accuracy of ±0.1% for CO2 concentration with minor fluctuations, and an accuracy of ±0.5% for O2 concentration across the range from 5% to 80%. Consequently, the system exhibits effective concentration control performance, meeting the gas concentration requirements for various cultivation scenarios.

3.3.3. Chamber Lids Open

After opening and closing the lid, thoroughly circulating, and mixing the gas concentration reaches 2.84% for CO2 and 11.3% for O2, indicating a scenario of high O2 concentration and low CO2 concentration. Following this process, the gas is replenished and adjusted to the target concentration, with the gas concentration change curve depicted in Figure 13a. The adjustments are made twice to achieve a target concentration. The total consumption illustrated in Figure 13b includes 85 mL of CO2 and 1400 mL of N2, with a recovery time of less than 15 min.

4. Discussion

For the calculation method of inflow volume, a step-by-step adjustment strategy is adopted to ensure the CO2 concentration preferentially and the subsequent gas introduced always contains the target proportion of CO2 so that the CO2 concentration remains unchanged during the time of adjusting the O2 concentration because of the importance of CO2 concentration. For the intermediate concentration of O2, the theoretical calculation value (Co1) is used during the process instead of the measured value for the convenience of calculation, while the measured value will be susceptible.
Meanwhile, when changing the gas concentration, since the relief valve is positioned downstream of the gas mixer and upstream of the chambers to avoid the effect of chamber tightness when new gases pass into the mixer, the equal volume of original gases is discharged into the atmosphere from the relief valve, theoretically. Therefore, if the total gas inflow volume does not exceed the total capacity of the mixer during each adjustment, a good “new for old” can be realized, which satisfies the theoretical calculation model. This method is effective for small concentration changes, maintaining CO2 levels while gradually increasing O2 concentration. However, for large-scale adjustments, multiple adjustments are needed due to more gas discharge, resulting in longer adjustment times and higher gas consumption. Despite these challenges, gradual improvements in reducing gas concentration deviations are observed after several adjustments. For each subsequent adjustment, the gas concentrations of the system will approach the target value, and, thereafter, the interval of stabilization between adjustments depends on the acceptable deviation.
Sealing is a critical factor in ensuring the proper functioning of the gas system and minimizing gas consumption. Theoretically, as long as the chamber lid is closed, no gas will be consumed in a breezing state. However, in the actual situation, poor sealing leads to an amount of air entering the system due to the negative pressure in the chambers, resulting in longer adjustment time, more gas consumption, and even failure to reach the target value. Therefore, better sealing helps to maintain longer concentration stability and lower gas consumption.
In terms of gas consumption, the system is in a state of minimal gas usage under good sealing conditions. As air gradually enters the system, the O2 concentration increases and the CO2 concentration decreases. When the gas concentration exceeds the threshold value, new gas needs to be replenished to reach the target concentration as outlined in the control process in Figure 3.
Here, we assume the gas concentration deviation threshold value is ±0.5, and the gas system needs to adjust once every two hours because the gas concentration exceeds the threshold value. According to the calculation method, the gas consumption is 17 mL of CO2 and 150 mL of N2 per adjustment, totaling 204 mL of CO2 and 1800 mL of N2 daily. A hypothetical gas concentration scenario for week-long cultivation is outlined: (1) Day 1 starts with air, transitions to 5% CO2 and 5% O2 for one day; (2) Day 2 maintains 5% CO2 and increases O2 to 8%; (3) Day 3 increases O2 to 13%; (4) Day 4 increases O2 to 18%; (5) Day 5 increases O2 to 23%; (6) Day 6 increases O2 to 28%; (7) Day 7 increases O2 to 33%. Throughout the cultivation, the lid is opened once daily for medium change and observation, and the other time the breezing state is kept with a little flow for circulation. The average daily consumption during cultivation is calculated to be 3570 mL of N2, 330 mL of CO2, and 115 mL of O2. Comparatively, the ESCO medical Miri TL, which also utilizes a recirculating gas supply method, consumes < 2 L/h of N2 and <12 L/h of CO2 under normal conditions without gas concentration changes or lid openings. The recirculating system’s gas consumption is significantly lower than that of the ESCO MIRI, let alone traditional incubator systems with open gas supply methods.

5. Conclusions

This study presents a gas supply system and method with low gas consumption and a wide concentration range for a multi-chamber tri-gas cell incubator. The system utilizes a circulating gas supply method and an innovative quantitative step-by-step adjustment strategy to control gas concentration. Numerical simulation and experiments are conducted to enhance gas mixing efficiency, with results indicating that an SV mixer with an L/D ratio of 2.5 is the optimal choice. Additionally, the three-gas mixing and distribution experiments in different scenarios are carried out to test gas concentration and gas consumption. The system finally allows for dynamic gas concentration adjustments across a wide range to meet various cell culture requirements while maintaining high accuracy. Thanks to the circulation method, the system demonstrates significantly lower gas consumption compared to existing incubators. Future research will involve conducting cell culture experiments in the system-based incubator to verify its effectiveness. The proposed system and method have strong universality and can be extended beyond the field of life science to applications in food processing, environmental protection, scientific experiments, and industrial production.

Author Contributions

Conceptualization, W.Z. and D.X.; methodology, D.X.; software, R.C.; validation, D.X. and W.L.; formal analysis, W.Z.; investigation, D.X.; resources, H.S.; data curation, D.X.; writing—original draft preparation, D.X.; writing—review and editing, W.Z. and D.X.; visualization, D.X.; supervision, W.Z. and H.S.; project administration, H.S.; funding acquisition, H.S. All authors have read and agreed to the published version of the manuscript.

Funding

This study was funded by the National Key R&D Program of China, Grant number 2022YFA1104800, and High-tech Industrialization Special Funding Projects for Scientific and Technological Cooperation between Jilin Province and the Chinese Academy of Sciences, Grant number 2023SYHZ0043.

Institutional Review Board Statement

Not applicable.

Informed Consent Statement

Not applicable.

Data Availability Statement

The original contributions presented in the study are included in the article, further inquiries can be directed to the corresponding authors.

Conflicts of Interest

Author Haixuan Sun was employed by the company Jinan Guokeyigong Science and Technology Development Company Ltd. The remaining authors declare that the research was conducted in the absence of any commercial or financial relationships that could be construed as a potential conflict of interest.

Nomenclature

VTotal volume of circulation part, including mixer, chambers, pipelines, etc.
CcOriginal concentration of CO2
CoOriginal concentration of O2
Co1Intermediate concentration of O2 (theoretical)
CcsTarget concentration of CO2
CosTarget concentration of O2
XInflow volume of CO2, the subscript “1” means the volume of the first step during once adjustment and the subscript “2” means the volume of the second step
YInflow volume of O2, the subscript “1” means the volume of the first step during once adjustment and the subscript “2” means the volume of the second step
ZInflow volume of N2, the subscript “1” means the volume of the first step during once adjustment and the subscript “2” means the volume of the second step

References

  1. Tse, H.M.; Gardner, G.; Dominguez-Bendala, J.; Fraker, C.A. The Importance of Proper Oxygenation in 3D Culture. Front. Bioeng. Biotechnol. 2021, 9, 634403. [Google Scholar] [CrossRef]
  2. Klein, S.G.; Steckbauer, A.; Alsolami, S.M.; Arossa, S.; Parry, A.J.; Li, M.; Duarte, C.M. Toward Best Practices for Controlling Mammalian Cell Culture Environments. Front. Cell Dev. Biol. 2022, 10, 788808. [Google Scholar] [CrossRef] [PubMed]
  3. Lee, S.C.; Seo, H.C.; Lee, J.; Jun, J.H.; Choi, K.W. Effects of dynamic oxygen concentrations on the development of mouse pre- and peri-implantation embryos using a double-channel gas supply incubator system. Clin. Exp. Reprod. Med. 2019, 46, 189–196. [Google Scholar] [CrossRef] [PubMed]
  4. Li, J.; Zhang, J.; Pan, X.; Tang, W.-X.; Wang, B.-H. Effects of Different Oxygen Concentrations on Growth of Several Kinds of Cells in Vitro. J. Nat. Sci. Hunan Normal Univ. 2014, 37, 13–18. [Google Scholar]
  5. Aguilera-Castrejon, A.; Oldak, B.; Shani, T.; Ghanem, N.; Itzkovich, C.; Slomovich, S.; Tarazi, S.; Bayerl, J.; Chugaeva, V.; Ayyash, M.; et al. Ex utero mouse embryogenesis from pre-gastrulation to late organogenesis. Nature 2021, 593, 119–141. [Google Scholar] [CrossRef]
  6. Swain, J.E. Optimal human embryo culture. Semin. Reprod. Med. 2015, 33, 103–117. [Google Scholar] [CrossRef]
  7. Hadanny, A.; Efrati, S. The Hyperoxic-Hypoxic Paradox. Biomolecules 2020, 10, 958. [Google Scholar] [CrossRef]
  8. Huang, J.; Xu, Z.; Jiao, J.; Li, Z.; Li, S.; Liu, Y.; Li, Z.; Qu, G.; Wu, J.; Zhao, Y.; et al. Microfluidic intestinal organoid-on-a-chip uncovers therapeutic targets by recapitulating oxygen dynamics of intestinal IR injury. Bioact. Mater. 2023, 30, 1–14. [Google Scholar] [CrossRef]
  9. Wörsdörfer, P.; Ergün, S. The Impact of Oxygen Availability and Multilineage Communication on Organoid Maturation. Antioxid. Redox Sign. 2021, 35, 217–233. [Google Scholar] [CrossRef]
  10. Kadoshima, T.; Sakaguchi, H.; Nakano, T.; Soen, M.; Ando, S.; Eiraku, M.; Sasai, Y. Self-organization of axial polarity, inside-out layer pattern, and species-specific progenitor dynamics in human ES cell-derived neocortex. Proc. Natl. Acad. Sci. USA 2013, 110, 20284–20289. [Google Scholar] [CrossRef]
  11. Lee, M.; Grazi, R.; Seifer, D. Incorporation of the Cook K-Minc incubator and media system into the IVF lab: The future of IVF. J. Clin. Embryol. 2010, 13, 21–32. [Google Scholar]
  12. Aparicio-Ruiz, B.; Romany, L.; Meseguer, M. Selection of preimplantation embryos using time-lapse microscopy in in vitro fertilization: State of the technology and future directions. Birth Defects Res. 2018, 110, 648–653. [Google Scholar] [CrossRef] [PubMed]
  13. Sciorio, R.; Thong, J.K.; Pickering, S.J. Comparison of the development of human embryos cultured in either an EmbryoScope or benchtop incubator. J. Assist. Reprod. Gen. 2018, 35, 515–522. [Google Scholar] [CrossRef]
  14. Schiewe, M.C.; Zozula, S.; Nugent, N.L.; Whitney, J.B.; Hatch, I.; Lee, C.T.; Anderson, R.E. Systematic Development, Validation and Optimization of a Human Embryo Culture System. Reprod. Med. 2020, 1, 1–14. [Google Scholar] [CrossRef]
  15. Bosch, E.P.; Bori, L.; Beltran, A.; Naranjo, V.; Meseguer, M. Artificial intelligence system for the automation of the blastocyst morphology evaluation in GERI Time-lapse Incubator. Hum. Reprod. 2021, 36, 200. [Google Scholar]
  16. Meyers, S.; Burruel, V.; Kato, M.; De La Fuente, A.; Orellana, D.; Renaudin, C.; Dujovne, G. Equine non-invasive time-lapse imaging and blastocyst development. Reprod. Fert. Develop. 2019, 31, 1874–1884. [Google Scholar] [CrossRef]
  17. Chun-Chen, W.; Tai-Hu, W.U.; Xin-Xi, X.U.; Feng, C.; Guang, Z. Design and Simulation Based on Improved Genetic Algorithm for Gas Mixture Control System. Chin. Hydraul. Pneum. 2017, 11, 81–86. [Google Scholar]
  18. Helwig, N.; Schüler, M.; Bur, C.; Schütze, A.; Sauerwald, T. Gas mixing apparatus for automated gas sensor characterization. Meas. Sci. Technol. 2014, 25, 055903. [Google Scholar] [CrossRef]
  19. Zhuang, Z.; Yan, J.; Sun, C.; Wang, H.; Wang, Y.; Wu, Z. The numerical simulation of a new double swirl static mixer for gas reactants mixing. Chin. J. Chem. Eng. 2020, 28, 2438–2446. [Google Scholar] [CrossRef]
  20. Su, Y.; Li, J.F.; Yu, B.; Zhao, Y.L.; Han, D.X.; Li, J.L. Simulation study on the mixing of hydrogen and natural gas in static mixers. Nat. Gas Ind. 2023, 43, 113–122. [Google Scholar]
  21. Putra, R.A. Mixing Characteristics Of Gas-Liquid Flow In A Static Mixer: A Numerical Study. Angkasa J. Ilm. Bid. Teknologi 2020, 12, 117–124. [Google Scholar] [CrossRef]
  22. Haddadi, M.M.; Hosseini, S.H.; Rashtchian, D.; Olazar, M. Comparative analysis of different static mixers performance by CFD technique: An innovative mixer. Chin. J. Chem. Eng. 2020, 28, 672–684. [Google Scholar] [CrossRef]
  23. Thakur, R.K.; Vial, C.; Nigam, K.D.P.; Nauman, E.B. Static mixers in the process industries—A review. Chem. Eng. Res. Des. 2003, 81, 787–826. [Google Scholar] [CrossRef]
  24. Saeed, M.; Yu, J.Y.; Abdalla, A.A.A.; Zhong, X.P.; Ghazanfar, M.A. An assessment of k-ε turbulence models for gas distribution analysis. Nucl. Sci. Tech. 2017, 28, 146. [Google Scholar] [CrossRef]
  25. Boudin, L.; Grec, B.; Salvarani, F. A mathematical and numerical analysis of the maxwell-stefan diffusion equations. Discret. Contin. Dyn. Syst.-Ser. B 2012, 17, 1427–1440. [Google Scholar] [CrossRef]
Figure 1. Schematic of the gas mixing and distribution system for a multi-chamber cell incubator. The system requires compressed gases of pure N2, O2, and CO2. The red arrows indicate the gas flow direction.
Applsci 14 07411 g001
Figure 2. Mixers with different length–diameter ratios (L/D).
Applsci 14 07411 g002
Figure 3. Gas supply and distribution process.
Applsci 14 07411 g003
Figure 4. A system-based multi-chamber cell incubator.
Applsci 14 07411 g004
Figure 5. The concentration distribution at the center section (molar fraction).
Applsci 14 07411 g005
Figure 6. The concentration distribution at the outlet section (molar fraction).
Applsci 14 07411 g006
Figure 7. Concentration changes of CO2 (a) and O2 (b) in an open system with mixers with different L/D ratios.
Applsci 14 07411 g007
Figure 8. Concentration changes of CO2 (a) and O2 (b) in circulatory system experiment with mixers with different L/D ratios.
Applsci 14 07411 g008
Figure 9. (a) Concentration changes of CO2 and O2 when initializing (b) gas consumption during each adjustment.
Applsci 14 07411 g009
Figure 10. Concentration changes of CO2 under different set concentrations of O2.
Applsci 14 07411 g010
Figure 11. Concentration changes of O2 under different set concentrations of O2.
Applsci 14 07411 g011
Figure 12. Gas consumption during each adjustment.
Applsci 14 07411 g012
Figure 13. (a) Concentration changes of CO2 and O2 after lids open (b) gas consumption during each adjustment.
Applsci 14 07411 g013
Table 1. The gas concentration measured and deviation in different scenarios.
Target ConcentrationMeasured ConcentrationDeviation
CO2O2CO2O2CO2O2
5%5%5.01%4.99%0.01%−0.01%
8%4.97%7.87%−0.03%−0.13%
13%4.92%12.71%−0.08%−0.29%
18%4.93%17.65%−0.07%−0.35%
23%4.96%22.90%−0.04%−0.02%
28%4.96%27.73%−0.04%−0.27%
33%4.92%32.50%−0.08%−0.50%
38%4.90%37.50%−0.10%−0.50%
43%4.90%42.70%−0.10%−0.30%
48%4.91%47.50%−0.09%−0.50%
53%4.90%52.82%−0.10%−0.18%
60%4.95%59.88%0.05%−0.12%
70%4.92%69.51%−0.08%−0.49%
80%4.93%79.81%−0.07%−0.19%
Disclaimer/Publisher’s Note: The statements, opinions and data contained in all publications are solely those of the individual author(s) and contributor(s) and not of MDPI and/or the editor(s). MDPI and/or the editor(s) disclaim responsibility for any injury to people or property resulting from any ideas, methods, instructions or products referred to in the content.