Abstract
During the operational process of an axial-flow compressor, the blade structure is simultaneously subjected to both aerodynamic loads and centrifugal loads, posing significant challenges to the safe and reliable operation of the blades. Considering both centrifugal loads and aerodynamic loads comprehensively, a bidirectional CFD-CSD coupling analysis method for blade structure was established. The Navier–Stokes governing equations were utilized to solve the internal flow field of the axial-flow compressor. The conservative interpolation method was utilized to couple and solve the blade’s static equilibrium equation, and the deformation, stress distribution, and prestress modal behavior of compressor blades were mainly analyzed. The research results indicate that the maximum deformation of the blades occurred at the lead edge tip, while stress predominantly concentrated approximately 33% upward from the blade root, exhibiting a radial distribution that gradually decreased. As the rotational speed increased, the maximum deformation of the blades continuously increased. Furthermore, at a constant rotational speed, the maximum deformation of the blade exhibited a trend of first increasing and then decreasing with the increase in mass flow. In contrast, the maximum stress showed a trend of first increasing, then decreasing, and finally increasing again as the rotational speed continuously increased. Centrifugal loads are the primary factor influencing blade stress and natural frequency. During operation, the blades exhibited two resonance points, approximately occurring at 62% and 98% of the design rotational speed.
1. Introduction
With the advancement of aviation engine technology, axial flow compressors, as crucial components of aviation engines, face increasingly stringent demands on overall performance. Consequently, in recent years, there has been an unparalleled development in turbomachinery, with design trends gradually shifting towards higher pressure ratios, improved efficiency, and broader operating ranges. However, the working environment for axial flow compressor blades is highly hostile, subjecting them to prolonged exposure to high temperatures, velocities, and pressures. During operation, compressor blades encounter various factors such as centrifugal loads, aerodynamic loads, thermal loads, and vibrations [1]. If blade vibration or fracture occurs, it will result in significant economic losses for the entire unit. Studies indicate that over 65% of compressor failures are blade-related [2]. According to data from a complete operational cycle of aviation engines and external maintenance test runs, compressor rotational speeds vary based on the aircraft’s flight status. Under different rotational speed conditions, the centrifugal and aerodynamic loads experienced by the blades exhibit notable variations. Therefore, conducting strength verification of compressor blades, assessing the influence of loads on blade stress and strain, and identifying potential resonance points during operation are of paramount practical and guiding significance. Such measures can prevent blade-resonance-induced damage, thereby enhancing equipment economy and safety.
In recent years, scholars both domestically and internationally have conducted extensive research on the structural performance of compressors. Ramamurti et al. [3] utilized finite element analysis to simulate the stress on a simplified impeller model, revealing that an increase in impeller rotational speed results in elevated stress levels, with centrifugal loads exhibiting a more pronounced effect. The interface between the blades and the hub emerges as the location of maximum stress. Day et al. [4] conducted a finite element analysis study on compressor blades. The research findings indicate that despite the large number of stages in the compressor, the methods utilized in the study are applicable across the entire compressor range, and vibration stress curves were plotted. Additionally, vulnerable areas of the impeller were detailed, guiding for assessing the lifespan of impeller blades. In recent years, research on the structural performance and vibration of axial flow compressor blades based on the CFD-CSD coupling method has primarily focused on coupling strategies and the numerical solution accuracy of aerodynamic forces, stresses, and strains [5,6]. Tao et al. [7] conducted numerical simulation studies on the aeroelasticity of compressor blades using fluid–structure coupling methods. They analyzed the dynamic stress and strain of the blades caused by aerodynamic impacts and assessed whether compressor blade flutter would occur. Tao [8] conducted simulation studies on the structure of turbochargers’ compressors, analyzing the deformation and stress distribution of blades under fluid dynamics, thereby offering theoretical foundations for structural optimization. Wang et al. [9] and others studied the compressor impeller of a certain type of micro-turbine engine, analyzing the formation mechanism of thermal loads and their impact on impeller stress and strain. Li [10] utilized the DS module of the ANSYS Workbench platform and the APDL language as the interface for transferring surface load data of blades, conducting a numerical simulation study on the internal flow of a transonic fan in a certain type of turbofan engine with fluid–structure coupling. The research findings demonstrated that the fluid–structure coupling-based numerical simulation was closer to experimental results, validating the effectiveness of this method. Zhang et al. [11] conducted a study on solving internal flow fields and analyzing blade vibration of high-pressure five-stage moving blades in a certain axial-flow compressor under multiple operating conditions. The distribution of blade dynamic stress under hazardous working conditions was determined, and fatigue failure analysis of the blades was carried out. The research revealed that under critical conditions, the distribution of blade vibration stress was closely related to the resonant modal vibration, and it was pointed out that the first-order resonance of blades at critical rotational speeds was the primary cause of blade failure. Li et al. [12] conducted a study on the modal analysis of compressor blades under prestress based on fluid–structure coupling. The research revealed that the centrifugal inertial force of the compressor blades themselves and the aerodynamic disturbances they experience are the primary mechanical factors causing blade vibration and fatigue failure.
When studying the structural characteristics of compressor blades, most scholars only consider aerodynamic loads, and less consider the centrifugal loads. During the structural analysis of an axial compressor, the centrifugal load significantly impacts both the bending stress at the blade root and the radial deformation of the blade. This research method of overlooking the centrifugal load may result in an inability to accurately simulate the stress and structural deformation of the compressor under real-world operating conditions, ultimately impacting its operational efficiency and the safety of the axial compressor. This paper employed a bidirectional CFD-CSD coupling method to investigate the deformation and stress distribution of compressor blades under aerodynamic loads, centrifugal loads, and the coupling of these two loads. Based on these prestresses, a modal analysis of the blades was conducted to obtain the vibration frequencies under different loading conditions, and the Campbell diagram of the blades was plotted to judge whether the blade would resonate or not. The research findings can provide a theoretical basis for the optimized design of blade structures.
2. Computational Methods
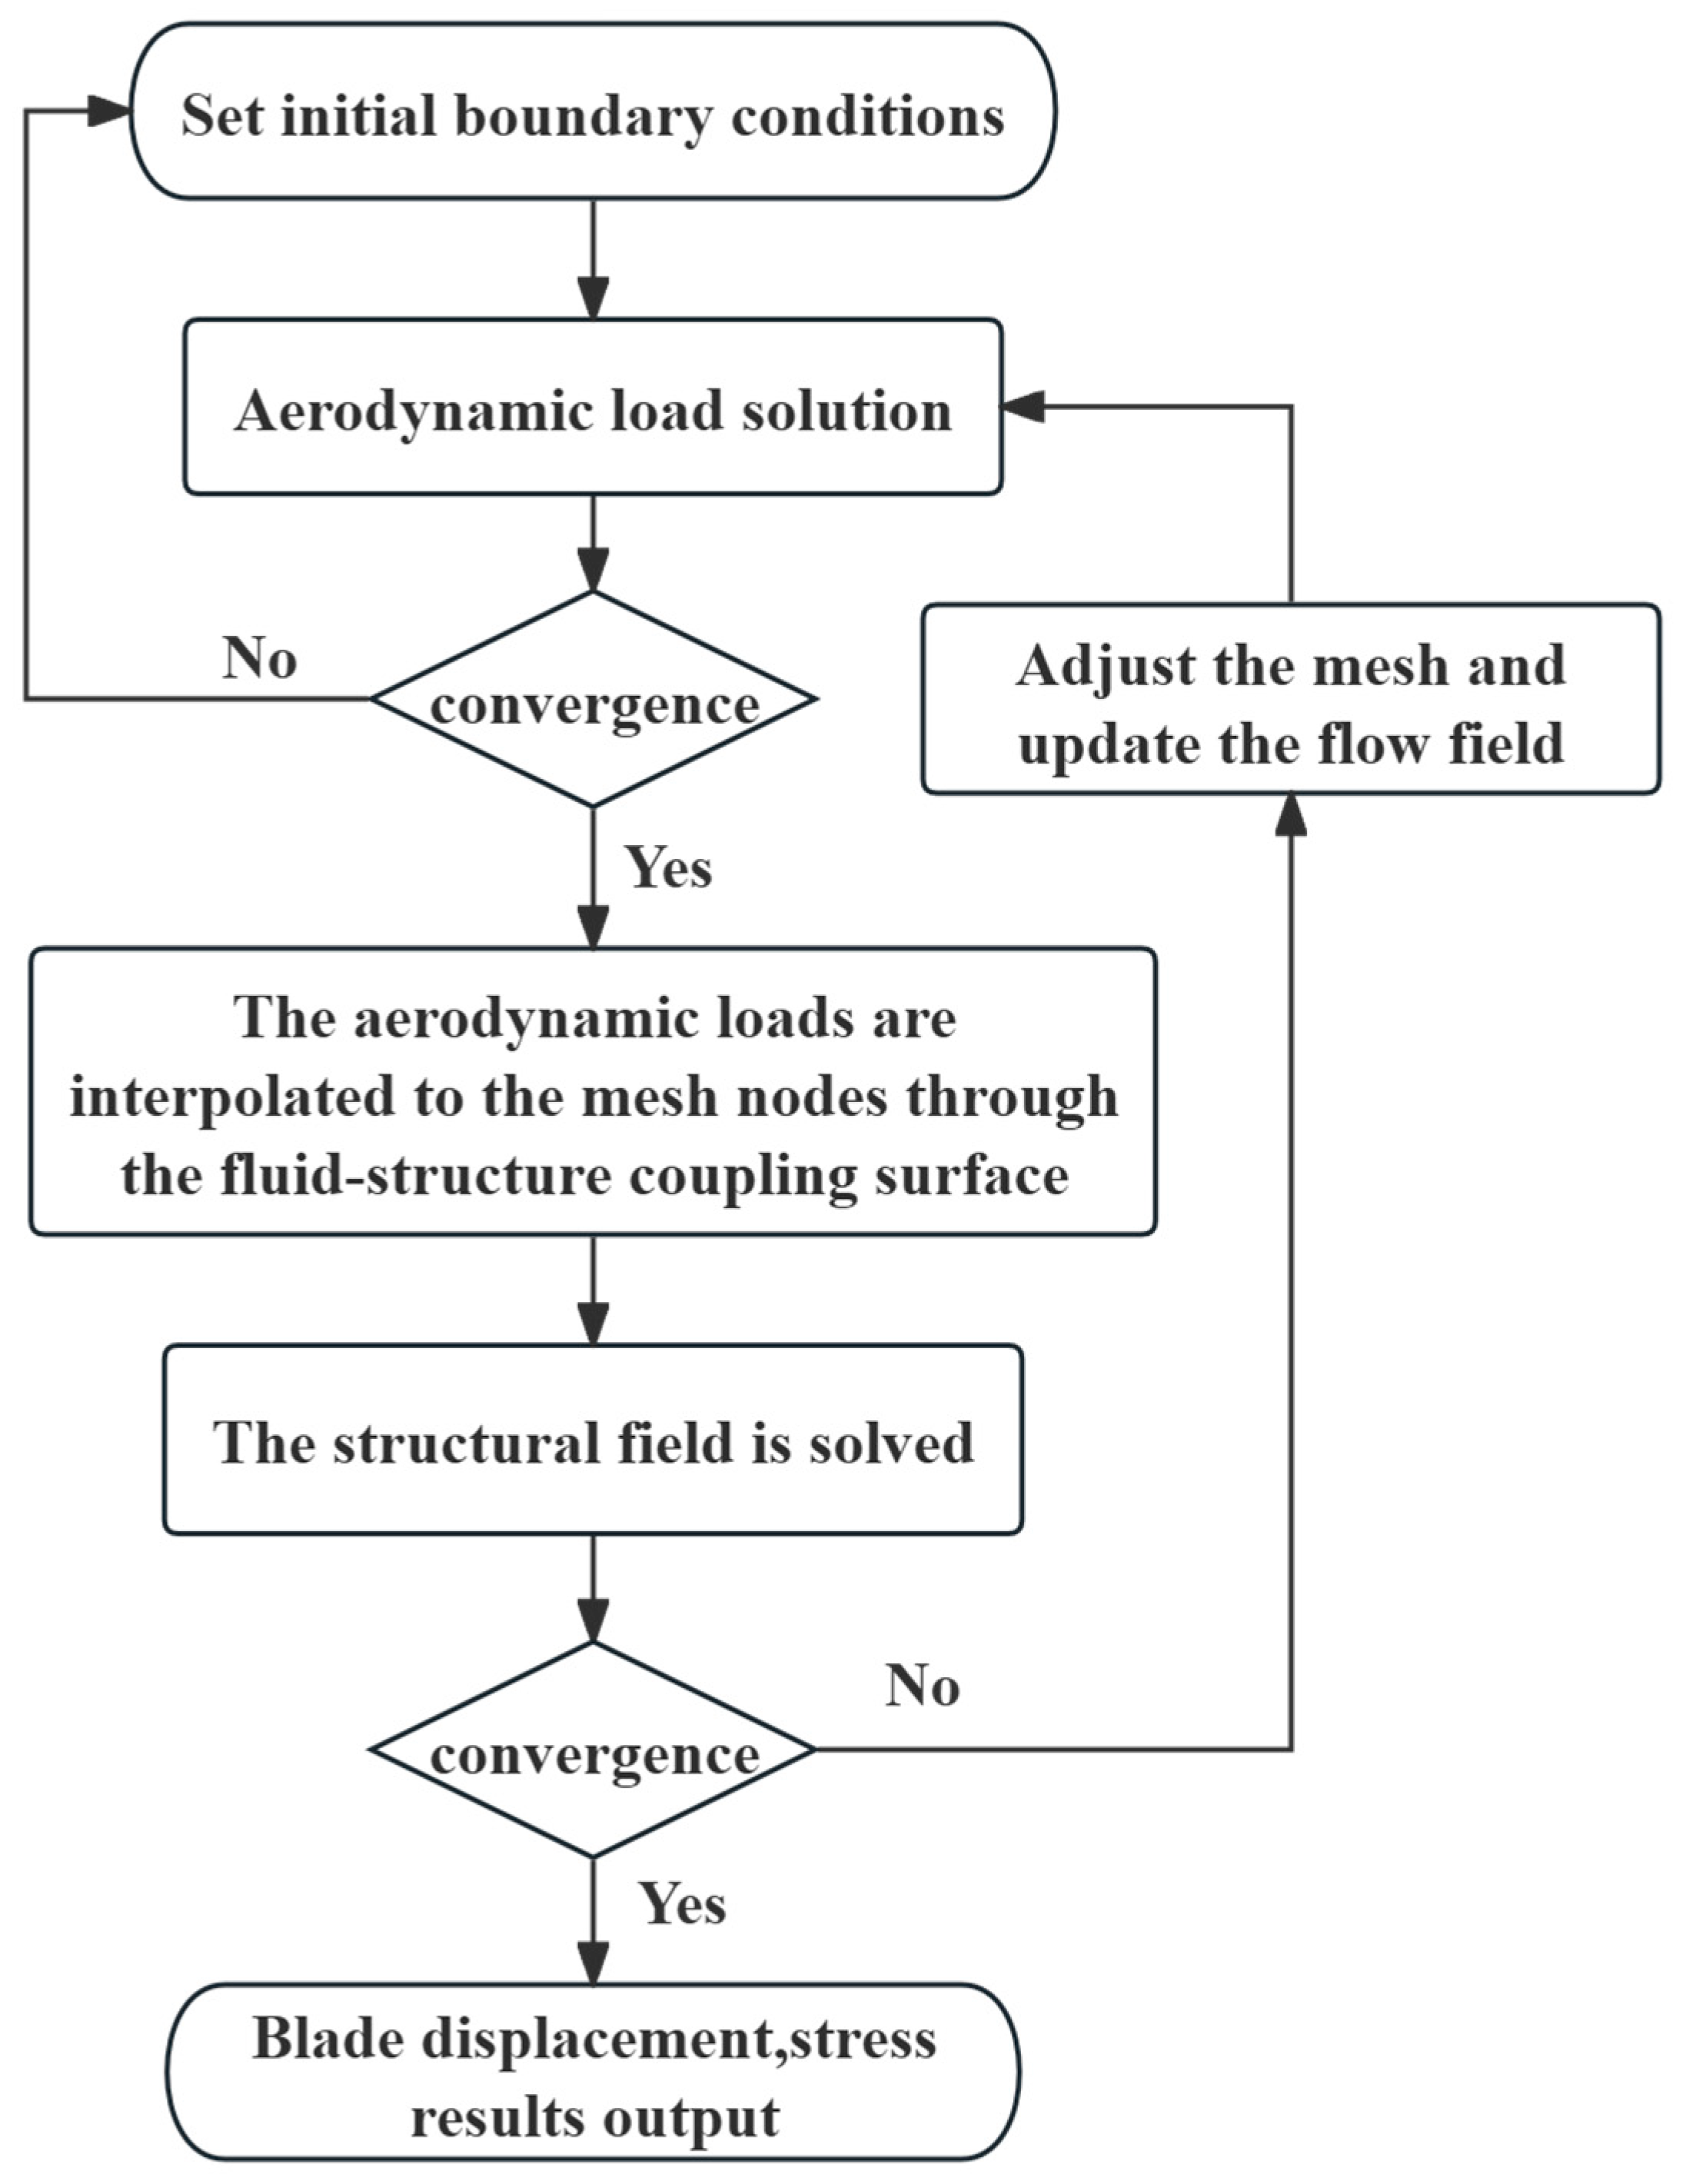
This paper employed a bidirectional CFD-CSD coupled method to solve the deformation and stress distribution of blades. The Navier–Stokes equations were utilized to compute the flow field within the transonic axial flow compressor blades. Once the flow field calculation converged, the pressure field distribution across the compressor blades was obtained. The conservative interpolation method was applied to map the pressure field onto the structural mesh nodes of the blade. Subsequently, the structural static equilibrium equations of the blade were solved to obtain the structural deformation. If the structural deformation did not converge, the deformation on the structural nodes was transferred back to the flow field mesh nodes using the conservative interpolation technique. Subsequently, the Motion Mesh method was employed to adjust the mesh positions, ensuring that the aspect ratio and skewness of the mesh were maintained at approximately 1 and 0.8, respectively. The adjusted mesh was then used to recalculate the flow field. After the flow field converged, the pressure field was again transferred to the structural nodes through the coupling interface, and the structural deformation was recalculated. This iterative process was repeated until the structural deformation of the compressor blade converged. The computational flowchart is shown in Figure 1.
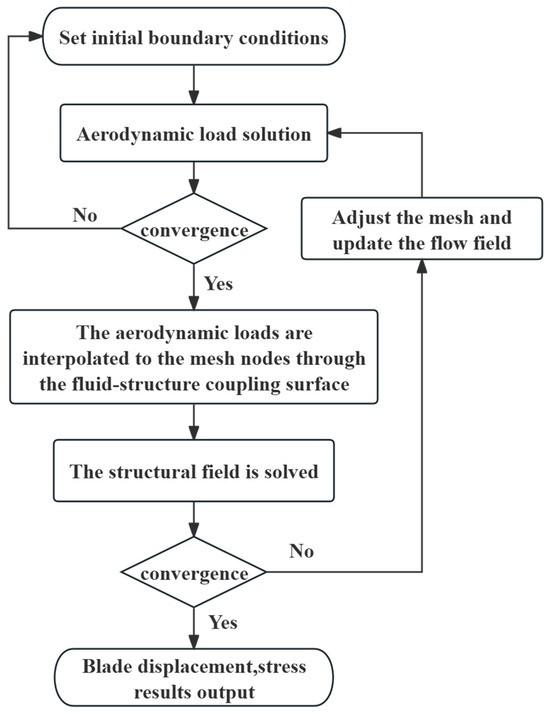
Figure 1.
Process diagram of the bidirectional CFD-CSD coupled method.
2.1. Flow Field Solution Method
The Reynolds-averaged Navier–Stokes equations were employed for the flow field solution [13]. Spatial discretization primarily uses the first-order upwind difference scheme. The convection terms were treated with a high-resolution (HR) scheme, while the temporal discretization adopted the lower–upper symmetric Gauss–Seidel (LU-SGS) implicit time integration method.
In the Equation (1), is the vector of conservative variables; is the vector of convective fluxes; and R, S, T are the vectors of viscous fluxes.
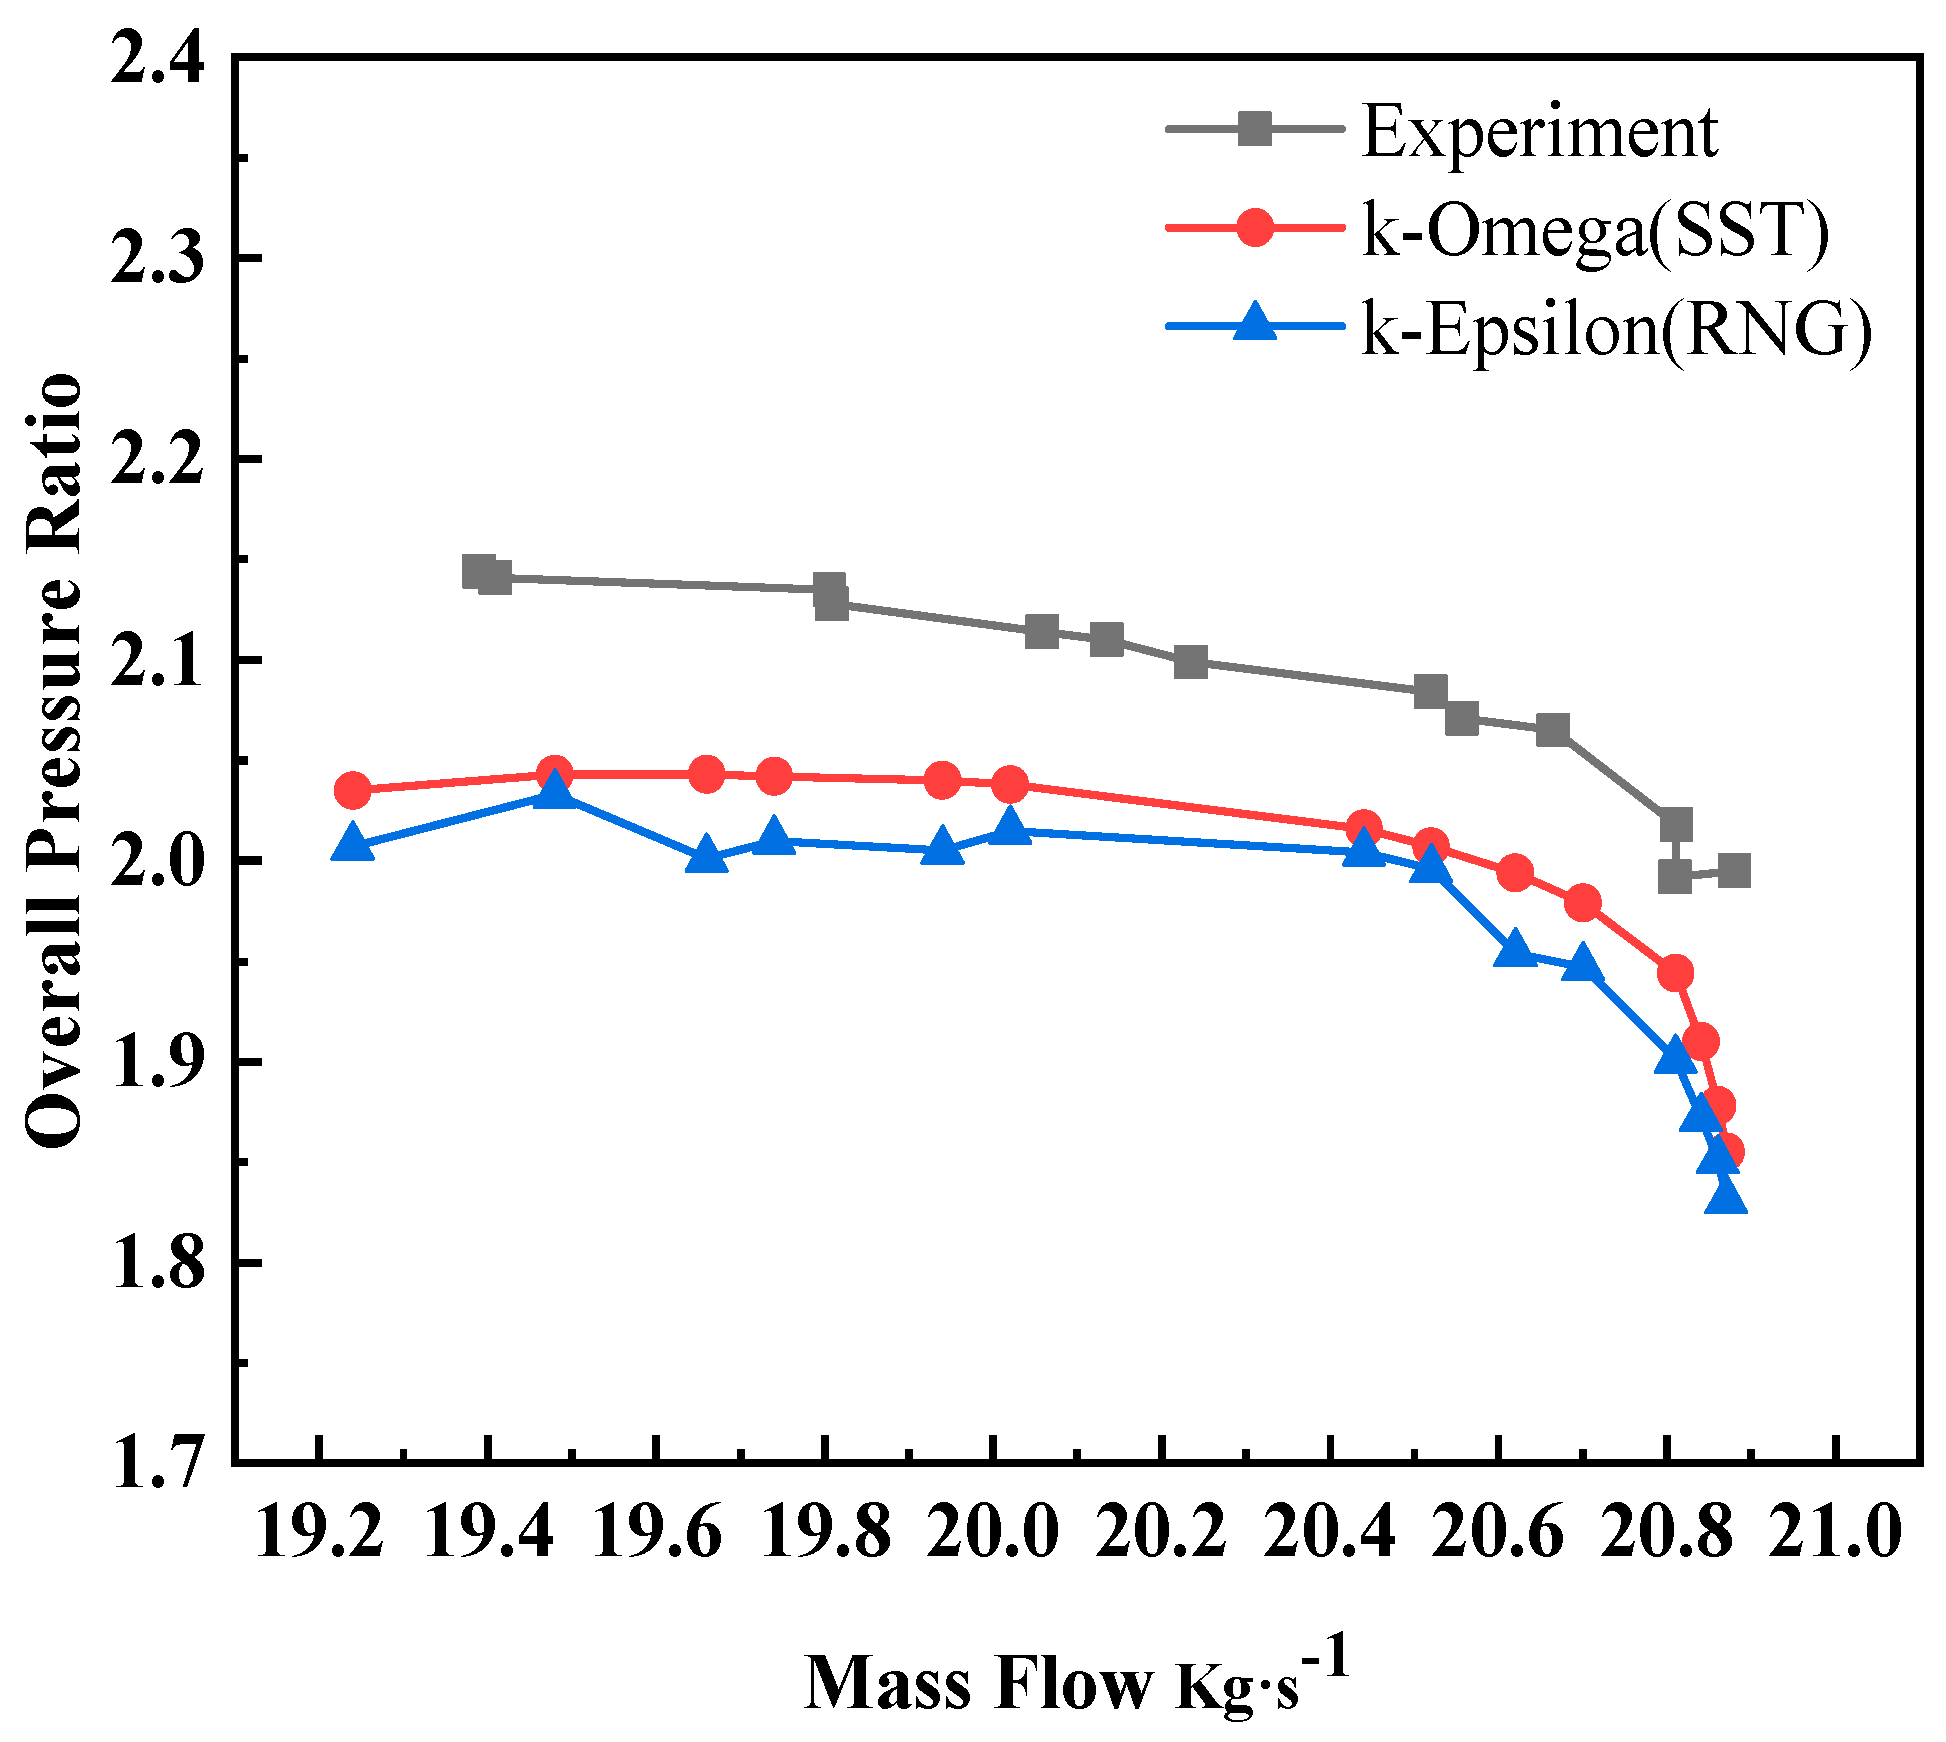
During numerical simulations of axial-flow compressors, turbulence models such as the k-ε model and the k-ω model are commonly used. To ensure computational accuracy, the k-ω shear stress transport (SST) model and the k-ε renormalization group (RNG) model were specifically used to simulate the performance of the compressor rotor blades. The simulation results, as presented in Figure 2, indicate that the SST model provided closer agreement with experimental data. Consequently, the SST model was selected for subsequent numerical simulations of the axial-flow compressor.
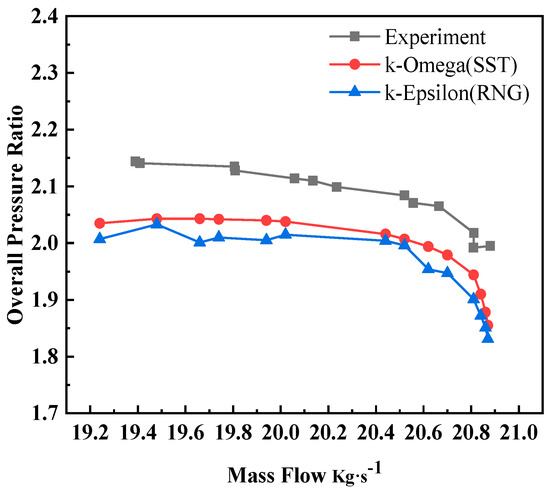
Figure 2.
Computation results with different turbulence models.
2.2. Structural Solution Method
In the solid field, the primary concern is the deformation of solids caused by the forces exerted by the fluid field. The conservation equations for the solid part are derived from Newton’s second law:
In the Equation (2), represents the solid density, is the Cauchy stress tensor, is the volume force vector, and is the local acceleration vector in the solid domain.
2.3. Data Transfer Method
In the coupled computation process, the method of conservative profile-preserving interpolation is utilized for data exchange across the coupling interface [14]. The data exchange process can be described as follows:
where in (3) and (4), represents the displacement of the aerodynamic points; represents the displacement of the structural points; is the interpolation matrix; denotes the aerodynamic loads; represents the structural equivalent loads; and are the virtual displacements of the aerodynamic and structural points, respectively.
If is independent of the displacement, then we have
Finally, the relationship between the structural equivalent loads and the aerodynamic loads is derived, which can be expressed as
3. Meshing and Computational Method Validation
3.1. Research Objectives
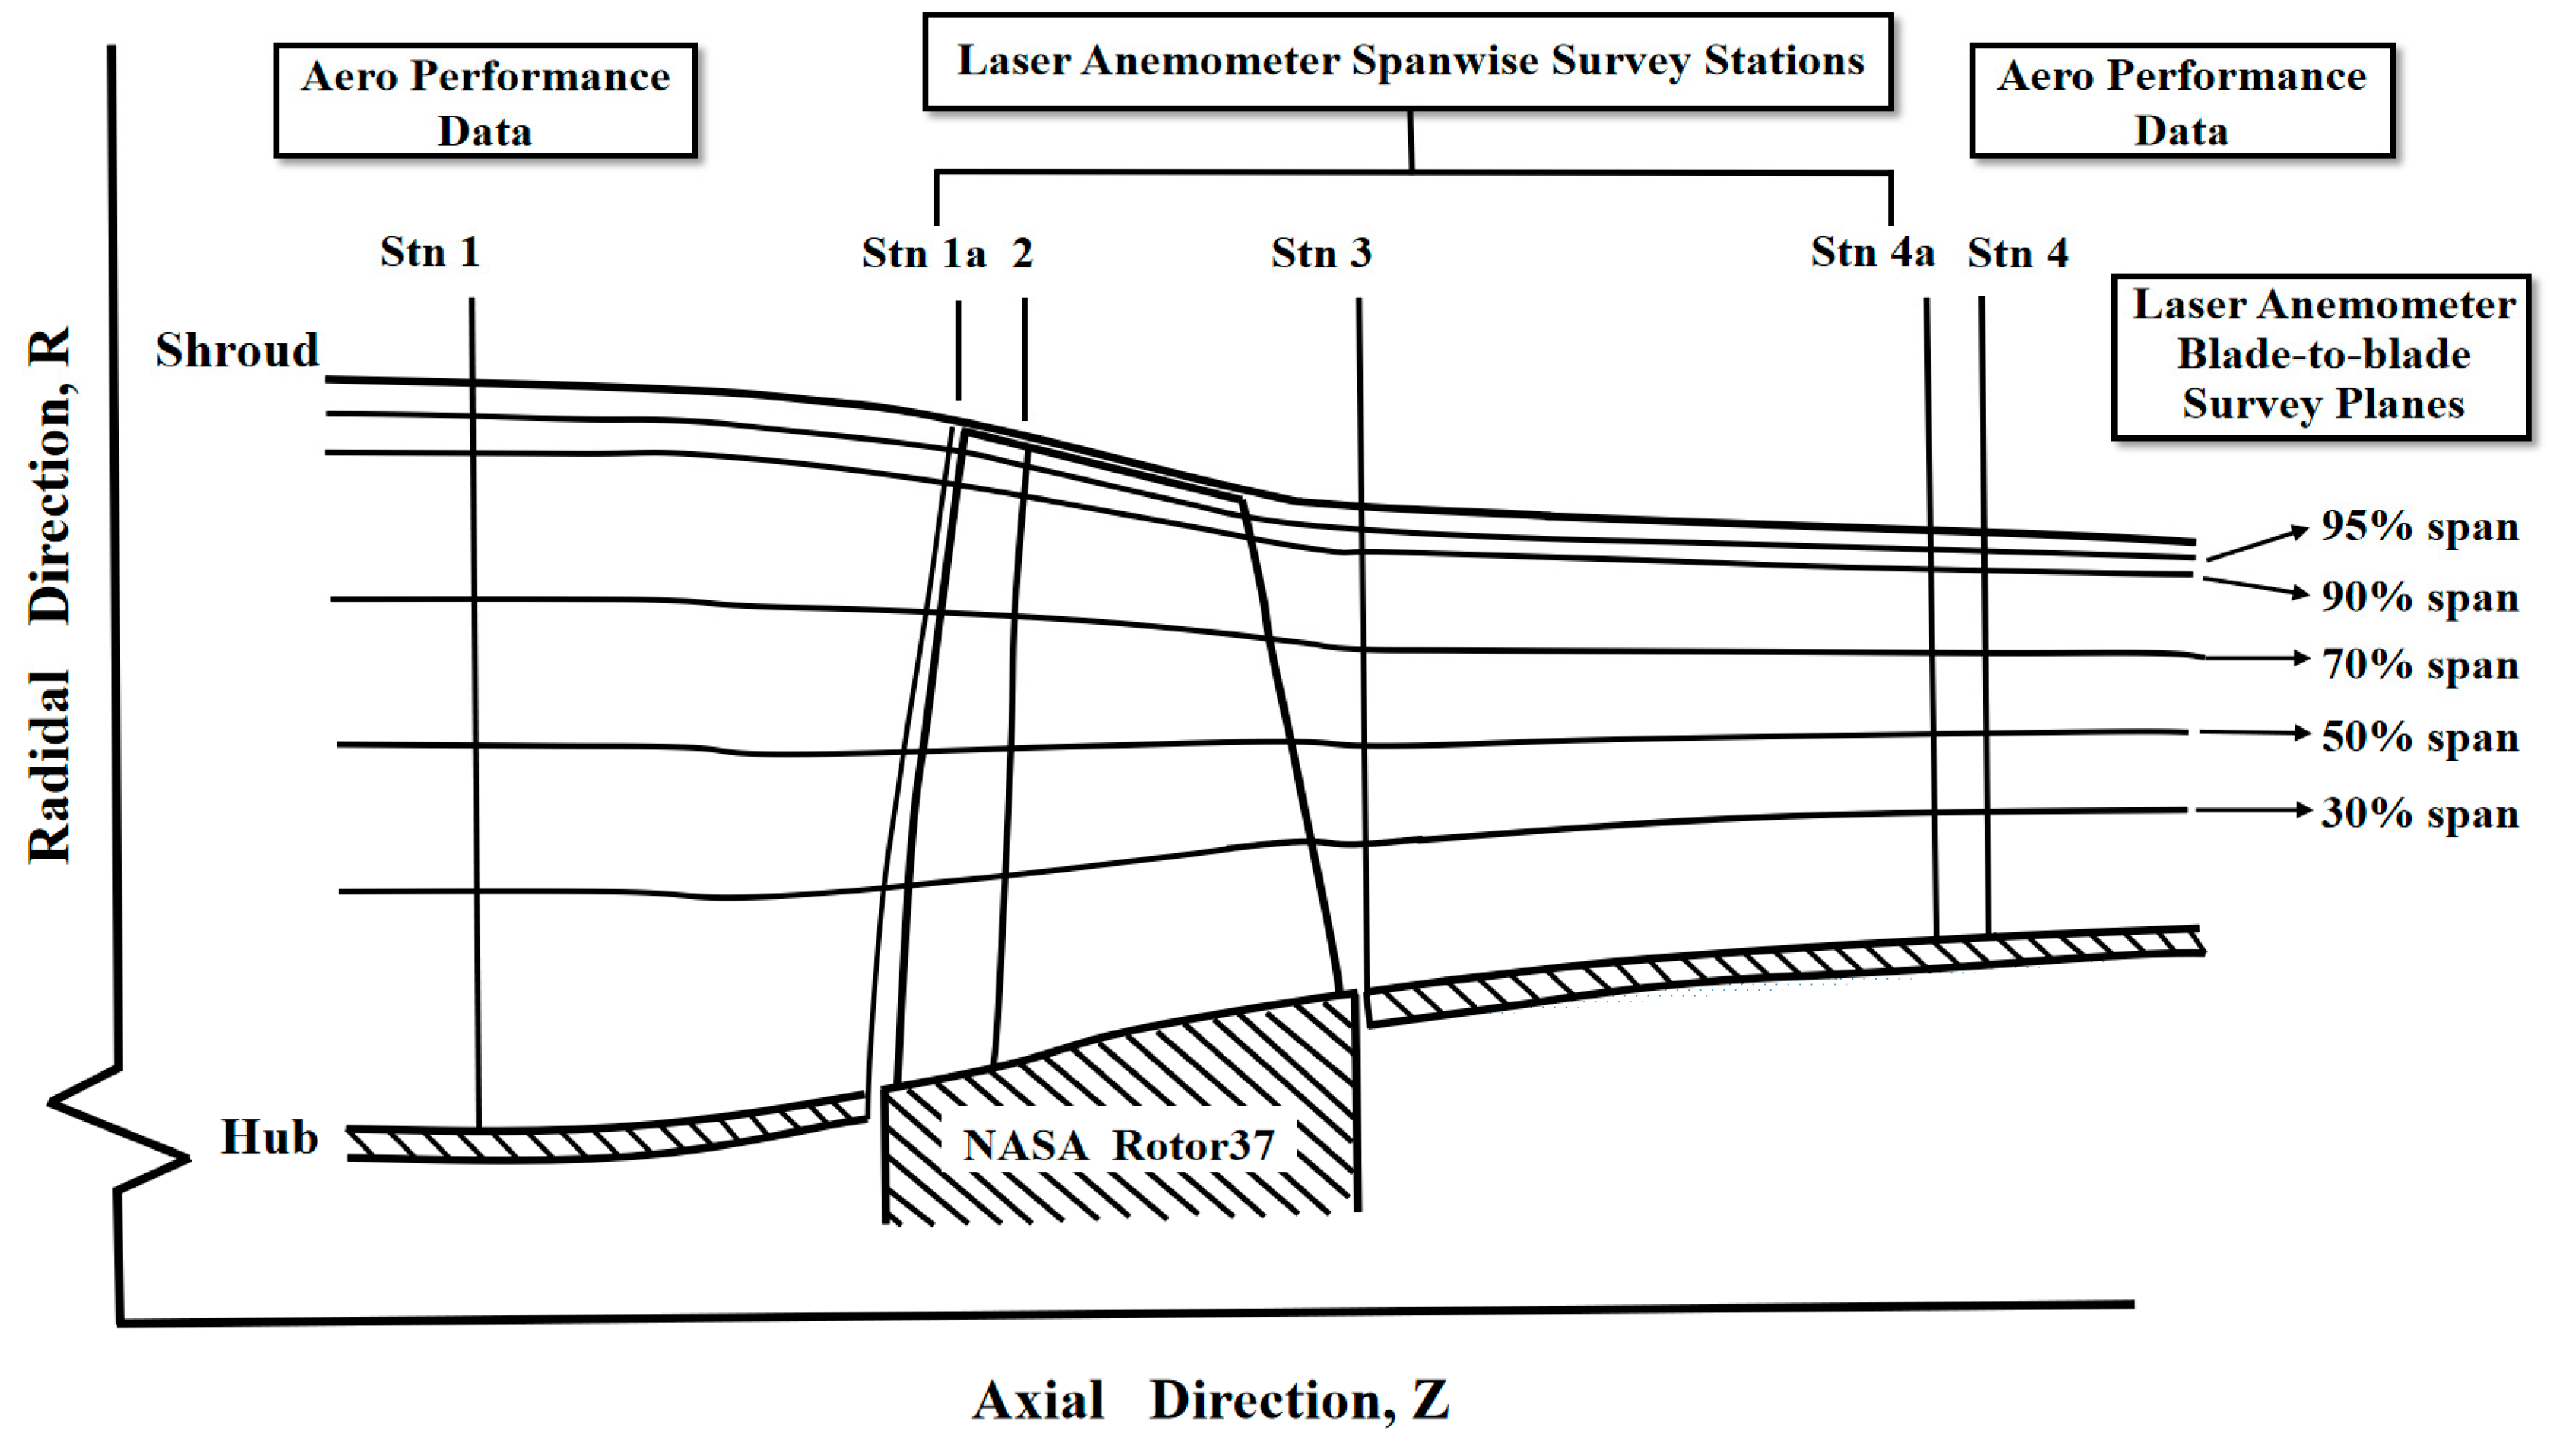
This research focused on Rotor37 [15], an axial flow compressor rotor designed and tested at the NASA Lewis Research Center. This rotor is commonly utilized in test cases for transonic axial flow compressor rotors, and it has been subject to extensive research and testing by numerous domestic and international research centers, yielding a wealth of experimental data. The basic design parameters are summarized in Table 1. Figure 3 shows the test positions and computational domain of the NASA Rotor 37 transonic rotor flow field [16].

Table 1.
Basic design parameters of the NASA Rotor37.
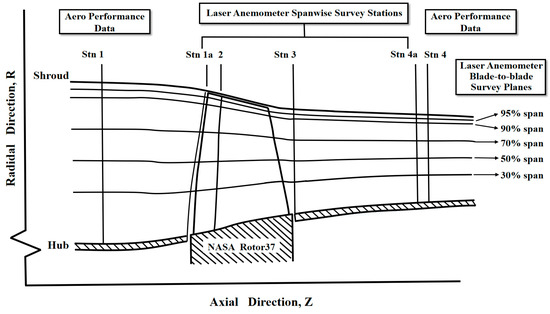
Figure 3.
Test positions and computational domain of the NASA Rotor37 transonic rotor flow field.
3.2. Boundary Conditions for the Fluid Domain
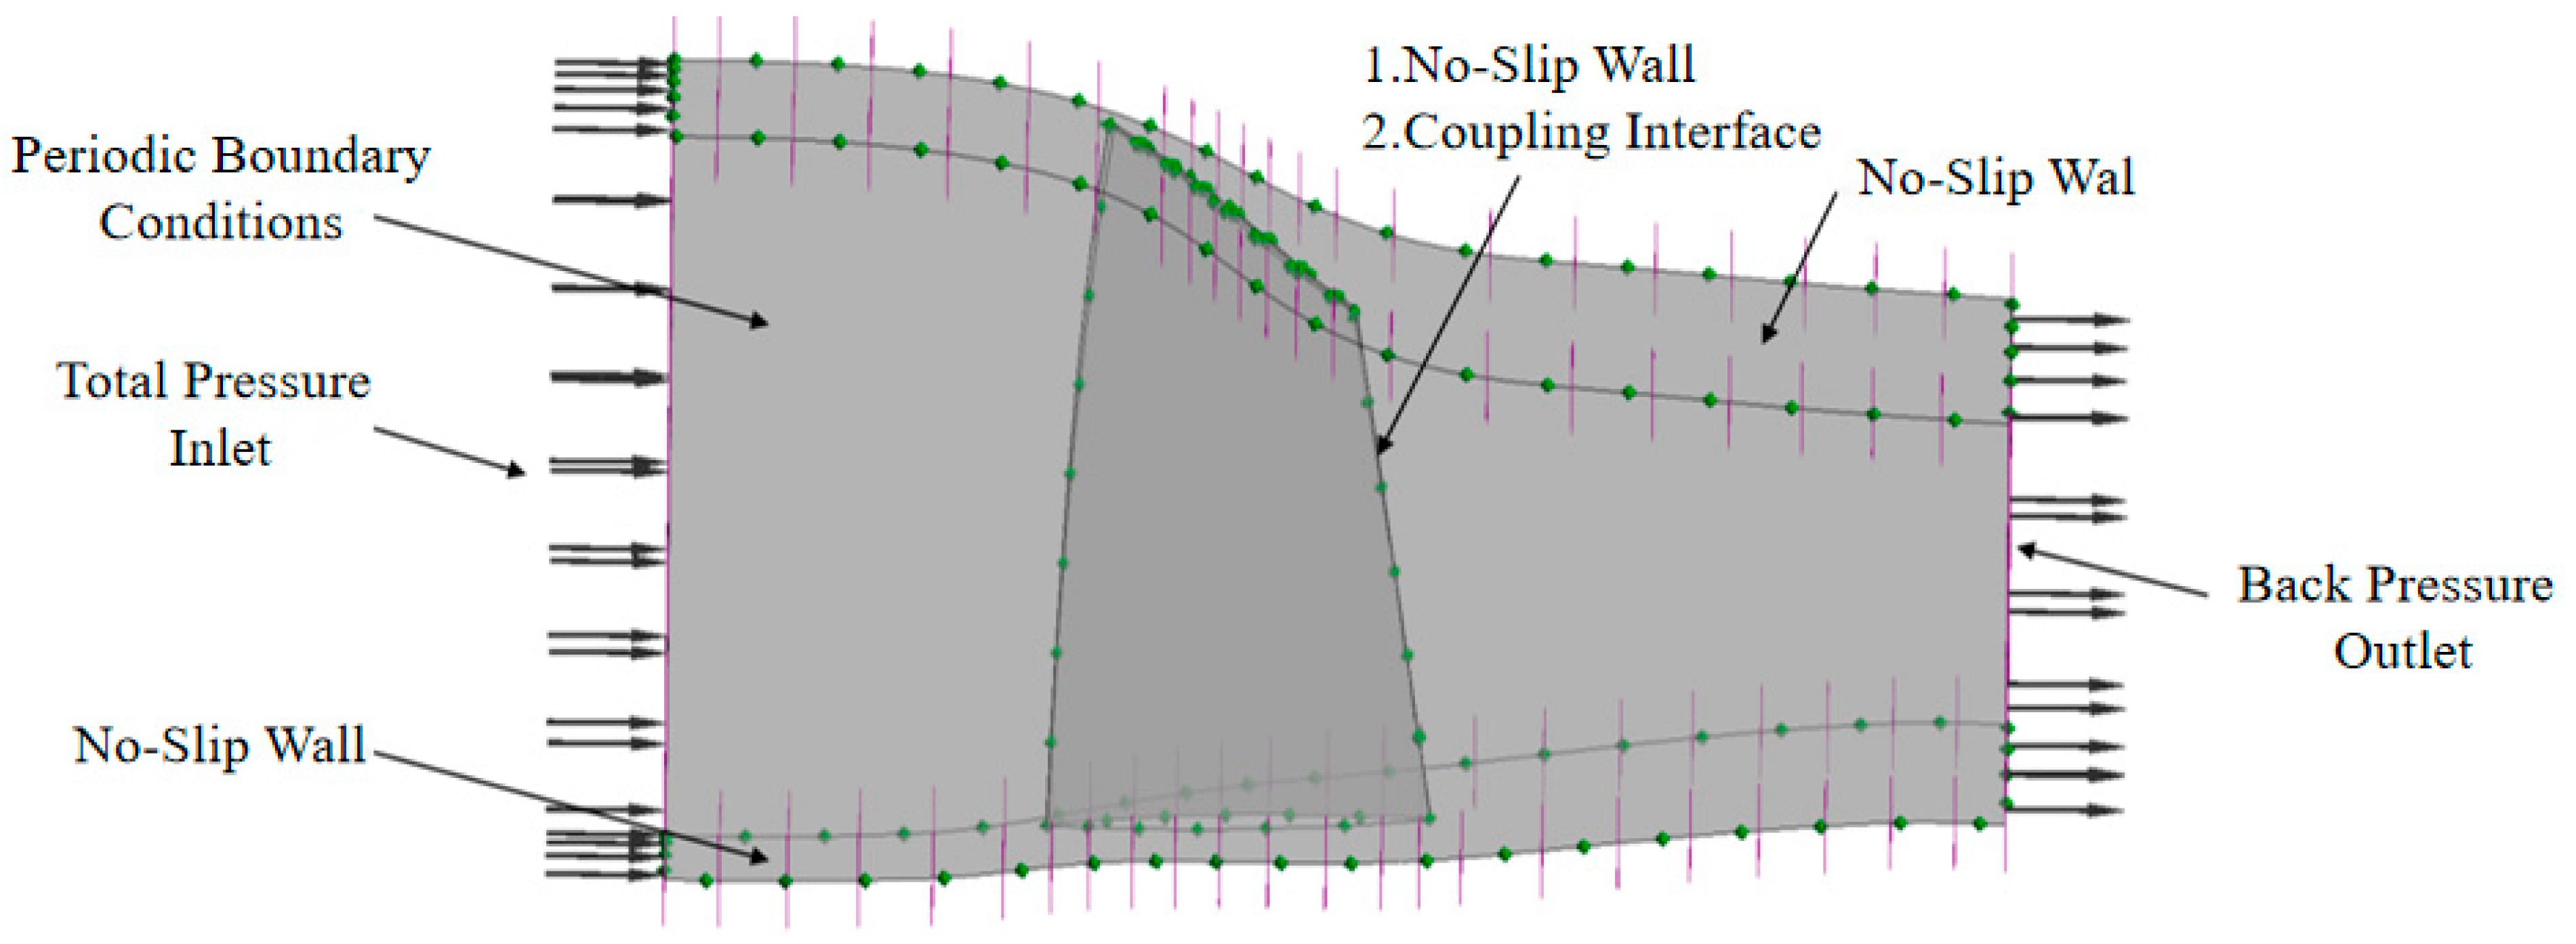
In the numerical simulation, the inlet conditions were set with a total temperature of 288.15 K and a total pressure of 0.1 MPa. The outlet condition was specified with back pressure, and the distribution of back pressure along the spanwise direction was determined using radial equilibrium equations. The last condition point before the numerical stall was identified as the near-stall condition by gradually increasing the outlet back pressure towards the stall point [17]. The blade passage on both sides was defined as periodic boundary conditions, while the blades, casing, and hub surfaces were set with adiabatic and no-slip boundary conditions. The blade walls were set as the fluid–structure interaction interface, where pressure was transmitted to the structural solver and mesh deformation from the structural solver was received. The blade flow field model and boundary conditions are shown in Figure 4.
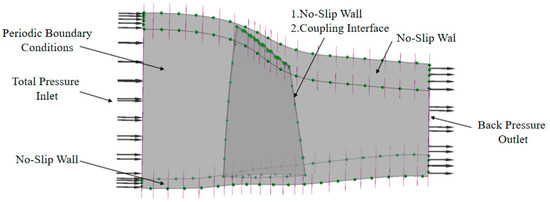
Figure 4.
The blade flow field model and boundary condition schematic diagram.
3.3. Boundary Conditions for the Structural Domain
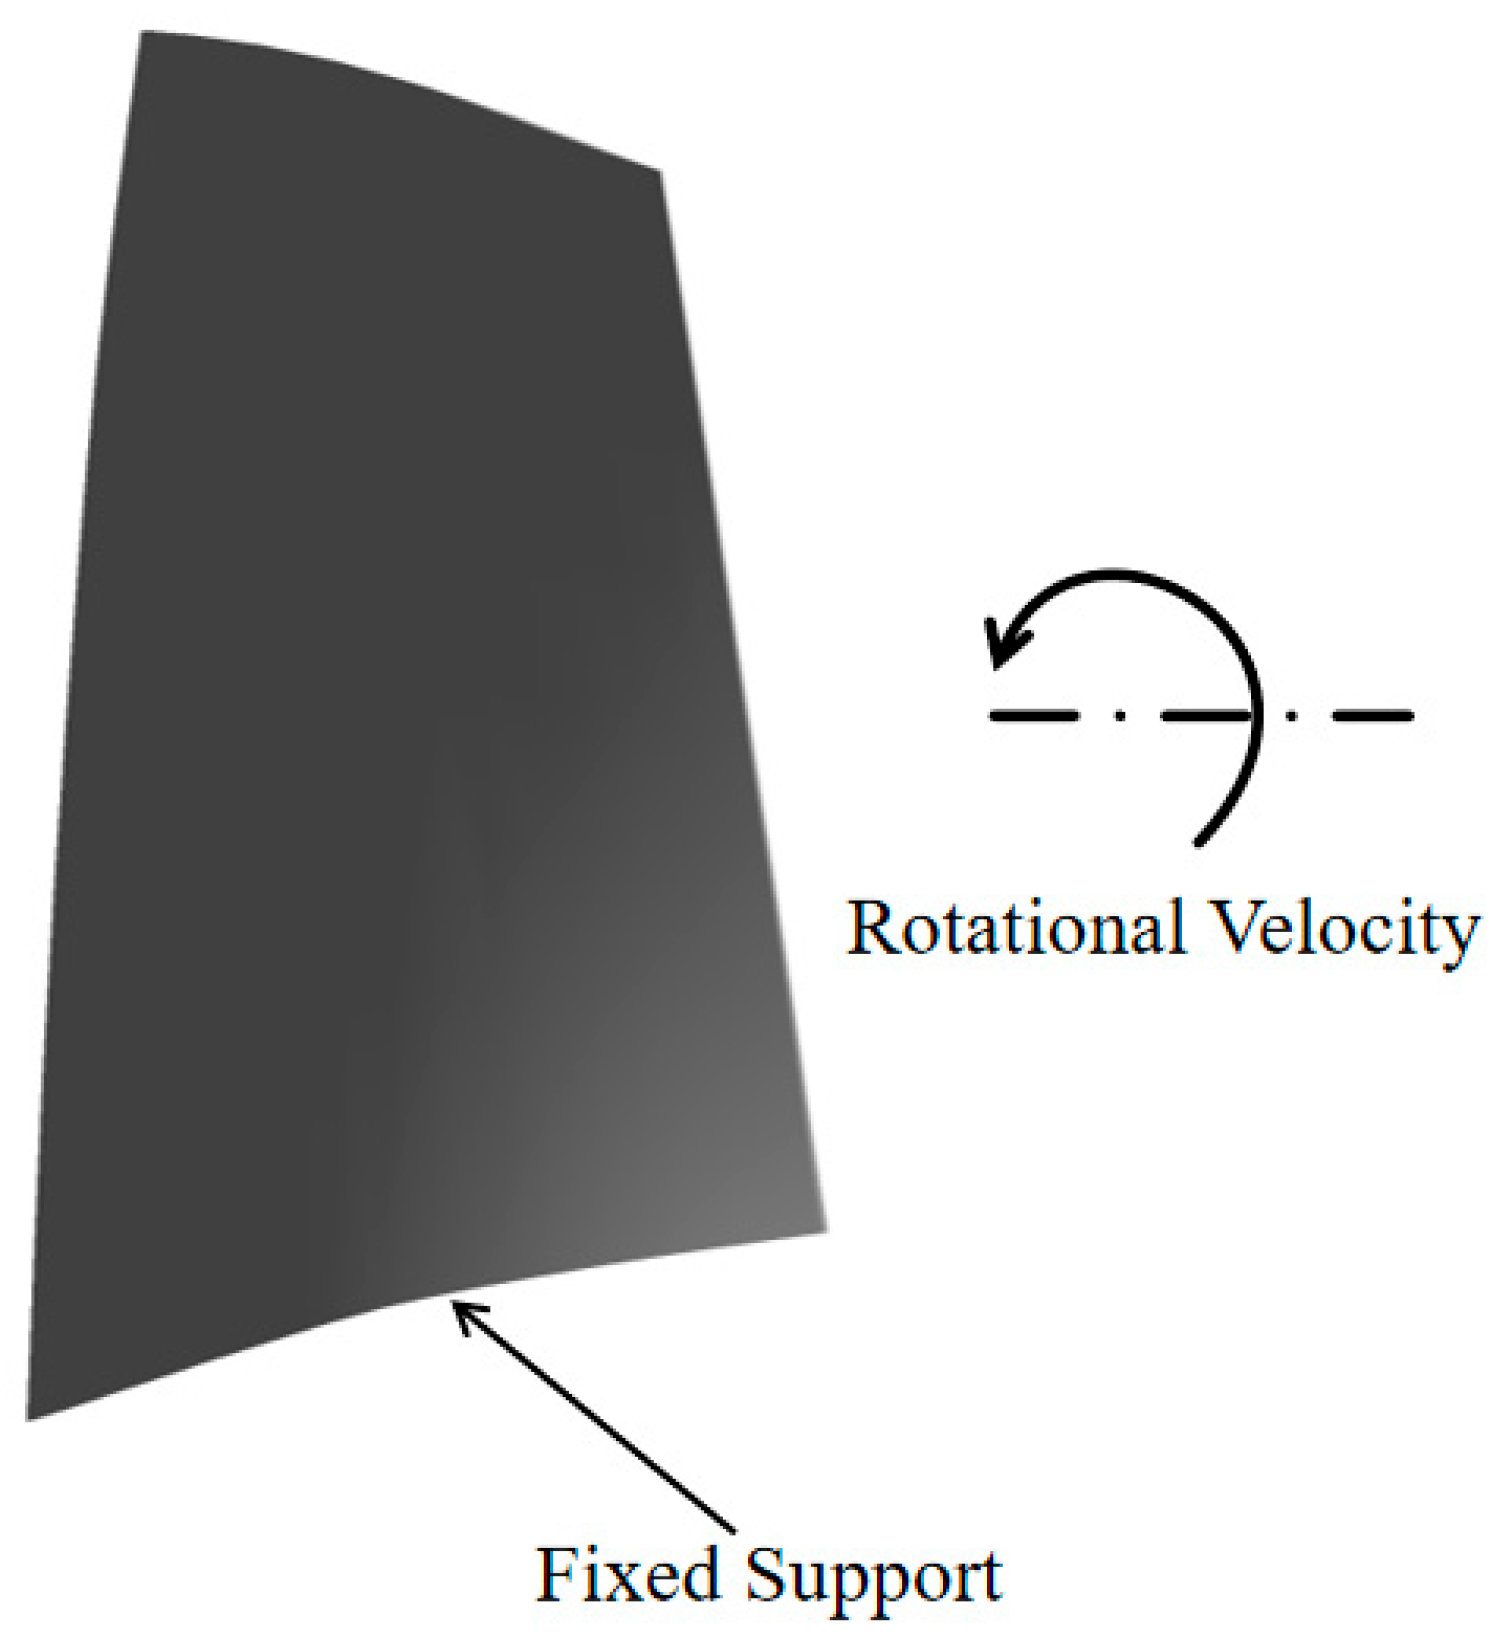
The boundary conditions for the structural solver were set as follows: A fixed constraint was applied at the interface where the blade connected to the hub. A rotational velocity was imposed on the entire blade. A fluid–structure interaction interface was added to the suction surface, pressure surface, and blade tip of the blade. This configuration enabled the blade surface to capture the aerodynamic forces transmitted from the fluid field during coupled calculations and simultaneously provided deformation feedback to the fluid field. The blade structural field model and boundary conditions are shown in Figure 5.

Figure 5.
The blade structural field model and boundary condition schematic diagram.
3.4. Meshing
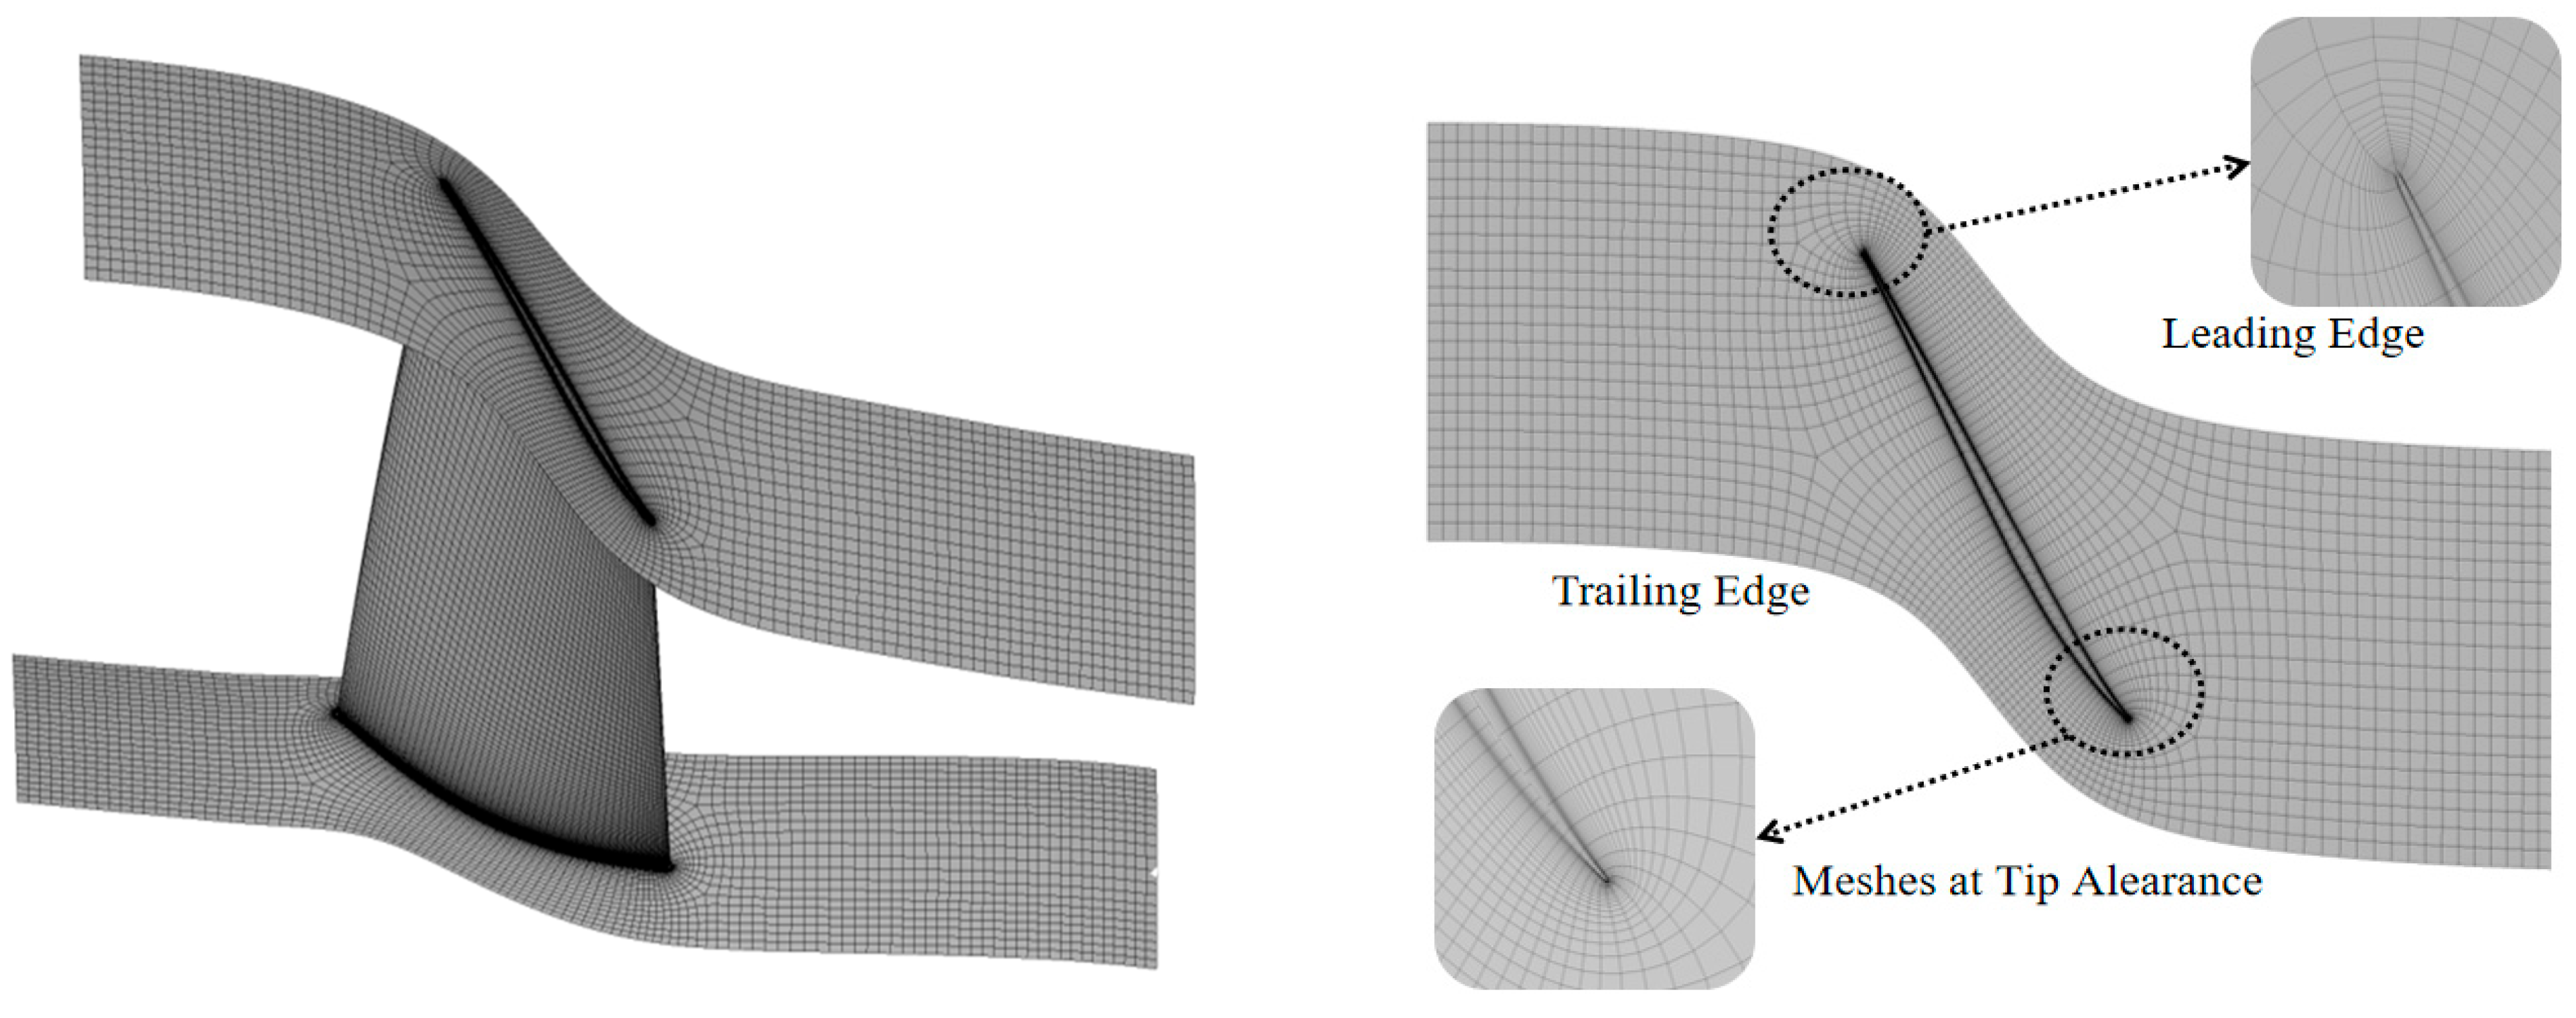
The single-channel spatial discrete mesh of the axial flow compressor is generated based on CFX/TurboGrid [18], a hexahedral structured mesh generator specially designed for rotating machinery. In this paper, sub-area meshing was used, with an O4H-type mesh topology for the interior of the channel, an H-type mesh topology for the inlet and outlet, and an O-type mesh topology for the blades. The leaf top gap adopted butterfly mesh topology, the inner layer was an H-type mesh structure, and the outer layer surrounded the O-mesh. The number of single-channel mesh nodes was 741,244, and the number of meshes was 706,419. The mesh schematic is shown in Figure 6.
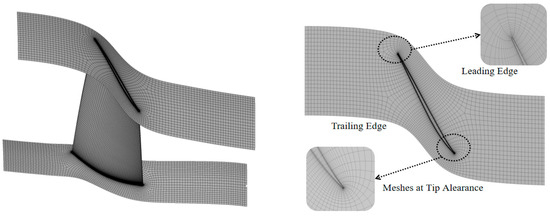
Figure 6.
Schematic of blade single passage meshing.
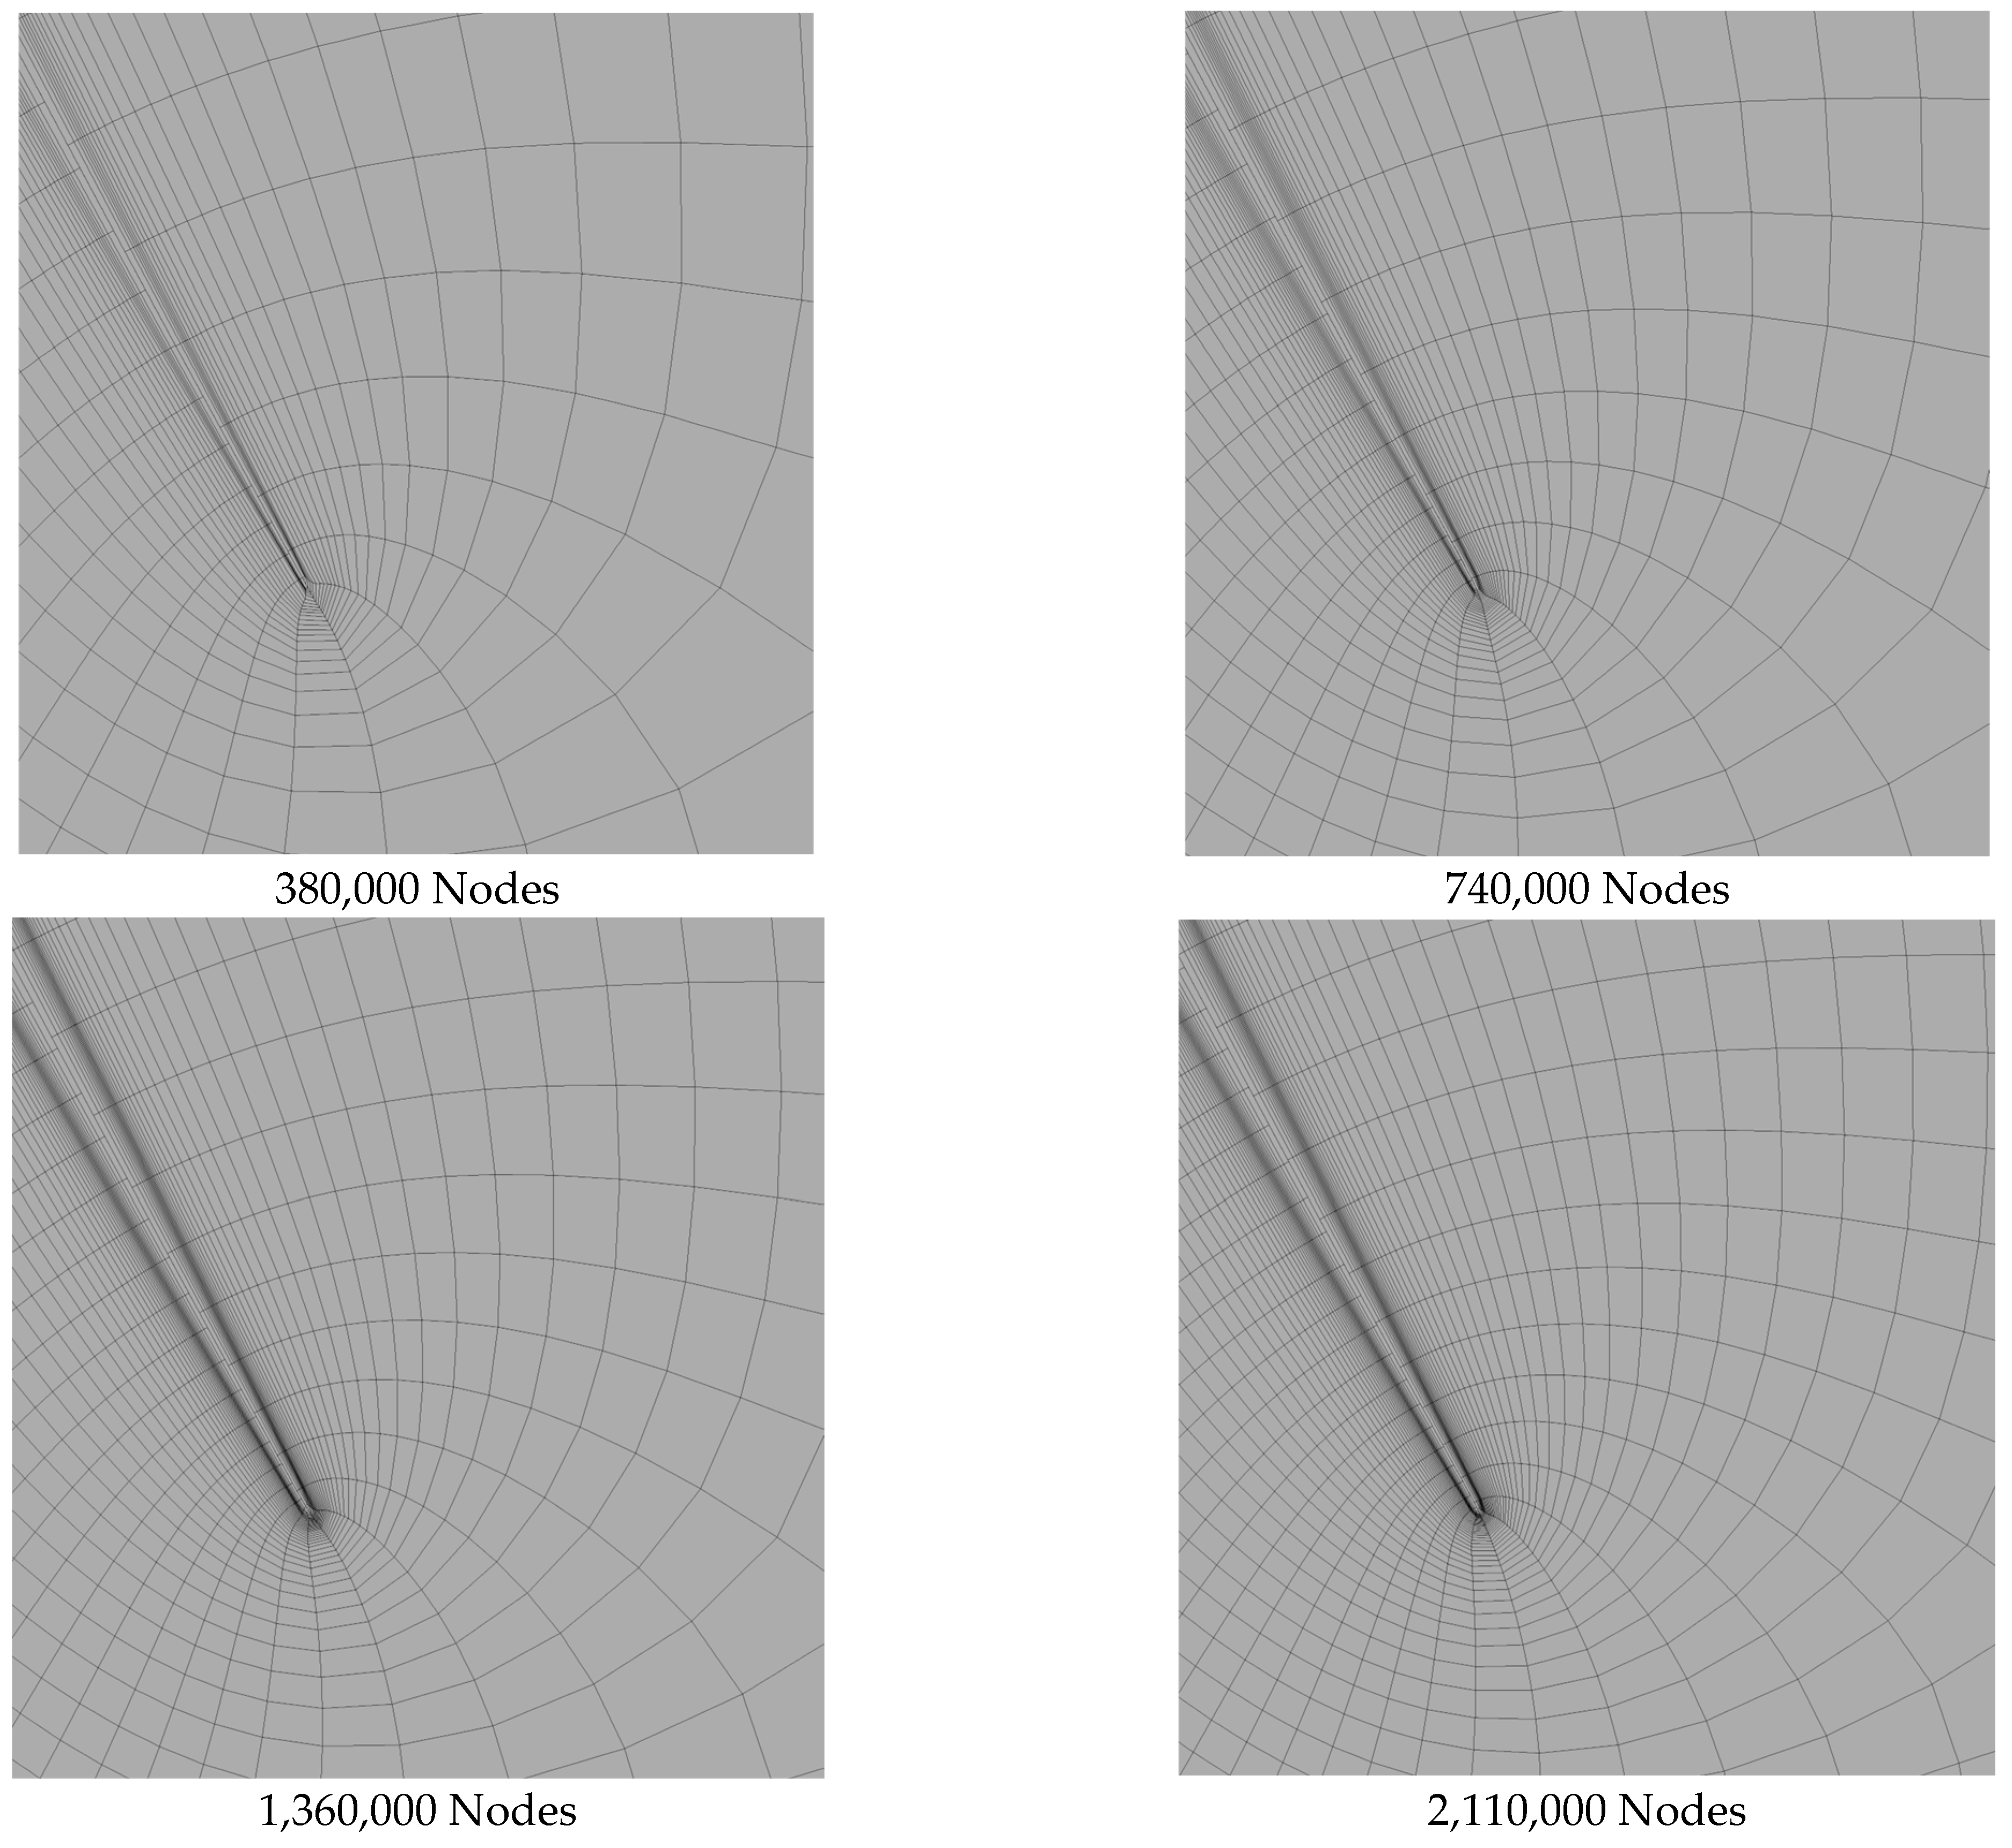
To appraise the influence of the number of meshes on the numerical calculation results, eight sets of meshes with different numbers of nodes, 380,000, 470,000, 580,000, 740,000, 1,030,000, 1,360,000, 1,660,000, and 2,110,000, were obtained by adjusting the mesh sizes of the surface area of the blades and the top clearance of the blades, respectively. Considering that this paper focused on the near-stall condition of axial-flow compressors, different outlet back pressures (0.102 MPa, 0.108 MPa, 0.114 MPa, 0.120 MPa, and 0.125 MPa) were considered to ensure the accuracy of mesh irrelevance, and the total pressure ratio was used as a parameter to assess the impact of mesh density on performance. Figure 7 shows the mesh around the blade for different numbers of nodes at 0.120 MPa.

Figure 7.
Mesh diagrams near the blade for different numbers of nodes.
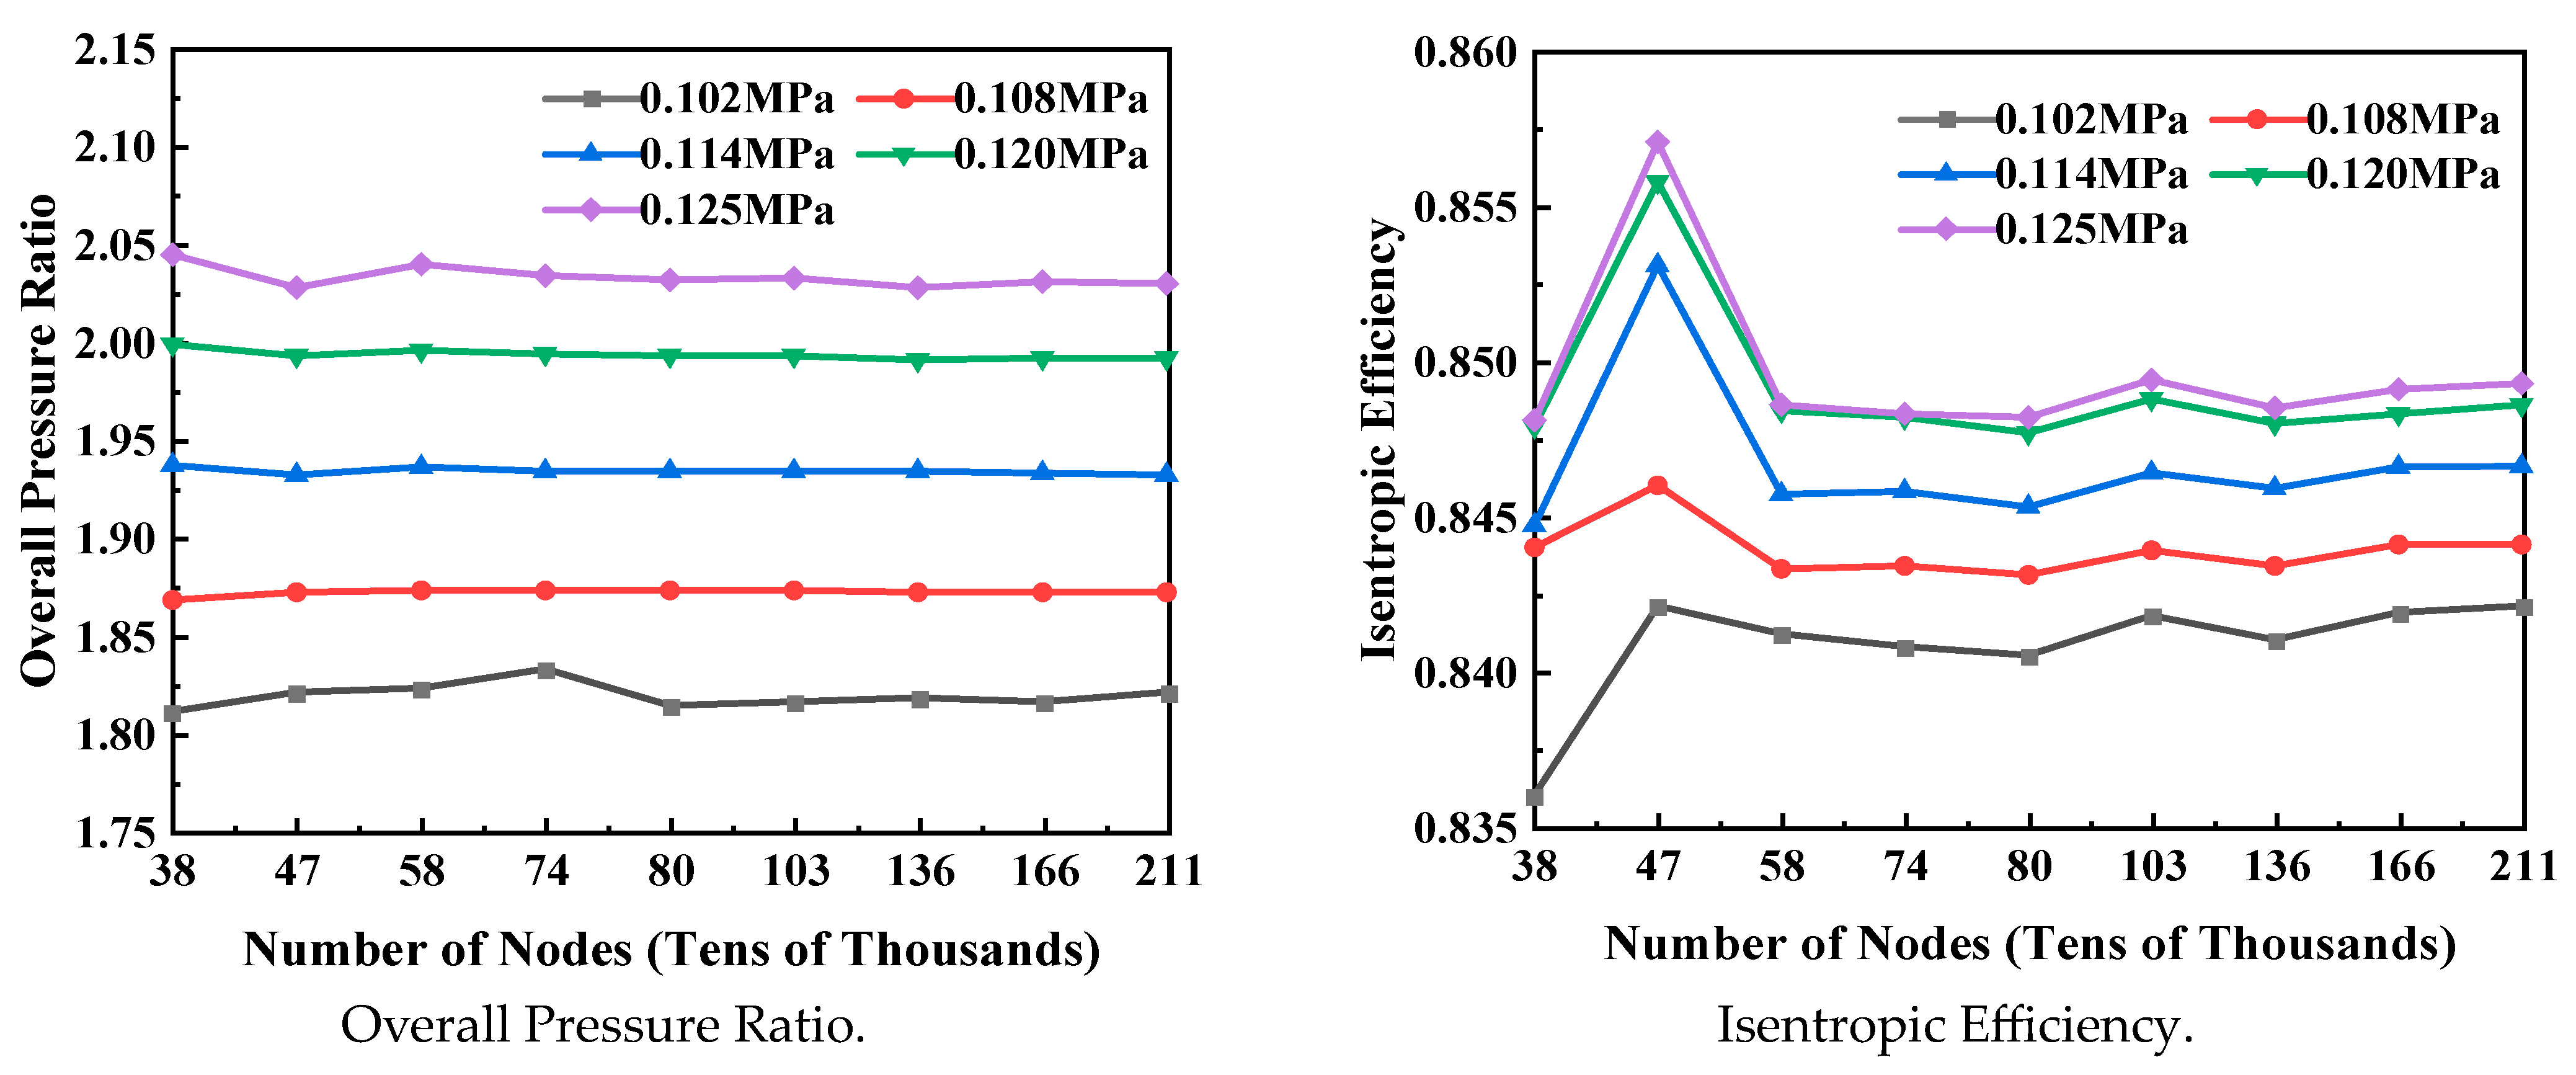
As shown in Figure 8, under varying outlet back pressure conditions, when the mesh node count reached 740,000, the maximum deviation in total pressure ratio compared to other mesh quantities was 0.5%. Therefore, to balance computational efficiency and accuracy, this study ultimately selected a mesh node count of 740,000.
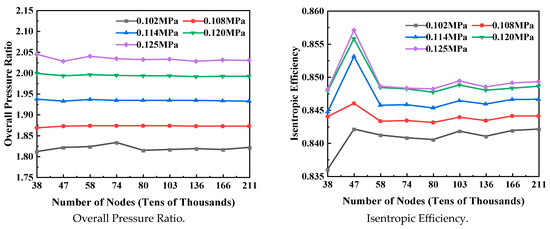
Figure 8.
Mesh independence study.
3.5. Method Validation
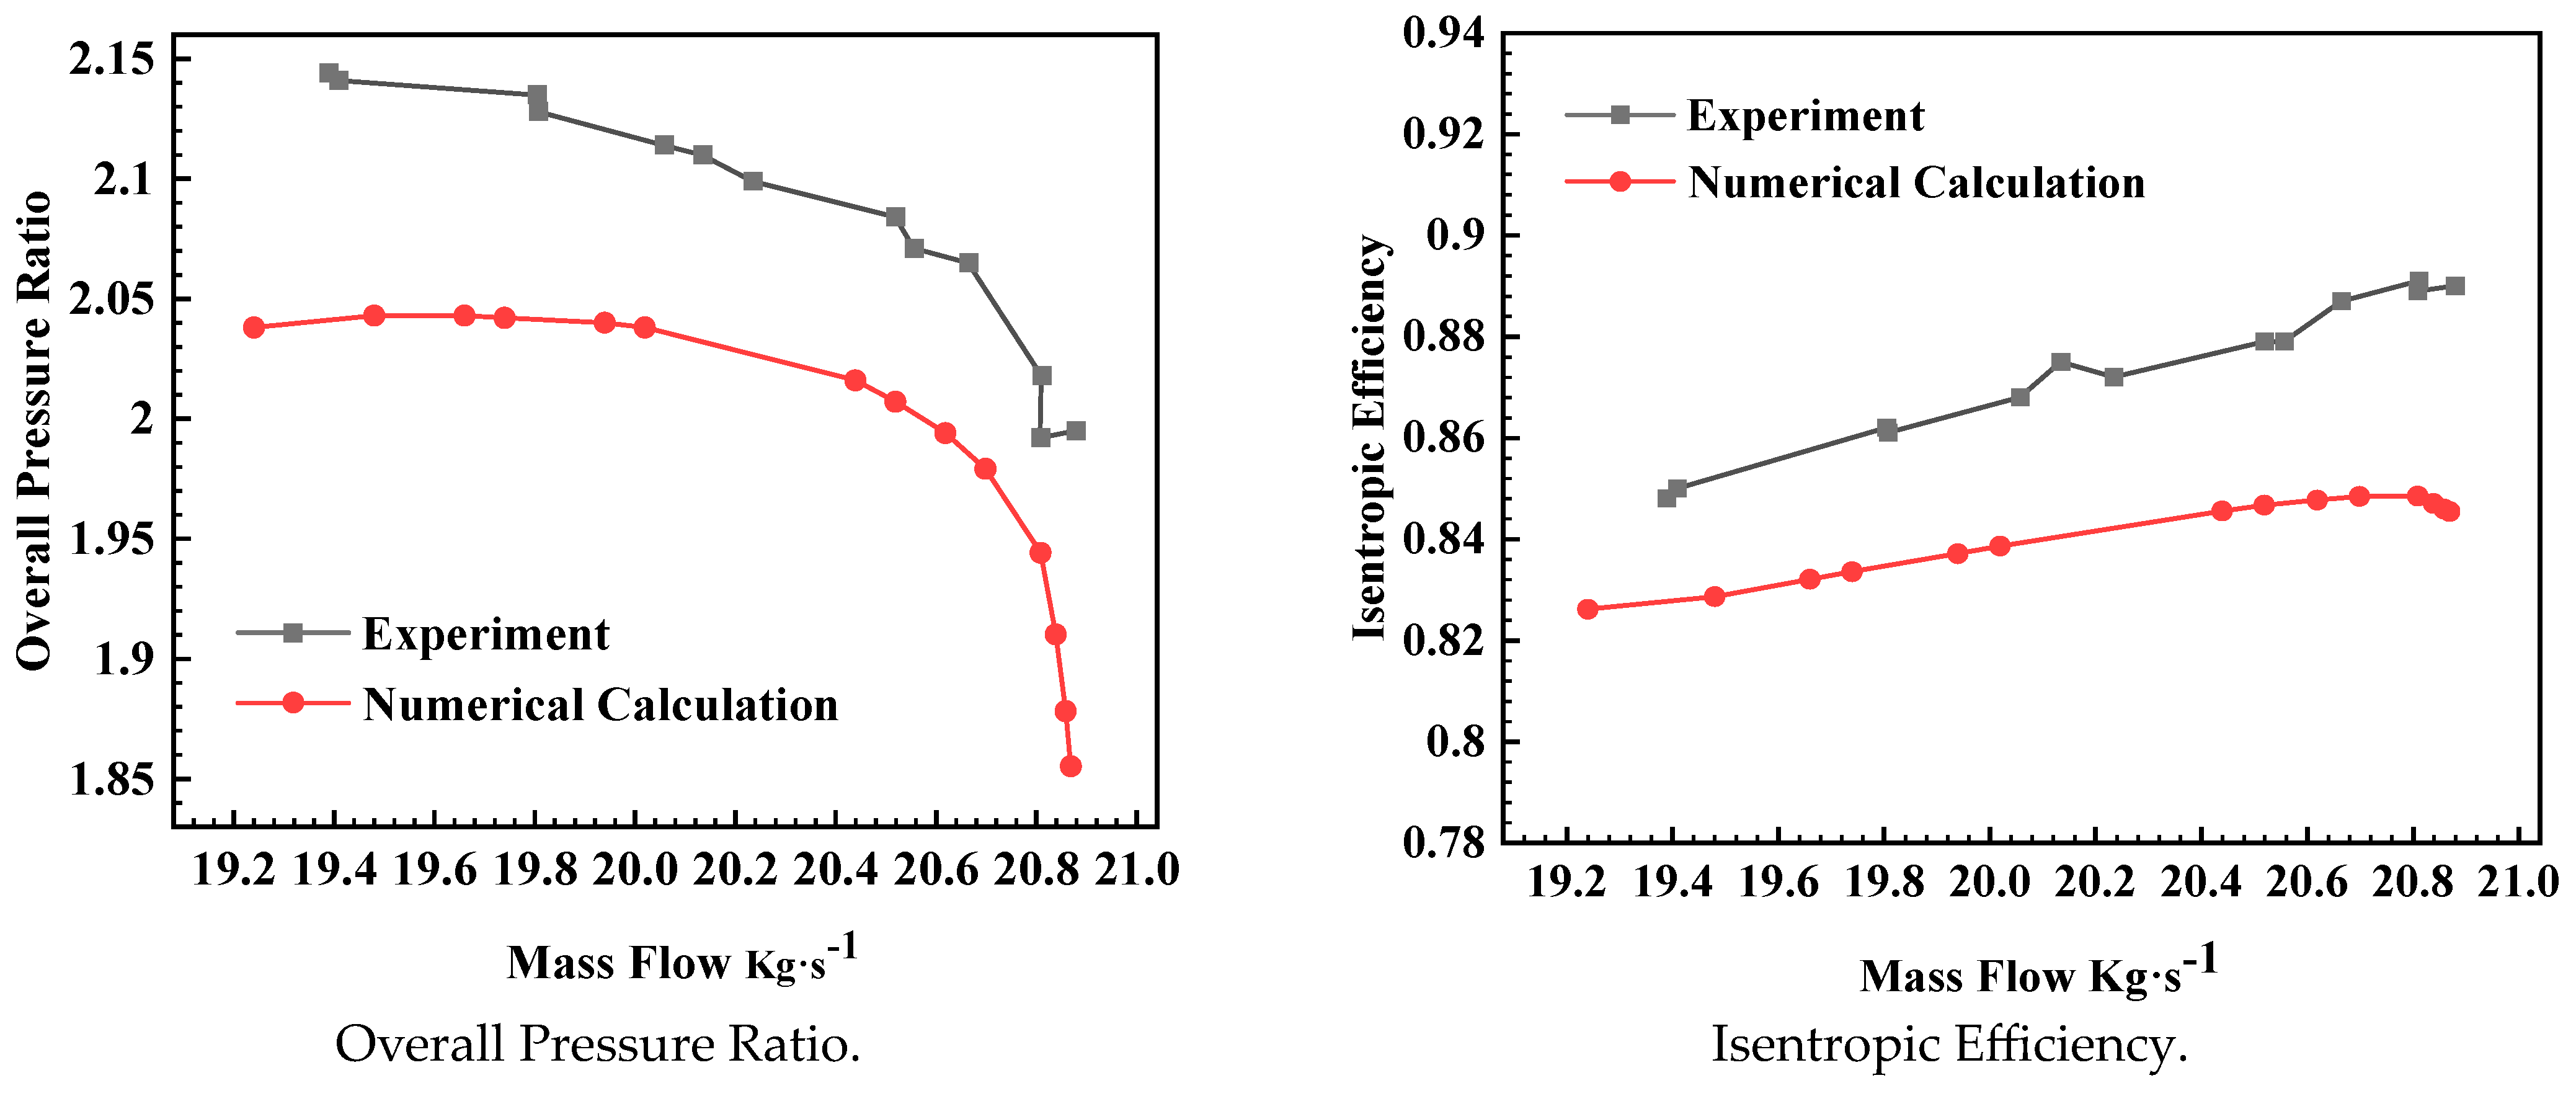
Figure 9 presents a comparative analysis between the numerical simulation results and experimental data [19] under the designed rotational speed. It is evident that the variation trend of the numerical results closely aligns with that of the experimental findings. Upon comparison with the experimental data, it is noted that the numerical computation exhibited a discrepancy of 3.68% for the near-design point total pressure ratio and 3.67% for the isentropic efficiency. At the designed rotational speed, the flow rate at the rotor choke point was measured at 20.93 kg/s, while the numerical calculation yielded 20.90 kg/s, resulting in a marginal difference of 0.14%. Similarly, at the rotor near-stall point, the flow rate was recorded at 19.36 kg/s in contrast to the numerical prediction of 19.24 kg/s, indicating a slight deviation of 0.62%. Overall, the numerical results tended to underestimate the experimental values, which may be attributed to the limitations in experimental measurements, where the highest measurement position can only reach 95% of the blade height, while numerical simulations can capture flow losses across the entire blade height.

Figure 9.
Comparison of calculated and experimental compressor characteristics.
The analysis indicates that the predicted characteristics and trends of the numerical simulation closely aligned with the experimental results. Moreover, the discrepancies in the flow choke point and stall point between numerical predictions and experimental values were minimal and fell within acceptable margins. Therefore, it can be concluded that the numerical computational method employed in this study is reliable.
4. Results and Discussion
4.1. Influence of Different Loads on Blade Stress and Strain
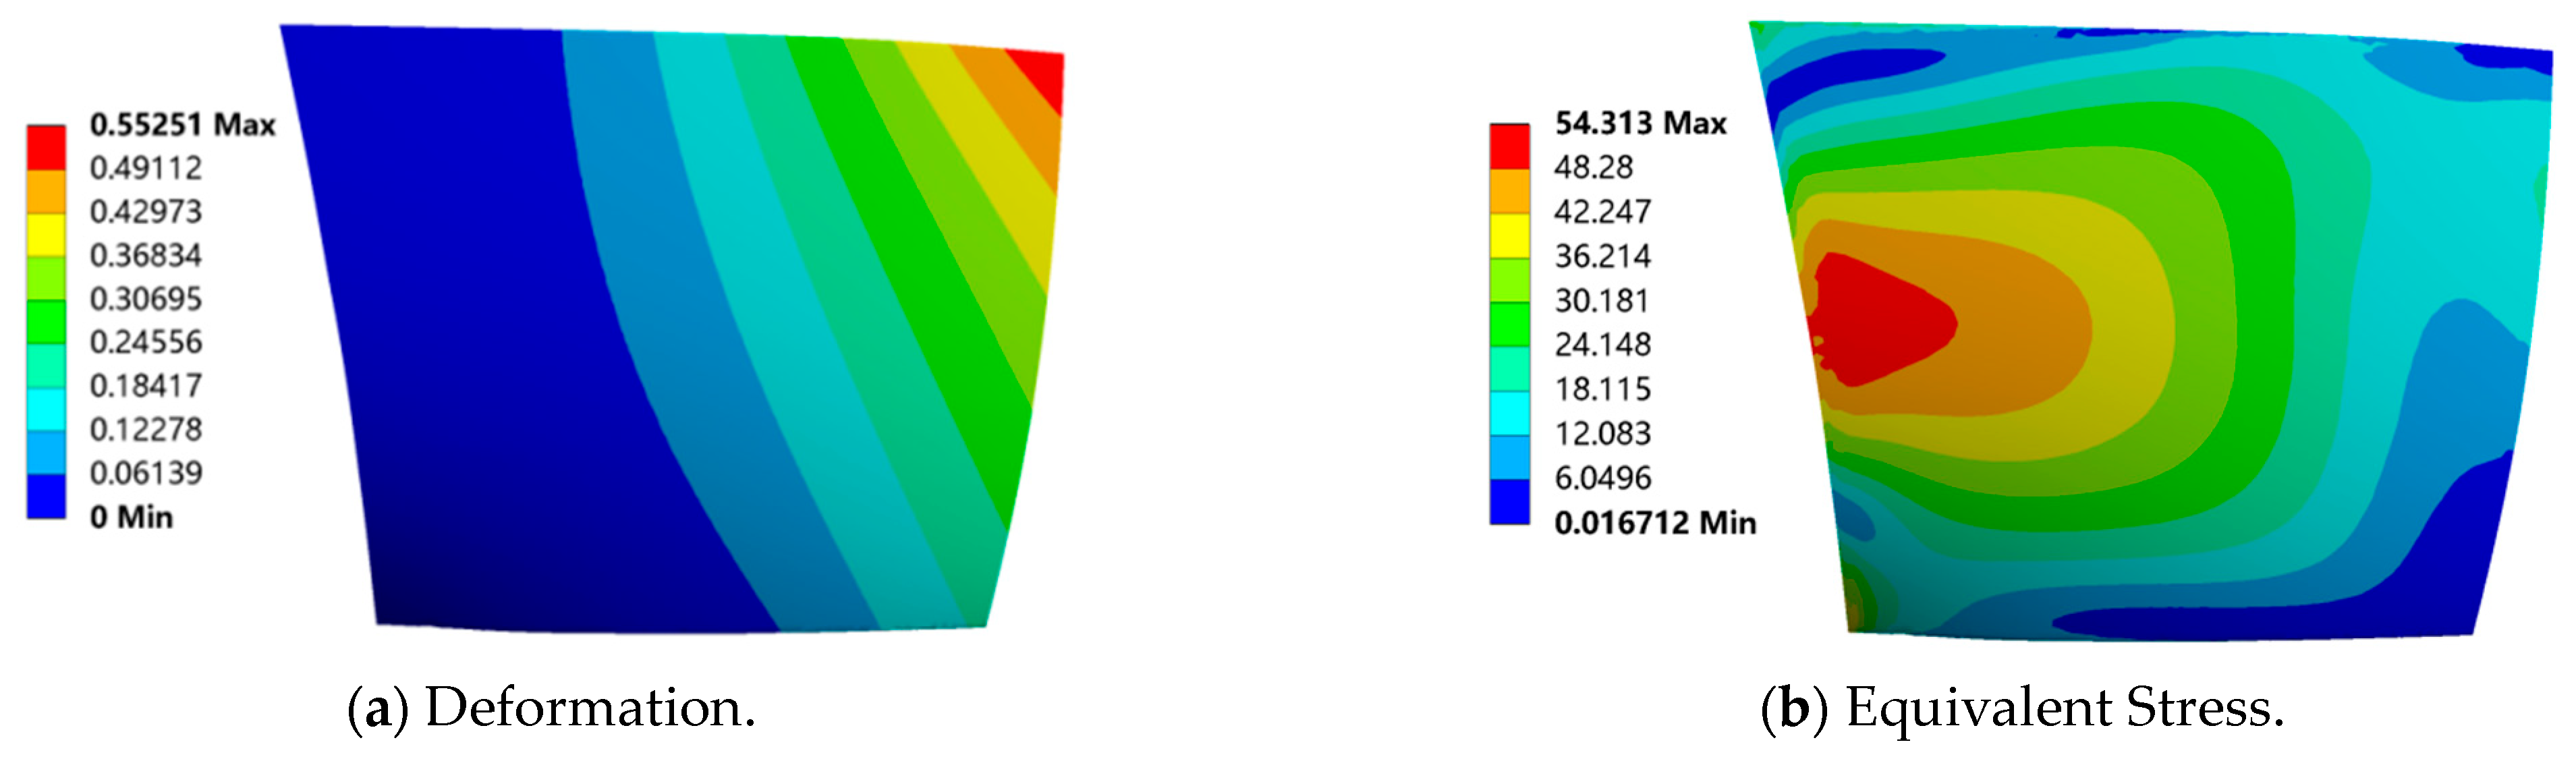
During the operation of compressor blades, they are subjected to various load factors. To gain a clearer understanding of how different loads affect the deformation and stress of the blades, this paper analyzed the blade under the following load conditions: aerodynamic load, centrifugal load, and a combination of aerodynamic and centrifugal load. Figure 10 , Figure 11 and Figure 12 depict the blade’s total deformation and equivalent stress contour maps under various loads. From Figure 10, it can be observed that the maximum equivalent stress on the blade under aerodynamic loading was relatively low. The maximum deformation occurred at the lead edge tip due to the generation of strong shock waves at the leading edge during high-speed rotation. The lead edge dimension was designed to be thinner to reduce shock wave resistance at the leading edge, resulting in reduced stiffness at the leading edge and significant deformation during rotation.
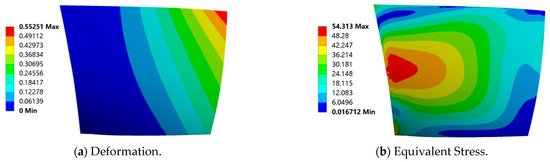
Figure 10.
Deformation and equivalent stress of blades under aerodynamic load.
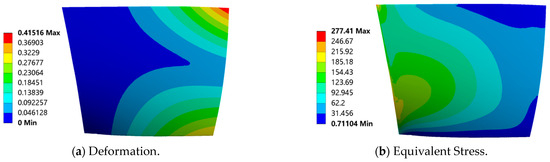
Figure 11.
Deformation and equivalent stress of blades under centrifugal load.
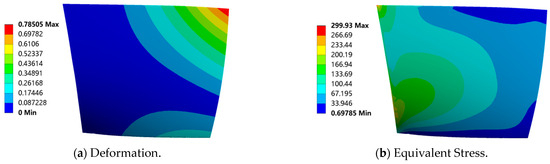
Figure 12.
Deformation and equivalent stress of blades under centrifugal and aerodynamic loads.
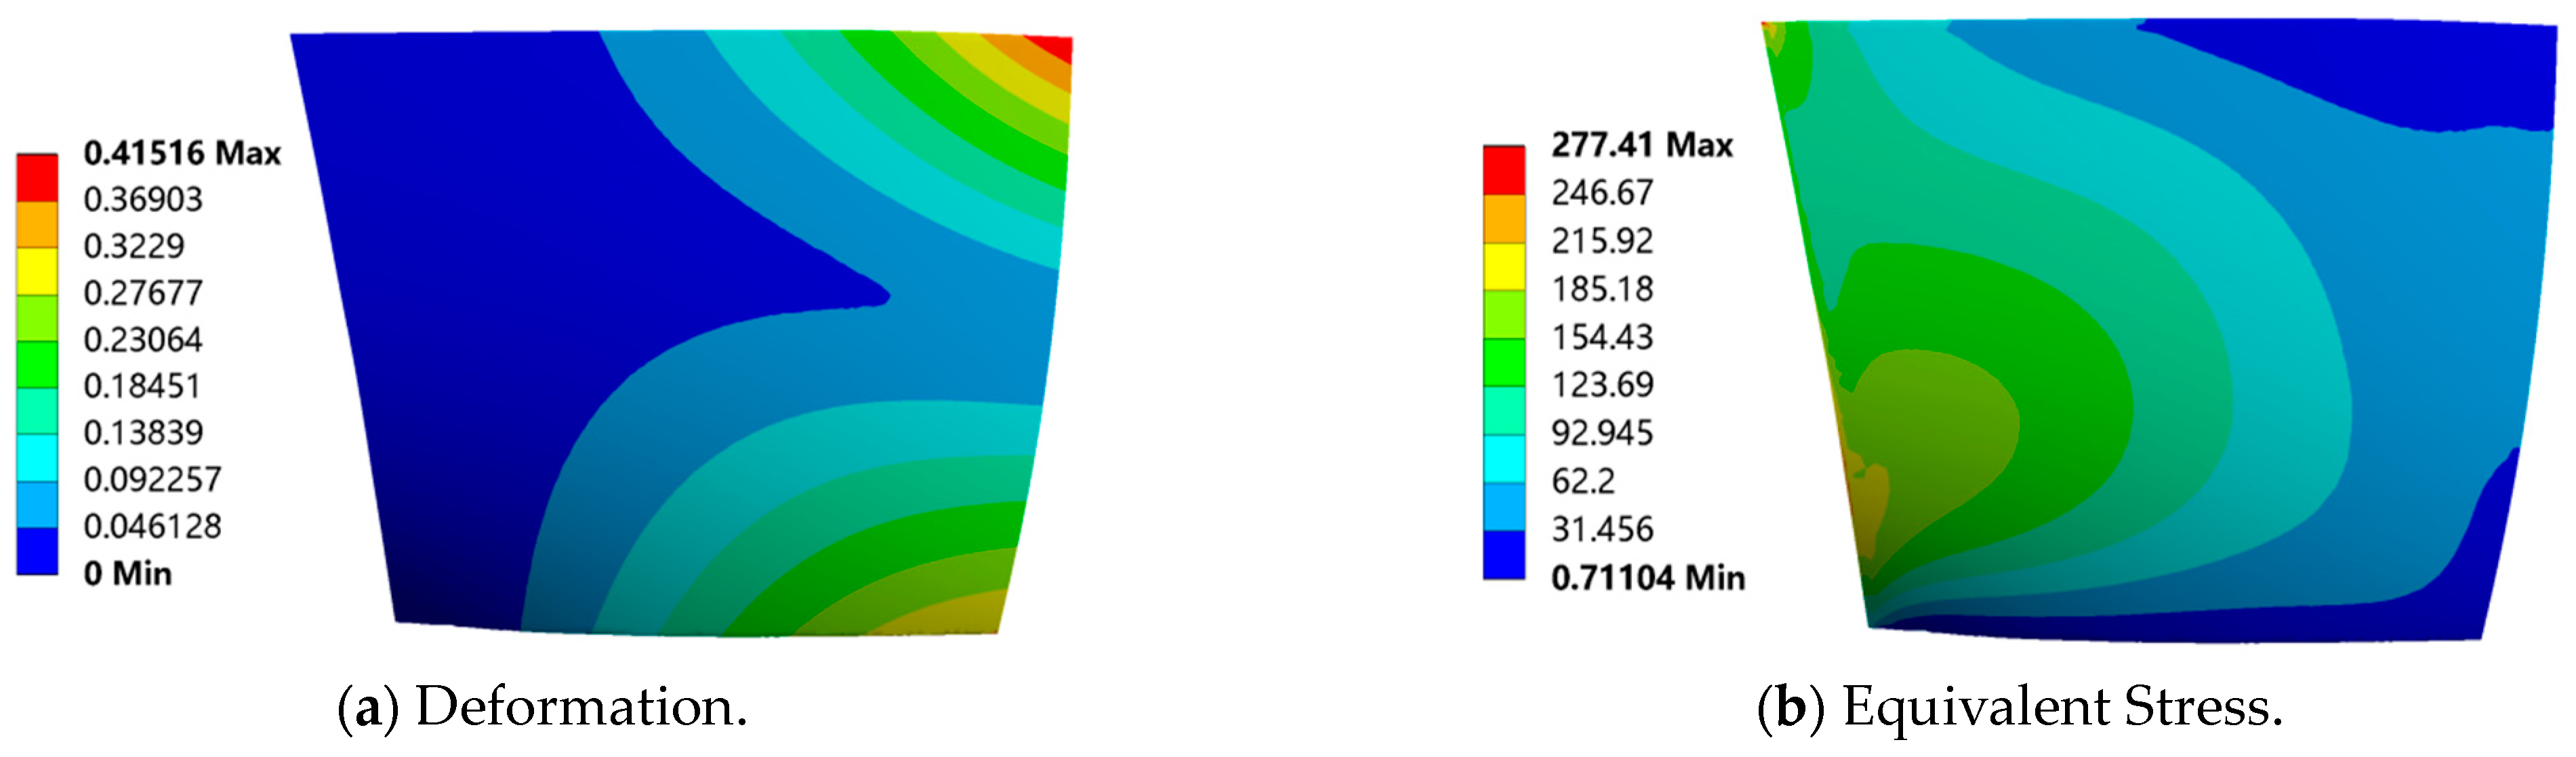
Figure 11 reveals that the maximum equivalent stress under centrifugal loading alone was 277.41 MPa, whereas, under aerodynamic loading alone, the maximum equivalent stress on the blade was 54.31 MPa, representing only 19.57% of the stress exerted under centrifugal loading alone. This indicates that centrifugal load predominantly influenced blade stress. Figure 11 and Figure 12 show that the variation trend of equivalent stress remained consistent when the blade was subjected to centrifugal loading alone or in combination with aerodynamic loading, spreading radially along the blade height direction and concentrating mainly within the upper 33% of the blade length. This is attributed to pressure differences between the suction and pressure surfaces of the blade during high-speed rotation, causing bending of the blade, with the root end face experiencing higher stress as a fixed end, making it prone to fracture and stress fatigue.
The three scenarios show that the stress distribution on the blade did not simply follow a linear superposition of forces. A comparison of Figure 10, Figure 11 and Figure 12 shows that the deformation of the leading edge under aerodynamic loading alone or centrifugal loading alone was less than that under the combined action of aerodynamic and centrifugal loading. Conversely, the deformation of the trailing edge under centrifugal loading alone was greater than that under the combined action of aerodynamic and centrifugal loading. This is because at the blade’s leading edge, the forces from aerodynamic and centrifugal loading acted in the same direction, leading to increased deformation. Conversely, at the trailing edge of the blade, the troops from aerodynamic and centrifugal loading acted in opposite directions, partially canceling each other out and resulting in reduced deformation of the blade.
In summary, the fluid–structure coupling of the blade represents the optimal approach for studying the stress and strain of impeller blades, providing the most accurate representation of their distribution. It reflects the actual stress and strain distribution of the blades. For compressor blades to operate safely, they must adhere to strength safety criteria, whereby the maximum stress should not exceed the permissible stress [α]. Compressor blade working conditions involve high temperatures and pressures, so their strength must meet specified requirements; otherwise, they are susceptible to damage. The strength verification formula is
In Equation (7), represents the maximum stress that the blade can withstand (MPa), denotes the material’s yield strength (MPa), and k is the safety factor. For specialized dynamic machinery such as impellers, due to their unique operational conditions under static loading, a safety factor of k = 1.2 was selected in this study. As per the preceding context, it is apparent that the material composition of the blades was TC4, distinguished by its exceptional ductility, with a yield strength of 825 MPa. With a safety factor of k = 1.2 applied, the allowable stress for the material was established at 687.5 MPa. At the rated rotational speed of 17,188.7 rpm, the maximum equivalent stress experienced by the blades was recorded at 299.93 MPa. Notably, this stress magnitude remained below the allowable stress threshold of 687.5 MPa for the material, thereby ensuring compliance with the strength criteria for the blades at 17,188.7 rpm.
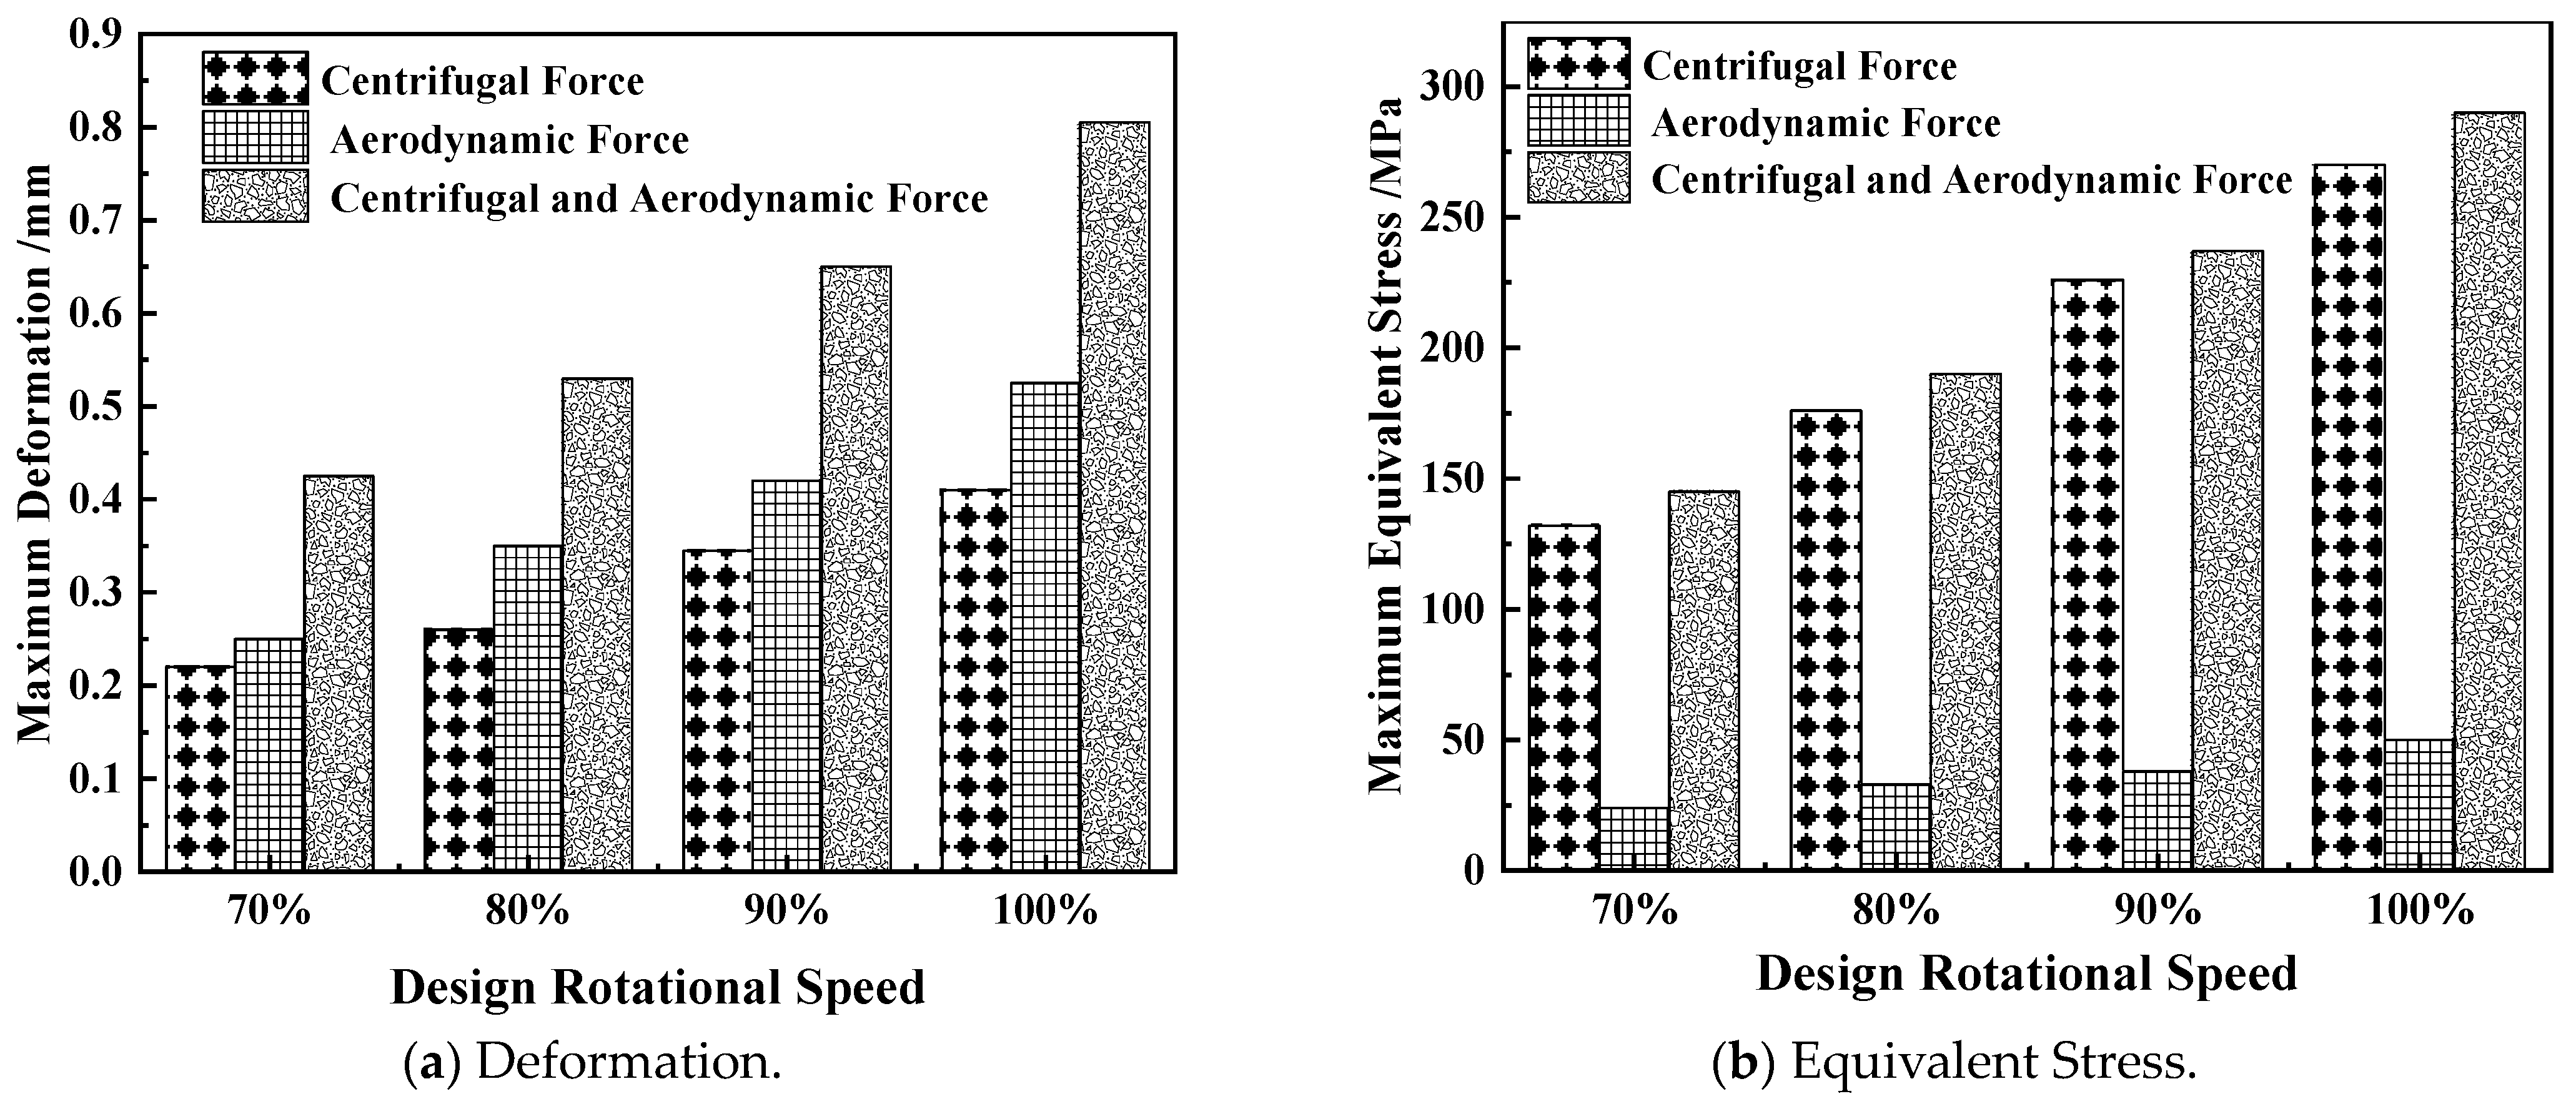
For a clearer understanding of the influence patterns of different loads on the maximum deformation and maximum stress of the blades, this study contrasted the effects at 90%, 80%, and 70% of the design rotational speed. From Figure 13a, it is observed that under various design rotational speeds, the deformation solely induced by aerodynamic loads slightly exceeded that caused solely by centrifugal loads. Moreover, the deformation resulting from the combined action of centrifugal and aerodynamic loads surpassed that induced by either force acting alone. Figure 13b reveals that the maximum equivalent stress induced solely by aerodynamic loads was significantly lower than that induced solely by centrifugal loads or by the combined action of centrifugal and aerodynamic loads.

Figure 13.
Deformation and stress of blades at different rotational speeds under load.
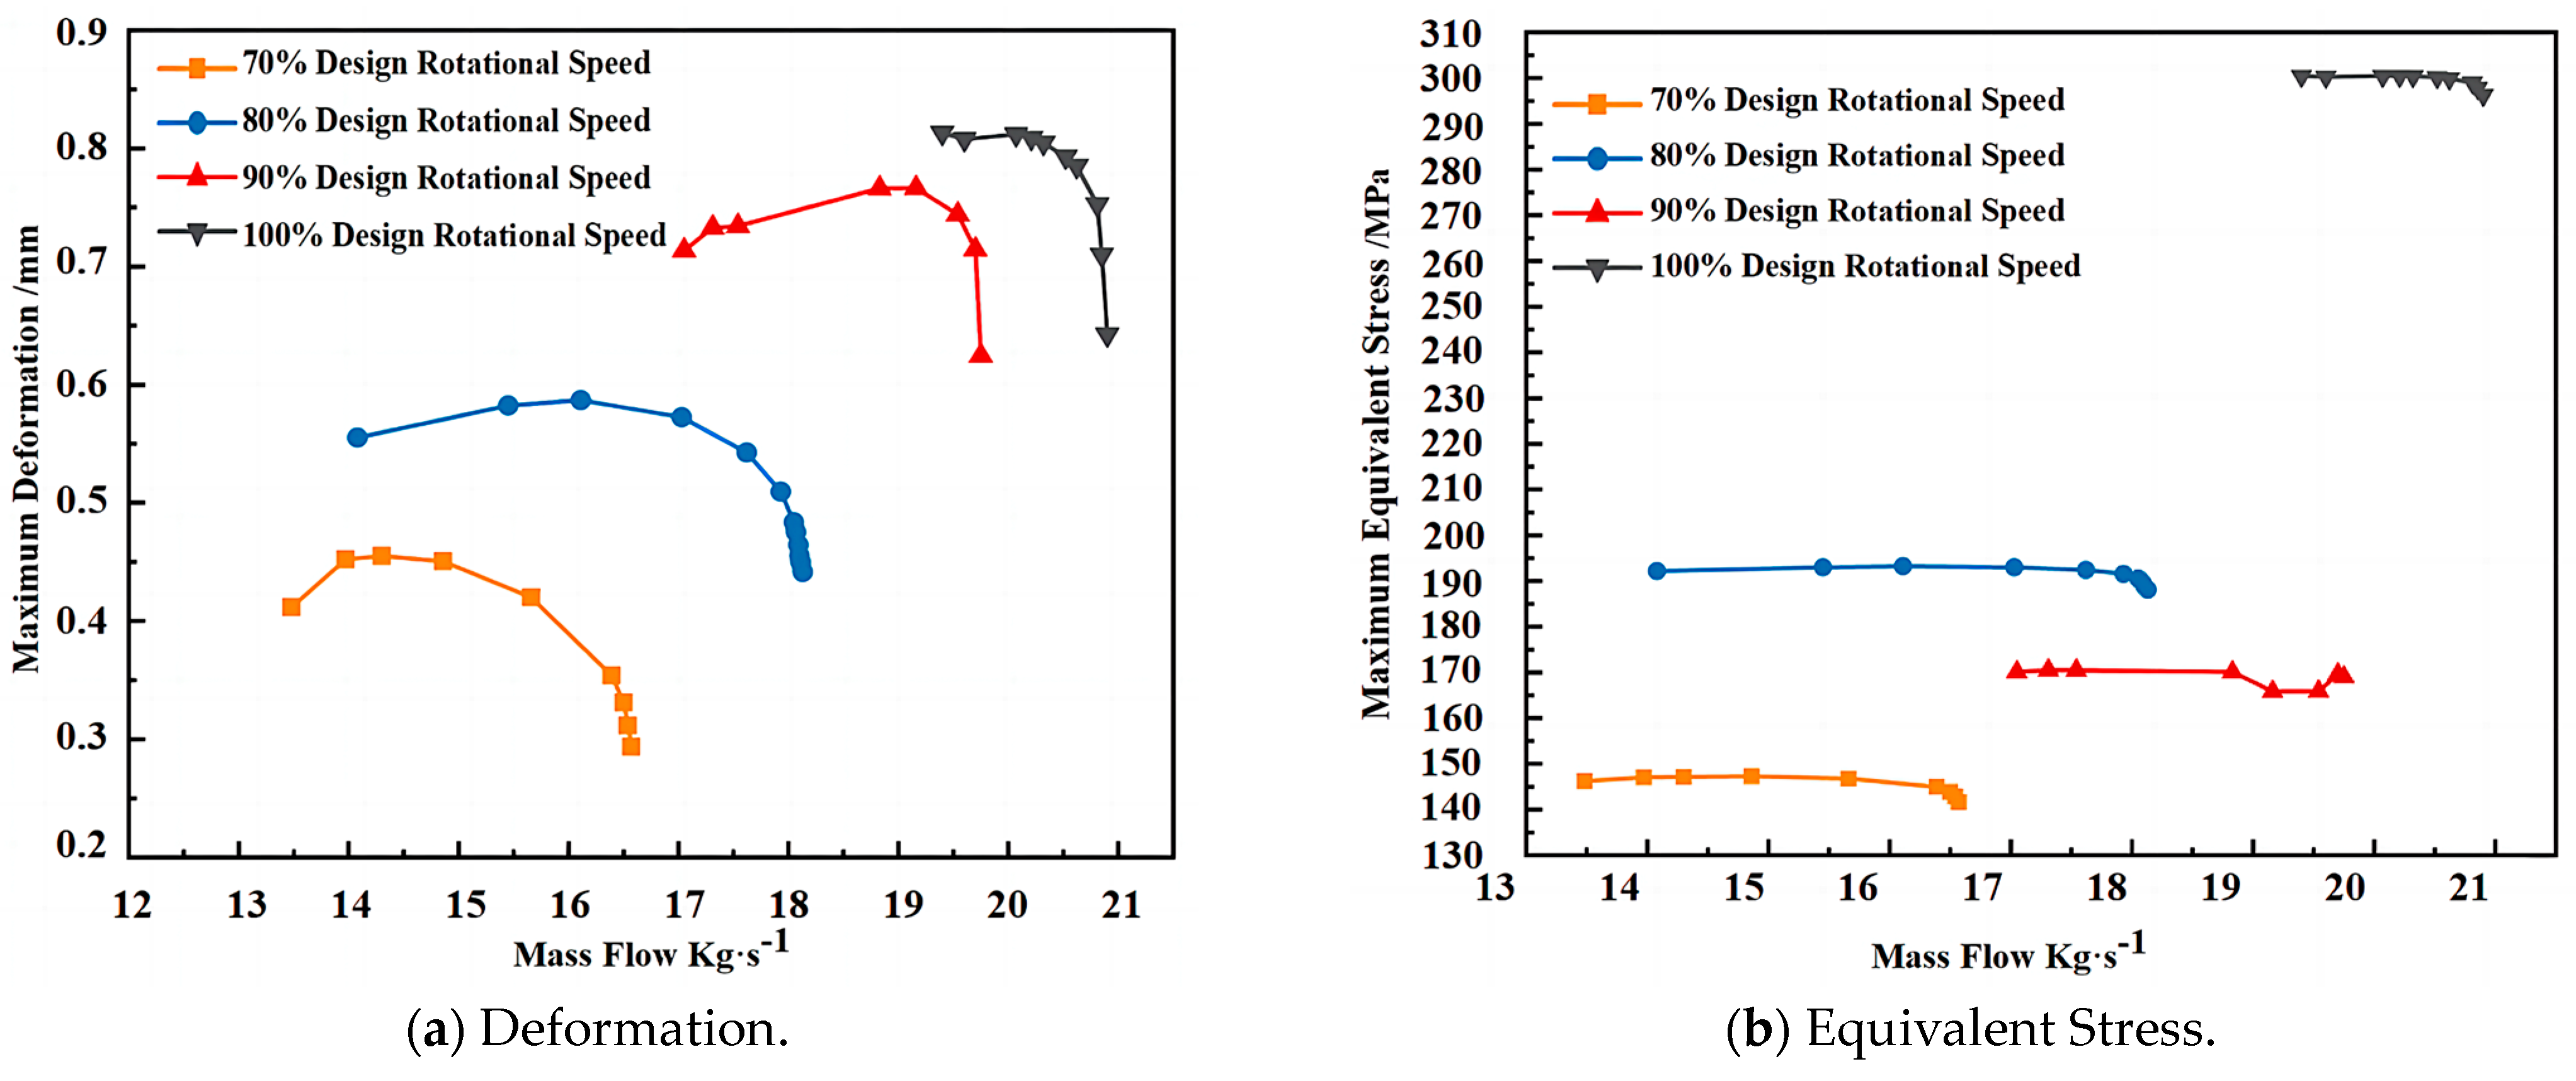
Figure 14 presents the variation of blades’ maximum deformation and maximum stress with mass flow at different rotational speeds. Figure 14a shows that the blades’ maximum deformation under different rotational speeds exhibited a trend of initially increasing and subsequently decreasing with the increasing mass flow, with a peak value present throughout the entire operational range. It is evident that with the continuous increase in rotational speed, the maximum deformation of the blade progressively increased. Notably, at each rotational speed, the maximum deformation under near-stall conditions exceeded that at the near-choke point, with the deformation trend of the blades intensifying as the rotational speed increased. Variations in rotational speed induced variations in blade deformation characteristics. From Figure 14b, it can be observed that the variation trend of maximum blade stress under different rotational speeds was relatively smooth, with minimal impact from variations in mass flow. As rotational speed increased, the variation in maximum blade stress did not exhibit a singular increasing trend; rather, it increased from 70% to 80% speed, decreased from 80% to 90% speed, and then increased again from 90% to 100% speed. Overall, the maximum stress exhibited a variation process of initial increase, subsequent decrease, and subsequent increase with the increase in rotational speed. Hence, selecting an appropriate rotational speed can effectively mitigate the blades’ maximum deformation and stress.
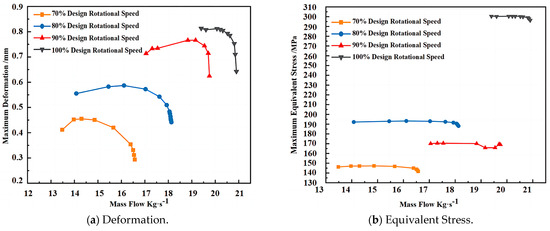
Figure 14.
Variation of maximum deformation and maximum equivalent stress of blades at different rotational speeds with mass flow.
4.2. Analysis of Blade Vibration Characteristics under Different Pre-Stresses
To explore the impact of prestress induced by load generation on the natural frequencies of blades and to prevent resonance during blade operation, this section performs a modal analysis of the blades based on the prestresses generated by the three load scenarios discussed in the previous section. This analysis provides the vibration frequencies of the blades at different loads. Table 2 reveals that with increasing rotational speed, the natural frequencies of the blades under different pre-stresses all increased. When the blades were subjected solely to aerodynamic loads, their natural frequencies were significantly lower than those under centrifugal loads alone or combined loads. This is because the blades undergo certain deformations under aerodynamic loads, but the stresses generated by aerodynamic loads are limited, consistent with the analysis of load effects on blade stress conducted earlier in this paper. By comparing the natural frequencies of the blades under the three types of loads, it is evident that the natural frequencies under combined loads exceeded those under individual loads. However, the natural frequencies under centrifugal loads were very close to those under combined loads, indicating that centrifugal loads are the primary factor influencing the natural frequencies of the blades.
Table 2.
Natural frequencies of blades for the first six modes at various rotational speeds.
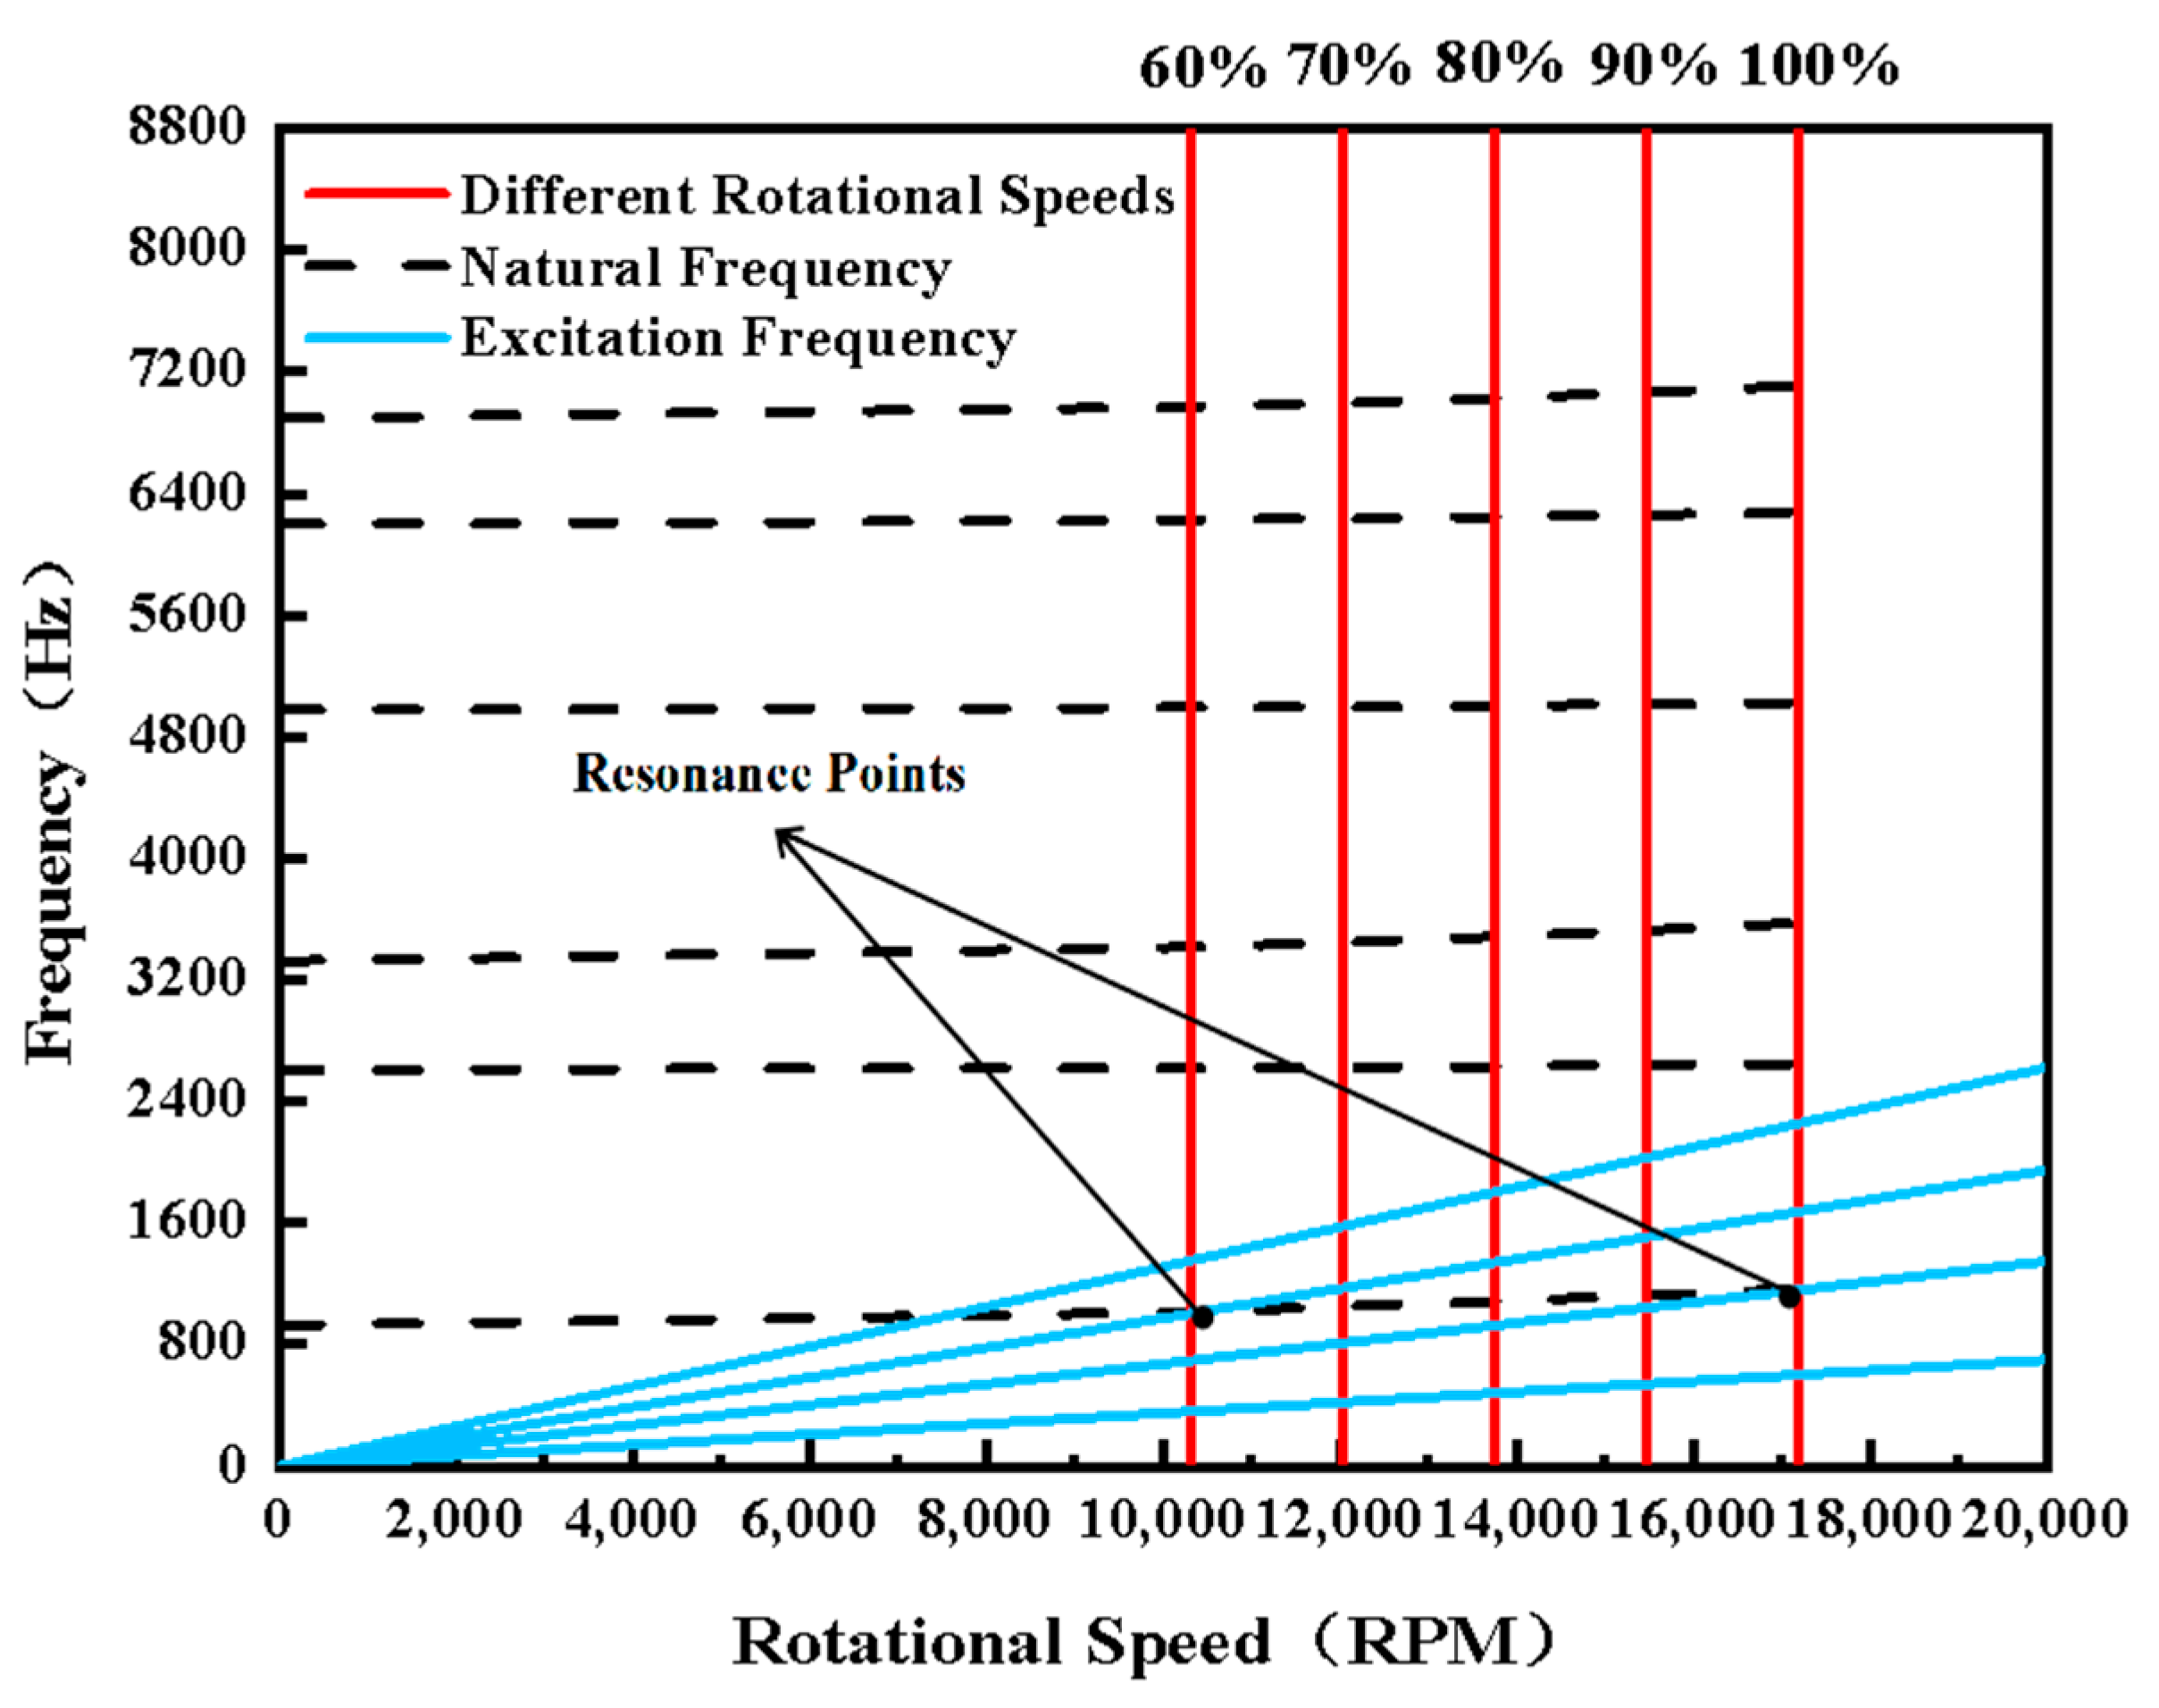
When the natural frequency of a blade matches or is an integer multiple of the frequency of the excitation force, it can lead to resonance [11]. The Campbell diagram [20] can be used to determine whether the excitation force frequencies generated by rotating components in a compressor during normal operation coincide with the natural frequencies of some components, effectively preventing resonance. The Campbell diagram is created using modal frequencies at different speeds, lines for different rotational speeds, and excitation force data for the compressor [20]. As shown in Figure 15, the black horizontal lines represent the modal frequency lines for the first six modes of the blade, the red vertical lines represent different rotational speed lines of the impeller, and the blue diagonal lines represent the excitation lines. Since the amplitude of pressure fluctuations increases with lower excitation frequency orders (r), leading to higher vibration stress and increased risk of blade failure [21], this paper considered excitation frequencies corresponding to two, four, six, and eight times the rotational speed frequencies. From Figure 15, it can be observed that resonance points occurred around 62% and 97% of the rotational speed, with a particular resonance point near 97% indicating that resonance is very likely to occur at 100% rotational speed, potentially leading to blade damage. Therefore, it is necessary to either modify the blade structure to change its natural frequency or adjust the compressor’s operational speed to avoid the resonance points as much as possible.
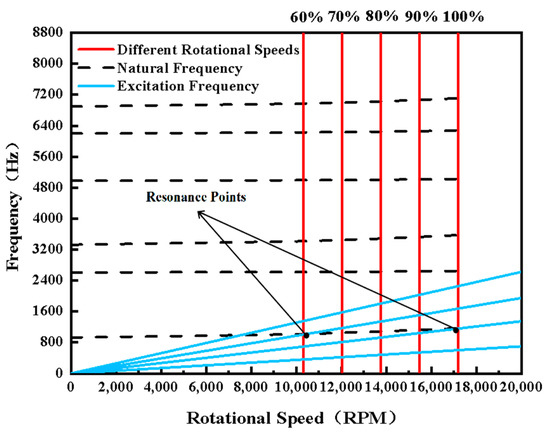
Figure 15.
The Campbell diagram of an axial flow compressor blade.
5. Conclusions
This study established a bidirectional CFD-CSD coupling analysis method for blade structures, comprehensively considering the effects of aerodynamic and centrifugal loads on the structural characteristics of transonic axial flow compressor blades. It analyzed stress and deformation distributions under different conditions. Based on this, modal analysis of the blades under various prestresses was performed, and Campbell diagrams were plotted. The main conclusions are as follows:
- (1)
- The deformation of the blades gradually increased along the blade height, with maximum deformation occurring at the lead edge tip. Regions of high stress were primarily concentrated at the upper 33% of the blade root, then radiated radially outward and gradually decreased. Both aerodynamic and centrifugal loads affected the magnitude and distribution of blade deformation and stress, but the influence of centrifugal loads on blade stress was significantly greater than that of aerodynamic loads, making centrifugal loads the primary consideration in stress calculations.
- (2)
- With increasing rotational speed, the maximum deformation of the blades showed a trend of initially increasing and subsequently decreasing, with maximum deformation under near-stall conditions exceeding that at near-choke points. However, the maximum stress of the blades exhibited a trend of initially increasing, subsequently decreasing, and then increasing, suggesting that selecting an appropriate rotational speed can reduce both the maximum deformation and maximum stress of the blades.
- (3)
- The natural frequencies of the blades increased with increasing rotational speed. Both centrifugal and aerodynamic loads had some degree of influence on the natural frequencies of the blades, but centrifugal loads were the primary factor affecting blade natural frequencies.
- (4)
- There were resonance points for compressor blades around 62% and 98% of the rotational speed. Care should be taken during compressor operation to prevent resonance, which could lead to blade damage.
Author Contributions
Conceptualization, H.L., H.B. and H.Z.; methodology, H.L., H.B. and H.Z.; software, H.L.; validation, H.Z.; formal analysis, H.L. and H.Z.; investigation, H.L.; resources, H.B.; data curation, H.L. and H.Z.; writing—original draft preparation, H.L. and H.Z.; writing—review and editing, H.L., H.B. and H.Z.; visualization, H.L. and H.Z.; supervision, H.B., F.Z. and J.W.; project administration, H.B., F.Z. and J.W.; funding acquisition, H.B., F.Z. and J.W. All authors have read and agreed to the published version of the manuscript.
Funding
This research was funded by the National Natural Science Foundation of China (52305583); the Shaanxi Provincial Key R&D Project (2023-YBGY-385); the Shaanxi Provincial Natural Science Basic Research Project (2023-JC-YB-018); and the Fundamental Research Funds for the Central Universities (XJSJ23124).
Institutional Review Board Statement
Not applicable.
Informed Consent Statement
Not applicable.
Data Availability Statement
The raw data supporting the conclusions of this article will be made available by the authors upon request.
Acknowledgments
The author would like to express additional gratitude to the College of Mechanical Engineering at Shaanxi University of Technology for the 2024 Graduate Innovation Fund Project (SLGJX202402).
Conflicts of Interest
The authors declare no conflicts of interest.
References
- Chen, G. Structural Design and Analysis of Aerospace Engines, 3rd ed.; Beijing University of Aeronautics and Astronautics Press: Beijing, China, 2014. [Google Scholar]
- Jin, X.-M.; Gao, D.-P.; Cai, X.-X. Analysis of integrated centrifugal impeller blade vibration reliability. J. Aerosp. Power 2004, 19, 610–613. [Google Scholar]
- Ramamurti, V.; Subramani, D.A.; Sridhara, K. Free vibration analysis of a turbocharger centrifugal compressor impeller. Mech. Mach. Theory 1995, 30, 619–628. [Google Scholar] [CrossRef]
- Day, W.-D.; Fiebiger, S.W.; Patel, H.N. Parametric evaluation of compressor blade blending. Proc. ASME Turbo Expo 2012, 7, 1099–1110. [Google Scholar]
- Li, L.; Xu, P.; Xu, W.-X. Multi-field coupling vibration patterns of the multiphase sink vortex and distortion recognition method. Mech. Syst. Signal Process. 2024, 29, 111624. [Google Scholar] [CrossRef]
- Tan, Y.-F.; Ni, Y.-S.; Xu, W.-X. Key technologies and development trends of the soft abrasive flow finishing method. J. Zhejiang Univ. Sci. A 2023, 24, 1043–1064. [Google Scholar] [CrossRef]
- Tao, H.-L.; Zhu, Y.-L.; Guo, B.-T. Numerical simulation of aeroelastic response in compressor based on fluid-structure coupling. J. Aerosp. Power 2012, 27, 1054–1060. [Google Scholar]
- Tao, P. Analysis on compressor blade structure based on fluid-solid coupling. Des. Manuf. Diesel Engine 2014, 20, 8–11. [Google Scholar]
- Wang, D.-B.; Han, L.-L.; Wang, G.-H. The flow simulation in the compressor with the effect of fluid-solid interaction. J. Therm. Sci. Technol. 2020, 19, 64–71. [Google Scholar]
- Li, X. The Flow Simulation in the Compressor with the Effect of Fluid-Solid Interaction. Master’s Thesis, Harbin Institute of Technology, Harbin, China, 2010. [Google Scholar]
- Zhang, J.-H.; Fu, X.; Kou, H.-J. Numerical study on vibration characteristics of axial flow compressor blade under fluid-structure interaction. J. Therm. Sci. Technol. 2018, 38, 59–66. [Google Scholar]
- Li, C.-W.; Wang, C.; Li, Q. Modal analysis of aero-engine blade based on thermal-structure coupling pre-stressing force. J. Air Force Eng. Univ. (Nat. Sci. Ed.) 2016, 17, 1–4. [Google Scholar]
- Li, S. Preliminary Study on Axial Flow Fan Design Based on FLUENT Software. Master’s Thesis, Northwestern Polytechnical University, Xi’an, China, 2004. [Google Scholar]
- Guo, T.-Q.; Lu, Z.-L.; Zhou, D. Coupled CFD/CSD Calculation of Aircraft Aeroelasticity, 1st ed.; Science Press: Beijing, China, 2019. [Google Scholar]
- Reid, L.; Moore, R.D. Design and Overall Performance of Four Highly Loaded, High-Speed Inlet Stages for An Advanced High-Pressure-Ratio Core Compressor. NASA TP-1337. 1978. Available online: https://ntrs.nasa.gov/citations/19780025165 (accessed on 20 July 2024).
- Denton, J.D. Lessons from rotor 37. J. Therm. Sci. 1997, 6, 1–13. [Google Scholar] [CrossRef]
- Wang, W.; Chu, W.-L.; Zhang, H.-G. The effects on stability, performance, and tip leakage flow of recirculating casing treatment in a subsonic axial flow compressor. In Proceedings of the ASME Turbo Expo, Seoul, Republic of Korea, 13–17 June 2016. [Google Scholar]
- Wang, H. Study of Unsteady Tip Flow and Rotating Instability in Axial Compressors. Ph.D. Thesis, Shanghai Jiao Tong University, Shanghai, China, 2016. [Google Scholar]
- Boretti, A. Experimental and computational analysis of a transonic compressor rotor. Mar. Geol. 2010, 122, 243–262. [Google Scholar]
- Liu, Y.; Yang, C.; Ma, C.-C. Forced Responses on a Radial Turbine with Nozzle Guide Vanes. J. Therm. Sci. 2014, 23, 138–144. [Google Scholar] [CrossRef]
- Zhang, H.; Wang, X.-Y.; Zhang, Y.-F. Vibration Failure Characteristic Analysis of Compressor Impeller Under Plateau Conditions. Chin. Intern. Combust. Engine Eng. 2024, 45, 47–56. [Google Scholar]

Disclaimer/Publisher’s Note: The statements, opinions and data contained in all publications are solely those of the individual author(s) and contributor(s) and not of MDPI and/or the editor(s). MDPI and/or the editor(s) disclaim responsibility for any injury to people or property resulting from any ideas, methods, instructions or products referred to in the content. |
© 2024 by the authors. Licensee MDPI, Basel, Switzerland. This article is an open access article distributed under the terms and conditions of the Creative Commons Attribution (CC BY) license (https://creativecommons.org/licenses/by/4.0/).