Article

Enhancing Diabetes Prediction and Prevention through Mahalanobis Distance and Machine Learning Integration

by
Khongorzul Dashdondov
1,
Suehyun Lee
1,* and
Munkh-Uchral Erdenebat
2,*
1
Department of Computer Engineering, College of IT Convergence, Gachon University, Seongnam-si 13120, Republic of Korea
2
Department of Computer Engineering, School of Information and Communication Engineering, Chungbuk National University, 1 Chungdae-ro, Seowon-gu, Cheongju-si 28644, Republic of Korea
*
Authors to whom correspondence should be addressed.
Appl. Sci. 2024, 14(17), 7480; https://doi.org/10.3390/app14177480 (registering DOI)
Submission received: 17 July 2024 / Revised: 19 August 2024 / Accepted: 20 August 2024 / Published: 23 August 2024

Abstract

:
Diabetes mellitus (DM) is a global health challenge that requires advanced strategies for its early detection and prevention. This study evaluates the South Korean population using the Korea National Health and Nutrition Examination Survey (KNHANES) dataset from 2015 to 2021, provided by the Korea Disease Control and Prevention Agency (KDCA), focusing on improving diabetes prediction models. Outlier removal was implemented using Mahalanobis distance (MAH), and feature selection was based on multicollinearity (MC) and reliability analysis (RA). The proposed Extreme Gradient Boosting (XGBoost) model demonstrated exceptional performance, achieving an accuracy of 98.04% (95% CI: 97.89~98.59), an F1-score of 98.24%, and an Area Under the Curve (AUC) of 98.71%, outperforming other state-of-the-art models. The study highlights the significance of rigorous outlier detection and feature selection in enhancing the predictive power of diabetes risk models. Notably, a significant increase in diabetes cases was observed during the COVID-19 pandemic, particularly linked to male sex, older age, rural location, hypertension, and obesity, underscoring the need for enhanced public health strategies for early intervention and targeted prevention.

1. Introduction

Diabetes mellitus (DM) is a significant and growing global health challenge, and its prevalence is increasing at an alarming rate. Recent estimates suggest that the number of adults with diabetes will continue to increase, necessitating the development of advanced strategies for its effective prevention and early detection [1]. Diabetes is associated with a range of serious complications, including cardiovascular disease, neuropathy, retinopathy, and kidney failure, making early identification of at-risk individuals critical for reducing these adverse health outcomes [2]. Recent research has underscored the importance of leveraging machine learning techniques to enhance the accuracy and reliability of diabetes-risk-prediction models. Sonia et al. (2023) demonstrated the potential of a Multilayer Neural Network no-prop algorithm for diabetes risk prediction, highlighting the need for innovative approaches in this domain [3].
Traditional diagnostic methods, including fasting plasma glucose (FPG) tests, oral glucose tolerance tests (OGTTs), and glycated hemoglobin (HbA1c) measurements, often fail to identify early-stage diabetes or pre-diabetes due to their limited sensitivity. These methods also fail to fully capture the complex interplay between various risk factors such as demographic, genetic, biochemical, and lifestyle factors [4]. Consequently, there is growing interest in developing predictive models that integrate these diverse risk factors to improve the early detection of diabetes. Some authors have introduced a hybrid diabetes prediction framework that utilizes Random Forest (RF), LightGBM, Glmnet, XGBoost [5,6,7,8], and the LS-SVM classifier to address prevalent data quality issues in medical datasets, such as outliers. The framework achieved a classification accuracy of 96.57% [9]. Furthermore, [10] presented a selective data preprocessing approach using the Synthetic Minority Oversampling Technique (SMOTE) to balance the training data and manage outliers.
Advanced predictive models that integrate these diverse risk factors can enhance early detection. However, their performance is frequently compromised by the presence of outliers. Outliers, which are data points that deviate significantly from most datasets, can result from measurement errors, data entry mistakes, or inherent population variability. The presence of outliers can distort statistical analyses and predictive models, leading to unreliable outcomes and reduced predictive accuracy [11,12]. Effective outlier detection and removal are crucial for improving the data quality and predictive model performance. Mahalanobis distance (MAH), a multivariate distance measure, offers a robust method for outlier detection by accounting for correlations among variables and the overall covariance structure of the data [13]. The Mahalanobis distance method was utilized to generate values in patients with type 2 diabetes from NHANES to 1999–2018, using feature selection, as described in [14].
In this study, we leveraged Mahalanobis-distance-based outlier removal to enhance diabetes prediction models using the Korea National Health and Nutrition Examination Survey (KNHANES) dataset from 2015 to 2021 provided by the Korea Disease Control and Prevention Agency (KDCA) [15,16,17]. To address the complex interplay between the risk factors, we implemented feature selection based on multicollinearity (MC) [18,19] and reliability analysis (RA) [20] to refine the predictive variables. We applied this enhanced dataset to several machine-learning classifiers, including Extreme Gradient Boosting (XGBoost), Naive Bayes (NB), K-Nearest Neighbors (KNN), Random Forest (RF), and Decision Trees (DTs) [21]. The objective was to develop a comprehensive risk assessment model that integrates demographic, genetic, biochemical, and lifestyle variables, while effectively addressing the issue of outliers. Our empirical analysis demonstrates that the proposed approach significantly improves the model accuracy and robustness across all classifiers, with XGBoost showing superior performance.
The feature importance table summarizes the contribution of each feature to the prediction accuracy of our proposed method, MC and RA-based, XGBoost, and Random Forest models. Feature importance is a crucial aspect of machine learning models, as it helps identify which variables have the most significant impact on the model’s predictions.
The remainder of this paper is organized as follows. Section 2 provides a detailed survey of related work. The proposed methodology is described in Section 3. Section 4 presents the experimental study, including the dataset preparation, procedures used for comparison, evaluation metrics, and comparative results. Section 5 highlights discussions about the significance of the results and suggests potential future research directions. Finally, Section 6 concludes the paper. Appendix A presents the cross-tabulation results.

2. Related Works

Extensive research has been conducted on the use of machine learning and statistical methods to predict and prevent the occurrence of DM. This study highlights the urgent need to enhance early detection and intervention strategies for this common chronic disease. This section provides an overview of important contributions and methodologies in this field. It specifically examines the integration of different techniques for preparing data, machine learning algorithms, and the role of outlier detection using the MAH.
MAH has been widely used for outlier detection in medical datasets owing to its ability to account for variable correlations. For instance, ref. [11] utilized the Mahalanobis distance to effectively detect and handle outliers, which improved the stability and performance of their hypertension prediction models. Ref. [22] challenges the Neural Network for medical images by applying Mahalanobis distance to detect any out-of-distribution (OOD) pattern using synthetic artifacts. The authors of [23] proposed a privacy-preserving disease diagnosis scheme based on the Mahalanobis distance test, involving query users, aided cloud servers, and classification cloud servers. The system jointly calculates and protects sensitive medical data and outcomes from the clinical diagnostic processes. An innovative heart-sound-based system for diagnosing heart diseases was proposed using automatic adaptive feature extraction and the Mahalanobis-distance-classification criterion [24]. Similarly, various studies have employed outlier detection methods to predict diabetes. In diabetes prediction, removing outliers helps refine the dataset and enhances the performance of machine learning models.
Recent advancements in diabetes prediction models have demonstrated the effectiveness of various machine learning algorithms, including LR, DT, CatBoost, XGBoost, RF, Support Vector Machines (SVMs), Convolutional Neural Networks (CNNs), and Neural Networks (NNs). Notably, a 2024 study using the SECNN model achieved 94.12% accuracy on the NHANES dataset and 89.47% accuracy on the PIMA Indian dataset [25]. Another study found that the CatBoost Classifier was the most accurate (85%) for predicting gestational diabetes [26]. Additionally, models such as the Deep Dense Layer Neural Network (DDLNN) [27] and RF [28] have been effectively applied to the PIMA Indian dataset. At the same time, Hasan et al. improved predictions through a weighted ensemble of models [29] yielding an accuracy of 95.83% in the RFWBP model [30]. Practical applications, such as Sharma et al.’s automated eHealth cloud system using an Extreme Learning Machine (ELM), have also shown promising results with an accuracy of 90% [31].
Integrating outlier removal with machine learning models significantly advances diabetes prediction and prevention. By effectively identifying and handling outliers, these integrated approaches enhance the robustness and accuracy of predictive models. The continued exploration and development of such hybrid models hold great potential for improving diabetes management and ultimately reducing the burden of this chronic disease. The relevant studies are summarized in Table 1 and organized in chronological order.

3. Methodology

Figure 1 shows the proposed framework based on the MAH-based outlier-removal method. Our methodology was divided into three distinct interlinked modules. Initially, data preparation was performed, and the raw data were meticulously organized and structured. Data preprocessing involves cleaning and feature selection for optimal dataset refinement. Finally, predictive analysis applies advanced statistical models to make informed predictions. Each module is crucial for the integrity and accuracy of a diabetes prediction model. A detailed description of Figure 1 is provided in the subsequent subsections, where we break down the components, methodologies, and insights depicted in the figure for a thorough understanding.

3.1. Preparing Experimental Dataset

The KDCA collected the KNHANES data. These included health examinations for various diseases, health interviews, and nutritional surveys conducted in the Korean population. The KNHANES datasets were released for public use within one year from the end of each survey year. We generated a target value for individuals aged ≥ 19 years with diabetes. The target diabetes group included individuals with a history of hypertension, diabetes, heart disease, heart attack, or stroke. Our comprehensive study meticulously processed and analyzed the datasets derived from KNHANES. For the KNHANES (2015–2021), we initially obtained 39,768 records and 879 features. Through a rigorous screening process that excluded rows with missing values and features not pertinent to diabetes, coupled with MC and reliability analyses, we identified 24 features of critical relevance to diabetes. This careful curation resulted in a refined experimental dataset containing 27,282 records, each of which contained 24 diabetes-related features. After excluding the outliers using the MAH method, we obtained a target dataset with 23,611 records and 24 features. Figure 2 shows the procedure for creating the experimental target datasets for KNHANES (2015–2021).
The data preprocessing module consists of three main parts: feature selection based on the analysis of MC, RA, and the outlier removal. This study aimed to predict diabetes using data from the KNHANES. Table 2 provides the feature descriptions, means, and standard deviations of the target dataset.

3.2. Feature Selection Based on MC Analysis

The feature selection module was executed using MC analysis. This process allows for the identification of essential features to propose a simpler yet accurate model. We assessed collinearity among the selected features from health examinations, nutrition, and basic information concerning diabetes using MC in regression analysis [32]. MC is a statistical term used when two or more input attributes exhibit strong correlation [33]. Certain attributes were removed when highly correlated variables were present. We evaluated the results in terms of tolerance and the variance inflation factor (VIF) using MC analysis. An MC problem arises when the VIF value exceeds 10 and the tolerance falls below 0.10. After this analysis, we retained 36 features that were used as inputs for subsequent analysis of the two datasets. The comprehensive results of the correlation and MC analyses of the target dataset are presented in Table 2. The highest VIF was observed for “Attempted suicide for 1 year” at 5.171, followed by “Counseling for Mental Issues for 1 Year” (4.261), which was notable as it diverges from the common symptoms associated with diabetes. Predictors such as “glycated hemoglobin” and “fasting blood sugar” had the highest VIF scores of 3.546 and 3.173, respectively. A VIF ranging from 1 to 5 indicated that the predictors were not highly correlated, and could be considered when building a diabetes prediction model.

3.3. Feature Selection Based on Reliability Analysis

Feature selection techniques were employed to reduce the dimensionality of the feature space by eliminating unnecessary features. In this study, we used two distinct feature selection methods: MC and reliability analysis, based on two different datasets. Both techniques were performed using the SPSS software package v.23.
A reliability analysis was conducted using Cronbach’s alpha to assess the reliability of all features in the two datasets. Furthermore, it is crucial to determine whether the combined features contribute to the assessment of the same construct. While there is no specified lower bound, a higher Cronbach’s alpha coefficient (approaching 1) indicates greater internal consistency of the factors [34]. An α value of 0.7 or higher is indicative of strong internal consistency in assessing the construct’s reliability.

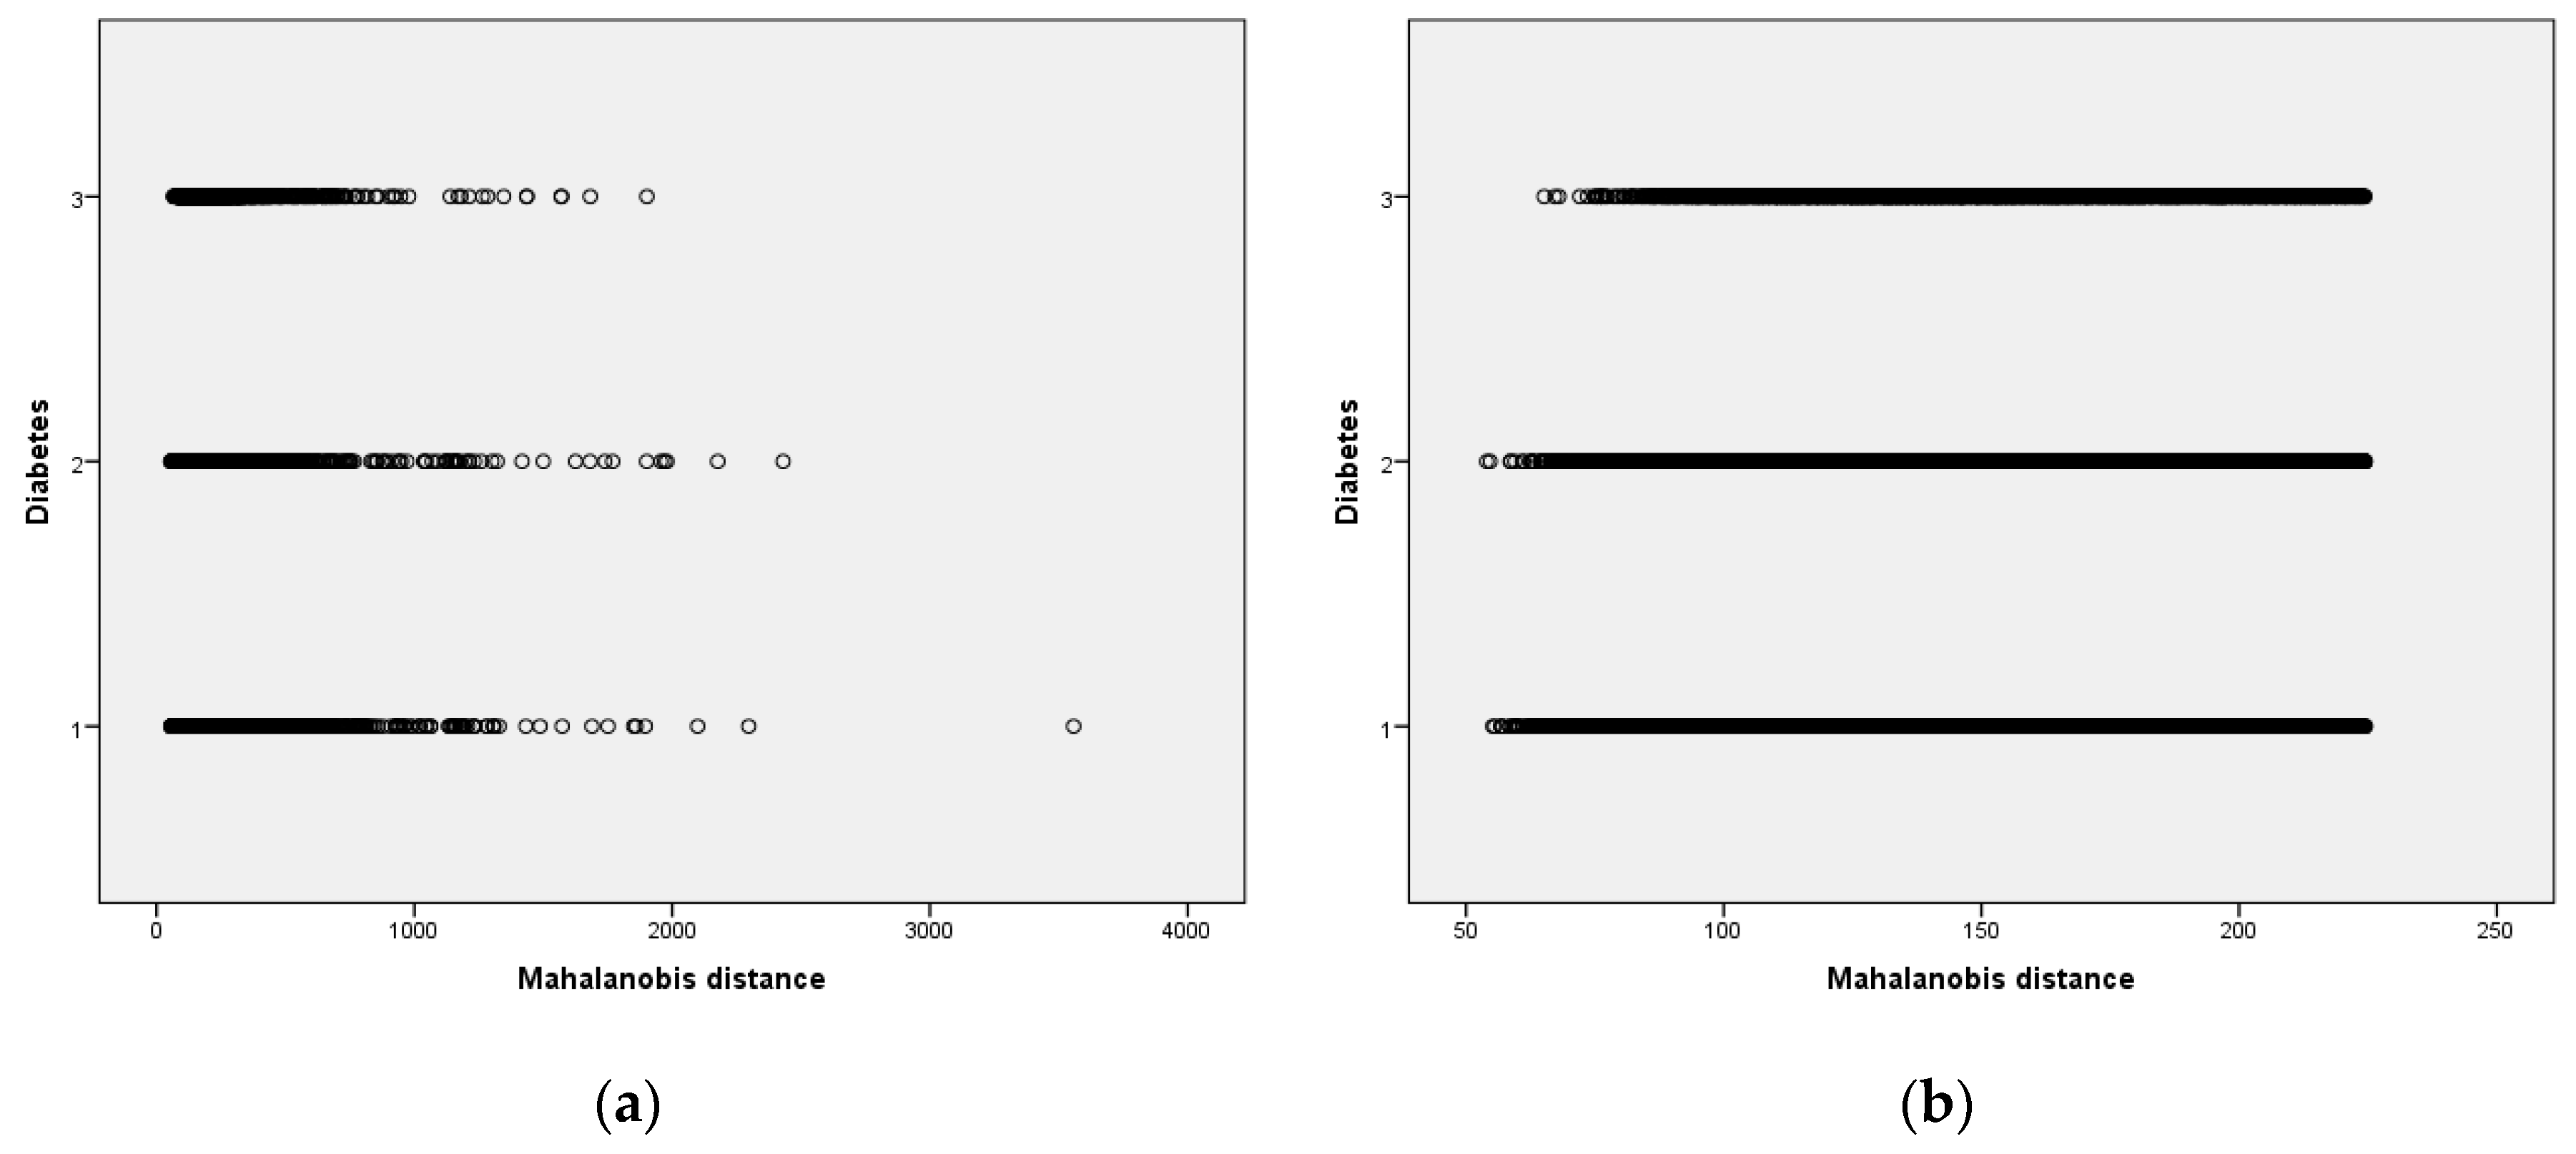
3.4. Outlier Detection Based on MAH

Multivariate outliers can be identified using the MAH distance, which is the distance of a data point from the calculated centroid in other cases where the centroid is calculated as the intersection of the means of the assessed variables. Each point is recognized as an (X, Y) combination, and the multivariate outliers lie at a given distance from the other cases. The distances were interpreted using p< 0.001 and the corresponding χ2 value, with degrees of freedom equal to the number of variables.
Multivariate outliers can also be identified using leverage, discrepancies, and influence. Leverage is related to MAH distance but is measured on a different scale; therefore, the χ2 distribution does not apply. Large scores indicate cases in which they are farther out; however, they may still lie along the same line. Discrepancy assesses the extent to which a case is consistent with others. Influence is determined by leverage and discrepancy and assesses changes in coefficients when cases are removed. Cases > 1.00 are likely to be considered outliers. The formula for computing the MAH distance is [11,12]:
D 2 = x m T C 1 ( x m )
where D2 is the square of the MAH distance; x is the vector of the observation (row in a dataset); m is the vector of the mean values of the independent variables (mean of each column); C 1 is the inverse covariance matrix of the independent variables; T denotes the transpose of the vector; and (x − m) is the distance of the vector from the mean, which is divided by the covariance matrix (or multiplied by the inverse of the covariance matrix). The p-value probability is given by the following equation:
P = 1 X 2 ( M A H , d f )
In this study, outliers were removed based on the MAH distance to detect multivariate outliers. We selected 37 diabetes-related features. The descriptions of these features are presented in Table 2. Figure 3 shows the data with and without outliers from the dataset, using several values based on the MAH method.
Default training and testing splits of 70% and 30% were applied to the target dataset, respectively. Descriptive statistics for the target variables with and without FS and MAH are presented in Table 3. In this study, the diagnostic criteria typically involved the assessment of fasting blood glucose levels. Diabetes is usually diagnosed with a fasting blood glucose level of 126 milligrams per deciliter (mg/dL) or higher, or when the hemoglobin A1c (HbA1c) level reaches 6.5% or higher. Pre-diabetes is often identified when fasting blood glucose levels fall between 100 and 125 mg/dL or when HbA1c levels range between 5.7% and 6.4%. Normal ranges were defined as fasting blood glucose levels of < 100 mg/dL and HbA1c levels of < 5.7%. These values are used to diagnose diabetes and pre-diabetes and are based on guidelines from organizations such as the American Diabetes Association (ADA).

3.5. Classifiers

To improve the performance of the predictive analysis, we focused on the training dataset. In other words, instead of directly training the classifiers, outliers were removed from the training dataset by using the MAH method. During the analysis stage, the curated experimental dataset underwent a rigorous testing phase utilizing advanced algorithms, such as Random Forest (RF), k-Nearest Neighbor (KNN), XGBoost (XGB), Decision Tree (DT), and Naïve Bayes (NB) [35,36,37,38,39]. These algorithms were selected based on their proven efficacy in pattern recognition and predictive accuracy in health-data analytics. This approach ensures a comprehensive and resilient analysis that leverages multiple facets of data to enhance decision-making.
First, we evaluate the performance of the baseline models as a comparison point for the proposed method. We trained these baseline models directly on both experimental datasets using ML algorithms, as shown in Figure 1. Furthermore, on a dataset with feature selection, we trained additional baseline models after removing outliers.

3.6. Evaluation Metrics

To evaluate the performance of our predictive models, we adopted a comprehensive set of metrics: accuracy, AUC, and F1-score [11,12]. Each metric offers a unique lens to assess the effectiveness of our models, from accuracy in predictions to the balance between precision and recall, providing a holistic view of our model’s performance, as follows:
P r e c i s i o n = T P T P + F P   a n d   R e c a l l = T P T P + F N
Precision and recall are important metrics for evaluating the classification models. Precision measures the accuracy of positive predictions, whereas recall measures the model’s ability to identify all positive instances. These metrics are useful for imbalanced datasets or when the cost of false positives and negatives varies.
The F1-score is the harmonic mean of the precision and recall, as follows:
F 1 = 2 · P r e c i s i o n   ·   R e c a l l P r e c i s i o n + R e c a l l
We studied the multiclass case, and the average F1-score of each class label with weighting depended on the average parameter, as shown in Equation (4).
Accuracy is a measure of the degree of closeness between calculated and actual values. Accuracy is the sum of the true positive and true negative fractions among all test data, as shown in Equation (5).
A c c u r a c y = T P + T N T P + F P + F N + T N
The AUC (Area Under the Curve) is a crucial metric for multiple classification models as shown in Equation (6). This was calculated by determining the receiver operating characteristic (ROC) curve. A higher AUC value indicates a better model performance, making it easier to distinguish between positive and negative instances. This is beneficial for imbalanced datasets or when the cost of false positives and negatives varies.
A U C = i = 1 n ( F P R i + F P R i + 1 ) · ( T P R i + 1 T P R i ) 2

4. Experimental Study

During the data transformation, the data quality structure can change based on the column selection, presence of null values, and identification of outliers. Therefore, we assessed the reliability of the data using Cronbach’s alpha coefficient to evaluate the integrity of data quality. The comparative results of the Cronbach’s alpha are presented in Table 4. By assessing the reliability of the integrated dataset compared with non-integrated data, it was found that integrating the data improved the reliability of the data by 0.042.

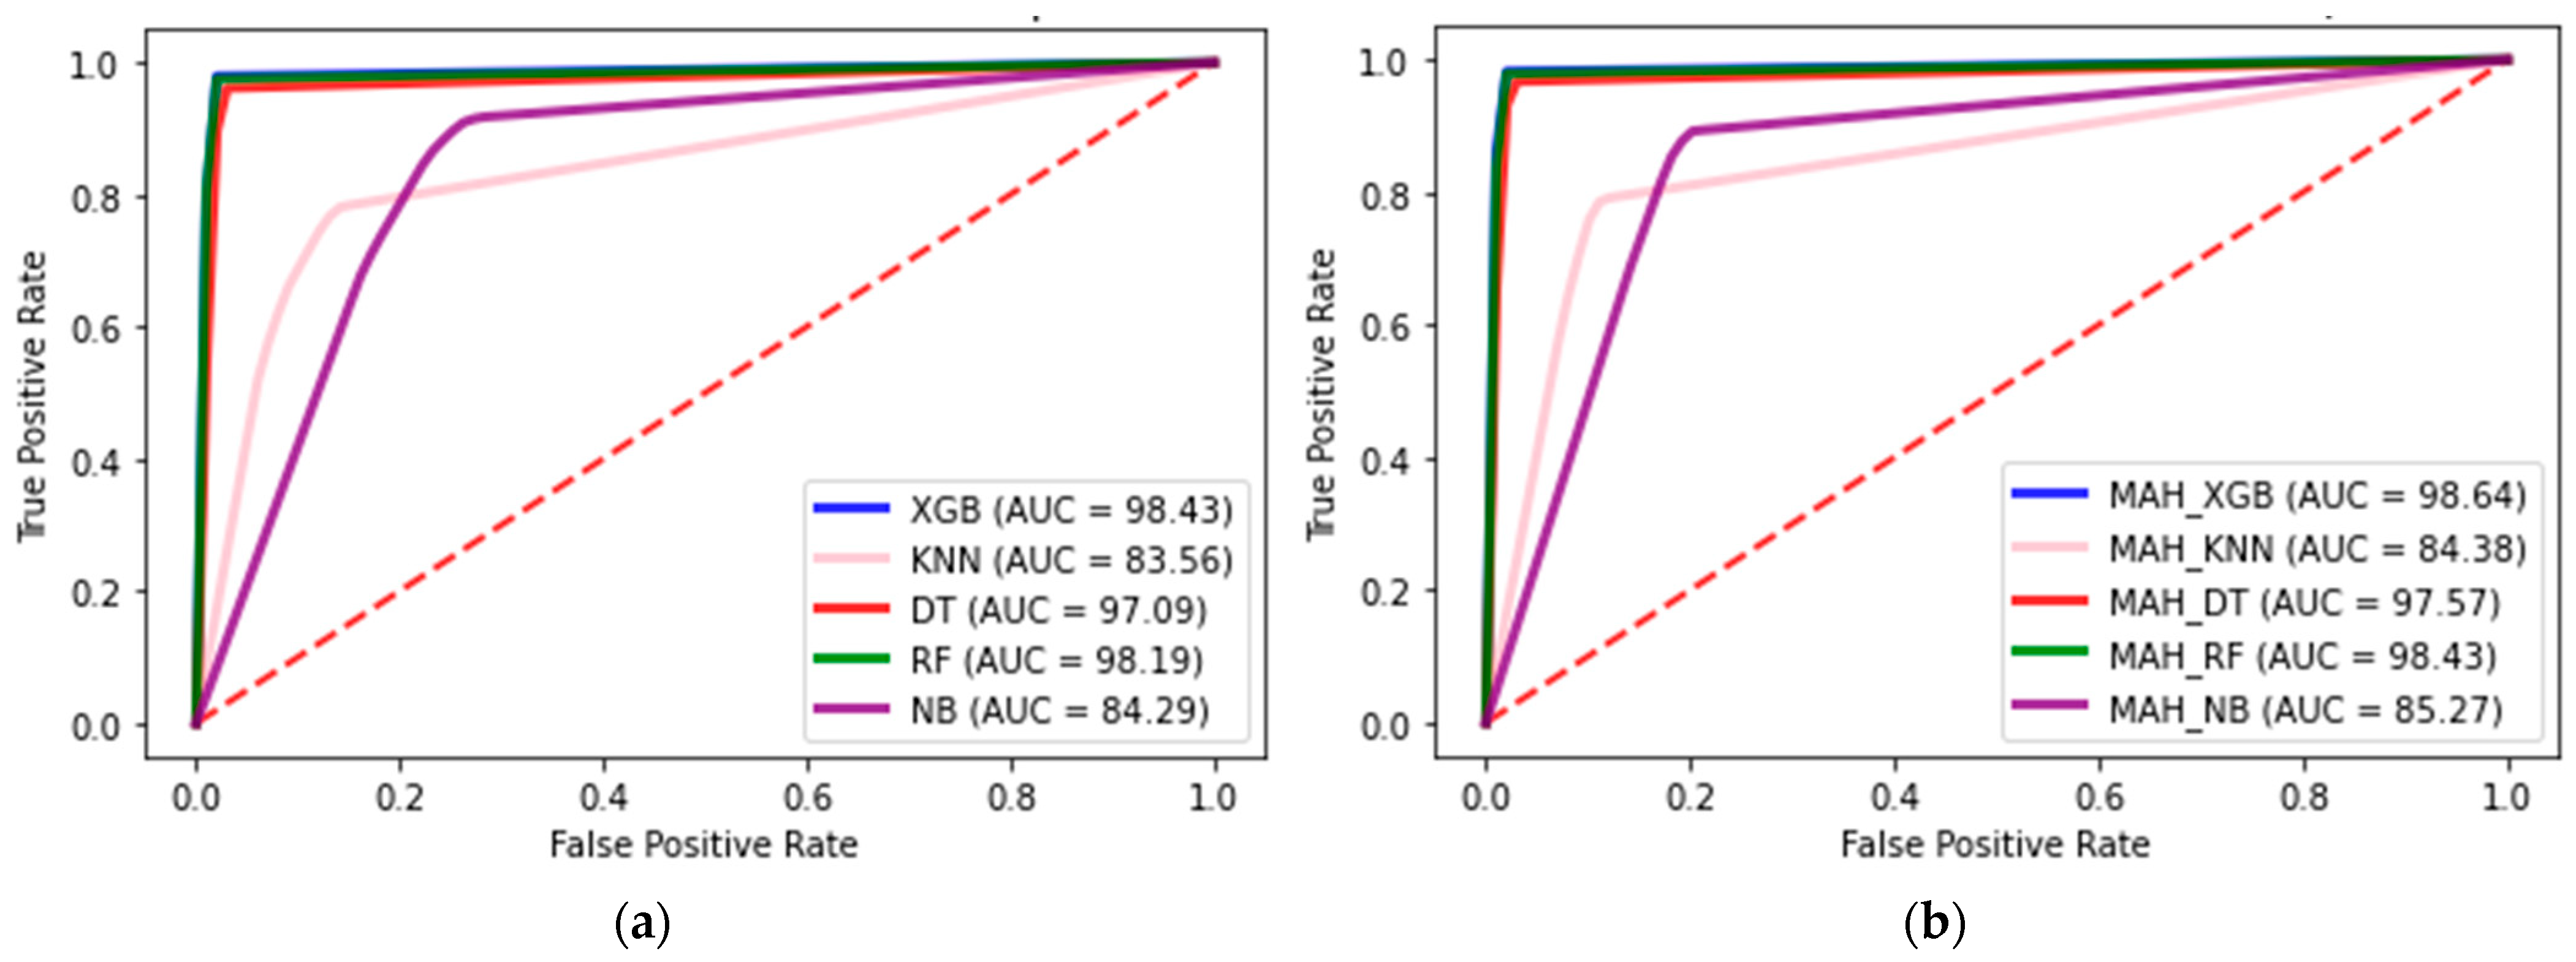
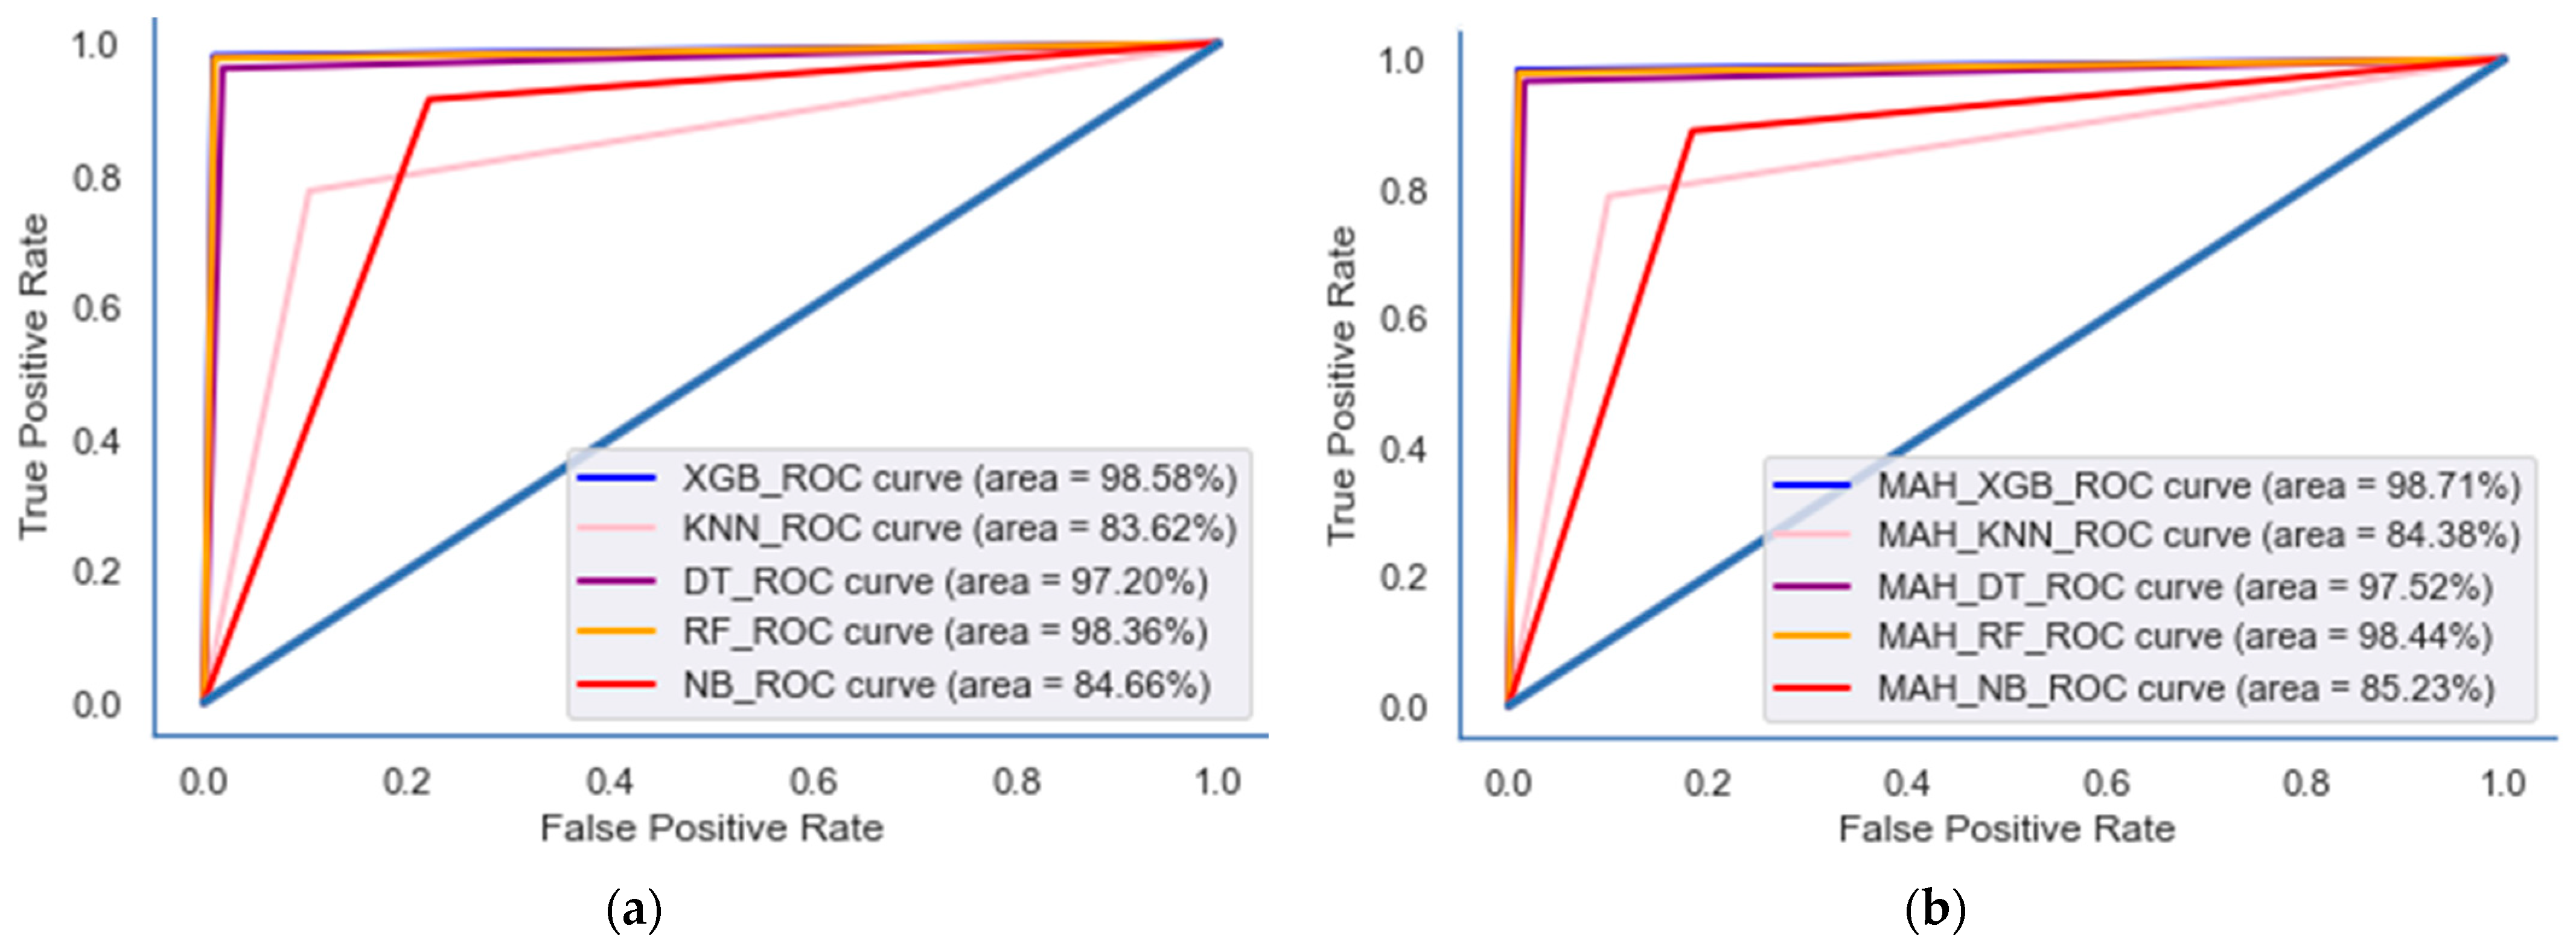
4.1. Classifier Results

Data preprocessing and predictive analysis modules were implemented in Python using the Sklearn library [39]. Data preprocessing was performed using SPSS version 23.0. Table 5 and Table 6 present the comparative results based on the following feature-importance methods: baseline (with all 165 features), MC (with 24 selected features), XGB (with 66 features), and RF (with 22 features). This differentiation of feature sets enables a comparison of model performance across varying levels of feature complexity and relevance.
Table 5 provides a comprehensive performance comparison between the baseline models and proposed method. The results revealed that the FS-based baseline models were the XGB, KNN, DT, NB, and RF. The findings indicate that our proposed method, which incorporates MAH-based outlier removal, demonstrates superior performance across all metrics compared to the baseline models. The accuracy, AUC, and F1-score of the performance results are presented in Table 5, with the highest scores highlighted in bold. The XGB model exhibited the highest accuracy of 96.78%, which improved to 97.98%, and the RF model exhibited the highest accuracy of 95.42%, which improved to 97.62 when MAH-based outlier removal was applied to the baseline model. The XGB and RF performed well across multiple metrics, indicating that they may be strong candidates for a given task. NB appears to have a lower accuracy and F1-score than the other algorithms, suggesting that it may not be the best choice for this specific task.
Figure 4 presents the multiclass ROC curves for each model and compares them with the average ROC curves obtained from the target dataset. Our analysis suggests that the XGB model demonstrates superior performance in predicting outcomes in the target dataset.
The accuracy, AUC, and F1-score of the performance results are presented in Table 6, with the highest scores highlighted in bold based on the k = 10 cross-validation. The XGB model exhibited the highest accuracy of 97.02%, which improved to 98.04% when MAH-based outlier removal was applied to the baseline model. The XGB and RF appear to perform well across multiple metrics, indicating that they are strong candidates for a given task. NB appears to have a lower accuracy and F1-score than the other algorithms, suggesting that it may not be the best choice for this specific task.
The ROC curves for each comparative method on the integrated dataset with k = 10-fold cross-validation are shown in Figure 5. When the training set is divided into several subsets, it is feasible to compute the mean area under the curve and view the variance of the curve for 10-fold cross-validation.
The diabetes risk prediction accuracy of the dataset was compared using various machine-learning algorithms, as shown in Table 7. The MAH technique enhances the performance of the individual algorithms, and MAH_XGB has emerged as the most effective. The accuracy of the standard XGB algorithm, standing at 98.04% (with a 95% confidence interval (95% CI) of 97.89 to 98.59) with the MAH-based approach, is shown in Table 7. The results of our study indicate that XGB, followed closely by RF and DT, significantly outperforms other algorithms, such as KNN and NB. These algorithms exhibit minimal or even slightly declining improvements in accuracy when using these features.

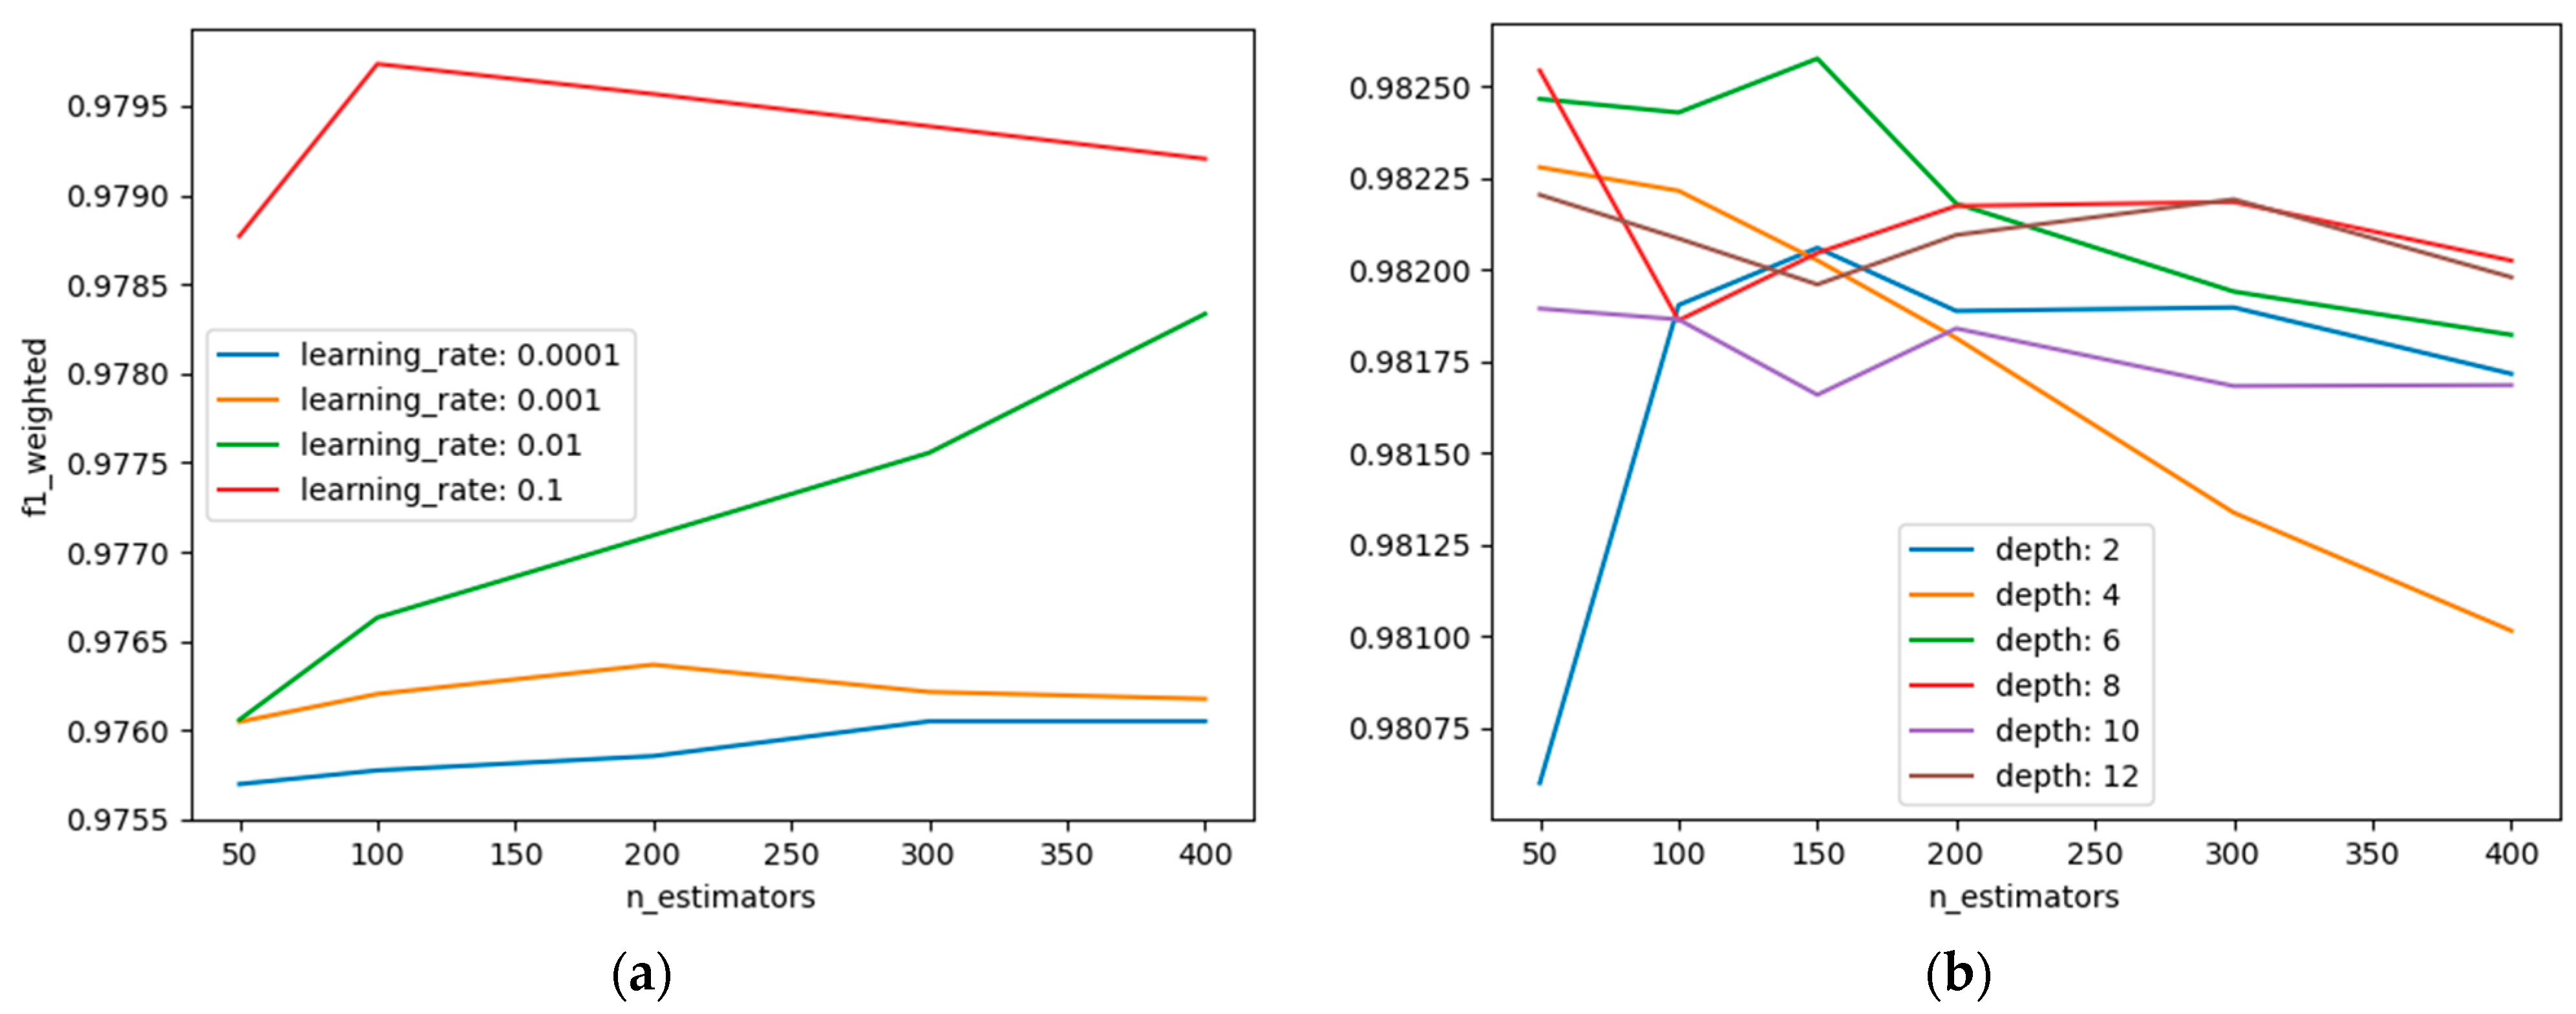
4.2. Hyperparameter Results

To improve the outcomes, we adjusted some XGBoost hyperparameters on a specific dataset by utilizing the grid search framework in scikit-learn [38,39]. Figure 6a displays a graph of the F1-weighted performance for each learning rate with variation in the number of trees. In addition, the data indicated that an optimal outcome was achieved when using a learning rate of 0.1 and 100 trees. The anticipated overall pattern remained consistent, with the performance improving as the number of trees increased.
Figure 6b illustrates the correlation between the number of trees in the model and the individual depth of each tree. We created a grid consisting of six distinct values for the number of estimators (50, 100, 150, 200, 300, and 400) and six distinct values for the maximum tree depth (2, 4, 6, 8, 10, and 12). Each combination was evaluated using 10-fold cross-validation, resulting in the training and evaluation of 360 models (6 × 6 × 10). The optimal outcome was obtained by utilizing 150 estimators and setting the maximum depth to 6, resulting in a superior F1-weighted score.
Compared with other advanced ML-based techniques for diabetes detection, our MAH_XGB method demonstrated superior performance. As detailed in Table 8, this method outperforms various state-of-the-art ML-based algorithms in terms of the accuracy and AUC metrics. For example, MAH_XGB achieved a remarkable accuracy of 98.04% and an AUC of 98.71% on the target dataset, exceeding those of other models such as CatBoost CBC [26] and DDLNN [27]. This indicated the exceptional efficacy of MAH_XGB in predicting diabetes risk by setting a new benchmark in the field.

5. Discussions

This study significantly advances the field of diabetes risk prediction and prevention by integrating advanced machine-learning techniques with robust outlier detection methods. Specifically, we employed Mahalanobis-distance-based outlier removal to enhance diabetes prediction models using data from the Korea National Health and Nutrition Examination Survey (KNHANES) dataset (2015–2021) provided by the Korea Disease Control and Prevention Agency (KDCA) [15,16,17]. We implemented feature selection based on multicollinearity (MC) and reliability analysis (RA) to address the complex interplay between various risk factors effectively. These refined datasets were then applied to several machine-learning classifiers, including Extreme Gradient Boosting (XGBoost), Naive Bayes (NB), K-Nearest Neighbors (KNNs), Random Forest (RF), and Decision Trees (DTs). The primary objective was to develop a comprehensive risk assessment model that integrates demographic, genetic, biochemical, and lifestyle variables, while effectively managing outliers. The empirical results demonstrate that the proposed approach significantly enhances model accuracy and robustness across all classifiers, with XGBoost demonstrating superior performance.
The application of Mahalanobis distance (MAH) for outlier removal yielded substantial improvements in the accuracy and reliability of the predictive models. Outliers in clinical datasets often undermine the model performance by distorting the statistical relationships among variables. By effectively identifying and removing these outliers, our study enhanced the precision and dependability of diabetes risk predictions. The MAH-based outlier removal method was particularly effective in refining the dataset, leading to a superior model performance. Notably, the XGBoost model achieved remarkable results, with an accuracy of 98.04%, an F1-score of 98.24%, and an AUC of 98.71%. These metrics underscore the superiority of the MAH-based approach over other state-of-the-art models, highlighting its potential for broader applications in predictive healthcare modeling.
The study also involved a comparative analysis of the importance of the features across different models. By comparing the importance scores between XGBoost, Random Forest, and our MC- and RA-based models, we observed similarities and differences in how these models prioritize various features. Some features, such as fasting blood glucose levels, have been consistently identified as critical predictors of diabetes, indicating their strong influence on the risk of diabetes. In contrast, the other features showed varying degrees of importance, depending on the model, reflecting the distinct data-processing mechanisms of each algorithm. These insights into feature importance have practical implications for healthcare providers, who can prioritize the monitoring and management of the most influential features identified by the models.
An analysis of the KNHANES data revealed a significant increase in diabetes cases during the COVID-19 pandemic, particularly among males, older individuals, rural residents, and those with hypertension or obesity. This increase in cases is likely attributable to pandemic-induced lifestyle changes such as reduced physical activity, poor diet, and increased psychological stress. These findings underscore the need for targeted public health strategies to mitigate the impact of global health crises on chronic diseases such as diabetes [40]. Traditional diagnostic methods for diabetes, including fasting plasma glucose (FPG) tests, oral glucose tolerance tests (OGTTs), and glycated hemoglobin (HbA1c) measurements, often fall short of early detection due to their limited sensitivity. In contrast, our integrated approach, which combines machine learning models with MAH-based outlier removal, offers a more comprehensive and accurate assessment of diabetes risk by incorporating demographic, genetic, biochemical, and lifestyle factors.

Limitations and Future Work

Although this study presented a robust methodology that yielded promising results, it is essential to acknowledge certain limitations. This research relied primarily on data from the KNHANES dataset, which may not fully represent the global population. Future research should aim to validate the proposed model across diverse datasets and populations to ensure its generalizability. Additionally, exploring other advanced feature selection techniques and machine learning algorithms could further enhance model performance, a significant advancement in diabetes prediction and prevention, by demonstrating the efficacy of combining the Mahalanobis distance for outlier detection with machine learning techniques. The proposed approach improved the accuracy and reliability of predictive models and provided valuable insights into the factors influencing diabetes risk during the COVID-19 pandemic. These findings pave the way for the development of more effective public health strategies and predictive models for chronic disease management, ultimately contributing to better health outcomes and reduced disease burden.
The practical implications of this study are as follows: Healthcare providers can leverage enhanced predictive models to more accurately identify at-risk individuals and implement early intervention strategies. Public health authorities can use these insights to design targeted prevention programs, particularly when considering the increased risk of diabetes observed during the pandemic. Moreover, this methodology can be adapted and applied to other chronic diseases, offering a versatile tool for improving health outcomes through advanced data analytics and machine learning. Future research should refine the model by integrating additional data sources, such as genetic information and real-time health monitoring data, to improve the prediction accuracy. Exploring deep learning techniques and ensemble methods can provide further enhancements. The development of user-friendly tools and applications incorporating these advanced predictive models could facilitate their adoption in clinical practice and public health policies. By addressing these areas, future studies can build on the foundation of this research, advancing the field of predictive modeling in healthcare and contributing to the overall goal of reducing the global burden of diabetes and other chronic diseases.

6. Conclusions

This study innovated diabetes prediction by employing sophisticated feature selection, including multicollinearity and reliability analyses, along with the Mahalanobis distance for outlier detection, significantly enhancing prediction accuracy. Our findings revealed a critical link between the two conditions, underscored by the effectiveness of the machine learning and linear regression techniques. Although tested on limited datasets and classifiers, our model outperformed traditional approaches, demonstrating the potential of advanced data processing and machine learning for disease prediction. This approach not only refines diabetes risk assessment during the pandemic but also serves as a foundational strategy for predictive modeling in healthcare, addressing future pandemics. The XGB model exhibited the highest accuracy of 96.78%, which improved to 98.04% when MAH-based outlier removal was applied to the baseline model. According to an examination of the KNHANES data from 2015 to 2021, a significant increase in diabetes cases was observed during the COVID-19 pandemic. The increased prevalence of diabetes is linked to the male sex, older age, rural location, hypertension, and obesity. The analysis of KNHANES data from 2015 to 2021 revealed a significant increase in diabetes cases during the COVID-19 pandemic, with a higher prevalence particularly noted in older age groups, rural residents, males, and individuals with hypertension or obesity.

Author Contributions

Conceptualization, K.D.; data curation, M.-U.E.; formal analysis, K.D.; funding acquisition, S.L.; methodology, K.D. and S.L.; project administration, S.L.; software, K.D. and M.-U.E.; supervision, S.L. and M.-U.E.; validation, K.D. and M.-U.E.; visualization, M.-U.E.; writing—original draft, K.D.; writing—review and editing, K.D. All authors have read and agreed to the published version of the manuscript.

Funding

This research was supported by a grant of the Korea Health Technology R&D Project through the Korea Health Industry Development Institute (KHIDI), funded by the Ministry of Health & Welfare, Republic of Korea (grant number: HI22C0452).

Institutional Review Board Statement

Not applicable.

Informed Consent Statement

Not applicable.

Data Availability Statement

Data are contained within the article.

Conflicts of Interest

The authors declare no conflicts of interest.

Appendix A

A correlation of the categorical features of the experimental datasets was performed on the experimental datasets. Table A1 presents the diabetes cases from the KNHANES dataset (2015–2021) across various demographics and health conditions. This revealed that rural areas consistently reported more diabetes cases than urban areas, with 1217 cases (10.7%) in rural regions versus 1039 cases (9.1%) in urban areas. Males showed a slightly higher prevalence of diabetes, with 1122 cases (12.2%) compared to 1134 cases (8.4%) in females. Age significantly influenced the diabetes rates, particularly among individuals aged ≥ 50 years, who accounted for the majority of cases. The results highlighted a strong correlation between diabetes and both hypertension and obesity, with those in the highest stages of these conditions showing the most significant prevalence. Overall, the analysis underscores that older age, rural residency, male sex, hypertension, and higher obesity stages are key factors associated with increased diabetes incidence in South Korea during this period.
Table A1. Cross-tabulation results for KNHANES (2015–2021 years).
DiabetesTotal
Before COVID-19 PandemicDuring COVID-19 Pandemic
2015201620172018201920202021
Residential area
Rural76 (0.7)164 (1.4)185 (1.6)57 (0.5)247 (2.2)244 (2.1)244 (2.1)1217 (10.7)
Urban158 (1.4)144 (1.3)154 (1.4)51 (0.4)171 (1.5)181 (1.6)180 (1.6)1039 (9.1)
Sex
Male123 (1.3)159 (1.7)184 (2.0) 0 (0)222 (2.4)218 (2.4)216 (2.3)1122 (12.2)
Female111 (0.8)149 (1.1)155 (1.1)108 (0.8)196 (1.4)207 (1.5)208 (1.5)1134 (8.4)
Age
19–29 years old0 (0.0)1 (0.0)0 (0.0)0 (0.0)0 (0.0)2 (0.1)1 (0.0)4 (0.2)
30–39 years old2 (0.1)6 (0.2)7 (0.2)3 (0.1)11 (0.3)10 (0.3)3 (0.1)42 (10.3)
40–49 years old19 (0.4)20 (0.5)28 (0.7)8 (0.2)37 (0.9)34 (0.8)30 (0.7)176 (40.1)
50–59 years old43 (0.9)60 (10.3)79 (10.7)24 (0.5)71 (10.5)107 (20.3)63 (10.4)447 (90.7)
60–69 years old96 (20.2)10 (20.3)106 (20.4)32 (0.7)127 (20.9)137 (30.2)154 (30.6)752 (170.4)
70–79 years old67 (20.3)109 (30.8)97 (30.4)33 (10.2)142 (50.0)107 (30.7)138 (40.8)693 (240.2)
Over 80 years old7 (10.0)12 (10.7)22 (30.0)8 (10.1)30 (40.1)28 (30.9)35 (40.8)142 (190.5)
Hypertension
Normal49 (0.5)45 (0.4)60 (0.6)17 (0.2)64 (0.6)85 (0.8)77 (0.7)397 (3.8)
Pre-hypertension49 (0.9)69 (1.2)57 (1.0)15 (0.3)91 (1.6)85 (1.5)79 (1.4)445 (7.9)
Hypertension136 (2.0)194 (2.9)222 (3.3)76 (1.1)263 (3.9)255 (3.8)268 (3.9)1414 (20.8)
Obesity
Underweight1 (0.1)2 (0.2)4 (0.4)0 (0.0)3 (0.3)2 (0.2)7 (0.8)19 (2.1)
Normal127 (1.2)152 (1.5)88 (0.8)32 (0.3)92 (0.9)87 (0.8)112 (1.1)690 (6.6)
Pre-obesity stage106 (1.8)154 (2.6)80 (1.4)30 (0.5)102 (1.7)111 (1.9)93 (1.6)676 (11.4)
1st stage obesity--144 (3.1)38 (0.8)182 (3.9)171 (3.6)181 (3.8)716 (15.2)
2nd stage obesity--22 (3.2)7 (1.0)35 (5.1)52 (7.6)21 (3.1)137 (20.0)
3rd stage obesity--1 (1.1)1 (1.1)4 (4.3)2 (2.2)10 (10.8)18 (19.4)

References

  1. Saeedi, P.; Petersohn, I.; Salpea, P.; Malanda, B.; Karuranga, S.; Unwin, N.; Colagiuri, S.; Guariguata, L.; Motala, A.A.; Ogurtsova, K.; et al. Global and regional diabetes prevalence estimates for 2019 and projections for 2030 and 2045: Results from the International Diabetes Federation Diabetes Atlas. Diabetes Res. Clin. Pract. 2019, 157, 107843. [Google Scholar] [CrossRef]
  2. Zheng, Y.; Ley, S.H.; Hu, F.B. Global aetiology and epidemiology of type 2 diabetes mellitus and its complications. Nat. Rev. Endocrinol. 2018, 14, 88–98. [Google Scholar] [CrossRef] [PubMed]
  3. Sonia, J.J.; Jayachandran, P.; Md, A.Q.; Mohan, S.; Sivaraman, A.K.; Tee, K.F. Machine-learning-based diabetes mellitus risk prediction using multilayer neural network no-prop algorithm. Diagnostics 2023, 13, 723. [Google Scholar] [PubMed]
  4. Care, D. Classification and diagnosis of diabetes. Diabetes Care 2017, 40, S11–S24. [Google Scholar]
  5. Kopitar, L.; Kocbek, P.; Cilar, L.; Sheikh, A.; Stiglic, G. Early detection of type 2 diabetes mellitus using machine learning-based prediction models. Sci. Rep. 2020, 10, 11981. [Google Scholar] [CrossRef]
  6. Adua, E.; Kolog, E.A.; Afrifa-Yamoah, E.; Amankwah, B.; Obirikorang, C.; Anto, E.O.; Acheampong, E.; Wang, W.; Tetteh, A.Y. Predictive model and feature importance for early detection of type II diabetes mellitus. Transl. Med. Commun. 2021, 6, 17. [Google Scholar]
  7. Sadeghi, S.; Khalili, D.; Ramezankhani, A.; Mansournia, M.A.; Parsaeian, M. Diabetes mellitus risk prediction in the presence of class imbalance using flexible machine learning methods. BMC Med. Inform. Decis. Mak. 2022, 22, 36. [Google Scholar] [CrossRef]
  8. Dritsas, E.; Trigka, M. Data-driven machine-learning methods for diabetes risk prediction. Sensors 2022, 22, 5304. [Google Scholar] [CrossRef]
  9. Srivastava, A.K.; Kumar, Y.; Singh, P.K. Hybrid diabetes disease prediction framework based on data imputation and outlier detection techniques. Expert Syst. 2022, 39, e12785. [Google Scholar] [CrossRef]
  10. Nnamoko, N.; Korkontzelos, I. Efficient treatment of outliers and class imbalance for diabetes prediction. Artif. Intell. Med. 2020, 104, 101815. [Google Scholar]
  11. Dashdondov, K.; Kim, M.H. Mahalanobis distance based multivariate outlier detection to improve performance of hypertension prediction. Neural Process. Lett. 2023, 55, 265–277. [Google Scholar] [CrossRef]
  12. James, G.; Witten, D.; Hastie, T.; Tibshirani, R. An Introduction to Statistical Learning; Springer: New York, NY, USA, 2013. [Google Scholar]
  13. Flores-Guerrero, J.L.; Grzegorczyk, M.A.; Connelly, M.A.; Garcia, E.; Navis, G.; Dullaart, R.P.; Bakker, S.J. Mahalanobis distance, a novel statistical proxy of homeostasis loss is longitudinally associated with risk of type 2 diabetes. eBioMedicine 2021, 71, 103550. [Google Scholar] [CrossRef] [PubMed]
  14. Li, W.; Lai, Z.; Tang, N.; Tang, F.; Huang, G.; Lu, P.; Jiang, L.; Lei, D.; Xu, F. Diabetic retinopathy related homeostatic dysregulation and its association with mortality among diabetes patients: A cohort study from NHANES. Diabetes Res. Clin. Pract. 2024, 207, 111081. [Google Scholar] [CrossRef] [PubMed]
  15. Korea Centers for Disease Control & Prevention. Available online: http://knhanes.cdc.go.kr (accessed on 4 February 2014).
  16. Kwan, B.S.; Cho, I.A.; Park, J.E. Effect of breastfeeding and its duration on impaired fasting glucose and diabetes in perimenopausal and postmenopausal women: Korea National Health and Nutrition Examination Survey (KNHANES) 2010–2019. Medicines 2021, 8, 71. [Google Scholar] [CrossRef]
  17. Bae, J.H.; Han, K.D.; Ko, S.H.; Yang, Y.S.; Choi, J.H.; Choi, K.M.; Kwon, H.-S.; Won, K.C.; on Behalf of the Committee of Media-Public Relation of the Korean Diabetes Association. Diabetes fact sheet in Korea 2021. Diabetes Metab. J. 2022, 46, 417–426. [Google Scholar] [CrossRef]
  18. Dashdondov, K.; Kim, M.H.; Song, M.H. Deep autoencoders and multivariate analysis for enhanced hypertension detection during the COVID-19 era. Electron. Res. Arch. 2024, 32, 3202–3229. [Google Scholar] [CrossRef]
  19. Montesinos, L.; Osval, A.; Crossa, J. Multivariate Statistical Machine Learning Methods for Genomic Prediction; Springer Nature: Cham, Switzerland, 2022. [Google Scholar]
  20. Taber, K.S. The use of Cronbach’s alpha when developing and reporting research instruments in science education. Res. Sci. Educ. 2018, 48, 1273–1296. [Google Scholar] [CrossRef]
  21. Khongorzul, D.; Mi-Hye, K.; Kyuri, J. NDAMA: A Novel Deep Autoencoder and Multivariate Analysis Approach for IoT-Based Methane Gas Leakage Detection. IEEE Access 2023, 11, 140740–140751. [Google Scholar]
  22. Anthony, H.; Kamnitsas, K. On the use of Mahalanobis distance for out-of-distribution detection with neural networks for medical imaging. In Proceedings of the International Workshop on Uncertainty for Safe Utilization of Machine Learning in Medical Imaging, Vancover, BC, Canada, 12 October 2023; Springer Nature: Cham, Switzerland, 2023; pp. 136–146. [Google Scholar]
  23. Zhang, M.; Zhang, Y.; Shen, G. PPDDS: A privacy-preserving disease diagnosis scheme based on the secure Mahalanobis distance evaluation model. IEEE Syst. J. 2021, 16, 4552–4562. [Google Scholar] [CrossRef]
  24. Sun, S. Segmentation-based adaptive feature extraction combined with mahalanobis distance classification criterion for heart sound diagnostic system. IEEE Sens. J. 2021, 21, 11009–11022. [Google Scholar] [CrossRef]
  25. Zhao, J.; Gao, H.; Yang, C.; An, T.; Kuang, Z.; Shi, L. Attention-Oriented CNN Method for Type 2 Diabetes Prediction. Appl. Sci. 2024, 14, 3989. [Google Scholar] [CrossRef]
  26. Belsti, Y.; Moran, L.; Du, L.; Mousa, A.; De Silva, K.; Enticott, J.; Teede, H. Comparison of machine learning and conventional logistic regression-based prediction models for gestational diabetes in an ethnically diverse population the Monash GDM Machine learning model. Int. J. Med. Inform. 2023, 179, 105228. [Google Scholar] [CrossRef]
  27. Gupta, N.; Kaushik, B.; Imam Rahmani, M.K.; Lashari, S.A. Performance Evaluation of Deep Dense Layer Neural Network for Diabetes Prediction. Comput. Mater. Contin. 2023, 76, 347–366. [Google Scholar] [CrossRef]
  28. Al Sadi, K.; Balachandran, W. Prediction model of Type 2 diabetes mellitus for omanpre-diabetess patients using artificial neural network and six machine learning classifiers. Appl. Sci. 2023, 13, 2344. [Google Scholar] [CrossRef]
  29. Hasan, M.K.; Alam, M.A.; Das, D.; Hossain, E.; Hasan, M. Diabetes prediction using ensembling of different machine learning classifiers. IEEE Access 2020, 8, 76516–76531. [Google Scholar] [CrossRef]
  30. Ali, M.S.; Islam, M.K.; Das, A.A.; Duranta, D.U.; Haque, M.F.; Rahman, M.H. A novel approach for best parameters selection and feature engineering to analyze and detect diabetes: Machine learning insights. BioMed Res. Int. 2023, 1, 8583210. [Google Scholar]
  31. Sharma, S.K.; Zamani, A.T.; Abdelsalam, A.; Muduli, D.; Alabrah, A.A.; Parveen, N.; Alanazi, S.M. A Diabetes Monitoring System and Health-Medical Service Composition Model in Cloud Environment. IEEE Access 2023, 11, 32804–32819. [Google Scholar] [CrossRef]
  32. Aminizadeh, S.; Heidari, A.; Toumaj, S.; Darbandi, M.; Navimipour, N.J.; Rezaei, M.; Talebi, S.; Azad, P.; Unal, M. The applications of machine learning techniques in medical data processing based on distributed computing and the Internet of Things. Comput. Methods Programs Biomed. 2023, 241, 107745. [Google Scholar] [CrossRef]
  33. Xu, J.; Chen, T.; Fang, X.; Xia, L.; Pan, X. Prediction model of pressure injury occurrence in diabetic patients during ICU hospitalization—XGBoost machine learning model can be interpreted based on SHAP. Intensiv. Crit. Care Nurs. 2024, 83, 103715. [Google Scholar] [CrossRef]
  34. Uddin, M.J.; Ahamad, M.M.; Hoque, M.N.; Walid, M.A.; Aktar, S.; Alotaibi, N.; Alyami, S.A.; Kabir, M.A.; Moni, M.A. A comparison of machine learning techniques for the detection of type-2 diabetes mellitus: Experiences from Bangladesh. Information 2023, 14, 376. [Google Scholar] [CrossRef]
  35. Pina, A.F.; Meneses, M.J.; Sousa-Lima, I.; Henriques, R.; Raposo, J.F.; Macedo, M.P. Big data and machine learning to tackle diabetes management. Eur. J. Clin. Investig. 2023, 53, e13890. [Google Scholar] [CrossRef] [PubMed]
  36. Wee, B.F.; Sivakumar, S.; Lim, K.H.; Wong, W.K.; Juwono, F.H. Diabetes detection based on machine learning and deep learning approaches. Multimed. Tools Appl. 2024, 83, 24153–24185. [Google Scholar] [CrossRef]
  37. Dashdondov, K.; Song, M.H. Factorial Analysis for Gas Leakage Risk Predictions from a Vehicle-Based Methane Survey. Appl. Sci. 2021, 12, 115. [Google Scholar] [CrossRef]
  38. Brownlee, J.; Machine Learning Algorithms from Scratch with Python. Machine Learning Mastery. 2016. Available online: https://machinelearningmastery.com/machine-learning-algorithms-from-scratch/ (accessed on 1 August 2024).
  39. Pedregosa, F.; Varoquaux, G.; Gramfort, A.; Michel, V.; Thirion, B.; Grisel, O.; Blondel, M.; Prettenhofer, P.; Weiss, R.; Dubourg, V.; et al. Scikit-learn: Machine learning in Python. J. Mach. Learn. Res. 2011, 12, 2825–2830. [Google Scholar]
  40. WHO. Diabetes. Available online: https://www.who.int/news-room/fact-sheets/detail/diabetes (accessed on 1 August 2024).
Figure 1. Architecture of proposed method for diabetes prediction. Clean dataset: removing missing values and unrelated features from diabetes [31]. MCD: Minimum Covariance Determinant method.
Applsci 14 07480 g001
Figure 2. Workflow for data preprocessing to predict diabetes risk using the KNHANES dataset from 2015 to 2021.
Applsci 14 07480 g002
Figure 3. Plots of diabetes features: (a) with outliers and (b) without outliers by the MAH distance for the target dataset.
Applsci 14 07480 g003
Figure 4. ROC curves for algorithm performance of the target dataset based on Table 5: (a) baseline models were tested using the dataset in Figure 2; (b) models enhanced by the proposed MAH-based outlier removal method.
Applsci 14 07480 g004
Figure 5. ROC curves for algorithm performance of the target dataset with k = 10-fold based on Table 6: (a) baseline models were tested using the dataset in Figure 2; (b) models enhanced by the proposed MAH-based outlier removal method using the target dataset in Figure 2.
Applsci 14 07480 g005
Figure 6. Influence of learning rate, number of estimators, and depth of trees on performance of XGBoost model. (a) Learning rate and n_estimator, (b) depth and n_estimator.
Applsci 14 07480 g006
Table 1. Summary of existing studies integrating the MAH and ML methods for predicting diabetes risk 1.
AuthorsYearsAlgorithmsComments
[25]2024SECNNThe SECNN model has an accuracy of 94.12% in NHANES dataset and an accuracy of 89.47% on the PIMA Indian dataset.
[26]2023CBC CatBoost classifier best performance, with an accuracy of 85% and an AUC of 93%.
[27]2023DDLNNThe model is best, with an accuracy of 84.42%.
[31]2023PCA + ELM PCA has the best performance with an accuracy of 90.57%.
[29]2020AB + XB The best model reaches an AUC of 95%.
[30]2023RFWBP The best performance, with an accuracy of 95.83%.
1 MAH: Mahalanobis distance. ML: machine learning. SECNN: Attention-Oriented Convolutional Neural Network. PIMA Indian dataset: Public Investment Management Assessment of India. NHANES: National Health and Nutrition Examination Survey. CBC: CatBoost Classifier. DDLNN: Deep Dense Layer Neural Network. PCA: Principal Component Analysis. ELM: Extreme Learning Machine. RFWBP: Random forest algorithm with the best parameters. AB + XB: The ensembling of two boosting (adaptive (AB) and gradient (XB))-type classifiers.
Table 2. Feature descriptions, mean and standard deviation, correlation, and MC analyses for the KNHANES (2015–2021) target dataset.
FeatureDescriptions MeanStd. Devp-ValueToleranceVIF 1
BP6_31Attempted suicide for 1 year20.040.189 0.193 5.171
BP7Counseling for mental issues for 1 year1.980.1430.149 0.235 4.261
HE_HbA1cGlycated hemoglobin5.690.623<0.0010.282 3.546
HE_gluFasting blood sugar99.1216.855<0.0010.315 3.173
HE_sbpEnd systolic blood pressure118.6716.2230.290 0.350 2.857
HE_altSerum glutamic pyruvic transaminase21.1813.468<0.001 0.380 2.632
HE_HPHypertension 1.860.859<0.0010.392 2.554
HE_astSerum glutamic oxaloacetic transaminase22.88.2480.670 0.428 2.335
AgeAge4.731.686<0.001 0.441 2.270
SexSex1.60.489<0.0010.442 2.260
HE_obeObesity (over 19 years old)2.750.964<0.0010.464 2.155
HE_dbpEnd diastolic blood pressure75.039.623<0.0010.484 2.065
BO1Subjective body shape recognition3.370.906<0.0010.487 2.053
HE_HCTHematocrit42.334.201<0.0010.520 1.924
BS13Exposure to secondhand smoke indoors in public1.850.360.101 0.526 1.900
HE_creaBlood creatinine0.80.1830.686 0.592 1.688
HE_BUNBlood urea nitrogen14.64.285<0.0010.640 1.563
BS9_2Exposure to secondhand smoke indoors at home2.80.4980.294 0.712 1.405
BP6_2Planned suicide for a year1.990.101<0.004 0.759 1.317
BP1Perceived level of stress on a daily basis2.880.720.227 0.789 1.268
BO2_1Weight control for 1 year2.281.30.213 0.805 1.242
YearSurvey year2018.122.032<0.001 0.827 1.209
HE_HCHOLHypercholesterolemia0.240.428<0.0010.851 1.175
HE_WBCLeukocyte6.091.628<0.0010.857 1.166
HE_HTGHypertriglyceridemia0.120.328<0.005 0.888 1.126
GraduateEducation level—graduation status1.561.3630.319 0.896 1.116
DJ8_ptAllergic rhinitis treatment6.912.6990.362 0.907 1.102
DJ6_ptSinusitis treatment7.541.8470.261 0.948 1.055
BD1_11Frequency of drinking per year3.692.122<0.019 0.951 1.051
DL1_ptAtopic dermatitis treatment7.880.9680.176 0.958 1.044
HE_fhFamily history of chronic dis. diagnosed 0.670.7930.060 0.972 1.028
DH4_ptOtitis media treatment7.631.6760.245 0.975 1.026
RegionRegion7.394.9180.520 0.976 1.024
HE_hepaBHepatitis B surface antigen positive0.020.129<0.043 0.991 1.009
1 Dependent variable: diabetes. Predictors: features. VIF: variance inflation factor. Statistical significance (p < 0.05).
Table 3. Descriptive statistics of target variables for target datasets with and without FS and MAH 1.
ClassDataset with FSDataset with FS and MAH
TotalTrain 70%Test 30%TotalTrain 70%Test 30%
Normal14,64810,186444213,31893243994
Pre-diabetes887662382638777554262349
Diabetes37782673110525181777741
Total27,28219,097818523,61116,5277084
1 Dataset with FS: experimental dataset (case number = 27,443, feature = 37). Dataset with FS and MAH: target dataset for outliers removed based on MAH (case number 23,612, feature = 37).
Table 4. Comparison of Cronbach’s alpha for KNHANES 2020–2021.
Total CaseCronbach’s AlphaFeatures Number
Dataset without MAH *27,2820.59924
Dataset with MAH **23,6110.64124
* Experimental dataset based on Figure 2. ** Target dataset based on Figure 2.
Table 5. Evaluation comparison of the proposed methods on the target dataset based on training 70% and testing 30%.
Algorithms (Selected Features)Accuracy (%)AUC (%)F1-Score (%)
Base (165)MC
(24)
XGB
(66)
RF
(22)
Base
(165)
MC
(24)
XGB
(66)
RF
(22)
Base
(165)
MC
(24)
XGB
(66)
RF
(22)
Baseline model *XGB96.7897.7597.7297.7497.8398.4898.4798.4697.2497.9597.9697.97
KNN40.0977.4766.1366.3858.5083.5675.7475.9244.4479.7170.6870.83
DT93.8194.0793.9693.9396.9297.0597.0496.9495.8796.1795.9296.05
NB48.2153.3348.2153.1478.2384.2979.3783.4363.7570.4064.2969.26
RF95.4297.2696.9197.2597.2997.2698.0498.2197.4997.7497.6897.91
Proposed model **MAH_XGB97.7997.9897.9297.7698.5298.6498.6198.4797.9998.2198.1797.94
MAH_KNN41.9378.7167.6967.4859.5384.3976.7676.5944.1279.7170.8170.98
MAH_DT94.5195.3195.0594.1397.1797.5897.4697.0396.3496.8696.6396.04
MAH_NB54.9460.9255.7164.6079.4585.2780.4783.8166.1271.9667.6872.65
MAH_RF96.6797.6297.2997.2597.9698.4398.2898.2297.5197.9397.9497.74
* The baseline model was tested using the dataset in Figure 2 and without outlier removal. ** The proposed model was tested using the target dataset in Figure 2 with outlier removal.
Table 6. Comparison of the proposed methods on the target dataset based on k = 10 cross-validation and Cronbach’s alpha = 0.641 1.
Algorithms (Selected Features)Accuracy (%)AUC (%)F1-Score (%)
Base
(165)
MC
(24)
XGB
(66)
RF
(22)
Base
(165)
MC
(24)
XGB
(66)
RF
(22)
Base
(165)
MC
(24)
XGB
(66)
RF
(22)
Baseline model *XGB97.0297.9697.8397.7797.5198.5898.5598.597.0498.0898.0397.96
KNN33.6877.665.6666.0154.0083.6275.3575.6433.9377.9366.7667.12
DT94.50194.4494.3994.6397.597.297.1597.396.6996.3096.2496.41
NB42.0854.0048.5653.977.7784.6679.883.7869.6578.5472.7377.35
RF96.0897.5597.17897.4796.6898.3698.2198.3596.7297.8097.6397.80
Proposed model **MAH_XGB97.2298.0497.9697.6997.4498.7198.7298.3997.2298.2498.2797.81
MAH_KNN48.5278.8067.3667.464.6984.3876.4676.4752.6778.7968.0267.97
MAH_DT94.1494.9794.9494.1695.0797.4797.4997.0894.7594.6896.6196.16
MAH_NB53.6061.0157.0365.6182.8185.2381.5184.4477.479.1674.9478.44
MAH_RF96.8597.7197.2897.1796.7398.4498.3498.1696.7497.8997.8297.52
1 The Cronbach’s alpha value was 0.641, which indicates the reliability of the scale. This can be used in our study dataset to remove outliers and predict the diabetes risk using MAH. * The baseline model was tested using the dataset in Figure 2 and without outlier removal. ** The proposed model was tested using the target dataset in Figure 2 with outlier removal.
Table 7. Statistical significance of the overall mean accuracy, p-values, and CI values for diabetes risk prediction using ML algorithms on target dataset 1.
AlgorithmsAccuracy (%)p-Value95% CI
MAH_XGB98.043.52 × 10−1597.89~98.59
MAH_KNN78.803.89 × 10−1577.66~79.89
MAH_DT94.973.33 × 10−1593.56~97.52
MAH_RF97.713.98 × 10−1597.62~98.08
MAH_NB61.013.93 × 10−1579.88~81.96
1 95% confidence interval (CI): a 95% confidence interval is a statistical measure that provides a range of values based on sample data, within which there is a 95% probability that the correct population parameter will lie. p-value: the p-value represents the likelihood of obtaining results that are as extreme as or more extreme than the observed results under the assumption that the null hypothesis is true. Statistical significance was set at p < 0.05.
Table 8. Comparison of classification applications of ML models using other methods for diabetes risk prediction 1.
AlgorithmsAccuracy (%)AUC (%)
CatBoost CBC [26]85.093.0
DDLNN [27]84.42-
AB + XB [29]-95.0
RFWBP [30]83.086.0
PCA + ELM [31]90.57-
Proposed method_MAH_XGB98.0498.71
1 MAH_XGB: XGB within Mahalanobis distance. CatBoost CBC: CatBoost Classifier. DDLNN: Deep Dense Layer Neural Network. PCA: Principal Component Analysis. ELM: Extreme Learning Machine. RFWBP: Random forest algorithm with the best parameters. AB + XB: The ensembling of two boosting (adaptive (AB) and gradient (XB))-type classifiers.
Disclaimer/Publisher’s Note: The statements, opinions and data contained in all publications are solely those of the individual author(s) and contributor(s) and not of MDPI and/or the editor(s). MDPI and/or the editor(s) disclaim responsibility for any injury to people or property resulting from any ideas, methods, instructions or products referred to in the content.

