Abstract
Earthquake-triggered landslides represent a significant seismic-related disaster, posing threats to both the lives and property of individuals in affected areas. Furthermore, they can result in road and river blockages, as well as other secondary disasters, significantly impacting post-earthquake rescue efforts. Efficient, accurate, and rapid assessment of high-risk landslide zones carries important implications for decision making in disaster response and for mitigating potential secondary disasters. The high-intensity zones VII to IX of the Luding Ms6.8 earthquake on 5 September, 2022, were used as a case study here. Based on the simple Newmark model, the difference method and the cumulative displacement method were employed to assess earthquake-triggered landslides. The assessment results from both methods demonstrated that the areas posing an extremely high risk of earthquake-triggered landslides were predominantly situated on the western side of the Xianshuihe Fault. Verification using actual landslide data showed that both methods had high predictive accuracy, with the difference method slightly outperforming the cumulative displacement method. Moreover, this study recommends determining threshold values for each landslide risk interval having physical meanings using previous data on strong earthquakes when utilizing the difference method to assess the risk of earthquake-triggered landslides.
1. Introduction
Earthquake-triggered landslides occur when slope materials slide due to strong seismic motion. These landslides directly jeopardize the lives and property of individuals in earthquake-prone areas. For instance, the 2008 Wenchuan earthquake led to a landslide in the western region of Beichuan County, resulting in the burial of approximately 1600 people and the destruction of hundreds of houses [1]. Additionally, earthquake-triggered landslides can disrupt traffic, damage critical infrastructure, and create blockages in rivers, leading to the formation of barrier lakes in affected areas, all of which have detrimental effects on rapid rescue efforts [1,2,3,4,5,6]. Therefore, the efficient, accurate, and rapid assessment of high-risk areas for earthquake-triggered landslides holds great significance in reducing losses caused by secondary disasters during the rapid response stage following earthquakes.
Currently, there are numerous rapid assessment methods for regional earthquake-triggered landslides, which can be broadly categorized into two groups. The first category consists of indicator system methods, which involve developing evaluation techniques based on various parameters related to earthquake-triggered landslides and faults, such as the magnitude, the distance from the epicenter, and the distribution of rivers and roads. These methods include models such as logistic regression [7,8,9], support vector machines [10,11], and neural networks [12,13]. The second category is that of the Newmark method, which is based on the principle of mechanical equilibrium and has been widely applied in earthquake landslide risk assessments worldwide [14]. After the 8.0-magnitude Wenchuan earthquake occurred, global scholars conducted preliminary research on the landslide inversion results of the Wenchuan earthquake based on the Newmark method, and they achieved relatively good assessment effects [15,16,17,18]. Chen used the critical acceleration in the Newmark method as a criterion to quickly assess the landslide risk induced by the 2013 Lushan 7.0-magnitude earthquake [19]. Researchers used the Newmark method to conduct earthquake-triggered landslide assessments for the 2014 Ludian earthquake [20,21]. The Newmark method was also applied to the seismic landslide risk assessment of the 2015 Nepal 7.9-magnitude earthquake [22,23]. The Newmark method was also applied in the assessment of landslide risks triggered by the 2017 Jiuzhaigou 7.0-magnitude earthquake [24,25]. Wei used the Newmark method to assess the landslide risk of the 2022 Qinghai Madduo 7.4-magnitude earthquake [26]. Furthermore, Yong-shuang used the Newmark method to assess the seismic landslide risk of the Xianshuihe Fault zone due to seismic conditions [27]. Unlike indicator system methods, the Newmark method is not constrained by differences in the geological background and provides evaluation results with relatively clear physical significance. This method has been used in various earthquake cases around the globe [28,29,30,31].
Within the Newmark method, there are two main approaches for determining earthquake landslide risk: the difference method and the cumulative displacement method. The difference method assesses risk based on the magnitude of the difference between the peak ground acceleration (PGA) and the critical acceleration of rock–soil mass, with a larger difference indicating a higher risk of earthquake-triggered landslides [23,24,26,32,33]. On the other hand, the cumulative displacement method uses the relationship between the PGA and permanent cumulative displacement to calculate the displacement of rock–soil mass and determine landslide risk based on the magnitude of the displacement value [27,34,35,36,37]. While both methods have shown effectiveness in previous earthquake case studies, further comparative research is required to fully understand their respective advantages, disadvantages, and applicability. Through comparing the results of different assessment methods, researchers can evaluate the reliability and accuracy of each method and select the most suitable one for a given situation. Comparative research can also help users better understand the method’s limitations and application scenarios, which helps to promote the improvement and refinement of methods. Additionally, the comparative study of evaluation methods can provide decision-making support for earthquake landslide disaster prevention and mitigation.
On 5 September 2022, Luding County in Sichuan Province was struck by a magnitude 6.8 earthquake; its epicenter was located at 29.25° N, 102.08° E, and it had a focal depth of 16 km. The earthquake reached an intensity of IX according to the China Earthquake Network Center (www.cenc.ac.cn, accessed on 11 September 2022), causing widespread damage to infrastructure, including transportation networks, power systems, and buildings. Additionally, the seismic event triggered a substantial number of landslides, exacerbating the devastation [37,38,39,40] (refer to Figure 1). By the end of the emergency response phase on 11 September, the earthquake had claimed 118 lives, with 86% being attributed to secondary geological disasters, such as landslides and collapses.
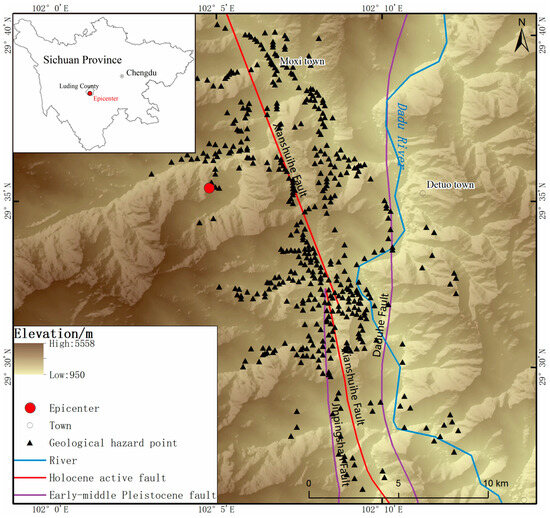
Figure 1.
Geographic overview and earthquake-triggered landslides distribution map.
Following the earthquake, researchers conducted extensive field investigations and utilized remote sensing data to compile distribution data on the earthquake-triggered landslides, providing valuable insights for studying rapid assessment methods in such scenarios. This study focuses on high-intensity areas—notably, Moxi Town and Detuo Town—during the Luding earthquake (rated VII–IX) and employs the difference method and cumulative displacement method to assess the risk of earthquake-induced landslides in the region. The validation of these methods relies on actual landslide data, allowing for a comprehensive analysis of their strengths, weaknesses, and applicability in similar contexts.
2. Methods and Data
2.1. Two Assessment Methods Based on the Newmark Model
The Newmark model, which was introduced by Newmark in 1965, was originally developed to assess the stability of dams in response to seismic activity [14]. According to this method, when ground motion produces a peak acceleration surpassing the critical acceleration (Ac) associated with the most precarious surface, a slider is initiated to slide along this surface, leading to cumulative displacement. Essentially, the model posits that a rock–soil mass with a higher Ac value necessitates a greater peak ground acceleration (PGA) to induce cumulative displacement, indicating that a larger Ac value generally corresponds to enhanced stability during seismic events. Therefore, after a critical acceleration distribution map of the regional rock–soil mass has been prepared, the value of Ac can be combined with the PGA to quickly determine the earthquake-triggered landslide risk of the rock–soil mass within the seismic zone.
To calculate Ac, we need to first calculate the static safety factor (Fs) of the rock–soil body under non-seismic conditions. The static safety coefficient can be computed using the principle of limit equilibrium [41].
In Formula (1), Fs represents the static factor of safety, while c’, φ’, and γ denote the physical and mechanical parameters of the rock–soil mass—specifically, the effective cohesion (kPa), effective friction angle (°), and unit weight (kN/m3), respectively. The selection of the rock–soil physical mechanics parameters c’, φ’, and γ is detailed in the Data Source Section. The variable t represents the slope-normal failure slab thickness, which, in the context of this earthquake, where landslides were predominantly small to medium-sized [37,38,39], is considered as 3 m. The slope angle (°), denoted by α, was determined using digital elevation models (DEMs) within the study area, while m signifies the proportion of the slab thickness that is saturated. Given the absence of rainfall during this seismic event, the value of m is assumed to be 0. After Fs was calculated, we were ready to perform the calculation of Ac. Ac, representing the critical acceleration of the rock–soil mass in the study area, can be computed from Fs using Formula (2).
By employing the difference method and cumulative displacement method, the seismically triggered landslide risk of the rock–soil mass in the study area was evaluated based on the critical acceleration (Ac) and peak ground acceleration (PGA).
The difference method involves treating the PGA and Ac as distinct entities and utilizing their difference as the primary metric for assessing the risk of earthquake-triggered landslides. A larger difference indicates a heightened risk of such landslides, while a smaller difference suggests a lower risk. On the other hand, the cumulative displacement method involves fitting Ac with the PGA to directly determine the permanent cumulative displacement of the rock–soil mass (DN) under the influence of ground motion. In the process of the permanent cumulative displacement method, DN serves as the basis for assessing the risk of earthquake-triggered landslides. It is important to note that the empirical formula used to calculate DN exhibits regional characteristics. In previous studies, various researchers have obtained numerous empirical formulas in different regions, but these formulas often exhibit regional characteristics and lack universality; the same formula may yield significantly different fitting results in various regions [42,43]. Therefore, it is advisable to employ fitting formulas that are most suitable for the specific study area.
To ensure regional applicability, we utilized an empirical formula derived from previous research—specifically based on cumulative displacement records from the Wenchuan strong earthquake—to calculate the cumulative displacement of the rock–soil masses in the current earthquake event (refer to Formula (3)) [36].
The formula utilizes DN to represent the permanent cumulative displacement (in cm), while Ac and PGA denote the critical acceleration (in g) and peak ground acceleration (in g), respectively. Notably, the empirical formula boasts an impressive coefficient of determination R2 of 91.4%.
Figure 2 illustrates the processes of these two assessment methods, showing the similarities and differences between them. Both methods were based on calculations utilizing DEM data and geological maps to determine the critical acceleration (Ac) of the rock–soil masses within the study area. Notably, the difference method employed the PGA-Ac difference to directly assess the earthquake-triggered landslide risk, whereas the cumulative displacement method used an empirical formula to calculate the Newmark displacement based on PGA-Ac, and it subsequently evaluated the earthquake-triggered landslide risk based on the rock–soil mass’s Newmark displacement. Finally, the assessment results of the two methods were verified using actual landslide data.
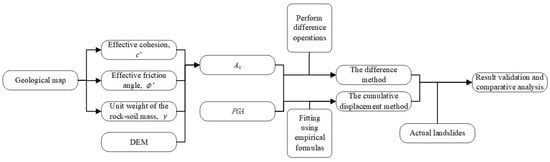
Figure 2.
Research flowchart.
2.2. Data Source
It is known from Formula (1) that, except for the already determined t and m, the calculation of Fs also requires the determination of the terrain slope and rock–soil physical mechanical parameters within the study area. Slope data were derived from pre-earthquake shuttle radar topography mission (SRTM) DEMs with a 30 m resolution, which were sourced from the official website of the United States Geological Survey (www.usgs.gov, accessed on 11 September 2022).
In addition, the physical mechanical parameters of the rock–soil mass needed for calculating Fs can be determined using regional geological data. This study utilized geological map data at a scale of 1:200,000 obtained from the National Geological Data Center (www.ngac.cn, accessed on 11 September 2022). In accordance with the engineering classification standard for rock mass [44], the rock–soil masses within the research area were categorized into four types (refer to Figure 3): very hard (I), harder (II), softer (III), and extremely soft (IV).
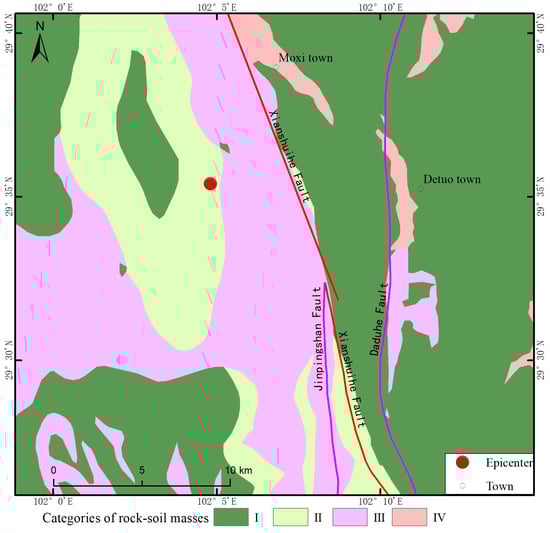
Figure 3.
Categories of rock–soil masses.
In detail, the very hard category predominantly encompassed intermediate acidic intrusive rocks, such as granite and diorite, while the harder types included limestone, dolomite, calcareous dolomite, and dolomitic limestone. The softer types comprised sedimentary rocks such as conglomerate, mudstone, and slate, while the extremely soft type referred to loose deposits of the Holocene series. Drawing upon the aforementioned standards and relevant studies in neighboring regions [16,23,24,25], we assigned specific values to the physical and mechanical parameters of various rock–soil masses (see Table 1).

Table 1.
Physical and mechanical parameters of the rock–soil masses in the study area.
After calculating Fs, it could be used to calculate Ac via Formula (2). Then, using Ac and the seismic parameters of this earthquake, the earthquake-triggered landslide risk of the study area due to seismic action could be evaluated. Given the limited number of seismic stations within the earthquake zone, only one station was situated in the study area, located at the perimeter. Consequently, the PGA data for this study were acquired through transformation and interpolation analysis by leveraging the earthquake intensity map released by the Ministry of Emergency Management of the People’s Republic of China (www.mem.gov.cn, accessed on 11 September 2022) and the Chinese seismic intensity scale (refer to Figure 4) [45]. The interpolated PGA data ranged from 174 to 830 gal, exhibiting consistency with both the seismic station recordings within the earthquake zone and the seismic intensity map released by the Ministry of Emergency Management of the People’s Republic of China.
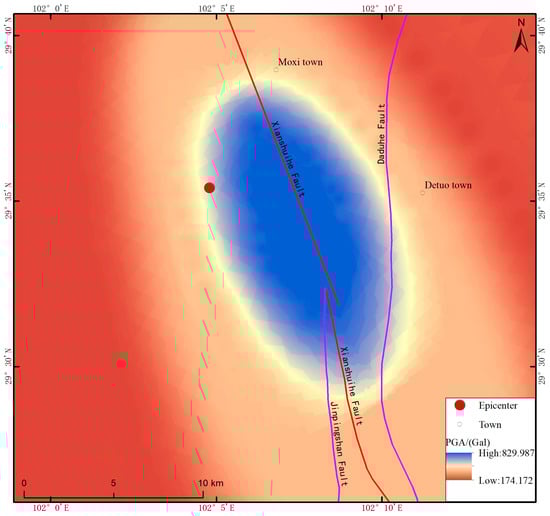
Figure 4.
Distribution of PGA.
3. Results
3.1. The Susceptibility of Earthquake-Triggered Landslides in the Research Area
As described in the Data Source Section, we collected terrain slope data and physical mechanical parameters of rock–soil masses within the study area, and we could calculate the critical acceleration (Ac) of rock–soil masses within the study area by sequentially using Formulas (1) and (2) (refer to Figure 5). The results of the calculations revealed that the critical acceleration of the rock–soil masses within the area was constrained by the Xianshuihe Fault. Notably, there was a distinct numerical pattern characterized by lower values in the west and higher values in the east. This suggested a higher propensity for earthquake-triggered landslides on the western side of the Xianshuihe Fault due to ground motion.
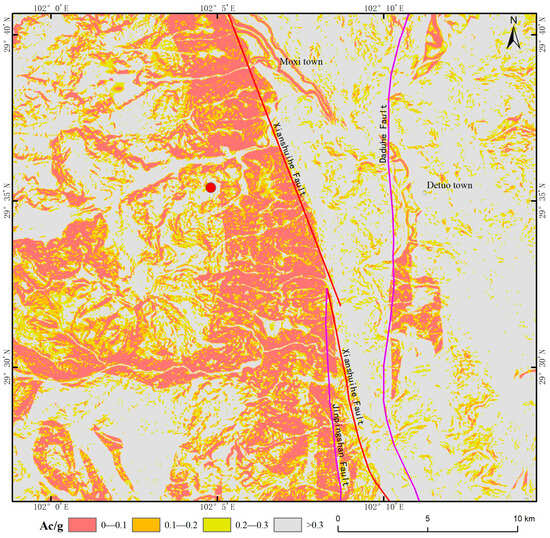
Figure 5.
Critical acceleration of rock–soil masses.
3.2. Assessment Results of the Difference Method
By conducting a differential analysis between the PGA and Ac, we then utilized the natural breaks method to classify the earthquake landslide risk. The natural breaks method is a method used in Geographic Information Systems (GIS) to classify and segment data (https://desktop.arcgis.com/, accessed on 16 September 2022). This method categorizes data by identifying natural breaks or change points in the data values, which serve as the basis for classification. The fundamental idea is to find the natural breaks or change points in the data and then classify each data point according to one of these breaks. The advantages of natural breaks classification are that it can automatically classify data without human intervention and that it can avoid the influence of human factors. Additionally, it can further refine and subdivide data, improving the accuracy and reliability of classification. This classification method has the characteristic that it can identify small intra-class differences and significant inter-class differences, which gives it a certain advantage in assessing the level of earthquake-triggered landslide risk. By using this method, we divided the earthquake-triggered landslide risk in the study area into five distinct categories: extremely low-risk areas, low-risk areas, medium-risk areas, high-risk areas, and extremely high-risk areas.
Figure 6 shows that the earthquake-triggered landslide risk evaluation conducted using the difference method exhibited a distinctive pattern of high risk in the west and low risk in the east, delineated by the Xianshuihe Fault. Particularly noteworthy was the concentration of extremely high-risk zones predominantly on the western side of the fault line. Additionally, the earthquake-triggered landslide risk classification demonstrated a gradual decrease towards the surrounding regions, mirroring the distribution of the PGA. Statistical analysis revealed that the distribution of the earthquake-triggered landslide risk classification in the study area, ranging from extremely high to extremely low, stood at 8.27%, 22.77%, 27.21%, 21.50%, and 20.25%.
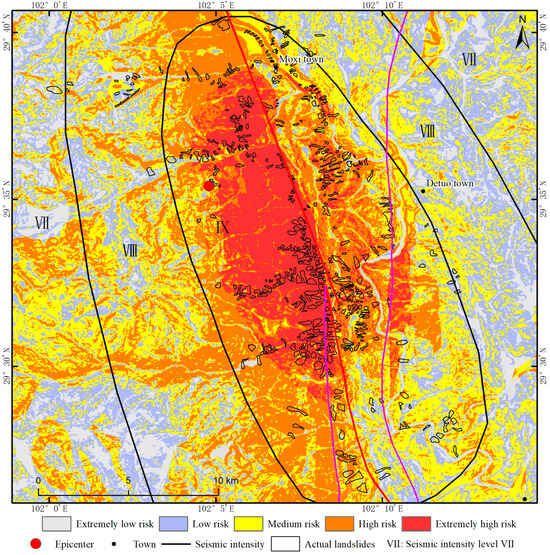
Figure 6.
Results of the assessment of the risk of earthquake-triggered landslides (using the difference method).
3.3. Assessment Results of the Cumulative Displacement Method
In this study, we employed empirical Formula (3) to compute the permanent cumulative displacement of the rock–soil masses within the study area due to ground motion. As described in the Methods and Data Section, using this formula can meet the regional requirements of an empirical formula and reduce unnecessary errors brought about by an empirical formula. The empirical formula we used was derived from the strong-motion records of the 8.0-magnitude Wenchuan earthquake [36]. The research area in this study is located in Luding County, Sichuan Province, which has a similar geographical and geological environment to the 8.0-magnitude Wenchuan earthquake in 2008, and therefore, this study used the formula to calculate DN.
Subsequently, we assessed the earthquake-triggered landslide risk by evaluating the magnitude of the cumulative displacement value. Integrating the results derived from Formula (3) with the critical displacement values determined in prior studies [18,37,46,47], the earthquake-triggered landslide risk within the study area was classified into extremely low-risk, low-risk, medium-risk, high-risk, and extremely high-risk zones, with boundary values set at 0.5, 1, 2, and 5 cm.
As shown in Figure 7, the earthquake-triggered landslide risk classification obtained through this method ranged from extremely high to extremely low, encompassing 19.82%, 3.67%, 3.10%, 3.15%, and 70.26% of the study area, respectively.
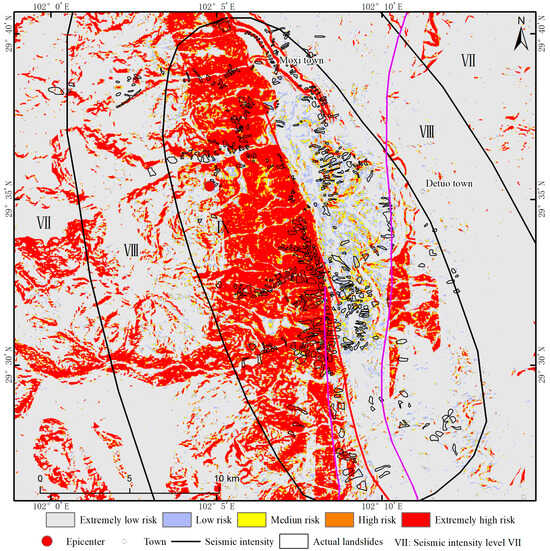
Figure 7.
Results of the assessment of the risk of earthquake-triggered landslides (using the cumulative displacement method).
4. Analysis and Discussion
4.1. Analysis of the Assessment Results
On the whole, the evaluation results from both methods demonstrated that the areas posing an extremely high risk of earthquake-triggered landslides were predominantly situated on the western side of the Xianshuihe Fault, exhibiting a similar distribution pattern to that of the critical acceleration of the rock–soil masses.
Concurrently, the difference method identified elevated earthquake-triggered landslide risks on both sides of the Daduhe Fault, aligning with the observed real-world scenario. Conversely, the cumulative displacement method indicated a relatively heightened risk of earthquake-triggered landslides on the western side of the Daduhe Fault, accompanied by isolated high-risk zones on the eastern side. Notably, the actual distribution of seismic landslides deviated somewhat from the assessment results.
In general, the proportion of the study area having different earthquake-induced landslide risk levels obtained by the two types of assessment methods showed significant differences (Figure 8). This was due to the different methods used for classifying risk levels, with the difference method employing a natural break classification method to categorize the assessment results, which yielded statistically significant threshold values. In contrast, the cumulative displacement method relied on the findings of previous research and the experience of classifiers to determine the classification breakpoints, resulting in threshold values having physical significance. Although the classification differences were significant, both classification methods have previously achieved good verification results in multiple case studies [6,15,17,18,20,22,23,26,32,33,48,49].
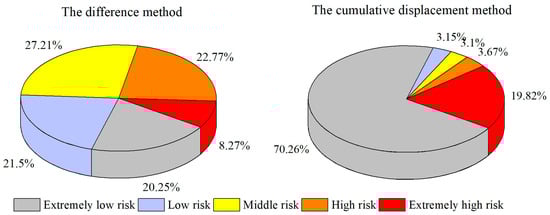
Figure 8.
The proportion of each risk level assessed by the two methods in the study area.
In the study area, a comprehensive collection of 476 earthquake-triggered landslides was amassed [39], covering an approximate total area of 17.81 km2. These data were employed in this study as validation data to facilitate a comparative analysis of the assessment results derived from the two methods.
We evaluated the accuracy of the two models using receiver operating characteristic (ROC) curves, which are a comprehensive indicator reflecting the sensitivity and specificity of continuous variables [50]. The evaluation criteria were as follows: when the area under curve (AUC) < 0.5, the prediction results were opposite; when the AUC = 0.5, it indicated a random model; an AUC between 0.5 and 0.7 suggested low accuracy; an AUC between 0.7 and 0.9 indicated high accuracy; when the AUC > 0.9, the model accuracy was very high [51].
We used 476 actual landslides triggered by the earthquake as landslide samples. Additionally, we randomly selected 476 non-landslide samples outside a 100-meter buffer zone from the actual landslide samples, totaling 952 sample points (Figure 9). In order to conduct a quantitative comparison of the two assessment methods, we assigned the five levels of earthquake-triggered landslide risk assessment from low to high as a possibility of 0.2, 0.4, 0.6, 0.8, and 1.0. We defined actual landslide samples as a possibility of 1 and non-landslide samples as a possibility of 0. Then, we statistically analyzed the prediction values of the two assessment methods for landslide and non-landslide samples, respectively, and finally input the statistical results into the Origin 2021 (9.8) software to plot the ROC curve.
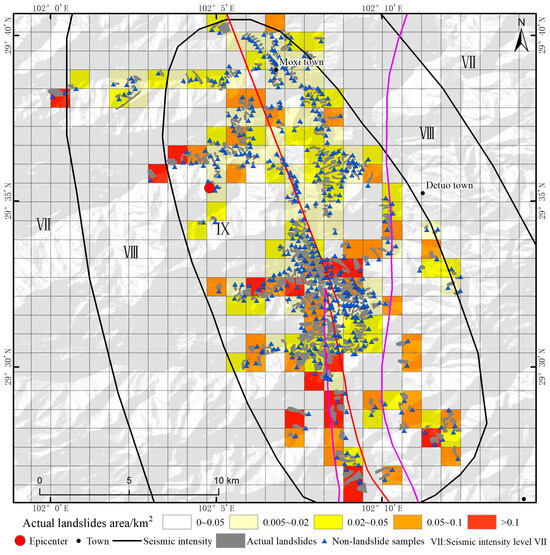
Figure 9.
Actual landslides and non-landslide samples.
The ROC curve (Figure 10) displayed the prediction performance of the two assessment methods. The AUC values were 0.804 and 0.762, respectively, indicating that both methods have extremely high predictive abilities and can effectively distinguish between landslide samples and non-landslide samples. In terms of the shape of the ROC curve, both methods were located above the reference line, and the validation curve of the difference method was closer to the upper left corner. The results showed that both models had high predictive accuracy (both exceeding 0.7), with the difference method model slightly outperforming the cumulative displacement method model (Figure 10).
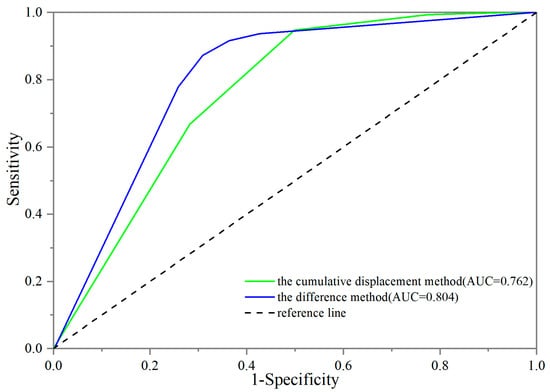
Figure 10.
ROC curve of two earthquake-triggered landslide assessment methods.
4.2. Discussion
The Luding 6.8 earthquake was employed as a case study here, and both the difference method and the cumulative displacement method based on the Newmark model were used to evaluate the risk of earthquake-triggered landslides and conduct a comparative analysis.
The validation results showed that both evaluation methods had high reliability, with the difference method slightly outperforming the cumulative displacement method. Unlike the complex cumulative displacement fitting formula, the difference method directly performed the difference operation between the PGA and Ac. As a result, the assessment results obtained with this method not only reflected the characteristics of the seismic landslide susceptibility of rock–soil masses but also captured the distribution and attenuation of the PGA. The difference method has been demonstrated to have effective performance in the study of earthquake landslides across numerous earthquake cases [24,26,32,33,48,49].
Nevertheless, it is important to note that the natural breaks method, which forms the basis of the difference method for classifying the risk level of earthquake-triggered landslides, lacks clear physical significance in its natural break values [26,48,49]. Consequently, different sample data may result in varying breakpoints, potentially leading to the classification of the same risk level with different thresholds in distinct earthquake case studies, thus potentially impacting the assessment results.
The cumulative displacement method employs empirical formulas to calculate the permanent cumulative displacement values of rock–soil masses for assessing earthquake-triggered landslide risk. This method not only facilitates a rapid evaluation of such risks but also enables predictions regarding potential loosening points induced by earthquakes within the rock–soil masses. It is crucial to bear in mind that the regional applicability of the empirical formula utilized to calculate the permanent cumulative displacement must be considered when employing this method [35,36,52]. Selecting an appropriate empirical formula tailored to the specific study area is imperative to avoid potential deviations in the assessment results.
In conclusion, the regional earthquake-triggered landslide risk assessment technology based on the Newmark method has significantly advanced from its initial stage; however, there are still numerous shortcomings that require urgent improvement. Regarding the difference method, it is imperative to determine threshold values for each landslide risk interval having clear physical significance through the study of previous significant earthquake data. This approach will ensure that the assessment results not only receive verification-level support but also possess a solid theoretical foundation. As for the cumulative displacement method, establishing a fitting formula with a high regression coefficient between ground motion and cumulative displacement in each earthquake-prone area is crucial. Furthermore, improving the Newmark method itself entails establishing a more refined database of physical and mechanical parameters for rock–soil masses, along with regular updates of high-precision terrain data [18,25,52,53]. These measures will contribute to enhancing the accuracy and reliability of the method’s assessment results.
5. Conclusions
This study employed two assessment methods to assess earthquake-triggered landslides caused by the Ms6.8 earthquake in Luding, Sichuan Province, China. This study summarized the distribution characteristics of earthquake-triggered landslide risk in the research area obtained through assessment and conducted a quantitative comparative study of the two assessment methods using actual landslide data. Finally, we discussed the application and improvement of the assessment methods. The specific conclusions obtained were as follows:
(1) Both assessment methods demonstrated that the areas posing an extremely high risk of earthquake-triggered landslides were predominantly situated on the western side of the Xianshuihe Fault.
(2) Actual landslide data verification showed that both methods had high predictive accuracy, with the difference method slightly outperforming the cumulative displacement method.
(3) It is imperative to determine threshold values for each landslide risk interval with clear physical meanings using previous data on strong earthquakes when utilizing the difference method to assess the risk of earthquake-triggered landslides.
Author Contributions
Data curation, J.Y.; formal analysis, M.L.; funding acquisition, H.L. and D.L.; investigation, H.S.; methodology, H.L.; resources, J.Y. and C.D.; writing—original draft, H.L.; writing—review and editing, D.L. All authors have read and agreed to the published version of the manuscript.
Funding
This research was funded by Key Tasks for Youth in Earthquake Emergency Response of China Earthquake Administration (grant number: CEAEDEM20240206), the Zhejiang Provincial Natural Science Foundation of China (grant number: LTGG24D040002), and Research on Major Policy Theory and Practice Issues of China Earthquake Administration (grant number: CEAZY2024JZ01); the APC was funded by the Zhejiang Provincial Natural Science Foundation of China (grant number: LTGG24D040002).
Institutional Review Board Statement
Not applicable.
Informed Consent Statement
Not applicable.
Data Availability Statement
The data presented in this study are available on a publicly accessible website.
Conflicts of Interest
The authors declare no conflicts of interest.
References
- Yin, Y.P.; Wang, F.W.; Sun, P. Landslide hazards triggered by the 2008 Wenchuan earthquake, Sichuan, China. Landslides 2009, 6, 139–152. [Google Scholar] [CrossRef]
- Keefer, D.K.; Larsen, M.C. Assessing landslide hazards. Science 2007, 316, 1136–1138. [Google Scholar] [CrossRef] [PubMed]
- Cui, P.; Chen, X.Q.; Zhu, Y.Y.; Su, F.H.; Wei, F.Q.; Han, Y.S.; Liu, H.J.; Zhuang, J.Q. The wenchuan earthquake (may 12, 2008), sichuan province, china, and resulting geohazards. Nat. Hazards 2011, 56, 19–36. [Google Scholar] [CrossRef]
- Xu, C.; Xu, X.; Yao, X.; Dai, F. Three (nearly) complete inventories of landslides triggered by the May 12, 2008 Wenchuan Mw 7.9 earthquake of China and their spatial distribution statistical analysis. Landslides 2014, 11, 441–461. [Google Scholar] [CrossRef]
- Boudriki, B.B.; Molina, C.; Park, H.; Camps, A. First results on the systematic search of land surface temperature anomalies as earthquakes precursors. Remote Sens. 2023, 15, 1110. [Google Scholar] [CrossRef]
- Li, H.Y.; Chen, T.; Yang, F.P.; Chen, Q.; Xu, X.; Zhang, M.; Dai, C.; Zhou, H. Rapid estimation of road landslides based on Newmark method for the 6.1 magnitude earthquake in Lushan, Sichuan. North China Earthq. Sci. 2023, 41, 16–21. (In Chinese) [Google Scholar]
- Nowicki, M.A.; Hamburger, M.W.; Allstadt, K.; Wald, D.J.; Robeson, S.M.; Tanyas, H.; Hearne, M.; Thompson, E.M. A global empirical model for near-real-time assessment of seismically induced landslides. J. Geophys. Res. Earth Surf. 2018, 123, 1835–1859. [Google Scholar] [CrossRef]
- Xu, C.; Xu, X.W.; Dai, F.C.; Wu, Z.; He, H.; Shi, F.; Wu, X.; Xu, S. Application of an incomplete landslide inventory, logistic regression model and its validation for landslide susceptibility mapping related to the may 12, 2008 wenchuan earthquake of china. Nat. Hazards 2013, 68, 883–900. [Google Scholar] [CrossRef]
- Ayalew, L.; Yamagishi, H. The application of GIS-based logistic regression for landslide susceptibility mapping in the Kakuda-Yahiko Mountains, central Japan. Geomorphology 2005, 65, 31. [Google Scholar] [CrossRef]
- Xu, C.; Dai, F.C.; Xu, X.W.; Lee, Y.H. Gis-based support vector machine modeling of earthquake-triggered landslide susceptibility in the Jianjiang river watershed, China. Geomorphology 2012, 145–146, 70–80. [Google Scholar] [CrossRef]
- Yao, X.; Tham, L.G.; Dai, F.C. Landslide susceptibility mapping based on support vector machine: A case study on natural slopes of hong kong, china. Geomorphology 2008, 101, 572–582. [Google Scholar] [CrossRef]
- Pradhan, B.; Lee, S. Landslide susceptibility assessment and factor effect analysis: Backpropagation artificial neural networks and their comparison with frequency ratio and bivariate logistic regression modelling. Environ. Model. Softw. 2010, 25, 747–759. [Google Scholar] [CrossRef]
- Yilmaz, I. (2010). Comparison of landslide susceptibility mapping methodologies for koyulhisar, Turkey: Conditional probability, logistic regression, artificial neural networks, and support vector machine. Environ. Earth Sci. 2010, 61, 821–836. [Google Scholar] [CrossRef]
- Newmark, N.M. Effects of earthquakes on dams and embankments. Géotechnique 1965, 15, 139–160. [Google Scholar] [CrossRef]
- Godt, J.; Sener, B.; Verdin, K.; Wald, D.J.; Earle, P.S.; Harp, E.L.; Jibson, R. Rapid assessment of earthquake-induced landsliding. In Proceedings of the First World Landslide Forum; United Nations University: Tokyo, Japan, 2008. [Google Scholar]
- Zhou, H.J.; Wang, X.; Yuan, Y. Risk assessment of disaster chain: Experience from Wenchuan earthquake-induced landslides in China. J. Mt. Sci. 2015, 12, 1169–1180. [Google Scholar] [CrossRef]
- Wang, T.; Wu, S.R.; Shi, J.S.; Xin, P. Application and validation of seismic landslide displacement analysis based on Newmark model: A case study in Wenchuan earthquake. Acta Geol. Sin. (Engl. Ed.) 2013, 87, 393–397. [Google Scholar]
- Ma, S.Y.; Xu, C. Applicability of two Newmark models in the assessment of coseismic landslide hazard and estimation of slope-failure probability: An example of the 2008 Wenchuan Mw 7.9 earthquake affected area. J. Earth Sci. 2019, 30, 1020–1030. [Google Scholar] [CrossRef]
- Chen, X.L.; Yuan, R.M.; Yu, L. Applying the Newmark’s model to the assessment of earthquake-triggered landslides during the Lushan earthquake. Seismol. Geol. 2013, 35, 661–670. (In Chinese) [Google Scholar]
- Chen, X.L.; Liu, C.G. Assessment of landslides triggered by earthquakes based on the combination of peak ground motion and critical acceleration analysis. In IAEG/AEG Annual Meeting; Springer: San Francisco, CA, USA; Cham, Switzerland, 2019; pp. 123–129. [Google Scholar]
- Chen, X.L.; Liu, C.G.; Wang, M.M.; Zhou, Q. Causes of unusual distribution of coseismic landslides triggered by the Mw 6.1 2014 ludian, yunnan, china earthquake. J. Asian Earth Sci. 2018, 159, 17–23. [Google Scholar] [CrossRef]
- Gallen, S.F.; Clark, M.K.; Godt, J.W.; Roback, K.; Niemi, N.A. Application and evaluation of a rapid response earthquake-triggered landslide model to the 25 April 2015 Mw 7.8 Gorkha earthquake, Nepal. Tectonophysics 2017, 714–715, 173–187. [Google Scholar] [CrossRef]
- Haneberg, W.C.; Johnson, S.E.; Gurung, N. Response of the Laprak, Nepal, landslide to the 2015 Mw 7.8 Gorkha earthquake. Nat. Hazards 2022, 111, 567–584. [Google Scholar] [CrossRef]
- Yue, X.L.; Wu, S.H.; Yin, Y.H.; Gao, J.; Zheng, J. Risk identification of seismic landslides by joint Newmark and rockfall analyst models: A case study of roads affected by the jiuzhaigou earthquake. Int. J. Disaster Risk Sci. 2018, 9, 116–130. [Google Scholar] [CrossRef]
- Chen, X.L.; Shan, X.J.; Zhang, L.; Liu, C.; Han, N.; Lan, J. Quick assessment of earthquake-triggered landslide hazards: A case study of the 2017 Ms7.0 Jiuzhaigou earthquake. Earth Sci. Front. 2019, 26, 312–320. (In Chinese) [Google Scholar]
- Wei, Y.K.; Chen, X.L. Applicability of different seismic landslide risk assessment methods: A case study of Maduo Ms7.4 earthquake. Seismol. Geol. 2022, 44, 590–603. (In Chinese) [Google Scholar]
- Zhang, Y.S.; Yang, Z.H.; Guo, C.B.; Wang, T.; Wang, D.H.; Du, G.L. Predicting landslide scenes under potential earthquake scenarios in the Xianshuihe fault zone, Southwest China. J. Mt. Sci. 2017, 14, 1262–1278. [Google Scholar] [CrossRef]
- Wilson, R.C.; Keefer, D.K. Dynamic analysis of a slope failure from the 6 August 1979 Coyote Lake, California, earthquake. Bull. Seismol. Soc. Am. 1983, 73, 863–877. [Google Scholar] [CrossRef]
- Jibson, R.W. Regression models for estimating coseismic landslide displacement. Eng. Geol. 2007, 91, 209–218. [Google Scholar] [CrossRef]
- Wang, X.; Nie, G.; Ma, M. Evaluation model of landslide hazards induced by the 2008 Wenchuan earthquake using strong motion data. Earthq. Sci. 2011, 24, 311–319. [Google Scholar] [CrossRef][Green Version]
- Zeng, Y.; Zhang, Y.; Liu, J.; Wang, Q.; Zhu, H. Rapid emergency response assessment of earthquake-induced landslides driven by fusion of InSAR deformation data and Newmark physical models. Remote Sens. 2023, 15, 4605. [Google Scholar] [CrossRef]
- Chen, X.L.; Liu, C.G.; Yu, L.; Lin, C.-X. Critical acceleration as a criterion in seismic landslide susceptibility assessment. Geomorphology 2014, 217, 15–22. [Google Scholar] [CrossRef]
- Maharjan, S.; Gnyawali, K.R.; Tannant, D.D.; Xu, C.; Lacroix, P. Rapid terrain assessment for earthquake-triggered landslide susceptibility with high-resolution DEM and critical acceleration. Front. Earth Sci. 2021, 9, 689303. [Google Scholar] [CrossRef]
- Ambraseys, N.N.; Menu, J.M. Earthquake-induced ground displacements. Earthq. Eng. Struct. Dyn. 1988, 16, 985–1006. [Google Scholar] [CrossRef]
- Jibson, R.W.; Harp, E.L.; Michael, J.A. A Method for Producing Digital Probabilistic Seismic Landslide Hazard Maps: An Example from the Los Angeles, California, Area; U.S. Geological Survey Open-File Report: Washington, DC, USA, 1998; pp. 98–113. [Google Scholar]
- Xu, G.X.; Yao, L.K.; Li, C.H.; Wang, X.F. Predictive models for permanent displacement of slopes based on recorded strong-motion data of Wenchuan earthquake. Chin. J. Geotech. Eng. 2012, 34, 1131–1136. (In Chinese) [Google Scholar]
- Liu, X.M.; Su, P.C.; Li, Y.; Xia, Z.; Ma, S.; Xu, R.; Lu, Y.; Li, D.; Lu, H.; Yuan, R. Spatial distribution of landslide shape induced by Luding Ms6.8 earthquake, Sichuan, China: Case study of the Moxi Town. Landslides 2023, 20, 1667–1678. [Google Scholar] [CrossRef]
- Xiao, Z.K.; Xu, C.; Huang, Y.D.; He, X.; Shao, X.; Chen, Z.; Xie, C.; Li, T.; Xu, X. Analysis of spatial distribution of landslides triggered by the Ms 6.8 Luding earthquake in China on September 5, 2022. Geoenviron. Disasters 2023, 10, 3. [Google Scholar] [CrossRef]
- Zhang, J.J.; Chen, L.; Li, Y.L.; Liu, M.S.; Shi, S.W.; Yi, J.S.; Zhang, W.; Zhang, S.L.; Sun, J.H.; Yang, D.; et al. Development characteristics and controlling factors of coseismic geohazards triggered by the Luding Ms 6.8 earthquake occurred on September 5. 2022. Acta Seismol. Sin. 2023, 45, 167–178. (In Chinese) [Google Scholar]
- Zhang, J.Q.; Yang, Z.J.; Meng, Q.K.; Wang, J.; Hu, K.-H.; Ge, Y.-G.; Su, F.-H.; Zhao, B.; Zhang, B.; Jiang, N.; et al. Distribution patterns of landslides triggered by the 2022 Ms 6.8 Luding earthquake, Sichuan, China. J. Mt. Sci. 2023, 20, 607–623. [Google Scholar] [CrossRef]
- Jibson, R.W.; Harp, E.L.; Michael, J.A. A method for producing digital probabilistic seismic landslide hazard maps. Eng. Geol. 2000, 58, 271–289. [Google Scholar] [CrossRef]
- Hsieh, S.; Lee, C. Empirical estimation of the Newmark displacement from the Arias intensity and critical acceleration. Eng. Geol. 2011, 122, 34–42. [Google Scholar] [CrossRef]
- Dreyfus, D.K.; Rathje, E.M.; Jibson, R.W. The influence of different simplified sliding-block models and input parameters on regional predictions of seismic landslides triggered by the Northridge earthquake. Eng. Geol. 2013, 163, 41–54. [Google Scholar] [CrossRef]
- GB/T 50218-2014; Ministry of Housing and Urban-Rural Development of the People’s Republic of China. Standard for Engineering Classification of Rock Mass. China Planning Press: Beijing, China, 2015. (In Chinese)
- GB/T 17742-2020; State Administration for Market Regulation. The Chinese Seismic Intensity Scale. Standards Press of China: Beijing, China, 2020. (In Chinese)
- Wieczorek, G.F.; Wilson, R.C.; Harp, E.L. Map Showing Slope Stability during Earthquakes in San Mateo County, California; U.S. Geological Survey Miscellaneous Investigations Series Map: Reston, VA, USA, 1985; I,1257E. [Google Scholar]
- Pareek, N.; Pal, S.; Kaynia, A.M.; Sharma, M.L. Empiricalbased seismically induced slope displacements in a geographic information system environment: A case study. Georisk Assess. Manag. Risk Eng. Syst. Geohazards 2014, 8, 258–268. [Google Scholar] [CrossRef]
- Chen, X.L.; Shan, X.J.; Wang, M.M.; Liu, C.-G.; Han, N.-N. Distribution pattern of coseismic landslides triggered by the 2017 Jiuzhaigou Ms7.0 earthquake of China: Control of seismic landslide susceptibility. ISPRS Int. J. Geo-Inf. 2020, 9, 198. [Google Scholar] [CrossRef]
- Chen, X.; Liu, C.; Wang, M. A method for quick assessment of earthquake-triggered landslide hazards: A case study of the Mw6.1 2014 Ludian, China earthquake. Bull. Eng. Geol. Environ. 2018, 78, 2449–2458. [Google Scholar] [CrossRef]
- Swets, J.A. Measuring the accuracy of diagnostic systems. Science 1988, 240, 1285–1293. [Google Scholar] [CrossRef]
- Brenning, A. Spatial prediction models for landslide hazards; review, comparison and evaluation. Nat. Hazards Earth Syst. Sci. 2005, 5, 853–862. [Google Scholar] [CrossRef]
- Roberto, R. Seismically induced landslide displacements: A predictive model. Eng. Geol. 2000, 58, 337–351. [Google Scholar]
- Bojadjieva, J.; Sheshov, V.; Christophe, B. Hazard and risk assessment of earthquake-induced landslides—Case study. Landslides 2018, 15, 161–171. [Google Scholar] [CrossRef]


Disclaimer/Publisher’s Note: The statements, opinions and data contained in all publications are solely those of the individual author(s) and contributor(s) and not of MDPI and/or the editor(s). MDPI and/or the editor(s) disclaim responsibility for any injury to people or property resulting from any ideas, methods, instructions or products referred to in the content. |
© 2024 by the authors. Licensee MDPI, Basel, Switzerland. This article is an open access article distributed under the terms and conditions of the Creative Commons Attribution (CC BY) license (https://creativecommons.org/licenses/by/4.0/).