Abstract
The research addresses challenges in food safety related to the migration of contaminants from plastics to food. It focused on the physicochemical and sensory degradation of olive oils packaged in polyethylene terephthalate (PET) and subjected to thermal exposure at 40 °C and 60 °C for several weeks and a subsequent 12 months of storage, as well as the stability and migration of compounds from the PET packaging itself. Olive oils (OO) from Spanish supermarkets (a mixture of refined and virgin, with commercial identifications of mild and intense) were selected and subjected to thermal treatments at 40 °C and 60 °C for 1, 2, and 3 weeks, followed by 12 months of storage. The treatments were conducted through the following two independent experiments: Experiment A focused on immediate analysis post-thermal treatment, while Experiment B included a 12-month storage period post-thermal treatment. The presence of antimony (Sb) was analyzed using acid digestion with nitric acid (HNO3) and high-resolution inductively coupled plasma mass spectrometry (HR-ICP-MS), while the metals cadmium (Cd), copper (Cu), lead (Pb), and iron (Fe) were analyzed using inductively coupled plasma mass spectrometry (ICP-MS). The PET characterization was assessed using Fourier transform infrared spectroscopy in the mid-infrared range (FT-IR/MIR), carbonyl index, and differential scanning calorimetry (DSC). The results showed increases in the acidity index by 0.29%, the peroxide value by 25.92%, and the K268 coefficient by 51.22% between the control sample and the most severe treatments, with more pronounced effects observed after 12 months. Sensory quality declined, with reduced intensity of the “fruity” attribute and increased presence of the “rancid” defect. PET degradation was reflected in an increase in the carbonyl index and greater structural amorphization. Fe was the predominant metal, and Sb concentration increased after thermal treatments. The lack of studies on the raw consumption of oils packaged in PET and the concerns about the migration of compounds from the packaging to the food highlight the relevance of this research. This study provides new insights into the effects of thermal exposure and storage on the migration of PET contaminants into oils, contributing to the development of strategies to ensure food safety and product quality.
1. Introduction
Food security (FS) has evolved significantly, with increasing focus on the regulation and control of food packaging, particularly in the use of materials like polyethylene terephthalate (PET). While PET has enhanced the durability and functionality of packaging, its use also raises important concerns about the potential migration of contaminants into food products. Understanding and addressing these risks is crucial to ensuring that modern packaging does not compromise FS [1,2].
Food contamination, both biological and chemical, remains a significant concern, causing foodborne illnesses due to microorganisms and chemical residues [3,4]. Food poisoning occurs from the ingestion of poorly prepared, improperly stored, or inadequately preserved foods and can be caused by physical, biological, and chemical contamination. Foods can become contaminated during their production, transport, storage, and preparation due to factors such as soil, water, air, and utensils. Therefore, food contamination is defined as the presence of extrinsic agents that compromise human safety and health [5,6].
These extrinsic agents can include heavy metals, such as cadmium, mercury, lead, and arsenic, which are highly toxic and non-biodegradable, accumulating in the environment and humans through air, water, and food and causing serious health issues. Environmental contamination by these metals, exacerbated by industrial and natural activities, negatively affects food security and public health, with effects ranging from damage to vital organs to cancer [5,7].
There is also the migration of substances from packaging to food, an increasing concern as certain toxic components can transfer and compromise food safety. Polyethylene terephthalate (PET), widely used in food packaging, can release minor compounds such as antimony, a catalyst used in its manufacture. The role of PET in the migration of heavy metals and other contaminants is critical, particularly given how factors such as temperature, contact time, and the nature of the food influence this process. This underscores the need for strict regulations to ensure FS and minimize the risks posed by packaging materials [8,9,10].
Within the current legislative framework on contaminants and heavy metals in foods and edible vegetable oils, such as olive oil, notable regulations include EU2023/915 [11], EU2020/1245 [12], and Codex Alimentarius [13], which outline the recommended maximum limits of these contaminants in food. However, there remains a certain laxity for many of these limits or even a lack of specific legislation, such as for cadmium, which lacks specific regulations governing its presence in foods.
Regarding vegetable oils, which are essential for the global diet and economy, the primary crops include soybean, rapeseed, and sunflower. Globally, palm oil is the most consumed, but in the European Union, olive oil stands out as a leader in production and consumption, representing approximately 67% of the global supply. In Spain, olive oil is also the most consumed, noted for its high market share, while PET remains the predominant packaging for edible vegetable oils, with 70% global usage [14,15].
Most studies on virgin olive oil (VOO) have focused on the evolution of quality parameters and shelf life over 12 months under various storage conditions, improving the understanding of the autooxidation process [16,17,18]. Antioxidant components, acidic composition, and antioxidant activity during prolonged storage have also been investigated [19,20], as well as the effect of storage at different temperatures and extraction conditions [21,22,23]. However, studies on the degradation of olive oils packaged in PET, derived from refining, and mixed with virgin fractions for commercial use as olive oil (OO) according to Regulation (EU) 2022/2104 [24] are limited for raw consumption. These have primarily focused on their use in frying and stability at high temperatures (170 °C to 185 °C) [25,26]. The existing literature focuses on the resistance of refined oil to oxidation under frying conditions, but there is little information on its behavior under thermal treatments and prolonged storage for raw consumption. It is necessary to investigate how these factors affect the quality and stability of refined olive oil to improve its preservation and use in culinary applications.
Current challenges, such as heavy metal contamination and the migration of substances from packaging, highlight the urgent need for more robust and specific regulations to protect public health. In this context, the following research will focus on analyzing the implications of contaminants in food, particularly in vegetable oils like olive oil, with the aim of identifying critical areas for improving food safety and consumer protection.
The quality of olive oil is affected by thermal exposure and prolonged storage, as reflected in physicochemical parameters such as the acidity index (AG), peroxide value (PV), and extinction coefficients, as well as in sensory analysis. Additionally, the degradation of PET containers, which are used for their transparency and resistance, is crucial for oil preservation. Exposure to high temperatures accelerates PET degradation, releasing compounds that alter the oil’s properties. This study proposes that thermal exposure at different temperature ranges and subsequent storage for 12 months could increase the mentioned physicochemical parameters and that PET degradation under thermal treatment would enhance the release of chemical compounds. Testing these hypotheses is essential to improve olive oil preservation strategies and better understand the impact of PET containers on the oil’s long-term quality.
2. Materials and Methods
2.1. Olive Oil Samples
For this study, only olive oils (OO) packaged in polyethylene terephthalate (PET) and available in supermarkets were selected as a commercial category according to Regulation (EU) 2022/2104 [24]. These oils are legitimately marketed in Spain with the labels “mild” and “intense”, terms referring to the proportion of virgin olive oil in the blend; “mild” contains 85–90% refined olive oil and 10–15% virgin olive oil, while “intense” contains 75–80% refined olive oil and 20–25% virgin olive oil. These products comply with the aforementioned regulation and Royal Decree 760/2021 [27] in Spain. In this study, the mild olive oil was coded as O04, and the intense olive oil was coded as O01. The selection of these oils was based on a previous study analyzing the most consumed oils worldwide [28], noting that many studies did not specify whether the oils were virgin, possibly because in many countries, extra virgin olive oil (EVOO) or virgin olive oil (VOO) is not marketed, but olive oil (OO) is. All containers were acquired respecting batch homogeneity and stored at room temperature (25 °C) and in darkness until the respective treatments began.
2.2. Olive Oil Treatments
The treatment of the samples was conducted through the following two independent experiments, which are detailed in Table 1:

Table 1.
Treatment conditions of mild olive oil (O04) and intense olive oil (O1).
- Experiment A: This experiment focused on the physicochemical and organoleptic analysis of the oils and PET degradation (groups T0a to T6 in Table 1). The thermal study was carried out at temperatures of 40 °C and 60 °C for periods of 1, 2, and 3 weeks, respectively. After the thermal treatments, the samples were transferred to opaque glass jars and analyzed immediately;
- Experiment B: This experiment also involved the physicochemical and organoleptic analysis of the oils and PET degradation (groups T0b to T12 in Table 1). The methodology was similar to that of Experiment A; however, the oil samples were stored in darkness at room temperature (25 °C) for a period of 12 months following the thermal treatments. After this time, the samples were analyzed to assess their quality.
In both experiments, the treatments were applied in triplicate to the oil samples contained in their original PET packaging. The samples were kept in darkness throughout the process and rotated inside the oven (Memmert, model UM 600, Schwabach, Germany) on Mondays and Thursdays during the thermal treatments.
2.3. Olive Oil Physicochemical Parameters
The acidity index (AG) was determined according to the methodology described in ISO 660:2020, applicable to animal and vegetable oils and fats [29]. A 20 g sample was dissolved in a mixed solvent of ethanol and diethyl ether in a 1:1 ratio, and the free fatty acids present were titrated with a potassium hydroxide (0.1 M) solution. The titration was performed in the presence of phenolphthalein as an indicator. The acidity index (AG) was expressed as a percentage of oleic acid. All measurements were performed in triplicate. The obtained results were compared with the limits established by Regulation (EEC) 2568/91 (currently in force is Regulation (EU) 2022/2104) [24,30].
The peroxide value (PV) was expressed as milliequivalents of active oxygen per kilogram of oil and was determined according to the methodology described in ISO 3960:2007 [31]. A sample of 1.2–2.0 g of oil was dissolved in a mixture of chloroform and acetic acid (2:3 v/v). Then, 1 mL of saturated KI solution was added, and after agitation and maintaining in darkness for 5 min, 75 mL of deionized water was added. Finally, the sample was titrated with sodium thiosulfate and starch solution as an indicator. All measurements were performed in triplicate. The obtained results were compared with the limits established by Regulation (EEC) 2568/91 (currently in force is Regulation (EU) 2022/2104) [24,30].
The extinction coefficients K232 and K268 were calculated according to the analytical method described by Regulation (EEC) 2568/91 (currently in force is Regulation (EU) 2022/2104) [24,30], using spectrophotometric testing. A 100 mg sample of oil was dissolved in 25 mL of isooctane, and the extinction of the solution at the specified wavelengths was determined, compared with the pure solvent. Specific extinctions were calculated from the spectrophotometer readings using a quartz cell with a 1 cm optical path. All measurements were performed in triplicate.
The sensory analysis was conducted according to document COI/T.20/Doc. N°. 5 of 2007 [32]. The tasting panel consisted of 8 tasters (4 women and 4 men) aged between 25 and 45 years. They carried out the sensory evaluation and linked the flavor stimuli of the oils with a numerical scale (0–10) according to the standards [32]. Following the protocol for conducting the organoleptic test, with the necessary means established and the conditions indicated in the regulations clarified, the selected tasters smelled and tasted the sample in the tasting cup, analyzing perceptions through olfactory, gustatory, and retronasal pathways. On the standardized profile sheet according to the regulation, the tasters recorded and rated the presence and intensity of the aromas and flavors in each sample analyzed. In this analysis, positive perception was dedicated to the intensity of fruitiness, while negative perception was oriented toward identifying defects such as rancidity. However, commercial olive oil (OO) is not subjected to sensory analysis, as this type of evaluation is reserved for virgin olive oils (VOO) that have not undergone refining processes. Nevertheless, this testing procedure was included with the aim of establishing a methodology and observing trends associated with the chosen treatments. Moreover, since the final composition of commercial olive oil (OO) is organoleptically limited by the higher proportion of refined olive oil in the blend, only “fruity” intensity was considered a positive attribute, while “rancid” and any defects potentially related to PET were considered defects. In this context, only trends associated with the treatments were evaluated.
The determination of photosynthetic pigments, chlorophyll, and carotenoid content, was established according to the approach outlined by Puentes [33], which involves measuring the absorbance of olive oil dissolved in cyclohexane at the maximum wavelength of the predominant compound in the chlorophyll fraction (phaeophytin α) and the carotenoid fraction (luteolin). For the absorbance measurements, standard solutions with known concentrations were prepared. Specifically, a chlorophyll reference solution was made with a concentration of 10 µg/mL of phaeophytin α, and a carotenoid reference solution was made with a concentration of 5 µg/mL of luteolin. Following the procedure, 3.0 g of sample was weighed and dissolved with cyclohexane up to the mark in a 10 mL flask. The sample was stirred and homogenized and then measured in a spectrophotometer at 670 nm for chlorophylls and 470 nm for carotenoids.
The total chlorophyll and carotenoid content was obtained using the following equation:
where
- Cp: pigment concentration (mg pigment/kg oil);
- Aγ: absorbance at 470 nm (carotenoids) or 670 nm (chlorophylls);
- ε1%: specific absorbance measurement of a 1% (w/v) solution. εi (phaeophytin α): 613 or εi (luteolin): 2000;
- ma: mass of oil sample (g);
- Vf: final volume of solution (mL).
2.4. PET Degradation
The determination of the influence of treatments on the spectral band behavior of PET containers was conducted using Fourier transform infrared spectroscopy with mid-infrared technology (FT-IR/MIR; Vertex 70, Bruker, Billerica, MA, USA). Spectra acquisition was performed with 32 scans/min, a resolution of 4 cm⁻1, and a reading range between 400 and 4000 cm⁻1. The sample preparation involved cutting fragments from the original containers, which were cleaned solely with water and soap and rinsed with distilled water. Once dried, both the internal and external faces were analyzed.
The study of the chemical and crystallographic behavior of PET containers after applying the treatments was carried out using differential scanning calorimetry (DSC; Mettler Toledo Model 822e, Greifensee, Switzerland). This determination allowed for the quantification of the crystallinity percentage of the PET container samples. The DSC analysis involved weighing approximately 5 mg of plastic sample in an aluminum crucible. It was subjected to heating with a ramp from 30 °C to 330 °C at a rate of 5 °C/min and a 3 h hold. The resulting thermograms were analyzed using STARe software Version 16.30 (Build 13243), and crystallinities were determined using the enthalpy of fusion for 100% crystalline polyesters (PET = 140 J/g) [34].
2.5. Determination of Heavy Metals
Just as the type of oil was carefully selected for this study, the most commonly analyzed metals worldwide were also chosen [28]. This selection was based on their relevance in previous studies, with the predominant metals being cadmium (Cd), lead (Pb), copper (Cu), and iron (Fe). Additionally, antimony (Sb) was considered due to its presence in the PET container as a catalyst used in the PET polymerization process. The determination of heavy metals Cd, Pb, Cu, and Fe was performed using inductively coupled plasma mass spectrometry (ICP-MS; Agilent Model 7900, Santa Clara, CA, USA). The calibration curve was prepared by diluting a multi-element standard solution with high-purity deionized water to obtain concentrations of 0.5 ppb, 1 ppb, 5 ppb, and 10 ppb for the calibration standards. The ISTD MIX 500 ppb multi-element standard containing internal standards 45-Sc, 72-Ge, 103-Rh, and 193-Ir used for the determination of the various metals studied was prepared. Subsequently, the prepared solutions were introduced into the ICP-MS equipment. Once the solutions from the different types of oils were ready for analysis, the blanks, calibration standards, and samples were placed in the automatic sampler. On the other hand, the determination of Sb was performed using high-resolution inductively coupled plasma mass spectrometry (HR-ICP-MS; Element XR, Thermo Fisher Scientific, Bremen, Germany). For this, the samples were digested by weighing 1 g into a PTFE digestion tube using an analytical balance. Then, 4 mL of HNO3 + 4 mL of H2O + 1 mL of H2O2 was added, and digestion was carried out in a microwave digestion oven at pressure. Once digestion was completed, the samples were diluted to a final volume of 25 mL with deionized water quality 1 (18.2 MΩ⋅cm). The digestion procedure followed the program detailed in Table 2.
Table 2.
Operating program for the microwave of mild olive oil (O04) and intense olive oil (O1).
To ensure precision and robustness in the analysis, instrumental parameters and validation criteria were established. Table 3 and Table 4 outline the validation criteria used to assess the accuracy and precision of the method, thereby ensuring the quality and consistency of the obtained results.
Table 3.
Detailed instrumental parameters and validation criteria for analytical method.
Table 4.
Validation and precision results for analytical method (N = 4).
2.6. Statistical Analysis
A multifactorial analysis of variance (ANOVA) was conducted using SPSS software (IBM SPSS Statistics 20). This analysis aims to develop a statistical model to assess the impact of two or more categorical factors on a dependent variable. Tests were performed to identify significant differences between mean values and to examine potential interactions between the factors. The ANOVA table provides a decomposition of the variability of the measured parameter into contributions from the individual factors. Since Type III sums of squares were employed, the interactions between factors were assessed while controlling for the effects of the other factors. The p values indicate the statistical significance of each factor. Additionally, a post hoc analysis using Tukey’s HSD test was performed to determine which specific observations exhibited significant differences. Furthermore, a T-Student analysis was conducted for those analyses with a smaller number of groups to ensure robust statistical evaluation.
3. Results and Discussion
3.1. Physicochemical Parameters
In this section, the obtained results are detailed, and the influence of the treatments is interpreted with the aim of evaluating the potential loss and deterioration of the physicochemical and sensory parameters of the studied oils. Table 5 presents the obtained results from the various analyses conducted.
Table 5.
Physicochemical parameters of mild olive oil (O04) and intense olive oil (O1).
3.1.1. Acidity Index (AG)
In Table 5, the treatments applied in Experiments A and B (referred to as A and B hereafter) did not show an increasing or decreasing trend in results concerning the treatments, nor did they exhibit a significant percentage change in O04 and O1 for A. However, for B, the O04 oil displayed either stable or decreasing values with the thermal treatments. In O1, the acidity values decreased or remained stable up to the T2 treatment, increasing only with more aggressive treatments. Similar to A, no considerable changes in acidity were observed following the treatments. Authors conducting similar treatments did not observe changes in acidity, suggesting that these treatments might have been insufficient to impact this parameter, unlike more severe treatments [35,36]. This could be due to the sample’s nature (low presence of free fatty acids) or the short exposure times not being enough to produce significant changes in acidity. Ultimately, both oils complied with the current legislation in A and B, which stipulates an acidity value of ≤1.0 [24,30].
3.1.2. Peroxide Value (PV)
Analyzing the results of A, it was observed that the PV values for O04 and O1 generally showed an increase with treatments compared to the control oil value (Table 5). Regarding the evolution of PV, it is noted that O04 reached a maximum value in the T5 treatment, while O1 reached a maximum in the T2 treatment. In B, a decrease in PV was observed in O04 for the 40 °C treatments of T7 y T8, followed by an increase with a maximum at T10. In O1, an increase in PV was observed across all treatments. Additionally, there was a maximum increase of 11.95% and 25.92%, respectively, for the T10 treatment. In this case, no clear trend of peroxide value reduction was observed in the 60 °C treatment.
There is no consensus in the literature on the evaluation of PV after thermal treatments. Some authors observed a significant decrease in PV with treatments similar to those established in this research [37,38]. Others observed a slight increase in the PV of extra virgin olive oil after 120 min of microwave heating at 170 °C, while a decrease in parameters was observed in virgin olive oil under the same conditions [39]. They also reported an increase in the PV of extra virgin olive oil after 8 min of microwave heating and suggested that the increase in PV is caused by the formation of hydroperoxides and the appearance of secondary oxidation products, which reduce the PV value [40]. In long-term tests, authors exposed samples to room temperature, both in the absence and presence of light, observing a slight increase in this index in samples treated in different containers [41].
Furthermore, no trend associated with storage was observed in any of the analyzed oils. However, a clearly upward trend of the thermal treatment effect at both 40 °C and 60 °C on PV in O04 and O1 of A can be observed. This indicates that the thermal effect increased the PV of the samples, as observed by other authors [42]. Finally, both O04 and O1 complied with current legislation in A and B, keeping values below the established limits of ≤15 [24,30] after the treatments.
3.1.3. Extinction Coefficients K232 y K268
In the results shown in Table 5 for A, there was an increase in the mean K232 values for O04 and O1 at T3 treatment, with increases of 13.64% and 13.08%, respectively. This trend in the K232 coefficient showed the following disparate changes at 60 °C: an increase in O1 and a decrease in O04. This could be explained by the higher concentration of virgin olive oil in O1 compared to O04, causing the primary oxidation compounds to continue increasing in the former and transforming into secondary compounds in the latter [33]. Regarding K268, the values remained slightly higher than the control and stable with the treatments. These increases are due to the formation of oxidation products that explain the decrease in PV [43,44]. In B, O04 showed a slight increase compared to O1 in the most severe treatments for K232, while O04 obtained higher results in all treatments than O1 for K268. There was no constant trend of increasing or decreasing values after applying the treatments. However, at 60 °C in O04 and O1, there was an increase in the mean values between the control sample and the most extreme treatment for K268 of 16.28% and 51.22%, with values of 0.65–0.75 and 0.41–0.62, respectively. Additionally, there was an increase in the mean values for K232 in O04 at T12 treatment, with values higher than 20%, ranging from 2.91 to 3.18 compared to the control value (2.39). This explains the increase in the K232 coefficient after thermal application to the samples as determined by other authors [37,44].
In K268, both olive oils showed a notable increase after thermal treatment and one year of storage (Experiment B). This seems to indicate that prolonged storage produced the transformation of primary oxidation compounds, which were still present in the thermally treated and yet-to-be-stored oils, into secondary oxidation compounds related to this coefficient after the storage period [33]. This can be correlated with the decrease in the peroxide value (PV) in some cases. As observed by other authors, the increase in extreme conditions produced a decrease in primary oxidation compounds (PV) and an increase in secondary oxidation compounds (K268) [33]. This may be due to the intrinsic properties of each type of oil, which allow them to transfer greater or lesser stability to the treatments.
The K232 and K268 extinction coefficients are critical indicators of the oxidation levels in oils, with K232 reflecting the concentration of primary oxidation products and K268 indicating secondary oxidation products. These coefficients are directly related to the oil’s quality and stability, and their changes can provide insights into the effects of PET degradation and thermal treatments on the oil [37]. Regarding compliance with legislation, the K232 coefficient is not regulated for olive oils, while K268 has a limit value of ≤0.90 [24,30]. Therefore, the effect of the treatments on both oils did not exceed this limit.
3.1.4. Sensory Analysis
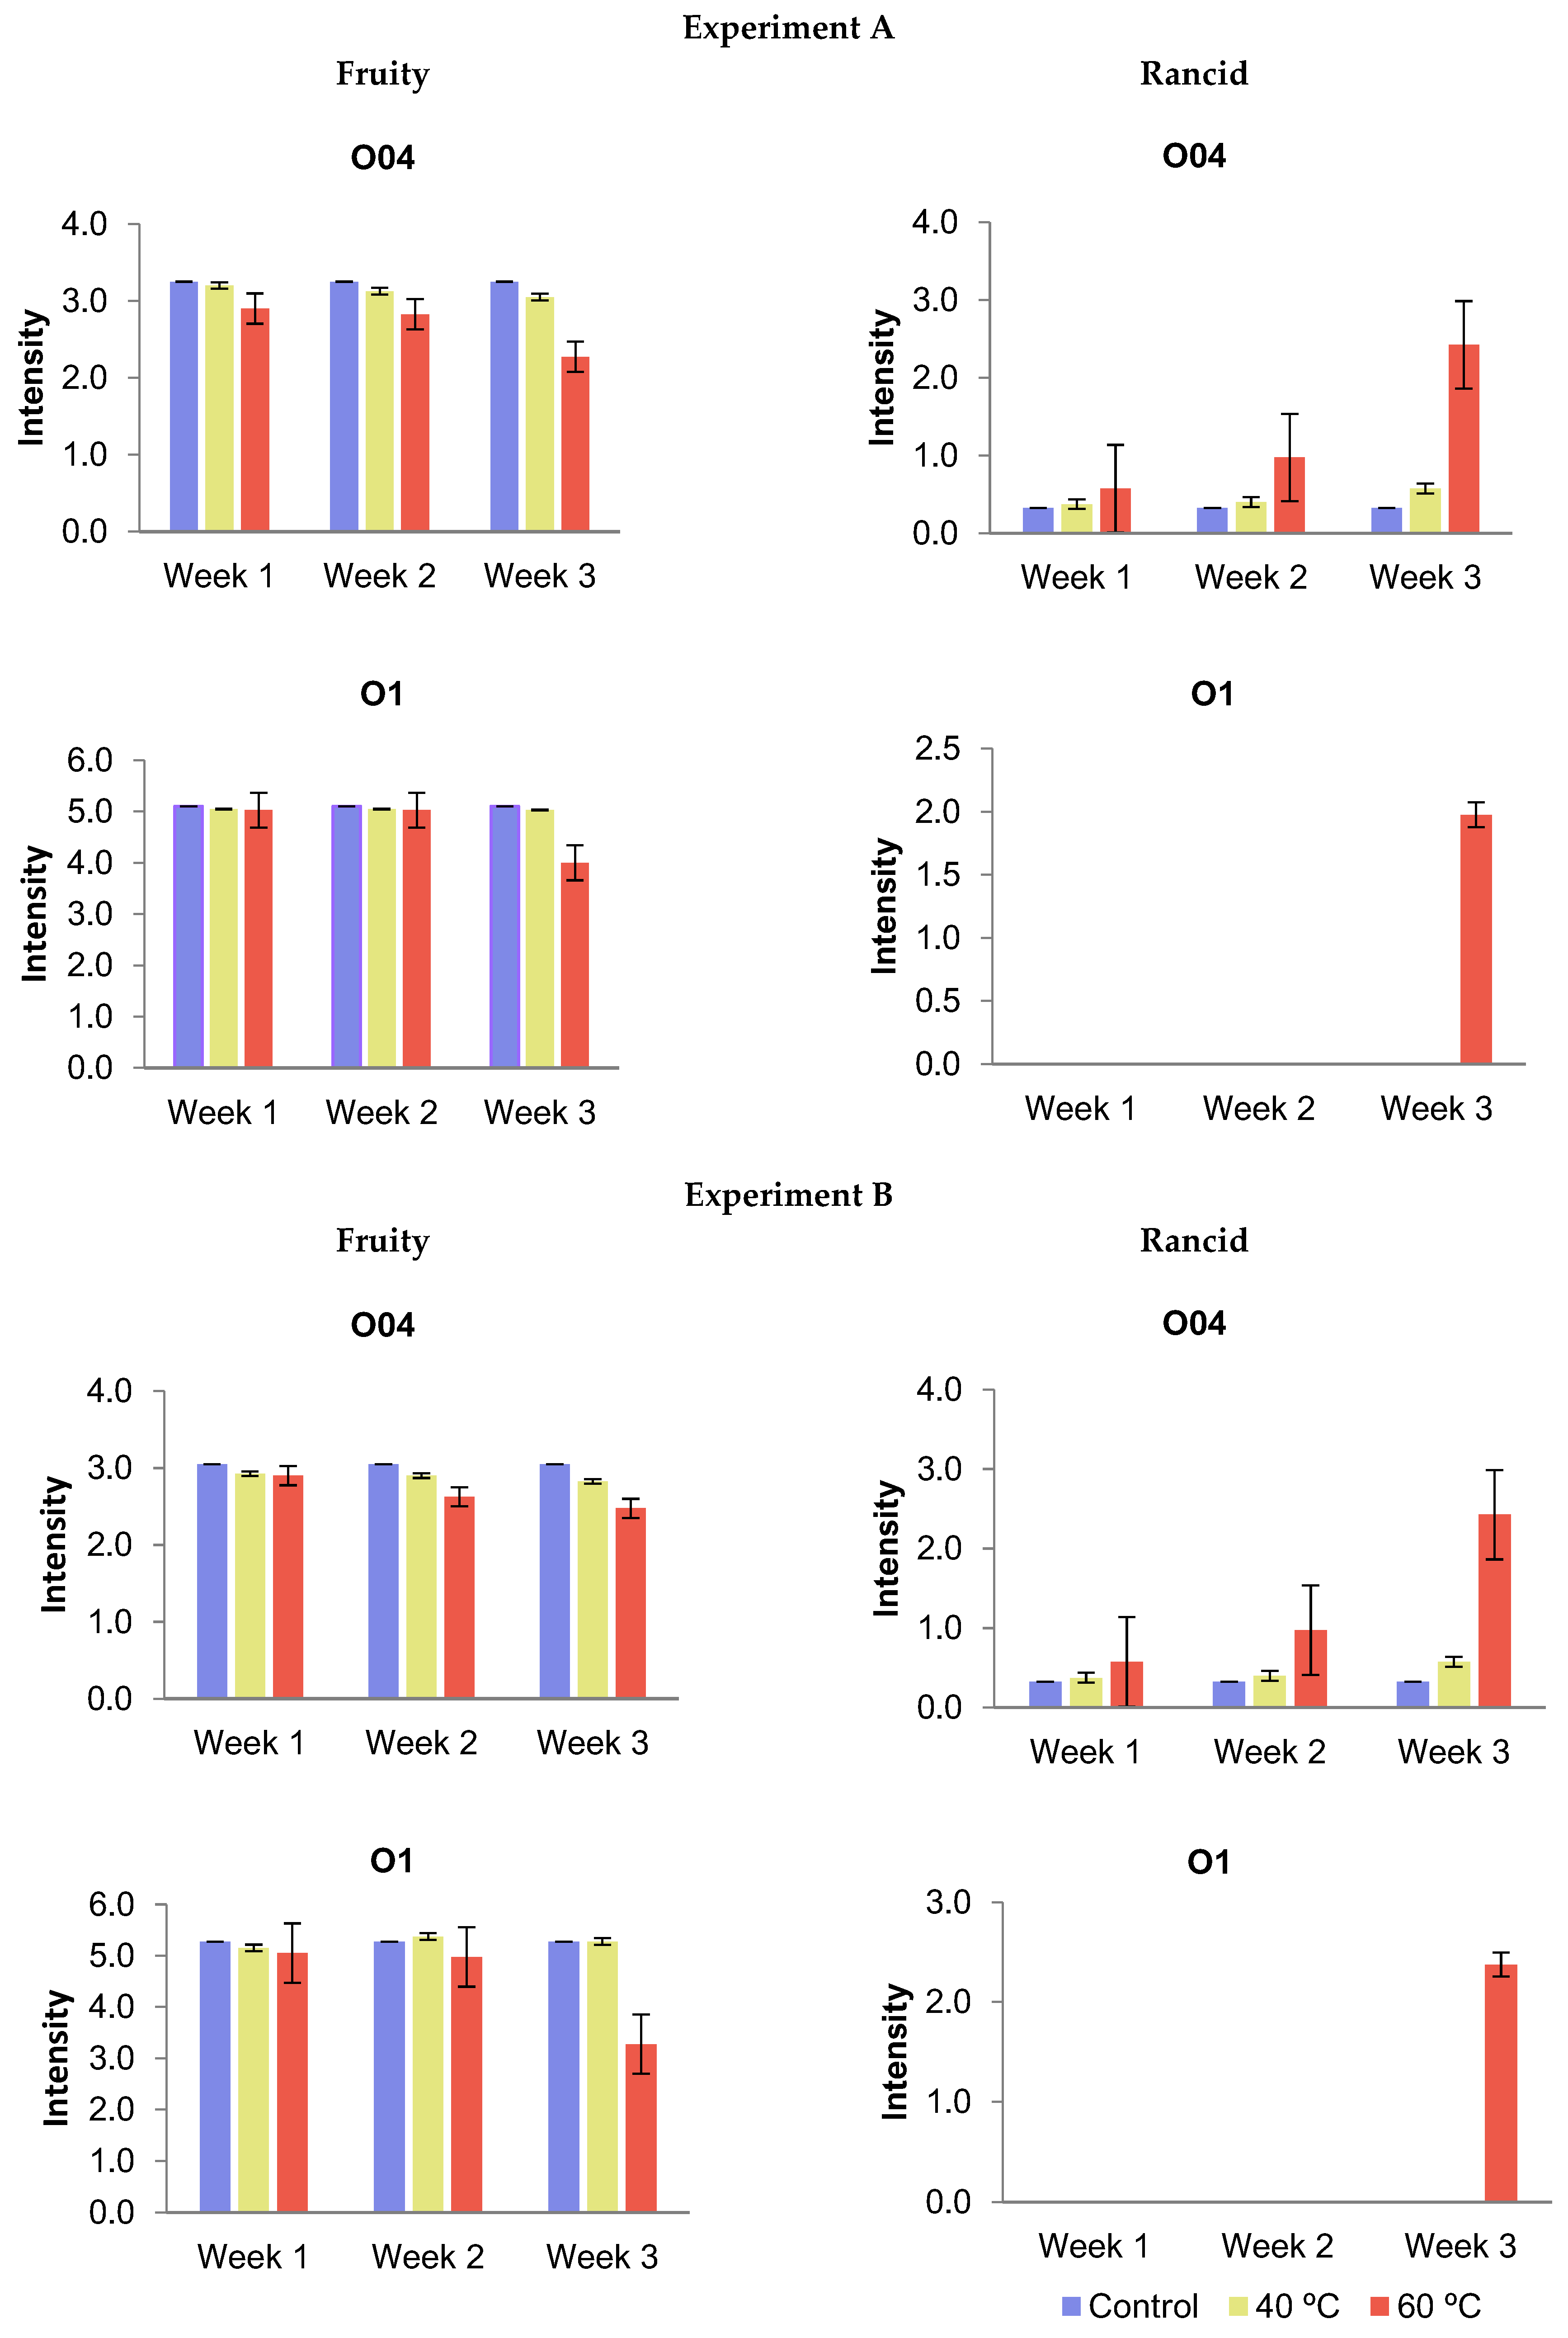
The sensory analysis of the samples was carried out following the methodology established in Regulation (EEC) N°. 2568/91 (currently in force is Regulation (EU) 2022/2104) [24,30]. As indicated in the corresponding chapter of the analytical method, none of the studied oils are regulated by this regulation for organoleptic evaluation. Additionally, the process was simplified by selecting only the intensity of “fruity”, the presence of “rancid”, and the possibility of other defects reminiscent of the PET container. Figure 1 shows the obtained results from the medians of each descriptor for each of the studied olive oils. In this case, the intensity of the measured descriptors (on a scale of 0 to 10) is displayed on the y-axis, while the weeks of exposure (1, 2, and 3) are represented on the x-axis. The bars indicate the temperatures to which the samples were subjected (control sample, 0 °C; 40 °C; and 60 °C).
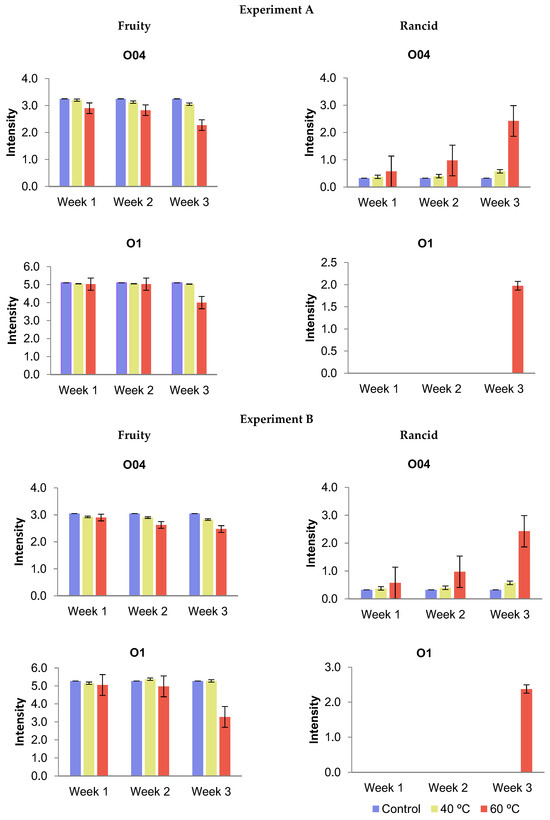
Figure 1.
Evolution of the intensity of “fruity” and “rancid” defect in the sensory analysis of mild olive oil (O04) and intense olive oil (O1) after exposure according to Experiments A and B.
In A, the intensity of “fruity” in O04 and O1 was not significantly affected by the treatments. However, O04 showed a downward trend at temperatures of 40 °C and 60 °C. The median values compared to the control sample were 3.3–3.1 for 40 °C and 3.3–2.3 for 60 °C. O1 and did not present an increasing or decreasing trend for 40 °C but did so for 60 °C, with median values compared to the control sample of 5.1–4.0 at the end of the 3-week treatment. The “rancid” defect appeared from the beginning of the treatments in O04, with an increasing trend after treatment at 60 °C. The range of median values between the control sample and the most severe treatment (60 °C/3 weeks) was 0.6–2.4. In O1, this defect only appeared with the most severe treatment (60 °C/3 weeks) at an intensity of 2.0.
In B, the intensity of “fruity” in O04 and O1 was not significantly affected by the treatments. However, O04 showed a downward trend at temperatures of 40 °C and 60 °C. The median values compared to the control sample were 3.1–2.8 for 40 °C and 3.1–2.5 for 60 °C. O1 did not present an increasing or decreasing trend for 40 °C but did so for 60 °C, with median values compared to the control sample of 5.3–3.3 at the end of the 3-week treatment. The “rancid” defect appeared from the beginning of the treatments in O04, with an increasing trend after treatment at 60 °C. The range of median values between the control sample and the most severe treatment (60 °C/3 weeks) was 0.5–3.2. In O1, this defect only appeared with the most severe treatment (60 °C/3 weeks) at an intensity of 2.4.
The general behavior of the “fruity” intensity concerning the appearance of defects like “rancid” in all analyzed samples shows the same pattern of loss of sensory quality in favor of the appearance of such defects as the temperature and exposure treatments increase. This fact coincides with other authors, who demonstrate the loss of this quality due to the presence of temperature at any stage of the olive oil production or preservation process [33,45].
The sensory analysis results indicate changes in the “fruity” attribute and the “rancid” defect in olive oils subjected to thermal treatments. While the focus on these specific descriptors may limit the scope of the analysis, their selection was deliberate, as they are antagonistic attributes, allowing for a more precise assessment of oil degradation. The analysis was conducted by a trained panel and followed standardized methods to minimize biases. These observed changes highlight the impact of thermal conditions and packaging materials on the sensory properties of the oil, providing a detailed insight into how these factors affect product quality.
3.1.5. Photosynthetic Pigments
Considering the results presented in Table 5, in A, the chlorophyll content of O1 exhibited a more pronounced decreasing trend. These findings align with those reported by other researchers who have studied extra virgin olive oils, in which a reduction in photosynthetic pigments is observed with increasing temperature [33,37]. In B, a more subdued decrease was noted in relation to the temperature applied to the samples. However, in certain treatments, these results do not agree with those reported by the previously cited authors, which may be due to the low concentration of both chlorophylls and carotenoids present in O04 and O1. The oil analyzed by other authors is extra virgin olive oil, and the chlorophyll content is much higher [33,37]. Nonetheless, the only notable finding would be the decrease in carotenoids in O1 as the exposures and temperature increase.
3.1.6. Influence of Type of Oil, Temperature, Time Exposure, and Storage
The influence of the type of oil, temperature, exposure time, and storage is presented in Table 6, in which a multifactorial statistical analysis (ANOVA) has been conducted. This analysis aims to study these variables and their relationship with the physicochemical parameters evaluated.
Table 6.
Analysis of variance (ANOVA) and Tukey’s HSD post hoc test.
The multifactorial analysis of variance (ANOVA) revealed that the type of oil is the most influential factor in the variability of the quality parameters, showing significance in almost all parameters studied. Temperature and exposure time significantly impact only the K268 parameter, while storage notably affects acidity, peroxide value (PV), chlorophylls, and carotenoids. Interactions between the type of oil and other factors, such as temperature, exposure time, and storage, were also significant, indicating that these factors do not operate independently. Post hoc Tukey’s tests identified specific significant differences between comparisons of oil type, temperature, exposure time, and storage, highlighting the need to consider these variables collectively. In summary, oil type and storage are the most critical factors affecting the quality parameters of the oil, while interactions between multiple factors also play an important role.
3.2. Analysis of PET Degradation
3.2.1. Fourier Transform Infrared Spectroscopy Results
In this analysis, PET samples from the olive oils subjected to different temperature treatments and storage times were used. The interpretation of the spectra results was carried out using the OPUS 8.7.31 software, and the absorption peaks of the characteristic FT-IR spectra of PET were described according to the various authors listed in Table 7. This identification and description were common for all the olive oils analyzed in Experiments A and B.
Table 7.
Characteristic PET wavenumbers found in the literature.
In addition to the individual identification of the peaks described above, a set of absorption bands was observed that as a consequence of the thermal treatments applied to the samples, caused changes in the PET structure (Table 8).
Table 8.
Spectral bands of PET identified as susceptible to changes after the applied treatments.
The PET samples were subjected to thermal treatments at 40 °C and 60 °C. During the thermal induction period, material degradation may have occurred, as one of the main causes is the presence of heat [61]. Generally, the synthesis of PET takes place at high temperatures, under vacuum conditions, and in the presence of effective catalytic conditions. As the temperature of PET increases, it degrades more easily [62].
Initially, the degradation process due to thermal action occurs in the cleavage of the ester bond chain, forming terminal carboxyl groups and a vinyl ester. The transesterification of the latter results in vinyl alcohol, which quickly converts into acetaldehyde. This process causes the polyester chain to regenerate, maintaining an average polymerization. As a result of this reaction, the terminal hydroxyl groups are replaced by terminal carboxyl groups, producing the same amount of acetaldehyde. Additionally, due to the generation of macroradical areas by hydrogen atom abstraction, thermally and photochemically unstable peroxide and hydroperoxide radicals may appear, leading to further degradation [63].
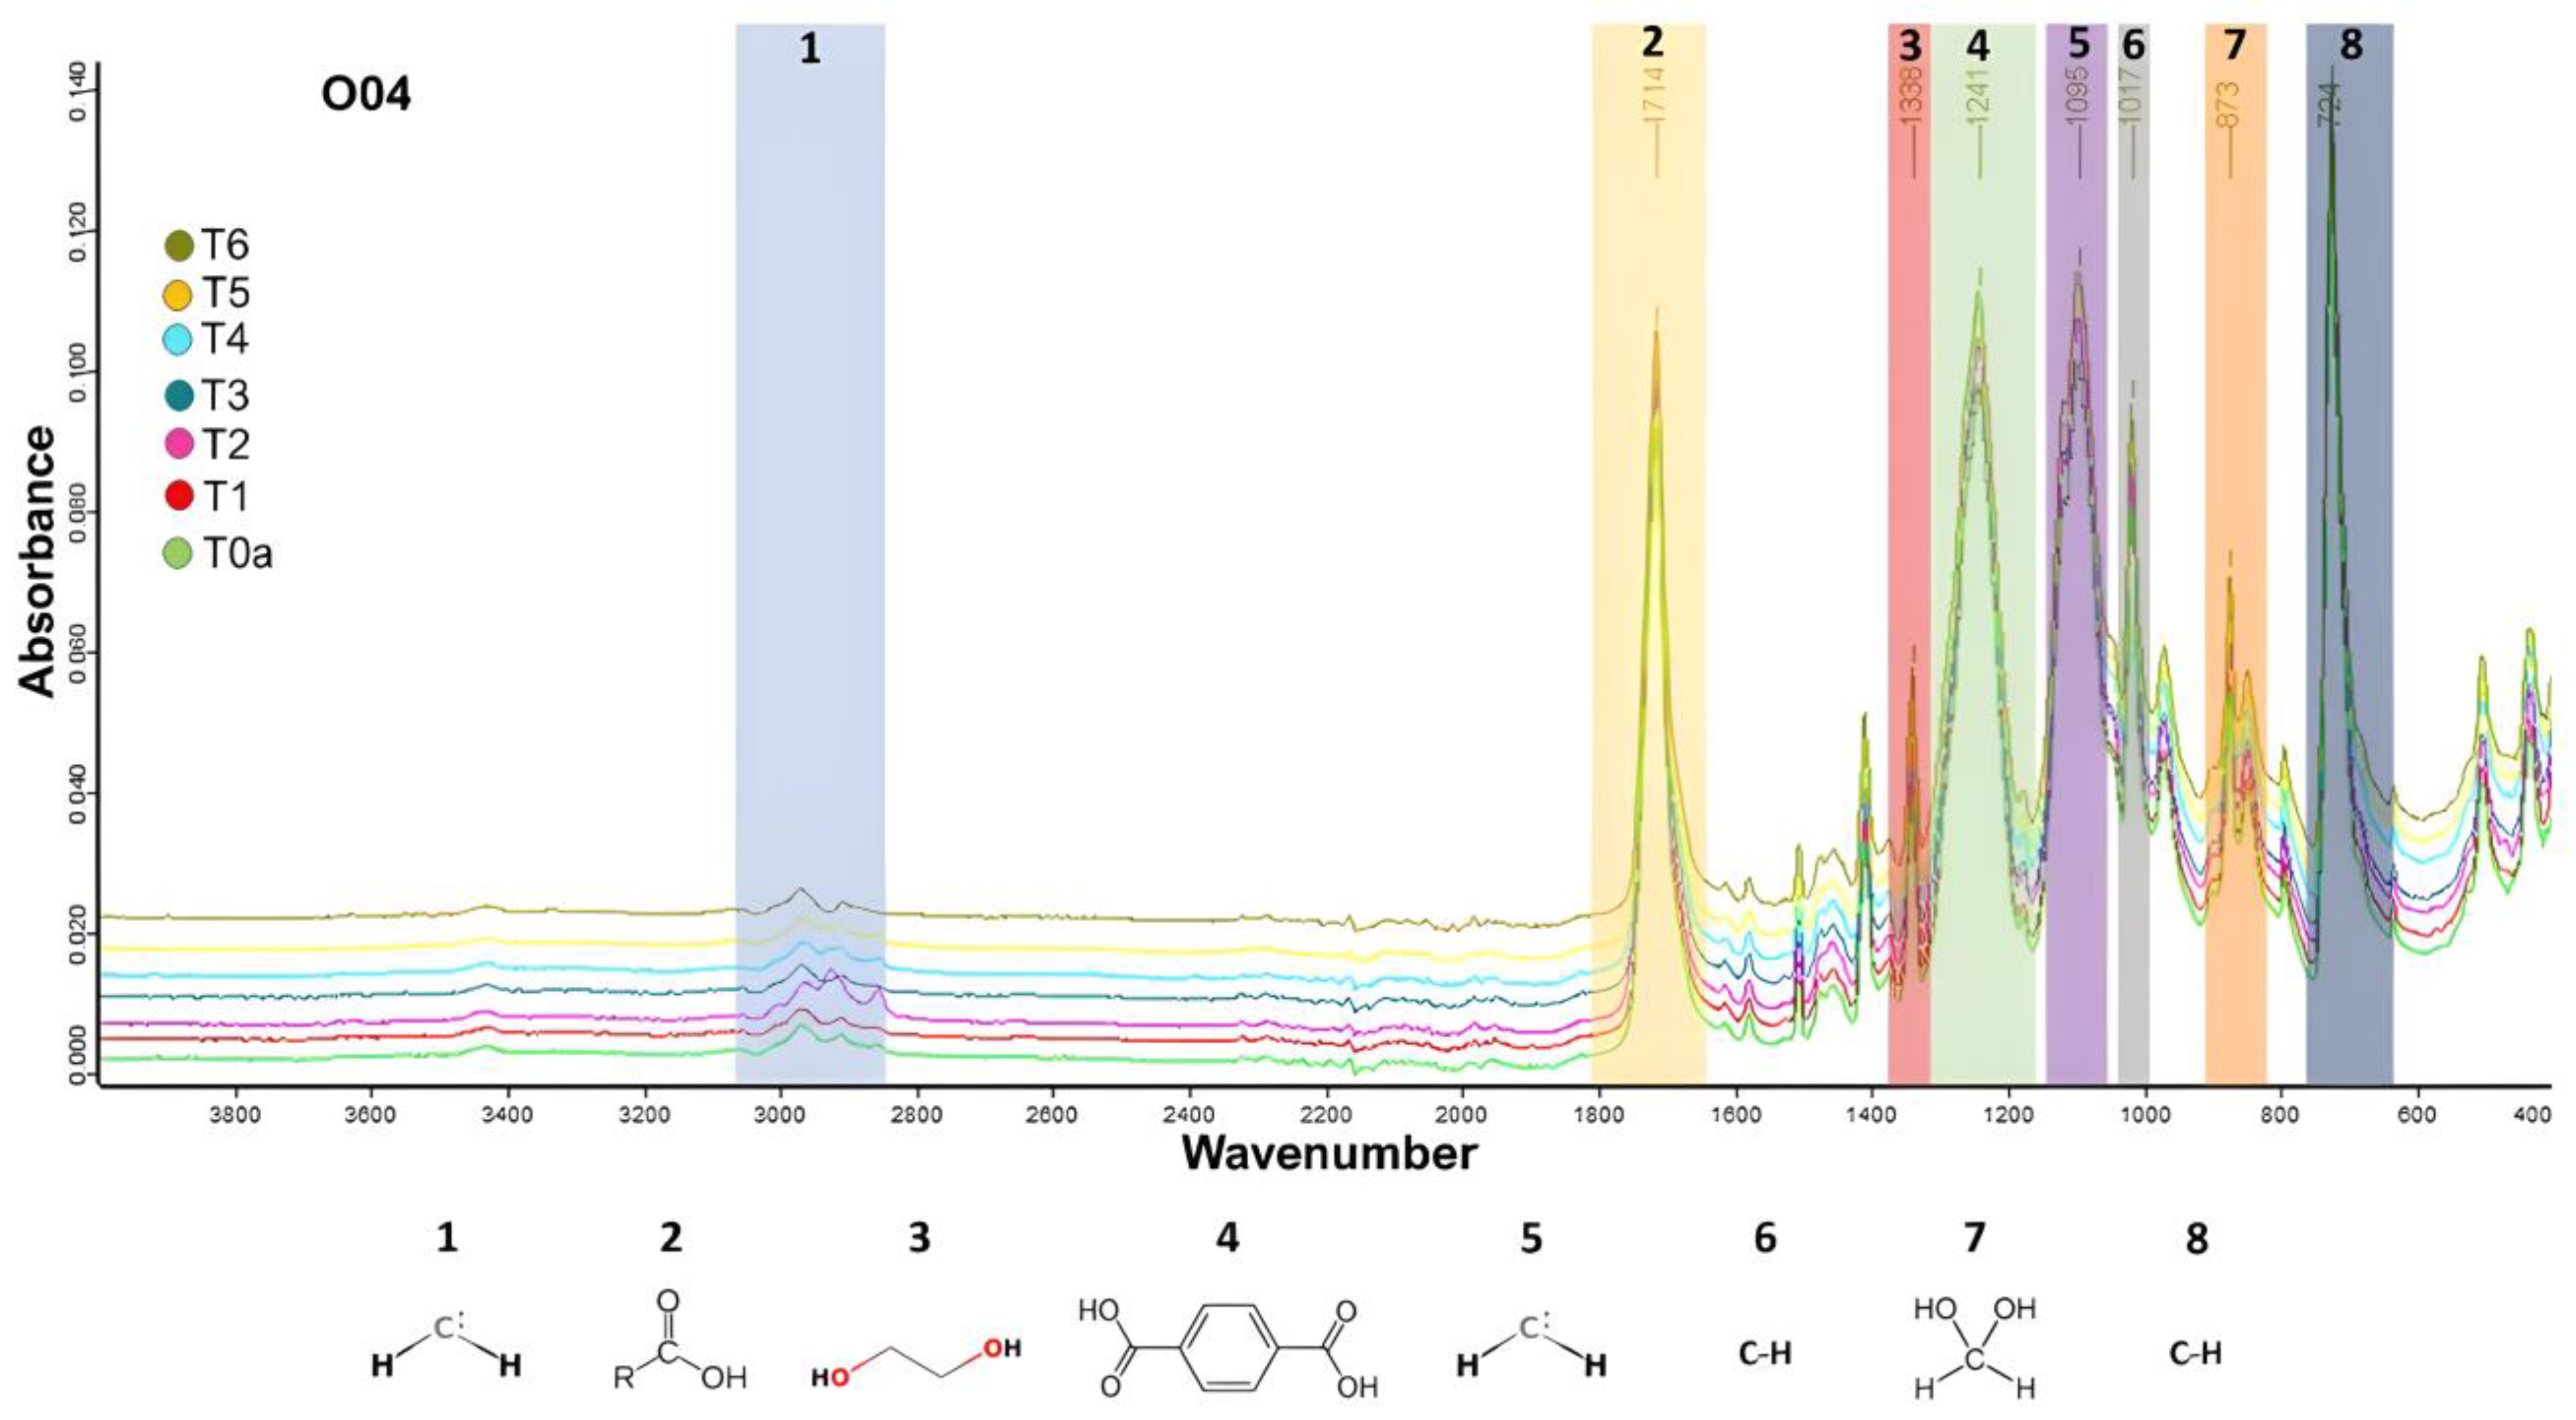
The absorption bands and the most notable peaks in the spectral range of 400–4000 cm−1 described in Table 7 and Table 8 are consistent across all PET containers analyzed for O04 and O1, confirming that the containers are made of this material. The structure is represented only once for the olive oils in Figure 2, which corresponds to the superposition of spectra resulting from the treatments applied to O04 in Experiment A.
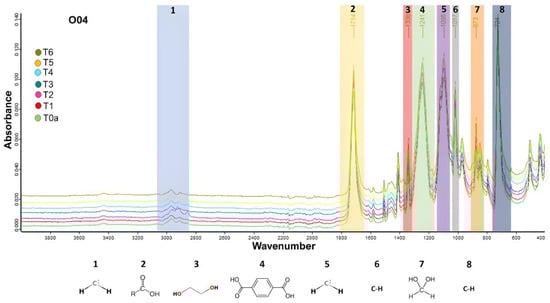
Figure 2.
Overlay of spectra for mild olive oil samples of Experiment A. Key wavenumbers included.
As observed by other authors, the degradation of PET occurs with the increase in temperature, resulting in a decrease in genuine functional groups [55] in favor of the appearance of new functional groups such as ketones, aldehydes, and alkenes, among others [58]. This degradation can be quantified through the carbonyl index, which is a widely used parameter to monitor degradation phenomena. In the case of PET, it allows for calculating the presence of carbonyl groups contained in the degradation products of acetaldehyde and carboxyl generated by this polymer. The carbonyl index is expressed using the following equation [64]:
In this determination, the absorption band 1750–1700 cm−1 is considered since, according to various authors, it is the region in which degradation products such as carbonyl are shown [46,47,48,49]. The most widely used peak is 1715 cm−1, while 974 cm−1 is the peak that does not undergo alterations in the degradation processes [65]. Table 9 shows the obtained results for the carbonyl index for O04 and O1 after exposure according to Experiments A and B.
Table 9.
Carbonyl index of PET containers of mild olive oil (O04) and intense olive oil (O1).
In A for the PET O04 samples, there were no significant differences after applying the treatments, with the most extreme mean values found between the control sample and the most severe treatment (Table 9). An analysis of the results showed that there was no clear trend in the increase in the carbonyl index compared to the control sample; however, in the most severe treatment, this index increased by 5.87%. Slight changes were observed in the evolution of the carbonyl index after the application of the treatments. In this case, the influence of temperature on the increase in the carbonyl index occurred starting from T1. Here, the carbonyl index began to rise at the beginning of the less severe treatments, then stabilized and finally increased.
For the PET O1 samples, there were significant differences after applying the treatments, with the most extreme mean values found between the control sample and the most severe treatment (T6; Table 9). The analysis of the results showed a slightly increasing trend in the carbonyl index compared to the control sample in all phases of the applied treatments, with the most severe treatment (T6) showing the highest percentage increase at 2.55%. An evolution in the increase in the carbonyl index was observed from the beginning to the end of the treatments. Likewise, the influence of temperature on the increase in the carbonyl index occurred starting from the first phase of the T1 treatment, in which the carbonyl index began to rise slowly.
Generally, PET containers of both oils showed an increase in the carbonyl index compared to the control sample in some phases of the applied treatments. PET O04 also showed stages of stabilization or a slight decrease in the carbonyl index, coinciding with the T3 and T5 treatments; however, this “valley” was always above the result obtained for the control sample. In this regard, the observations described agree with those described by other authors, which would demonstrate that the degradation is in an initiation stage [55,66,67,68]. Furthermore, it can be observed that PET O04 has the highest carbonyl index during all stages of the process compared to PET O1, including the control sample, except for the T4 treatment, in which a decrease occurs. This fact could indicate better quality in the material, as it is more resistant to the onset of degradation.
In B for the PET O04 samples, there were no significant differences after applying the treatments, with the most extreme mean values between the control sample and the most severe treatment (T12; Table 9). An analysis of the results of this study showed a growing trend in the carbonyl index compared to the control sample in all phases of the applied treatments, with the most severe treatment (T12) having the highest percentage increase at 8.33%. Notable changes were observed in the evolution of the carbonyl index after applying the treatments. The influence of temperature on the increase in the carbonyl index occurred from the first phase of the treatments (T7), in which the carbonyl index began to grow more evidently.
Generally, an increase in the carbonyl index compared to the control sample was observed in all phases of the applied treatments for PET O04 and PET O1. On this occasion, the carbonyl index was higher in the initial phases of the treatments in PET O1, while PET O04 increased the carbonyl index in the later phases. This fact indicates that the plastic used in the O1 samples is more resistant to high temperatures, making it a higher-quality material.
Finally, comparing the obtained results in A and B, the storage period was key to increasing this index, being higher in both PET O04 and PET O1 in B.
3.2.2. Differential Scanning Calorimetry Analysis
The PET samples from O04 and O1 subjected to temperature treatments and storage time were used. The interpretation of the results was carried out using DSC STARe software, Version 16.30 (Build 13243). The analysis focused exclusively on the plastics of the containers subjected to A treatments for a period of 3 weeks. This is because, through DSC analysis, the thermal parameters of plastic can be identified, which are mainly altered by processes involving temperature changes. Therefore, the variations that may arise in the plastics as a result of B would be analogous to those observed in this section.
Table 10 presents the obtained results after conducting this analysis on the commercial PET of O04 and O1. The data revealed notable changes that were observed among the different samples. Specifically, an increase in the glass transition temperature (Tg) was recorded in both PETs as the treatments became more severe at 40 °C and 60 °C. This increase was notable in both cases, with increments of 5.04% and 18.88% for O04, and 3.54% and 14.86% for O1, respectively. Regarding melting temperatures (Tm) and crystallization temperatures (Tc), no differences, as marked in the case of Tg, were observed. Lastly, concerning the percentage of crystallinity (Wc), variations compared to the T0a were recorded in all cases, although they were not significant. Specifically, in the case of PET O04, Wc increased at T3 and T6 treatments, while in the case of PET O1, it increased after the T3 treatment and then decreased below T0a after T6 (Table 10).
Table 10.
Thermal properties of PET in mild (O04) and intense olive oils (O1).
The results of the Student’s t-test reveal significant variations between groups for specific parameters, particularly ΔHm and ΔHc, indicating substantial differences in these aspects. Parameters Tg and Tm also show significant differences in certain comparisons, while Tc exhibits fewer significant differences. These variations may reflect substantial differences attributable to the applied treatments.
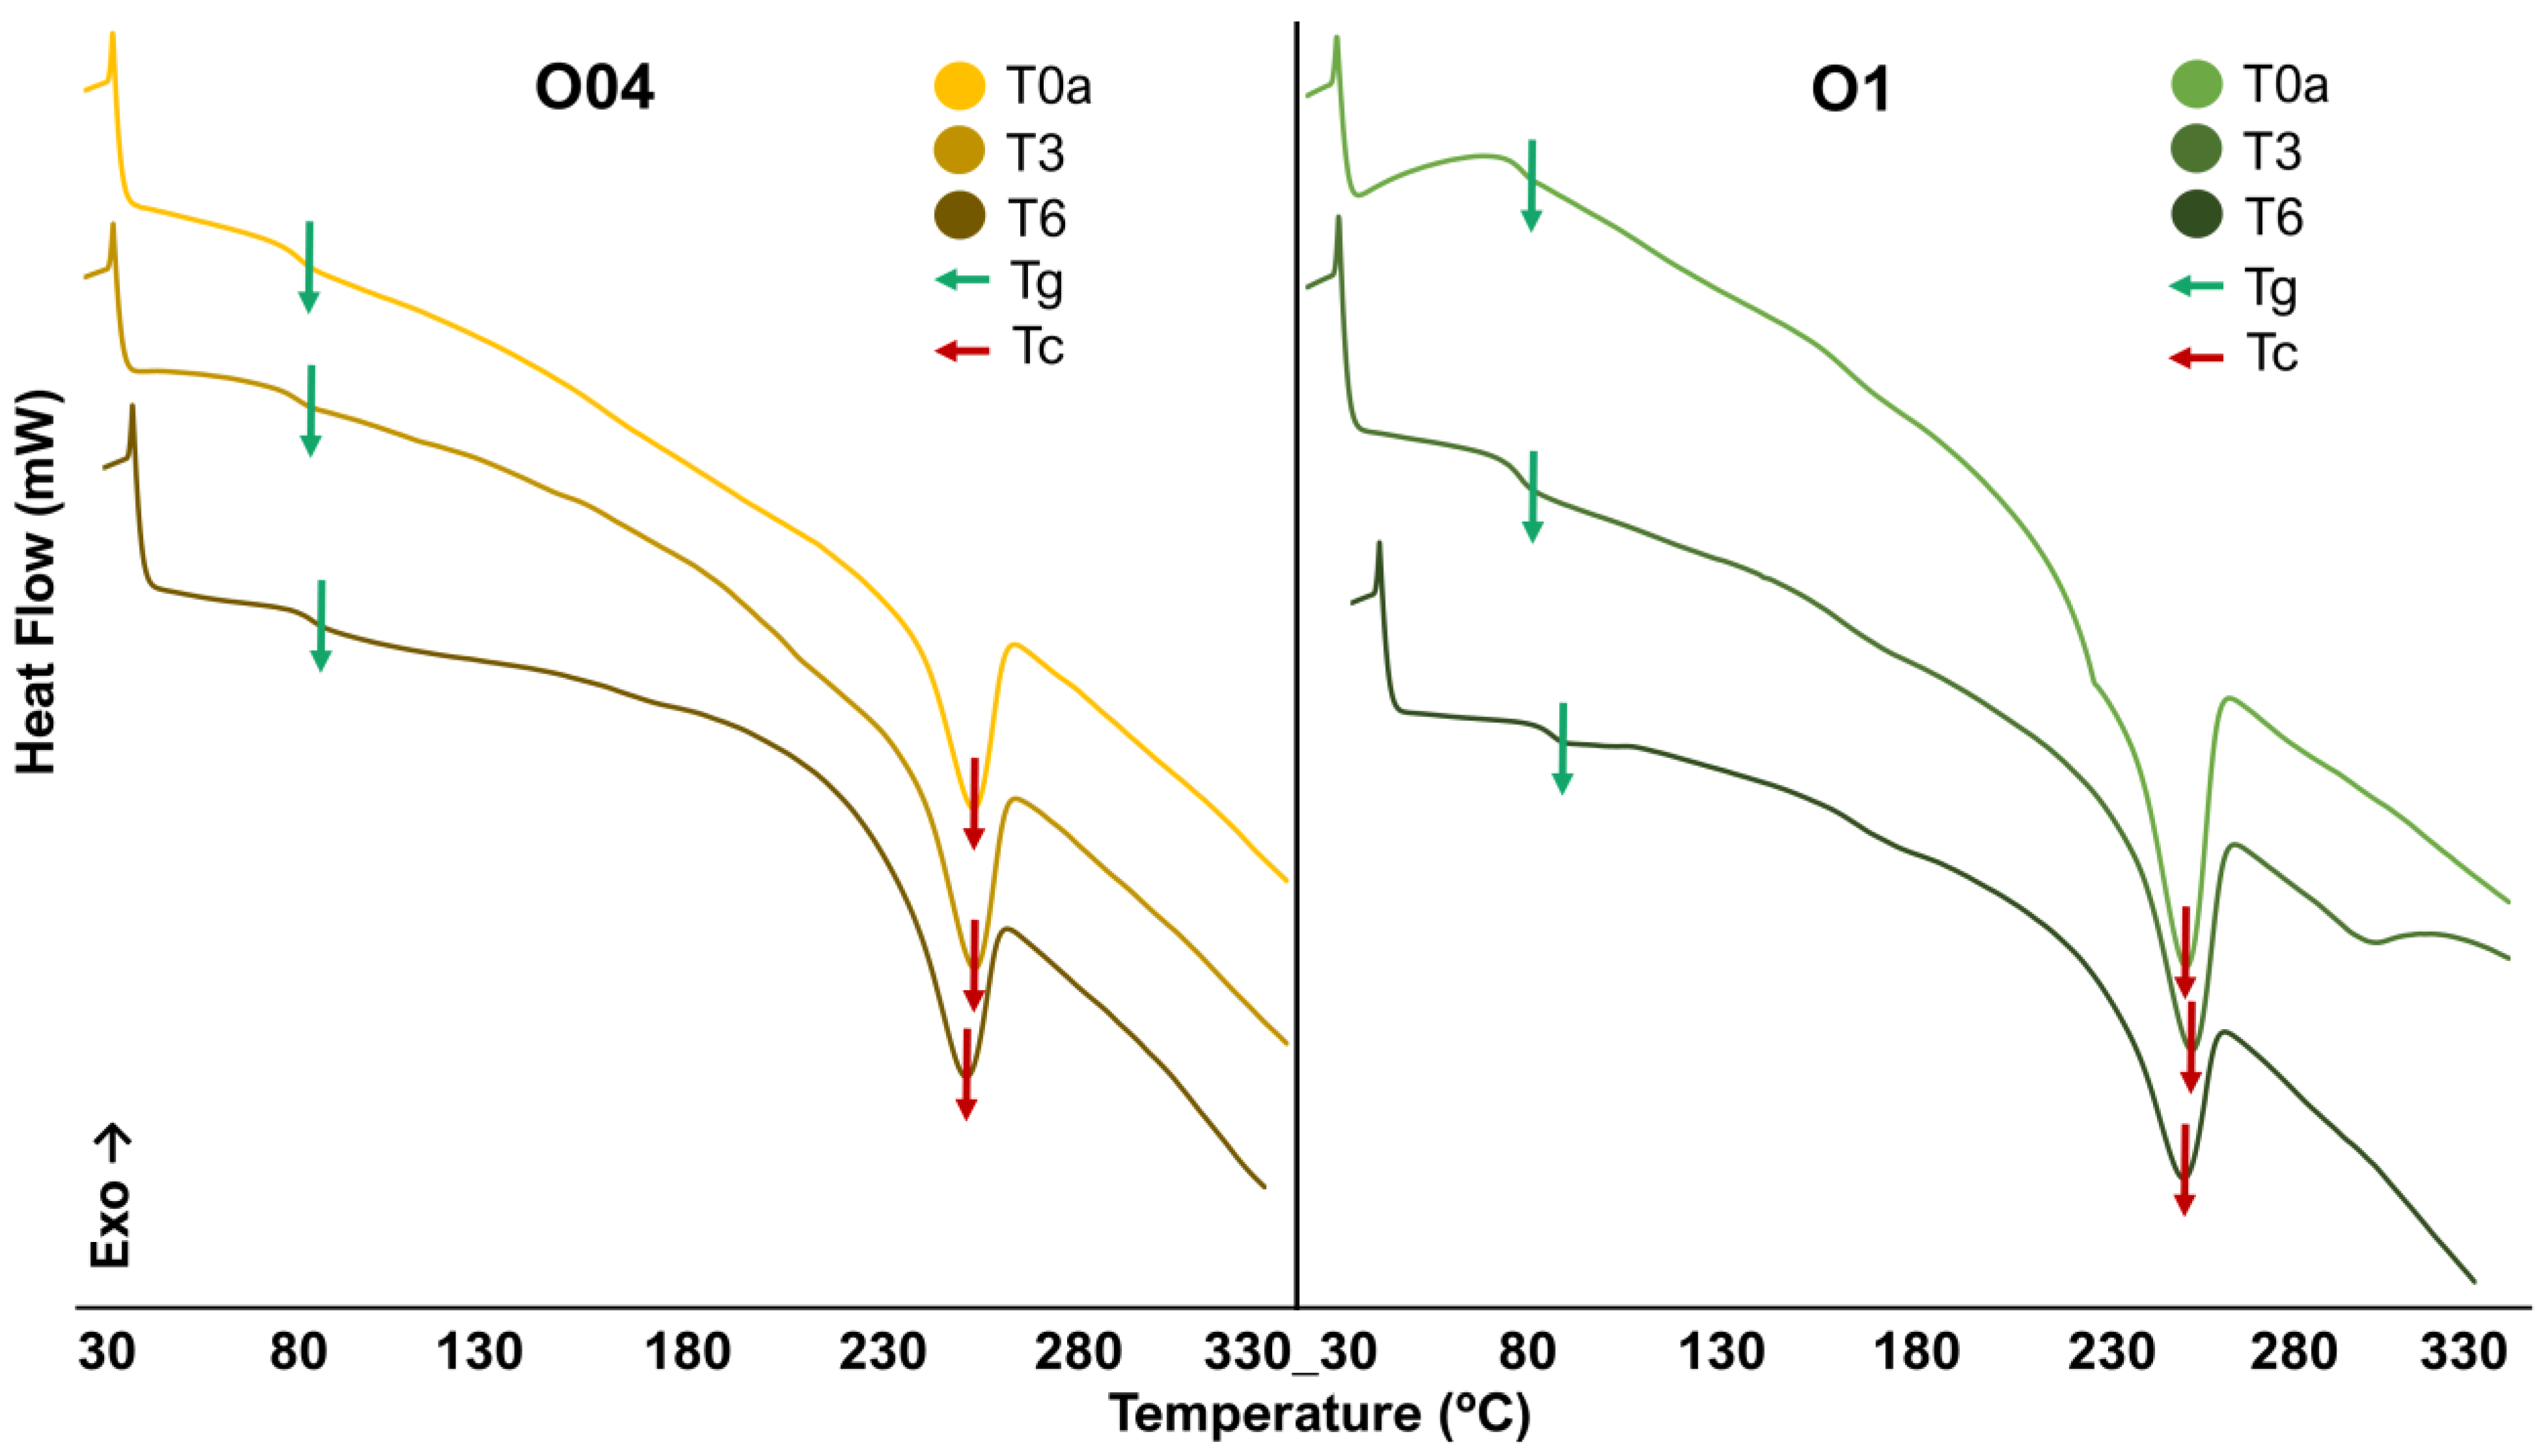
Figure 3 presents the curves obtained during the second heating for PET O04 and PET O1. The first heating was discarded because it tends to reflect the thermal history of the material, which could introduce biases in the results. It is during the second heating that the influence of the thermomechanical history of PET is eliminated, revealing the true thermal behavior of the analyzed samples [69,70]. A shift in Tg toward an increase in temperature occurred in both treatments compared to the T0a, being more evident in the T6 treatment for both oils. These increases align with those obtained by other authors who studied similar thermal treatments, obtaining values close to 80 °C [70,71].

Figure 3.
DSC curves in PET from mild (O04) and intense (O1) olive oil, where Tg is the glass transition temperature, and Tc is the crystallization temperature.
3.3. Heavy Metal Analysis
In a previous study, heavy metals and the most studied edible vegetable oils internationally were identified [28]. Based on this foundation, the most studied metals were selected, which in this case, were cadmium (Cd), lead (Pb), iron (Fe), and copper (Cu). Table 11 presents the obtained results in Experiments A and B for the two types of olive oil (OO) analyzed, O04 and O1.
Table 11.
Concentration of heavy metals in mild (O04) and intense (O1) olive oils after exposure according to Experiments A and B.
In A, it was observed that cadmium (Cd) concentrations were below permissible levels in both T0a and T6. Copper (Cu) levels recorded in both oils, O1 and O04, were below the maximum recommended by Codex Alimentarius, which was set at 0.1 mg/kg. Both oils were under this threshold in both control sample (T0a) and treated sample (T6). Cu emerged as a predominant heavy metal, showing elevated levels among the analyzed metals, following antimony (Sb) and iron (Fe). Some studies suggest that recycled plastics, incorporated in small percentages into packaging, may contain trace amounts of Cu due to the use of copper catalysts in PET recycling processes [72]. Therefore, the presence of Cu could account for the elevated carbonyl index values in the O04 and O1 packaging, as this metal acts as a catalyst, accelerating PET degradation during treatments. Lead (Pb) levels were similar across both control sample (T0a) and treated sample (T6) for both oils. Fe was higher after treatments in oil O1 and remained constant in O04. Finally, Sb showed higher values only in O1 after treatments. The results obtained were below the limits specified by regulations for all heavy metals and oils studied. Previous studies have shown that thermal treatments on olive oils of various varieties increase antimony content as temperature and exposure time rise [25]. Although the trend was similar across the three varieties, Arbequina exhibited the highest Sb concentrations, exceeding the WHO limit of 20 ppb after three weeks at 60 °C. Temperature appears to be the most influential factor in migration, especially in the initial stages. Specifically, Picual oils showed the highest increases in Sb, followed by Arbequina and, finally, Hojiblanca. However, the study concluded that the specific characteristics of each oil variety (such as composition, physical properties, and surface tension) likely contributed to these results. The levels of all heavy metals were below the specific limits indicated in the regulations.
In B, Cd showed a higher concentration in the most severe treatment (T12) than in the control sample (T0b), both in O04 and O1. For Pb, Cu, and Fe, the results were lower in the most severe treatment (T12) compared to the control sample (T0b) in both oils, except for O04 and O1 in Sb, in which T12 was higher than T0b. It is important to note that the Sb levels obtained in the oils in this study are much lower than those in previous studies, which could be due to a substantial modification in the type of plastic being used or the type of catalyst, which is very satisfactory from a food safety perspective. The obtained results showed lower levels for all heavy metals and oils studied in relation to the regulations indicated above.
These findings coincide with the obtained results by the authors mentioned in the initial referenced study [28]. The obtained results for Cd are lower than those determined in olive oils from Iran and Cyprus, with values between 0.094 and 0.097 mg/kg [73] and 0.09 mg/kg [74], respectively. In the case of Cu, other works determine values close to 0.10 mg/kg and others that exceed it significantly for olive oils. For proximity, there is olive oil from Iran, with values between 0.091 and 0.098 mg/kg [73], while among the results that exceed this limit are the oils from Ukraine and Cyprus, with values of 0.355 mg/kg and between 1.02 and 3.81 mg/kg, respectively [74,75]. In the case of Fe, high values have been obtained in oils from Saudi Arabia in the range of 0.025–7.861 mg/kg [76]. Other studies related to Pb in olive oils give values in the range of 0.15–1.48 mg/kg in oils from Cyprus [74] or 1.321–7.249 mg/kg in oils from Pakistan [77].
After conducting the Student’s t-test, significant differences were found between various treatments and specific metals. However, it is important to note that, in the case of Cd, the results were below the instrument’s limit of detection (LOD) and limit of quantification (LOQ). Therefore, these findings should be interpreted with caution, considering the potential limitations in the sensitivity of the analysis.
3.4. Influence of Commercial PET Packaging on Olive Oil Properties
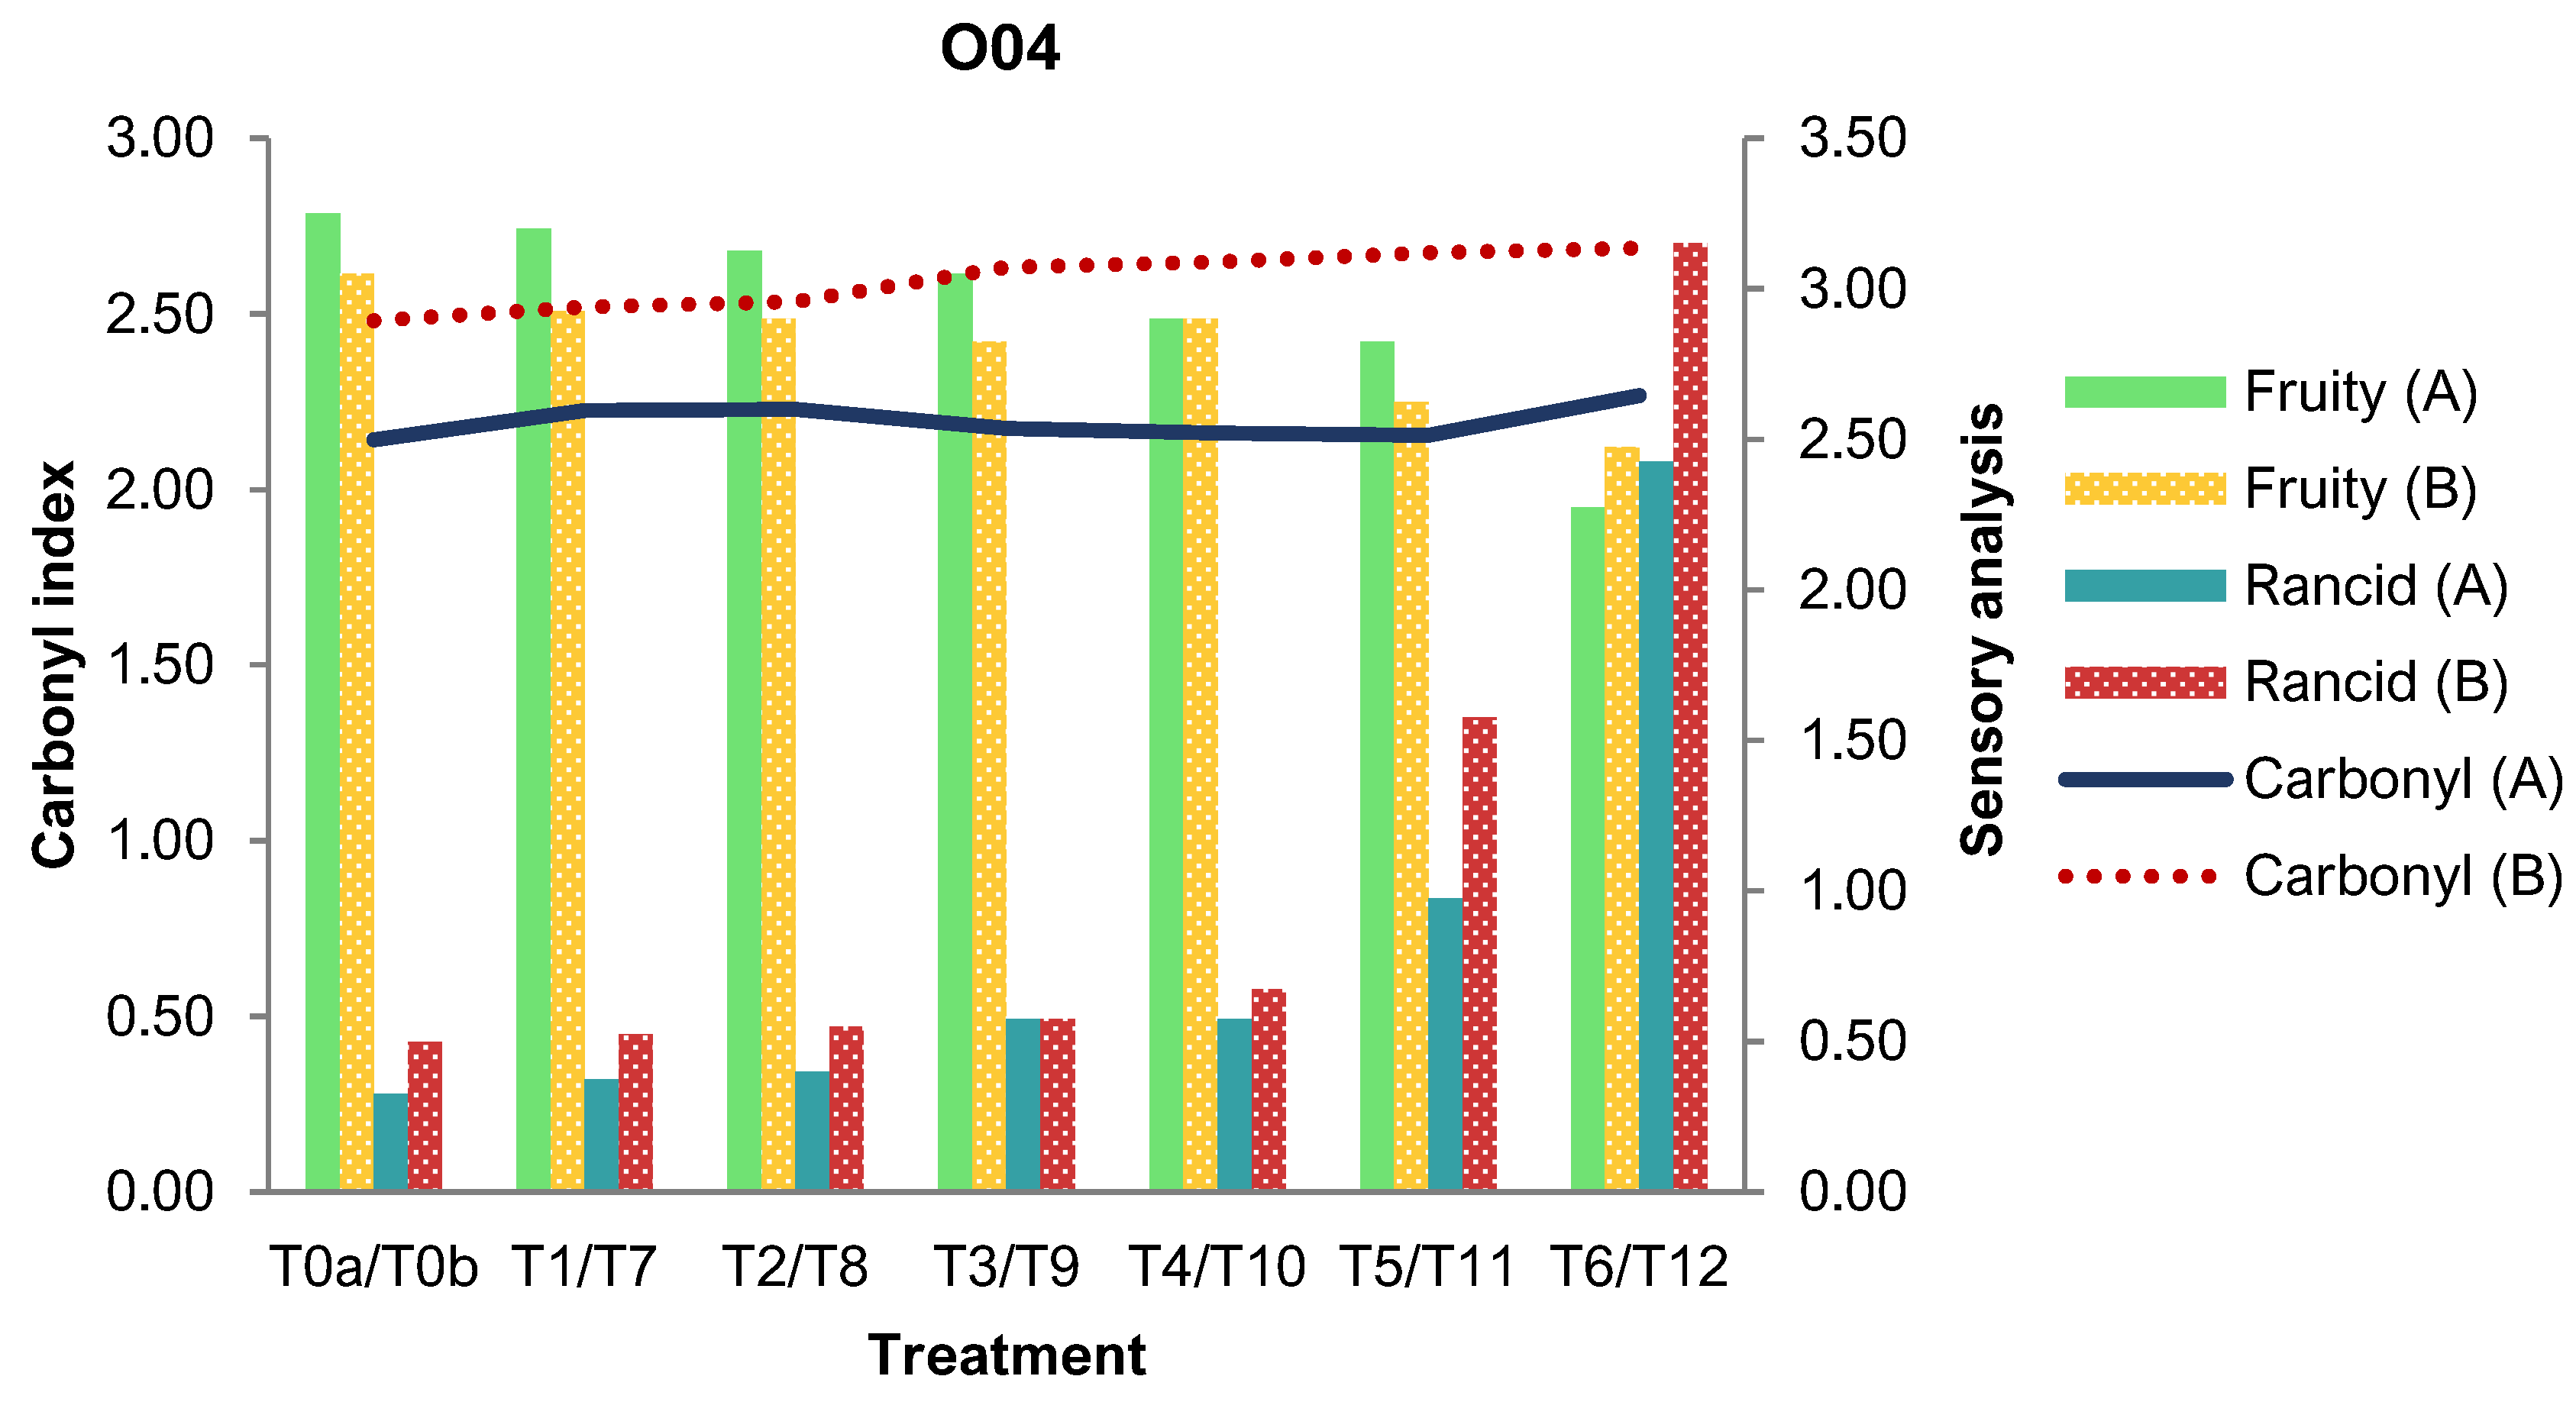
In the previous sections, it has been established that different treatments influenced the physicochemical and organoleptic properties of the analyzed oils. Additionally, analyses using FT-IR and DSC revealed that the PET containers used to hold the oils experienced deterioration due to thermal exposure and storage periods. The following presents some evidence of the influence of PET and its degradation on the modification of oil properties. The obtained results after exposure, according to Experiments A and B for O04 and O1 of the carbonyl index as indicators of plastic degradation and the sensory analysis as indicators of oil alteration, are shown in Figure 4 and Figure 5.
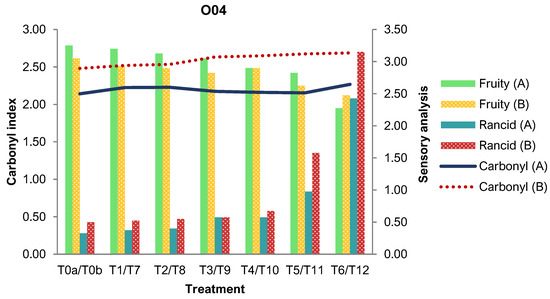
Figure 4.
Overlay of carbonyl index and sensory descriptors of mild olive oil (O04).

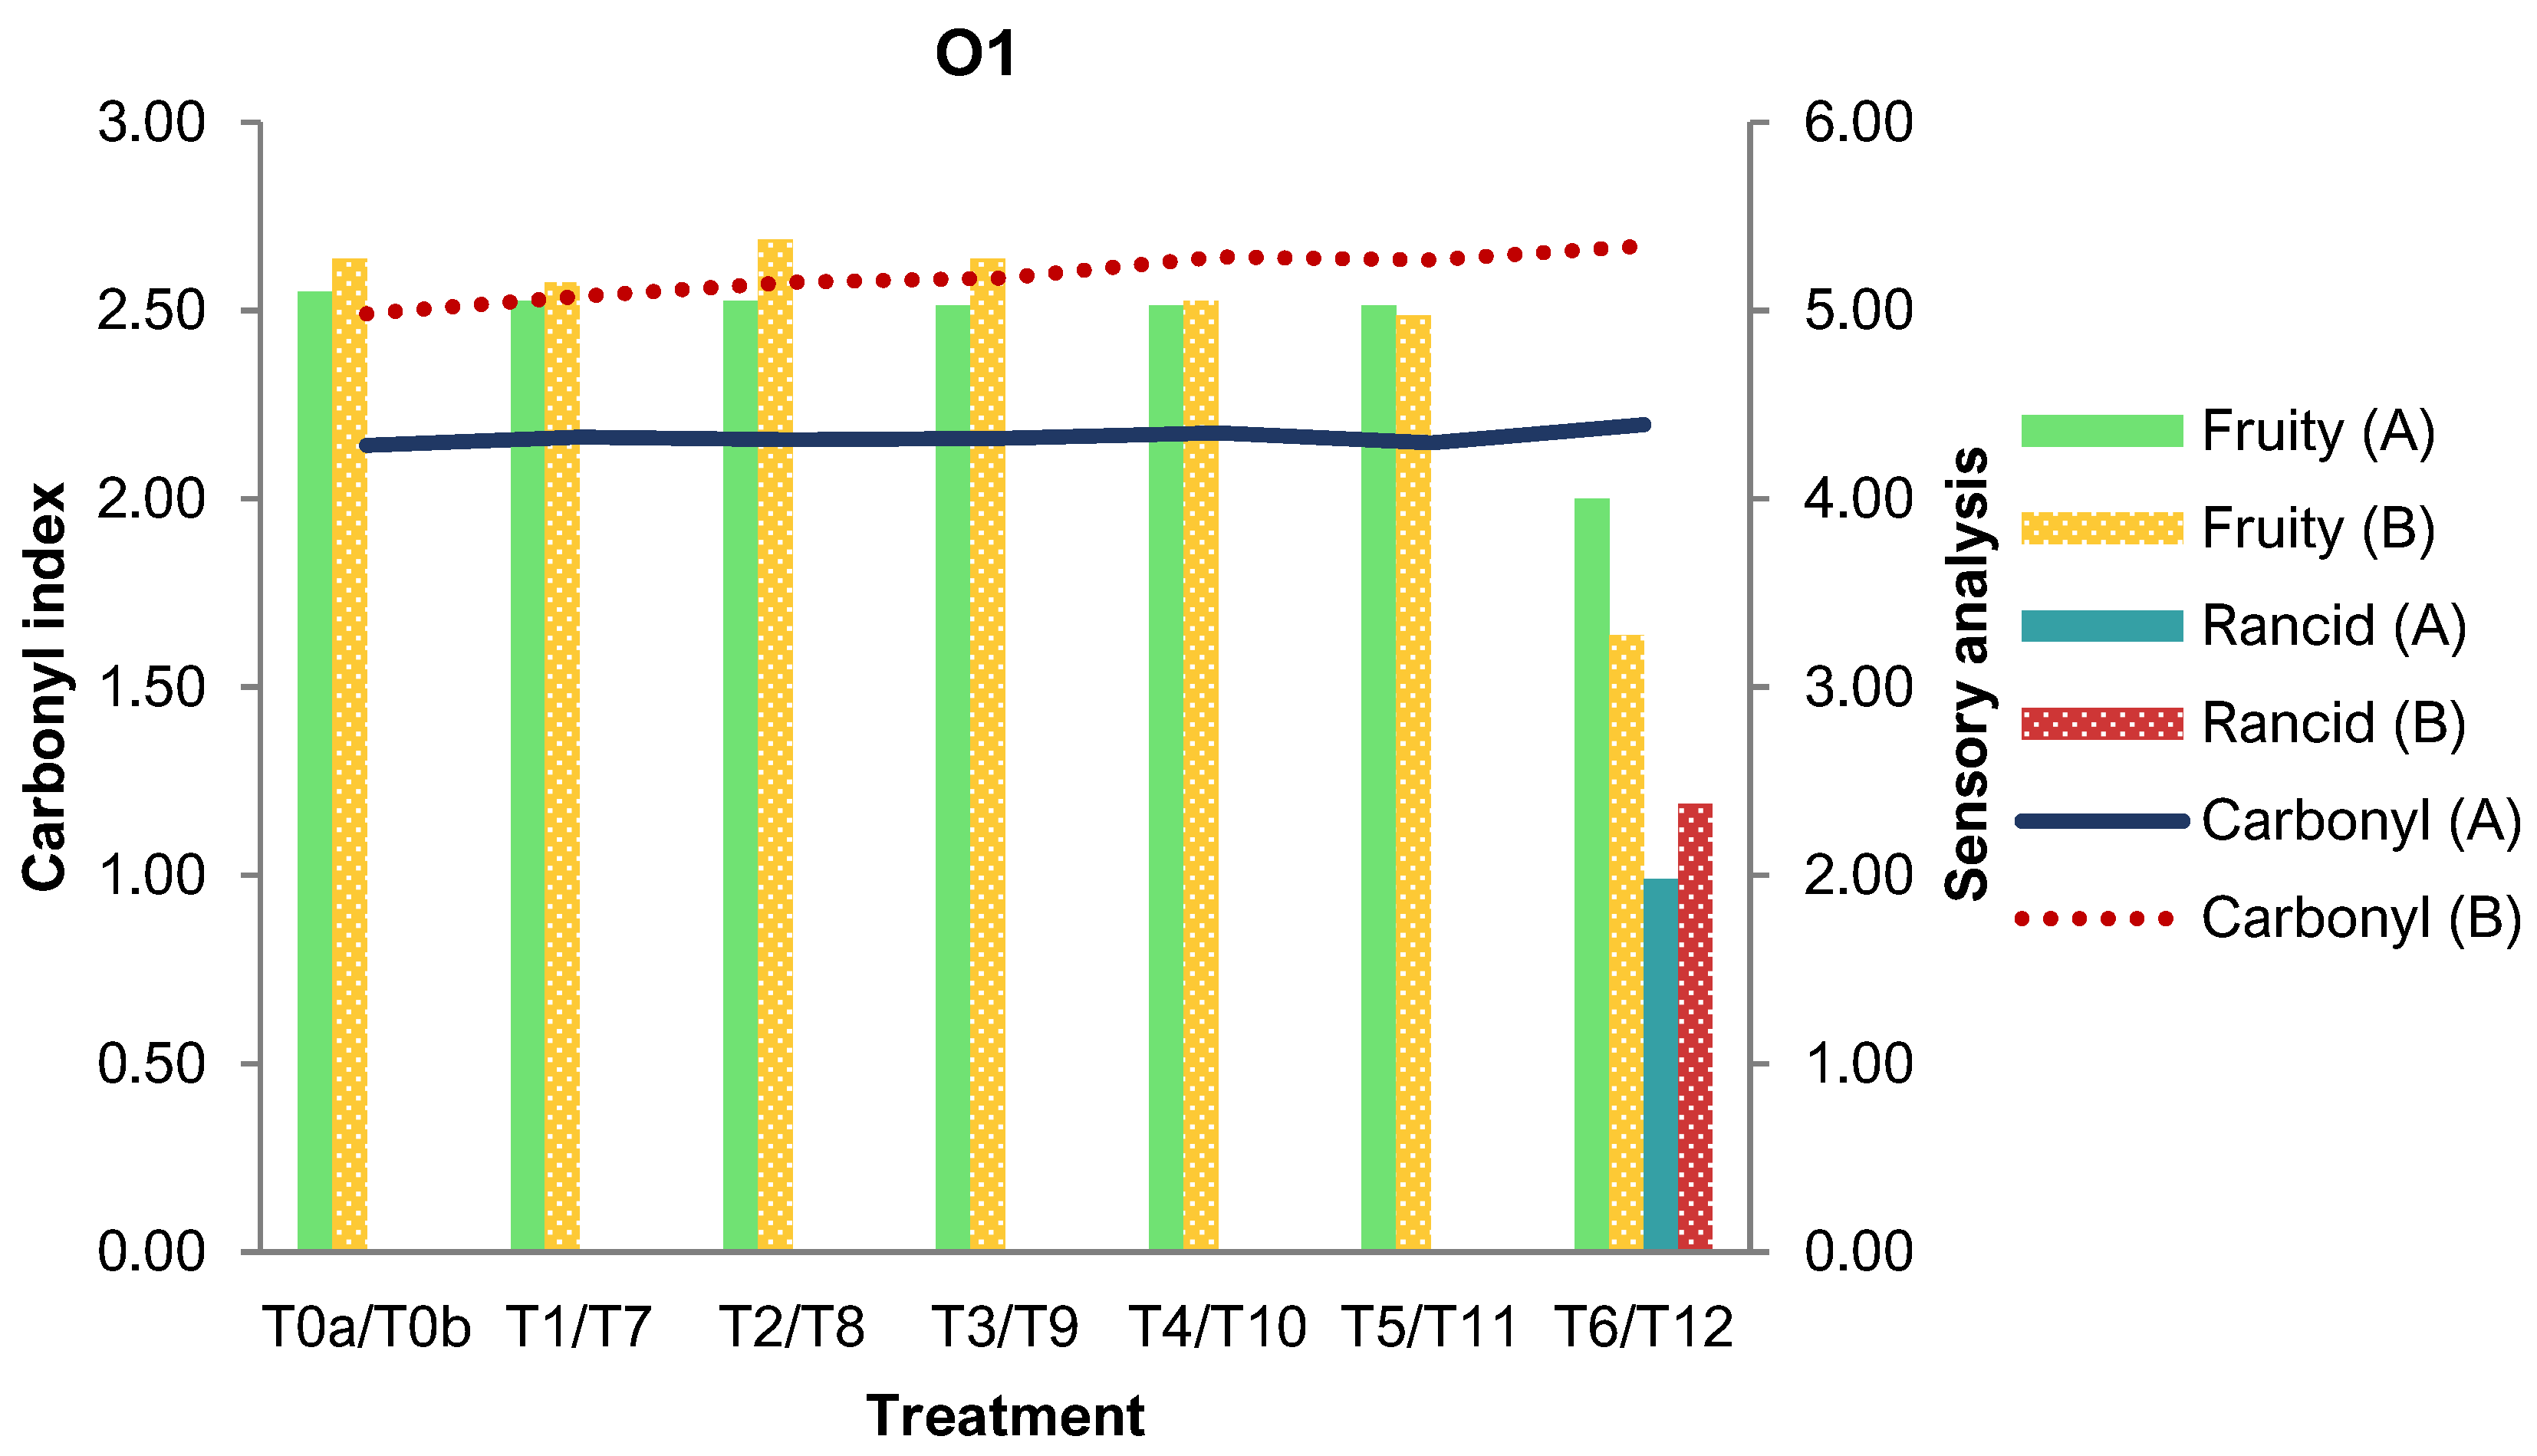
Figure 5.
Overlay of carbonyl index and sensory descriptors of intense olive oil (O1).
In these figures, it is observed that the carbonyl index increases with the treatments compared to the control sample in all cases. This could explain why compounds including the carbonyl functional group (C=O) mentioned earlier could transfer to the analyzed olive oils, causing undesirable flavors and aromas. In this case, the sensory analysis revealed a decrease in the “fruity” intensity in both oils and an increase in the “rancid” defect during the treatments for O04 and with the more severe treatments for O1, thereby showing the loss of quality and increased deterioration in both oils.
Furthermore, it was observed that under conditions of greater plastic deterioration, there is a greater diffusion of heavy metals, such as antimony (Sb), which is known to be present in it. In this context, PET O1 showed a reduction in the percentage of crystallinity (Wc) compared to the control sample after the treatments, with results of 9.08% and 6.02%, respectively (Table 10). O1 showed a higher concentration of Sb compared to the control sample after applying the treatments (Figure 5). Therefore, this observation could be explained by the fact that the applied treatments caused greater amorphization in the PET structure, which in turn, would facilitate the diffusion of compounds like Sb [78].
4. Conclusions
The physicochemical analysis of olive oils in Experiment A showed that thermal exposure did not significantly impact the acidity index or the conversion of hydroperoxides into secondary oxidation products. Fluctuations were observed in the extinction coefficients K232 and K268. In Experiment B, an increase in the peroxide value and the K268 coefficient was detected during storage, indicating a higher presence of secondary oxidation products. Additionally, there was a reduction in photosynthetic pigments, a decrease in the “fruity” intensity, and an increase in the “rancid” defect with more severe treatments, although all results remained within regulatory limits.
In Experiment A, degradation of the PET showed initial fluctuations in the carbonyl index with different stabilization stages, while Experiment B exhibited a more linear increase in the carbonyl index, indicating more advanced degradation. The PET associated with the intense olive oil showed greater resistance to degradation in the early stages of storage, whereas the PET associated with the mild olive oil showed better resistance in the later stages. DSC analysis revealed a decrease in crystallinity (Wc) and alterations in glass transition (Tg), melting (Tm), and crystallization (Tc) temperatures, confirming PET degradation and suggesting possible effects on compound migration into the oil.
Heavy metal analysis showed levels within legal limits, although copper, used as a catalyst in PET recycling, could explain the increase in the carbonyl index and the decrease in Wc. Antimony, while present in higher concentrations in some treated samples, also remained within legal limits. These results suggest a potential relationship between PET degradation and compound migration into the oil, emphasizing the need for ongoing monitoring of PET stability and heavy metal levels to ensure food safety and maintain product quality.
Author Contributions
Conceptualization, M.D.L.R. and P.G.-T.; methodology, P.G.-T. and M.D.L.R.; software, validation, and formal analysis, P.G.-T., Á.G.-R. and M.D.L.R.; investigation and data curation, M.D.L.R., P.G.-T. and Á.G.-R.; resources, P.G.-T. and M.D.L.R.; writing—original draft preparation, P.G.-T.; writing—review and editing, P.G.-T. and Á.G.-R.; supervision: M.D.L.R. All authors have read and agreed to the published version of the manuscript.
Funding
DEMATOX project: Tests for the Study of the Deterioration of Composite and/or Bio-Based Materials and Research Group “Bioprocesses” (TEP-138) of the Andalusia Regional Government (Spain).
Institutional Review Board Statement
Not applicable.
Informed Consent Statement
Not applicable.
Data Availability Statement
Data are contained within the article.
Conflicts of Interest
The authors declare no conflicts of interest.
References
- FAO. An Introduction to the Basic Concepts of Food Security. Available online: https://www.fao.org/3/al936s/al936s00.pdf (accessed on 5 July 2024).
- Food Safety in Compulsory Secondary Education. Spanish Agency for Food Safety. Ministry of Health and Consumption (AECOSAN). 2003. Available online: https://www.aesan.gob.es/AECOSAN/docs/documentos/publicaciones/seguridad_alimentaria/seguridad_edu_secundaria.pdf (accessed on 5 July 2024).
- Food and Agriculture Organization of the United Nations (FAO). In a New United Nations Report Focused on Food Security and Nutrition in Europe and Central Asia, the Path Towards More Affordable and Sustainable Diets is Highlighted. Available online: https://www.fao.org/newsroom/detail/new-un-report-focuses-on-food-security-and-nutrition-in-europe-and-central-asia-points-way-towards-more-affordable-and-sustainable-diets/es (accessed on 5 July 2024).
- Food Poisoning. Available online: https://www.medlineplus.gov/spanish/ency/article/001652.htm (accessed on 5 July 2024).
- Vásquez de Plata, G. La Contaminación de Los Alimentos, Un Problema Por Resolver. Salud UIS 2003, 35, 48–57. [Google Scholar]
- EFSA Cadmium in Food—Scientific Opinion of the Panel on Contaminants in the Food Chain. Available online: https://efsa.onlinelibrary.wiley.com/doi/epdf/10.2903/j.efsa.2009.980 (accessed on 5 July 2024).
- Food and Agriculture Organization of the United Nations (FAO) Sustainable Development Goals Helpdesk. Available online: https://www.fao.org/sustainable-development-goals-helpdesk/en (accessed on 5 July 2024).
- González, M. Determinación de La Migración de Monómeros y Aditivos Plásticos de Envases Alimentarios; Universidad de Granada: Granada, España, 2006. [Google Scholar]
- Torre, A. Migración de Diferentes Simulantes Alimentarios de Productos de Degradación de Poli(Ácido Láctico) Reciclado; Universidad Politécnica de Madrid: Madrid, España, 2017. [Google Scholar]
- Cobos, R. El Polietilén Tereftalato (PET) Como Envase de Aguas Minerales. Boletín Soc. Española Hidrol. Medica 2016, 31, 179–190. [Google Scholar] [CrossRef]
- Commission Regulation (EU) 2023/915 of 25 April 2023, on Maximum Limits for Certain Contaminants in Foodstuffs, and Repealing Regulation (EC) No 1881/2006. Available online: https://www.boe.es/buscar/doc.php?id=DOUE-L-2023-80614 (accessed on 5 July 2024).
- Commission Regulation (EU) 2020/1245 of 2 September 2020, Amending and Correcting Regulation (EU) No 10/2011 on Plastic Materials and Articles Intended to Come into Contact with Food. Available online: https://www.boe.es/buscar/doc.php?id=DOUE-L-2020-81322 (accessed on 5 July 2024).
- FAO/WHO Codex Alimentarius Commission Joint Food Standards Programme, Forty-Fifth Session, FAO Headquarters, Roma (Italia). Available online: https://www.fao.org/fao-who-codexalimentarius/sh-proxy/zh/?lnk=1&url=https%253A%252F%252Fworkspace.fao.org%252Fsites%252Fcodex%252FMeetings%252FCX-701-45%252FFinal%252520Report%252520CAC45%252FREP22_CACs.pdf (accessed on 5 July 2024).
- European Commission (EC) Statistics on Oilseeds and Protein Crops. Available online: https://agriculture.ec.europa.eu/data-and-analysis/markets/overviews/market-observatories/crops/oilseeds-and-protein-crops_es (accessed on 5 July 2024).
- European Commission (EC) Olive Oil. Available online: https://agriculture.ec.europa.eu/farming/crop-productions-and-plant-based-products/olive-oil_es (accessed on 5 July 2024).
- Cinquanta, L.; Esti, M.; Di Matteo, M. Oxidative Stability of Virgin Olive Oils. J. Am. Oil Chem. Soc. 2001, 78, 1197–1202. [Google Scholar] [CrossRef]
- Okogeri, O.; Tasioula-Margari, M. Changes occurring in phenolic compounds and alpha-tocopherol of virgin olive oil during storage. J. Agric. Food Chem. 2002, 50, 1077–1080. [Google Scholar] [CrossRef] [PubMed]
- Di Giovacchino, L.; Sestili, S.; Di Vincenzo, D. Influence of Olive Processing on Virgin Olive Oil Quality. Eur. J. Lipid Sci. Technol. 2002, 104, 587–601. [Google Scholar] [CrossRef]
- Angerosa, F.; Servili, M.; Selvaggini, R.; Taticchi, A.; Esposto, S.; Montedoro, G. Volatile Compounds in Virgin Olive Oil: Occurrence and Their Relationship with the Quality. J. Chromatogr. A 2004, 1054, 17–31. [Google Scholar] [CrossRef]
- Gómez-Alonso, S.; Mancebo-Campos, V.; Salvador, M.D.; Fregapane, G. Evolution of Major and Minor Components and Oxidation Indices of Virgin Olive Oil during 21 Months Storage at Room Temperature. Food Chem. 2007, 100, 36–42. [Google Scholar] [CrossRef]
- Morelló, J.-R.; Motilva, M.-J.; Tovar, M.-J.; Romero, M.-P. Changes in Commercial Virgin Olive Oil (Cv Arbequina) during Storage, with Special Emphasis on the Phenolic Fraction. Food Chem. 2004, 85, 357–364. [Google Scholar] [CrossRef]
- Fadda, C.; Del Caro, A.; Sanguinetti, A.M.; Urgeghe, P.P.; Vacca, V.; Arca, P.P.; Piga, A. Changes during Storage of Quality Parameters and in Vitro Antioxidant Activity of Extra Virgin Monovarietal Oils Obtained with Two Extraction Technologies. Food Chem. 2012, 134, 1542–1548. [Google Scholar] [CrossRef]
- Krichene, D.; Haddada, F.M.; Fernandez, X.; Cuvelier, L.L.; Zarrouk, M. Volatile Compounds Characterising Tunisian Virgin Olive Oils: The Influence of Cultivar. J. Food Sci. Technol. 2010, 45, 944–950. [Google Scholar] [CrossRef]
- Commission Delegated Regulation (EU) 2022/2104 of 29 July 2022 supplementing Regulation (EU) No 1308/2013 of the European Parliament and of the Council as Regards Marketing Standards for Olive Oil, and Repealing Commission Regulation (EEC) No 2568/91 and Commission Implementing Regulation (EU) No 29/2012. Available online: https://eur-lex.europa.eu/legal-content/EN/TXT/PDF/?uri=CELEX:32022R2104 (accessed on 5 July 2024).
- Boukandoul, S.; Zaidi, F.; Santos, C.S.P.; Casal, S. Moringa Oleifera Oil Nutritional and Safety Impact on Deep-Fried Potatoes. Foods 2023, 12, 4416. [Google Scholar] [CrossRef] [PubMed]
- Yu, K.S.; Cho, H.; Hwang, K.T. Physicochemical Properties and Oxidative Stability of Frying Oils during Repeated Frying of Potato Chips. Food Sci. Biotechnol. 2018, 27, 651–659. [Google Scholar] [CrossRef] [PubMed]
- Royal Decree 760/2021 of 31 August 2021, Approving the Quality Standard for Olive Oils and Olive Pomace Oils. Available online: https://www.boe.es/boe/dias/2021/09/01/pdfs/BOE-A-2021-14318.pdf (accessed on 5 July 2024).
- González-Torres, P.; Puentes, J.G.; Moya, A.J.; La Rubia, M.D. Comparative Study of the Presence of Heavy Metals in Edible Vegetable Oils. Appl. Sci. 2023, 13, 3020. [Google Scholar] [CrossRef]
- ISO 660:2020; Animal and Vegetable Fats and Oils. Determination of Acid Value and Acidity. International Organization for Standardization (ISO): Geneva, Switzerland, 2020.
- Commission Regulation (EEC) No 2568/91 of 11 July 1991 on the Characteristics of Olive Oil and Olive-Residue Oil and on the Relevant Methods of Analysis. Available online: https://eur-lex.europa.eu/legal-content/en/ALL/?uri=CELEX%3A31991R2568 (accessed on 5 July 2024).
- ISO 3960:2017; Animal and Vegetable Fats and Oils. Determination of Peroxide Value. Iodometric (Visual) Endpoint Determination. International Organization for Standardization (ISO): Geneva, Switzerland, 2017. Available online: https://cdn.standards.iteh.ai/samples/71268/578d213fc79042e0badd1e9f699bf1d6/ISO-3960-2017.pdf (accessed on 5 July 2024).
- COI/T.20/Doc. No 5/Rev. 1. Sensory Analysis Of Olive Oil Standard. Available online: https://www.internationaloliveoil.org/wp-content/uploads/2019/11/COI-T.20-Doc.-No-5-Rev1-2007-Eng.pdf (accessed on 5 July 2024).
- Puentes, J.G. Estudio Del Deterioro de Envases de PET y Su Relación Con La Calidad de Aceites de Oliva; Universidad de Jaén: Jaén, España, 2021. [Google Scholar]
- Abid, U.; Sun, G.; Soong, Y.-H.V.; Williams, A.; Chang, A.C.; Ayafor, C.; Patel, A.; Wong, H.-W.; Sobkowicz, M.J.; Xie, D. Evaluation of Enzymatic Depolymerization of PET, PTT, and PBT Polyesters. Biochem. Eng. J. 2023, 199, 109074. [Google Scholar] [CrossRef]
- El Yamani, M.; Sakar, E.H.; Boussakouran, A.; Rharrabti, Y. Effect of Storage Time and Conditions on the Quality Characteristics of ‘Moroccan Picholine’ Olive Oil. Biocatal. Agric. Biotechnol. 2022, 39, 102244. [Google Scholar] [CrossRef]
- Klisović, D.; Novoselić, A.; Lukić, I.; Brkić Bubola, K. Extra Virgin Olive Oil under Simulated Consumption Conditions: Evaluation of Quality, Health, and Flavour Properties. J. Food Compos. Anal. 2022, 110, 104570. [Google Scholar] [CrossRef]
- Escudero, A. Estudios de Migración En Aceites de Oliva Vírgenes Extra, Envasados En PET; Universidad de Jaén: Jaén, España, 2019. [Google Scholar]
- Zaroual, H.; Chèné, C.; Mestafa El Hadrami, E.; Karoui, R. Comparison of Four Classification Statistical Methods for Characterising Virgin Olive Oil Quality during Storage up to 18 Months. Food Chem. 2022, 370, 131009. [Google Scholar] [CrossRef]
- Albi, T.; Lanzón, A.; Guinda, A.; Pérez-Camino, M.C.; León, M. Microwave and Conventional Heating Effects on Some Chemical Parameters of Edible Fats. J. Agric. Food Chem. 1997, 45, 3000–3003. [Google Scholar] [CrossRef]
- Cossignani, L.; Simonetti, M.S.; Neri, A.; Damiani, P. Changes in Olive Oil Composition Due to Microwave Heating. J. Am. Oil Chem. 1998, 75, 931–937. [Google Scholar] [CrossRef]
- Ayton, J.; Mailer, R.; Grahamn, K. The Effect of Storage Conditions on Extra Virgin Olive Oil Quality. Available online: https://1.oliveoiltimes.com/library/Olive-Oil-Storage-Conditions.pdf (accessed on 5 July 2024).
- Khaneghah, A.M.; Shoeibi, S.; Ameri, M. Effects of Storage Conditions and PET Packaging on Quality of Edible Oils in Iran. Adv. Environ. Biol. 2012, 6, 694–701. [Google Scholar]
- Casal, S.; Malheiro, R.; Sendas, A.; Oliveira, B.P.P.; Pereira, J.A. Olive Oil Stability under Deep-Frying Conditions. Food Chem. Toxicol. 2010, 48, 2972–2979. [Google Scholar] [CrossRef]
- Malheiro, R.; Casal, S.; Rodrigues, N.; Renard, C.M.G.C.; Pereira, J.A. Volatile Changes in Cv. Verdeal Transmontana Olive Oil: From the Drupe to the Table, Including Storage. Food. Res. Int. 2018, 106, 374–382. [Google Scholar] [CrossRef] [PubMed]
- Marx, Í.M.G.; Rodrigues, N.; Veloso, A.C.A.; Casal, S.; Pereira, J.A.; Peres, A.M. Effect of Malaxation Temperature on the Physicochemical and Sensory Quality of Cv. Cobrançosa Olive Oil and Its Evaluation Using an Electronic Tongue. LWT 2021, 137, 110426. [Google Scholar] [CrossRef]
- Pulido, B.A.; Habboub, O.S.; Aristizabal, S.L.; Szekely, G.; Nunes, S.P. Recycled Poly(Ethylene Terephthalate) for High Temperature Solvent Resistant Membranes. ACS Appl. Polym. Mater. 2019, 1, 2379–2387. [Google Scholar] [CrossRef]
- Feng, X.; Hu, X.; Yu, J.; Zhao, M.; Yang, F.; Wang, X.; Zhang, C.; Weng, Y.; Han, J. A Hydrotalcite-Based PET Composites with Enhanced Properties for Liquid Milk Packaging Applications. Materials 2023, 16, 1857. [Google Scholar] [CrossRef] [PubMed]
- da Silva, A.F.; Papai, R.; Luz, M.S.; Gaubeur, I. Analytical Extraction Procedure Combined with Atomic and Mass Spectrometry for the Determination of Tin in Edible Oil Samples, and the Potential Application to Other Chemical Elements. J. Food Compos. Anal. 2021, 96, 103759. [Google Scholar] [CrossRef]
- Saxena, D.; Rana, D.; Bhoje Gowd, E.; Maiti, P. Improvement in Mechanical and Structural Properties of Poly(Ethylene Terephthalate) Nanohybrid. SN Appl. Sci. 2019, 1, 1363. [Google Scholar] [CrossRef]
- Roungpaisan, N.; Srisawat, N.; Rungruangkitkrai, N.; Chartvivatpornchai, N.; Boonyarit, J.; Kittikorn, T.; Chollakup, R. Melt Spinning Process Optimization of Polyethylene Terephthalate Fiber Structure and Properties from Tetron Cotton Knitted Fabric. Polymers 2023, 15, 4364. [Google Scholar] [CrossRef]
- Ibor, O.R.; Mpama, N.-O.L.; Okoli, C.P.; Ogarekpe, D.M.; Edet, U.O.; Ajang, R.O.; Onyezobi, C.E.; Anyanti, J.; Idogho, O.; Aizobu, D.; et al. Occurrence, Identification and Characterization of Plastic Pollution from an Open Solid Waste Dumpsite in Calabar, Southern Nigeria. Environ. Adv. 2023, 11, 100338. [Google Scholar] [CrossRef]
- Pal, S.K.; Prabhudesai, V.S.; Vinu, R. Catalytic Upcycling of Post-Consumer Multilayered Plastic Packaging Wastes for the Selective Production of Monoaromatic Hydrocarbons. J. Environ. Manag. 2024, 351, 119630. [Google Scholar] [CrossRef]
- Xu, Z.; Cheng, C.; Zhong, J.; Gao, W.; Li, J.; Liu, J. Co-Pyrolytic Interactions and Products of Brominated Epoxy Resin and Polyethylene Terephthalate: TG-FTIR Analysis and Machine Learning Prediction. J. Anal. Appl. Pyrolysis 2023, 175, 106223. [Google Scholar] [CrossRef]
- Zhang, C.; Dong, Z.; Chen, Q.; Lin, Y.; Zhou, Y.; Xu, Q. Determination of Key Factors Affecting Biofilm Formation on the Aged Poly(Ethylene Terephthalate) during Anaerobic Digestion. Chemosphere 2023, 344, 140435. [Google Scholar] [CrossRef]
- Ioakeimidis, C.; Fotopoulou, K.N.; Karapanagioti, H.K.; Geraga, M.; Zeri, C.; Papathanassiou, E.; Galgani, F.; Papatheodorou, G. The Degradation Potential of PET Bottles in the Marine Environment: An ATR-FTIR Based Approach. Sci. Rep. 2016, 6, 23501. [Google Scholar] [CrossRef] [PubMed]
- Chen, Y.; Wang, Z.; Chen, G.; Wang, Q.; Sun, T.; Zhang, M.; Du, Z.; Wu, M.; Guo, S.; Lei, T.; et al. Synergistic Effects and Products Yield Analyses Based on Co-Pyrolysis of Poplar Tree and Rape Stalks with Polyethylene Terephthalate and Polypropylene. J. Energy Inst. 2024, 112, 101461. [Google Scholar] [CrossRef]
- Eti, S.A.; Islam, M.S.; Shourove, J.H.; Saha, B.; Ray, S.K.; Sultana, S.; Ali Shaikh, M.A.; Rahman, M.M. Assessment of Heavy Metals Migrated from Food Contact Plastic Packaging: Bangladesh Perspective. Heliyon 2023, 9, e19667. [Google Scholar] [CrossRef]
- Chércoles Asensio, R.; San Andrés Moya, M.; De La Roja, J.M.; Gómez, M. Analytical Characterization of Polymers Used in Conservation and Restoration by ATR-FTIR Spectroscopy. Anal. Bioanal. Chem. 2009, 395, 2081–2096. [Google Scholar] [CrossRef]
- Singh, R.K.; Ruj, B.; Sadhukhan, A.K.; Gupta, P. A TG-FTIR Investigation on the Co-Pyrolysis of the Waste HDPE, PP, PS and PET under High Heating Conditions. J. Energy Inst. 2020, 93, 1020–1035. [Google Scholar] [CrossRef]
- Zheng, Y.; Wu, Y.; Zhang, B.; Wang, Z. Preparation and characterization of CO2-selective Pebax/NaY mixed matrix membranes. J. Appl. Polym. Sci. 2020, 137, 48398. [Google Scholar] [CrossRef]
- Romão, W.; Spinacé, M.A.S.; Paoli, M.-A. De Poli(Tereftalato de Etileno), PET: Uma Revisão Sobre Os Processos de Síntese, Mecanismos de Degradação e Sua Reciclagem. Polímeros 2009, 19, 121–132. [Google Scholar] [CrossRef]
- Liu, J.; Bian, S.G.; Xiao, M.; Wang, S.J.; Meng, Y.Z. Thermal Degradation and Isothermal Crystalline Behavior of Poly(Trimethylene Terephthalate). Chin. Chem. Lett. 2009, 20, 487–491. [Google Scholar] [CrossRef]
- McNeill, I.C.; Bounekhel, M. Thermal Degradation Studies of Terephthalate Polyesters: 1. Poly(Alkylene Terephthalates). Polym. Degrad. Stab. 1991, 34, 187–204. [Google Scholar] [CrossRef]
- Carlsson, D.J.; Clark, F.R.S.; Wiles, D.M. Photo-Oxidation of Polypropylene Monofilaments. I. Chemical Changes and Mechanical Deterioration. Text. Res. J. 1976, 46, 590–599. [Google Scholar] [CrossRef]
- Ashwinder, C.; Malini, S.; Gupta, R.; Gupta, A. Evaluation on the Thermo-Oxidative Degradation of PET Using Prodegradant Additives. Indian J. Sci. Technol. 2017, 10, 1–5. [Google Scholar] [CrossRef]
- Bayo, J.; Rojo, D.; Olmos, S. Weathering Indices of Microplastics along Marine and Coastal Sediments from the Harbor of Cartagena (Spain) and Its Adjoining Urban Beach. Mar. Pollut. Bull. 2022, 178, 113647. [Google Scholar] [CrossRef]
- Xiaoyan, Q.; Li, X.; Yue, W.; Yin, C.; Xu, Y.; Hui, N.; Zhou, N.-Y. Composting-Based Degradation of Poly (Ethylene Terephthalate) Microplastics and Its Enhancement with Exogenous PET Hydrolase Supplementation. Environ. Technol. Innov. 2023, 32, 103347. [Google Scholar] [CrossRef]
- Azeem, M.; Fournet, M.B.; Attallah, O.A. Ultrafast 99% Polyethylene Terephthalate Depolymerization into Value Added Monomers Using Sequential Glycolysis-Hydrolysis under Microwave Irradiation. Arab. J. Chem. 2022, 15, 103903. [Google Scholar] [CrossRef]
- Viora, L.; Combeau, M.; Pucci, M.F.; Perrin, D.; Liotier, P.-J.; Bouvard, J.-L.; Combeaud, C. A Comparative Study on Crystallisation for Virgin and Recycled Polyethylene Terephthalate (PET): Multiscale Effects on Physico-Mechanical Properties. Polymers 2023, 15, 4613. [Google Scholar] [CrossRef]
- Saabome, S.M.; Lee, J.E.; Hong, J.-S.; Kim, D.H.; Ahn, K.H. Mechanical Degradation of Poly(Ethylene Terephthalate) and Its Structural Modification by Chain Extender. Korea-Austral. Rheol. J. 2023, 35, 203–212. [Google Scholar] [CrossRef]
- Kanavouras, A. Alterations of PET Material Physical Properties during Storage of Olive Oil. Food Packag. Shelf Life 2019, 21, 100336. [Google Scholar] [CrossRef]
- Sánchez, M.; Rosales, A.; Maldonado, H. Estudio de Catalizadores En La Degradación de PET Reciclado. Ciencia UANL 2011, XIV, 39–45. [Google Scholar]
- Taghizadeh, S.F.; Rezaee, R.; Boskabady, M.; Mashayekhi Sardoo, H.; Karimi, G. Exploring the Carcinogenic and Non-Carcinogenic Risk of Chemicals Present in Vegetable Oils. Int. J. Environ. Anal. Chem. 2022, 102, 5756–5784. [Google Scholar] [CrossRef]
- Luka, M.F.; Akun, E. Investigation of Trace Metals in Different Varieties of Olive Oils from Northern Cyprus and Their Variation in Accumulation Using ICP-MS and Multivariate Techniques. Environ. Earth Sci. 2019, 78. [Google Scholar] [CrossRef]
- Zhuravlev, A.; Zacharia, A.; Gucer, S.; Chebotarev, A.; Arabadji, M.; Dobrynin, A. Direct Atomic Absorption Spectrometry Determination of Arsenic, Cadmium, Copper, Manganese, Lead and Zinc in Vegetable Oil and Fat Samples with Graphite Filter Furnace Atomizer. J. Food Compos. Anal. 2015, 38, 62–68. [Google Scholar] [CrossRef]
- Mohammed Alrajhi, I.; Idriss, H. Concentration of Trace Metals in Some Major Edible Oils of Riyadh. Rev. Intern. Contam. Ambient. 2020, 36, 977–984. [Google Scholar] [CrossRef]
- Haq, H.; Bibi, R.; Arain, M.; Safi, F.; Ullah, S.; Castro-Muñoz, R.; Boczkaj, G. Deep Eutectic Solvent (DES) with Silver Nanoparticles (Ag-NPs) Based Assay for Analysis of Lead (II) in Edible Oils. Food Chem. 2022, 379, 132085. [Google Scholar] [CrossRef]
- Khemani, K.C. Novel Approach for Studying the Thermal Degradation, and for Estimating the Rate of Acetaldehyde Generation by the Chain Scission Mechanism in Ethylene Glycol Based Polyesters and Copolyesters. Polym. Degrad. Stab. 2000, 67, 91–99. [Google Scholar] [CrossRef]
Disclaimer/Publisher’s Note: The statements, opinions and data contained in all publications are solely those of the individual author(s) and contributor(s) and not of MDPI and/or the editor(s). MDPI and/or the editor(s) disclaim responsibility for any injury to people or property resulting from any ideas, methods, instructions or products referred to in the content. |
© 2024 by the authors. Licensee MDPI, Basel, Switzerland. This article is an open access article distributed under the terms and conditions of the Creative Commons Attribution (CC BY) license (https://creativecommons.org/licenses/by/4.0/).