
EMG Activity of Lower Limb Muscles during Anti-Gravity Treadmill Running with Different Loads and Speeds


Abstract
1. Introduction
2. Materials and Methods
2.1. Participants
2.2. Procedures
2.3. Electromyography
2.4. Statistical Analysis
3. Results
4. Discussion
5. Conclusions
Author Contributions
Funding
Institutional Review Board Statement
Informed Consent Statement
Data Availability Statement
Conflicts of Interest
References
- Hopkins, C.; Graham, B.; Donnelly, B.; Robertson, A.; Strange, J. Adolescent track and field injuries presenting to US emergency departments. Physician Sportsmed. 2024, 52, 349–354. [Google Scholar]
- Veiga, S.; Suarez, B.; Segovia, C.; Navandar, A.; Rueda, J.; Navarro, E. Current iliotibial band syndrome alters patterns of running coordination in male and female runners, but not their levels of coordination variability. Sports Biomech. 2024, 15, 1–14. [Google Scholar] [CrossRef]
- Adamson, L.; Vandamme, L.; Prior, T.; Miller, S.C. Running-Related Injury Incidence: Does It Correlate with Kinematic Sub-groups of Runners? A Scoping Review. Sports Med. 2024, 54, 1163–1178. [Google Scholar] [CrossRef] [PubMed]
- Lee, J.H.; Kim, E.J. Optimizing rehabilitation outcomes for stroke survivors: The impact of speed and slope adjustments in anti-gravity treadmill training. Medicina 2024, 60, 542. [Google Scholar] [CrossRef]
- Hreljac, A.; Marshall, R.N.; Hume, P.A. Evaluation of lower extremity overuse injury potential in runners. Med. Sci. Sports Exerc. 2000, 32, 1635–1641. [Google Scholar] [CrossRef] [PubMed]
- James, S.L.; Bates, B.T.; Osternig, L.R. Injuries to runners. Am. J. Sports Med. 1978, 6, 40–50. [Google Scholar] [CrossRef] [PubMed]
- Messier, S.P.; Pittala, K.A. Etiologic factors associated with selected running injuries. Med. Sci. Sports Exerc. 1988, 20, 501–505. [Google Scholar] [CrossRef]
- Henkelmann, R.; Palke, L.; Schneider, S.; Muller, D.; Karich, B.; Mende, M.; Josten, C.; Bohme, J. Impact of anti-gravity treadmill rehabilitation therapy on the clinical outcomes after fixation of lower limb fractures: A randomized clinical trial. Clin. Rehabil. 2020, 35, 356–366. [Google Scholar] [CrossRef]
- Warren, B.L.; Jones, C.J. Predicting overuse injuries in female distance runners. Med. Sci. Sports Exerc. 1987, 19, 14–23. [Google Scholar]
- Fernandez-Lazaro, D.; Gallego-Gallego, D.; Corchete, L.; Frnandez Zoppino, D.; Gonzales-Bernal, J.; Garcia Gomez, B.; Mielgo-Ayuso, J. Inspiratory Muscle Training Program Using the PowerBreath®: Does It Have Ergogenic Potential for Respiratory and/or Athletic Performance? A Systematic Review with Meta-Analysis. Int. J. Environ. Res. Public Health 2021, 18, 6703. [Google Scholar] [CrossRef]
- Pietraszewski, P.; Gołaś, A.; Krzysztofik, M. Comparison of Muscle Activity During 200 m Indoor Curve and Straight Sprinting in Elite Female Sprinters. J. Hum. Kinet. 2021, 80, 309–316. [Google Scholar] [CrossRef]
- Pietraszewski, P.; Gołaś, A.; Krzysztofik, M.; Śrutwa, M.; Zajac, A. Evaluation of Lower Limb Muscle Electromyographic Activity during 400 m Indoor Sprinting among Elite Female Athletes: A Cross-Sectional Study. Int. J. Environ. Res. Public Health 2021, 18, 13177. [Google Scholar] [CrossRef] [PubMed]
- Derrick, T.; Hamill, J.; Caldwell, G. Energy absorption of impacts during running at various stride lengths. Med. Sci. Sports Exerc. 1998, 30, 128–135. [Google Scholar] [CrossRef] [PubMed]
- Cavanagh, P.R.; Lafortune, M.A. Ground reaction forces in distance running. J. Biomech. 1980, 13, 397–406. [Google Scholar] [CrossRef]
- Lieberman, D.E.; Venkadesan, M.; Werbel, W.A.; Daoud, A.I.; D’Andrea, S.; Davis, I.S.; Pitsiladis, Y. Foot strike patterns and collision forces in habitually barefoot versus shod runners. Nature 2010, 463, 531–535. [Google Scholar] [CrossRef]
- Munro, C.F.; Miller, D.I.; Fuglevand, A.J. Ground reaction forces in running: A reexamination. J. Biomech. 1987, 20, 147–155. [Google Scholar] [CrossRef]
- Hamill, J.; Bates, B.T.; Knutzen, K.M.; Sawhill, J.A. Variations in ground reaction force parameters at different running speeds. Hum. Mov. Sci. 1983, 2, 47–56. [Google Scholar] [CrossRef]
- Mercer, J.; Bezodis, N.; Russell, M.; Purdy, A.; DeLion, D. Kinetic Consequences of Constraining Running Behavior. J. Sports Sci. Med. 2005, 4, 144–152. [Google Scholar] [PubMed]
- Ferris, D.P.; Liang, K.; Farley, C.T. Runners adjust leg stiffness for their first step on a new running surface. J. Biomech. 1999, 32, 787–794. [Google Scholar] [CrossRef]
- Masumoto, K.; Mercer, J.A. Biomechanics of human locomotion in water: An electomyographic analysis. Exerc. Sport Sci. Rev. 2008, 36, 160–169. [Google Scholar] [CrossRef]
- Reilly, T.; Dowzer, C.N.; Cable, N.T. The physiology of deep-water running. J. Sports Sci. 2003, 21, 959–972. [Google Scholar] [CrossRef] [PubMed]
- Raffalt, P.C.; Hovgaard-Hansen, L.; Jensen, B.R. Running on a Lower-Body Positive Pressure Treadmill: VO 2 max, Respiratory Response, and Vertical Ground Reaction Force. Res. Q. Exerc. Sport 2013, 84, 213–222. [Google Scholar] [CrossRef] [PubMed]
- Whiteley, R.; Hansen, C.; Thomson, A.; Sideris, V.; Wilson, M.G. Lower limb EMG activation during reduced gravity running on an incline. Speed matters more than hills irrespective of indicated bodyweight. Gait. Posture 2021, 83, 52–59. [Google Scholar] [CrossRef]
- Liebenberg, J.; Scharf, J.; Forrest, D.; Dufek, J.S.; Masumoto, K.; Mercer, J.A. Determination of muscle activity during running at reduced body weight. J. Sports Sci. 2011, 29, 207–214. [Google Scholar] [CrossRef]
- Mercer, J.A.; Applequist, B.C.; Masumoto, K. Muscle activity during running with different body-weight-support mechanisms: Aquatic environment versus body-weight-support treadmill. J. Sport Rehabil. 2014, 23, 300–306. [Google Scholar] [CrossRef]
- Masumoto, K.; Mercer, J.A. Influence of speed on running strategies during forward and backward running with body weight support. J. Sports Med. Phys. Fitness 2023, 63, 241–249. [Google Scholar] [CrossRef] [PubMed]
- Hermens, H.J.; Freriks, B.; Disselhorst-Klug, C.; Rau, G. Development of recommendations for SEMG sensors and sensor placement procedures. J. Electromyogr. Kinesiol. 2000, 10, 361–374. [Google Scholar] [CrossRef]
- Besomi, M.; Hodges, P.W.; Clancy, E.A.; Van Dieën, J.; Hug, F.; Lowery, M.; Merletti, R.; Søgaard, K.; Wrigley, T.; Besier, T.; et al. Consensus for experimental design in electromyography (CEDE) project: Amplitude normalization matrix. J. Electromyogr. Kinesiol. 2020, 53, 102438. [Google Scholar] [CrossRef]
- Thomson, A.; Whiteley, R.; Hansen, C.; Wezel, J.; Racinais, S.; Wilson, M.G. Effect of speed and gradient on plantar force when running on an AlterG® treadmill. BMC Sports Sci. Med. Rehabil. 2021, 13, 34. [Google Scholar] [CrossRef]
- Vincent, H.; Madsen, A.; Vincent, K. Role of antigravity training in rehabilitation and return to sport after running injures. Arthrosc. Sports Med. Rehabil. 2022, 4, 141–149. [Google Scholar] [CrossRef]
- Kim, P.; Lee, H.; Choi, W.; Jung, S. Effect of 4 weeks of anti-gravity treadmill training on isokinetic muscle strength and muscle activity in adult patients with a femoral fracture: A randomized controlled trial. Int. J. Environ. Res. Public Health 2020, 17, 8572. [Google Scholar] [CrossRef] [PubMed]
- Barnes, K.; Janecke, J. Physiological and Biomechanical Responses of Highly Trained Distance Runners to Lower-Body Positive Pressure Treadmill Running. Sports Med. Open 2017, 3, 41. [Google Scholar] [CrossRef] [PubMed]
- Sainton, P.; Nicol, C.; Cabri, J.; Barthelemy-Montfort, J.; Berton, E.; Chavet, P. Influence of short-term unweighing and reloading on running kinetics and muscle activity. Eur. J. Appl. Physiol. 2015, 115, 1135–1145. [Google Scholar] [CrossRef] [PubMed]
- Jensen, B.R.; Hovgaard-Hansen, L.; Cappelen, K.L. Muscle activation and estimated relative joint force during running with weight support on a lower-body positive-pressure treadmill. J. Appl. Biomech. 2016, 32, 335–341. [Google Scholar] [CrossRef]
- Masumoto, K.; Soucy, M.T.; Bailey, J.P.; Mercer, J.A. Muscle activity during backward and forward running with body weight support. Hum. Mov. Sci. 2017, 55, 276–286. [Google Scholar] [CrossRef]
- Kim, H.; Lee, J.; Kim, J. Electromyography-signal-based muscle fatigue assessment for knee rehabilitation monitoring systems. Biomed. Eng. Lett. 2018, 9, 345–353. [Google Scholar] [CrossRef]

| Muscle | Speed | Body Weight Relief | |||
|---|---|---|---|---|---|
| 100% | 75% | 50% | 25% | ||
| Mean ± SD (95%) CI | Mean ± SD (95%) CI | Mean ± SD (95%) CI | Mean ± SD (95%) CI | ||
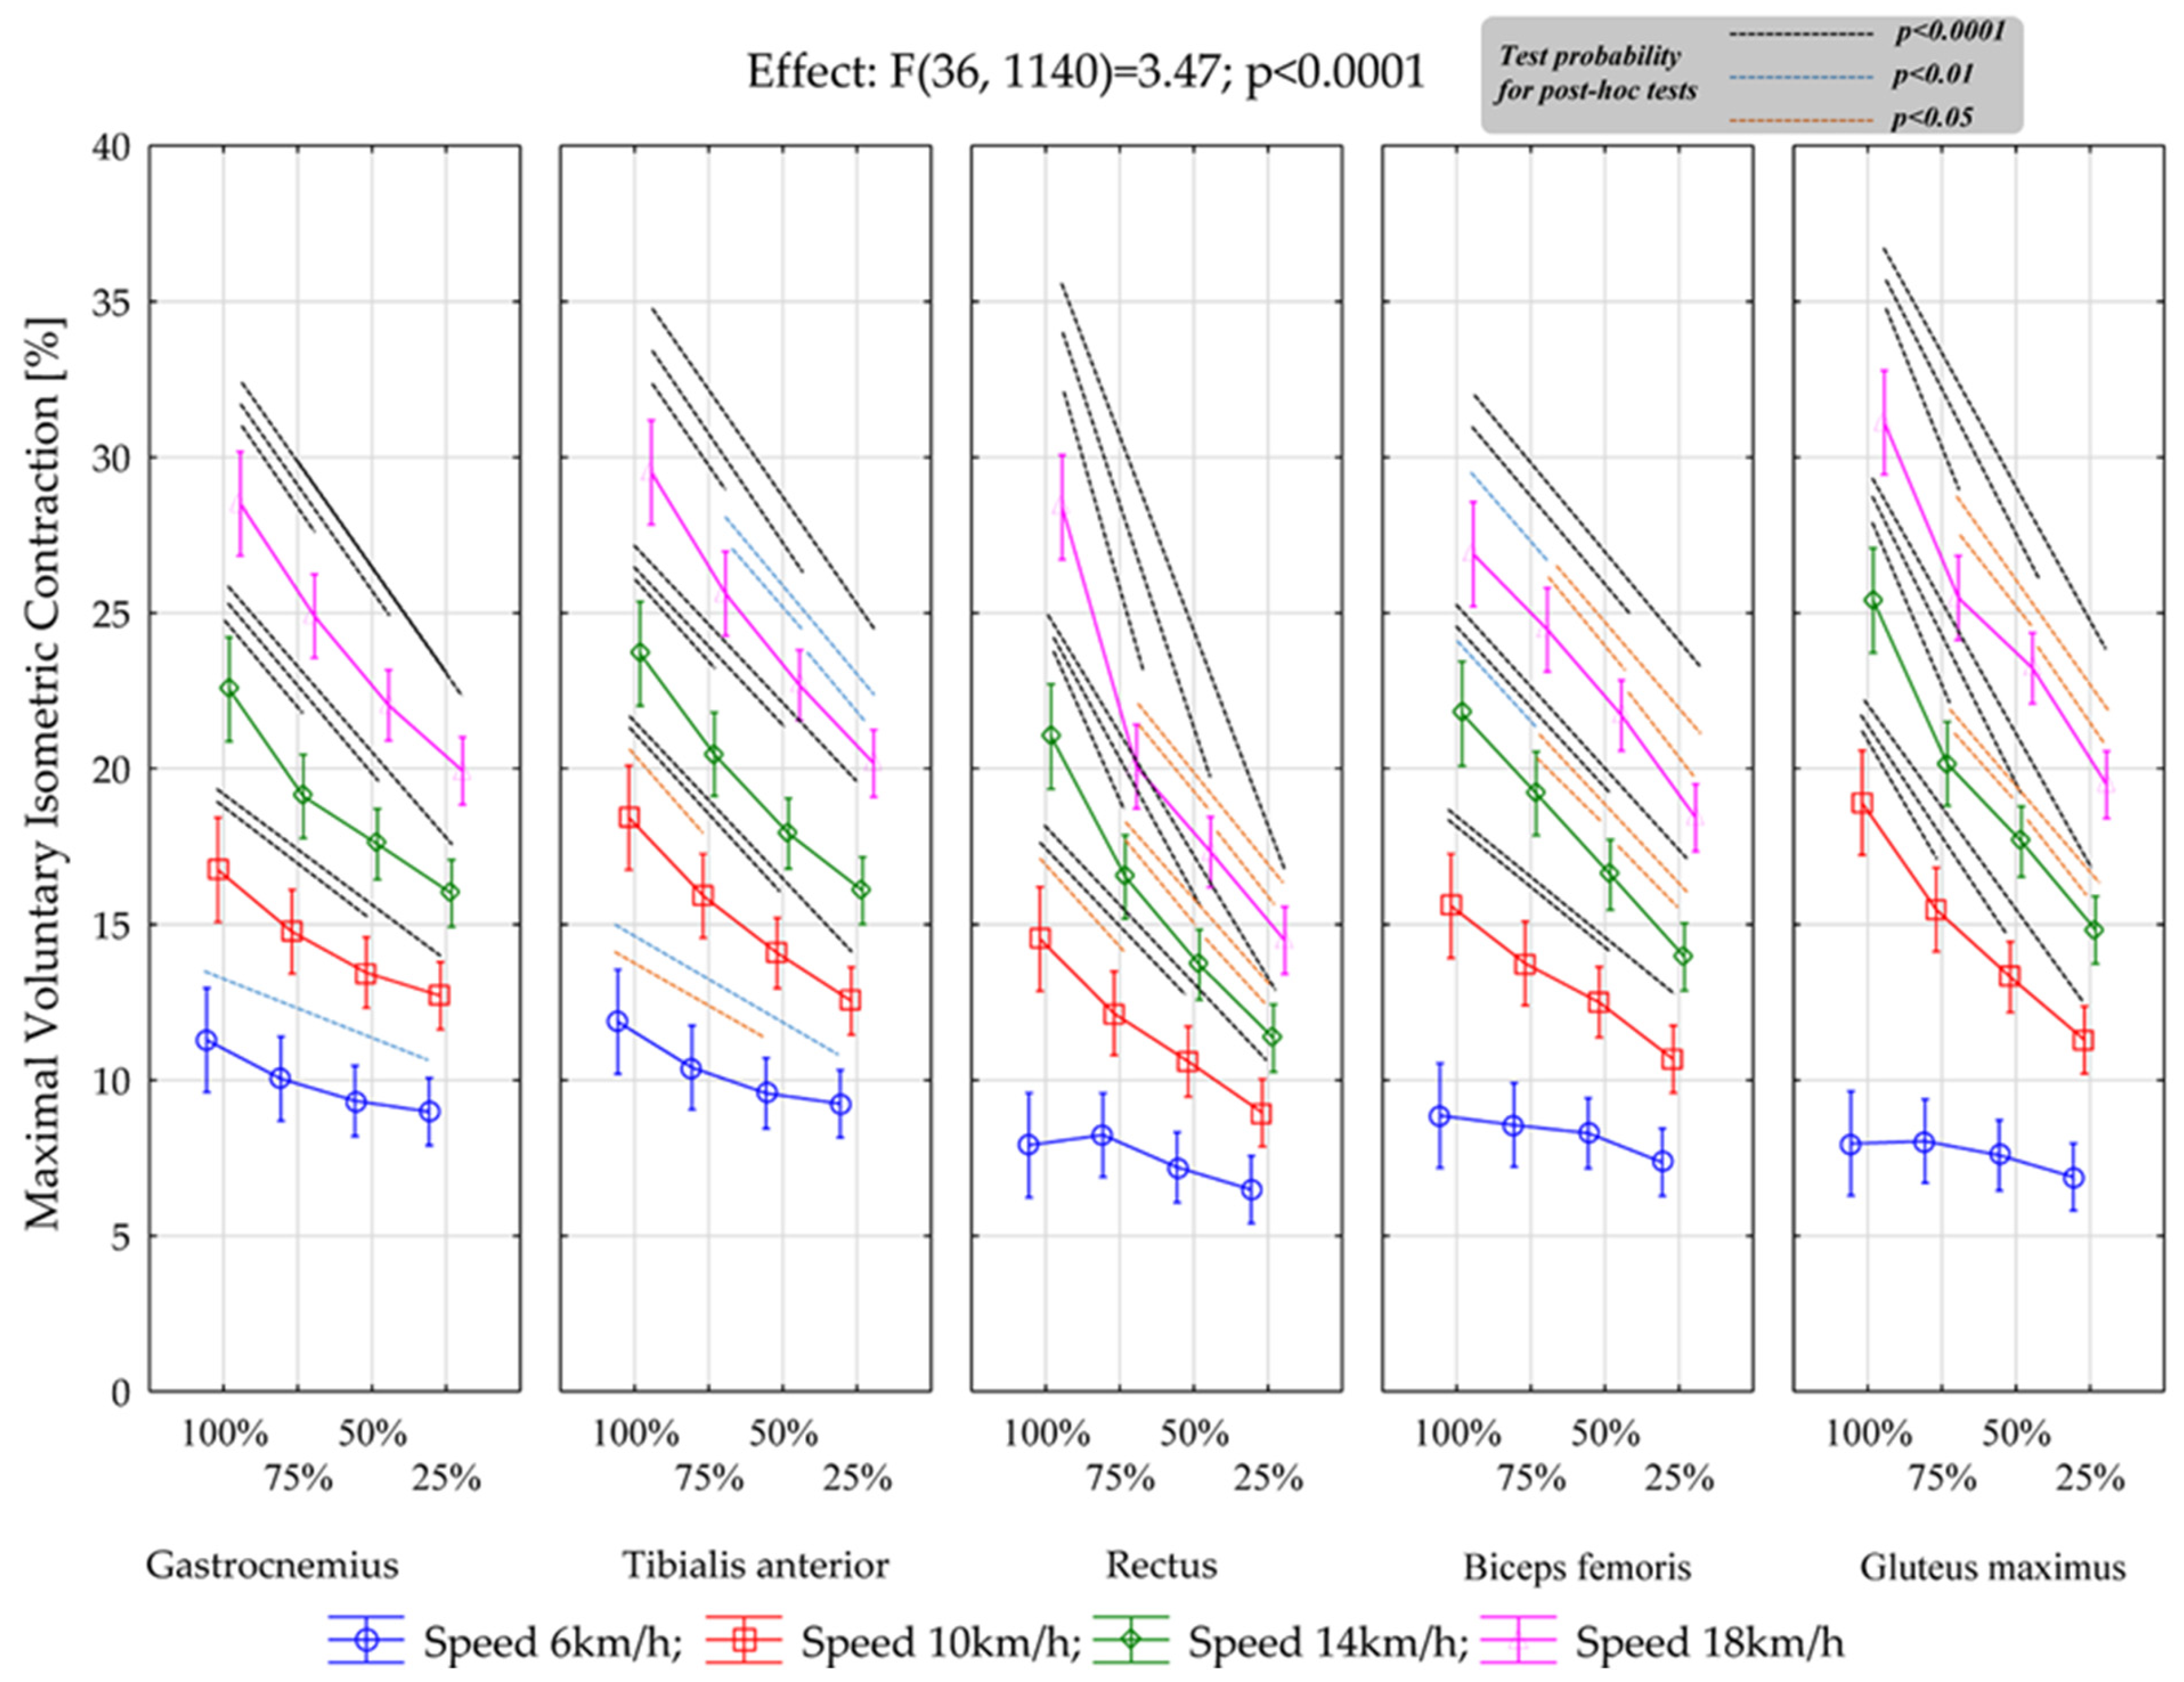
| Gastrocnemius | 6 km | 11.3 ± 1.50 (10.6–12.0) | 10.0 ± 1.36 (9.41–10.7) | 9.34 ± 1.14 (8.80–9.87) | 8.98 ± 1.53 (8.27–9.70) |
| 10 km | 16.7 ± 2.73 (15.5–18.0) | 14.8 ± 1.62 (14.0–15.5) | 13.4 ± 1.02 (13.0–13.9) | 12.7 ± 1.80 (11.9–13.6) | |
| 14 km | 22.6 ± 3.41 (20.95–24.15) | 19.1 ± 2.82 (17.79–20.43) | 17.6 ± 2.09 (16.60–18.56) | 16.0 ± 1.85 (15.13–16.86) | |
| 18 km | 28.5 ± 3.37 (26.9–30.1) | 24.9 ± 3.40 (23.3–26.5) | 22.0 ± 3.32 (20.5–23.6) | 19.9 ± 2.67 (18.7–21.2) | |
| Muscle | Speed | Body Weight Relief | |||
|---|---|---|---|---|---|
| 100% | 75% | 50% | 25% | ||
| Mean ± SD (95%) CI | Mean ± SD (95%) CI | Mean ± SD (95%) CI | Mean ± SD (95%) CI | ||
| Tibialis anterior | 6 km | 11.9 ± 1.65 (11.1–12.6) | 10.4 ± 1.57 (9.67–11.1) | 9.58 ± 1.62 (8.82–10.3) | 9.25 ± 1.54 (8.52–9.97) |
| 10 km | 18.4 ± 2.68 (17.2–19.7) | 15.9 ± 2.31 (14.8–17.0) | 14.1 ± 2.10 (13.1–15.1) | 12.6 ± 2.04 (11.6–13.5) | |
| 14 km | 23.7 ± 2.44 (22.6–24.8) | 20.5 ± 2.50 (19.3–21.6) | 17.9 ± 2.04 (17.0–18.9) | 16.1 ± 1.81 (15.2–16.9) | |
| 18 km | 29.5. ± 2.63 (28.3–30.7) | 25.6 ± 2.94 (24.2–27.0) | 22.7 ± 2.45 (21.5–23.8) | 20.2 ± 2.27 (19.1–21.2) | |
| Muscle | Speed | Body Weight Relief | |||
|---|---|---|---|---|---|
| 100% | 75% | 50% | 25% | ||
| Mean ± SD (95%) CI | Mean ± SD (95%) CI | Mean ± SD (95%) CI | Mean ± SD (95%) CI | ||
| Rectus Femoris | 6 km | 7.91 ± 2.30 (6.84–8.99) | 8.24 ± 1.74 (7.43–9.05) | 7.20 ± 1.65 (6.43–7.97) | 6.49 ± 1.35 (5.86–7.12) |
| 10 km | 14.5 ± 3.92 (12.7–16.4) | 12.1 ± 2.59 (10.9–13.3) | 10.6 ± 1.91 (9.71–11.5) | 8.96 ± 1.71 (8.16–9.76) | |
| 14 km | 21.0 ± 5.21 (18.6–23.5) | 16.5 ± 3.09 (15.1–18.0) | 13.7 ± 2.42 (12.6–14.8) | 11.3 ± 2.06 (10.4–12.3) | |
| 18 km | 28.4 ± 6.48 (25.4–31.4) | 20.1 ± 3.28 (18.5–21.6) | 17.3 ± 2.34 (16.2–18.4) | 14.5 ± 2.46 (13.3–15.6) | |
| Muscle | Speed | Body Weight Relief | |||
|---|---|---|---|---|---|
| 100% | 75% | 50% | 25% | ||
| Mean ± SD (95%) CI | Mean ± SD (95%) CI | Mean ± SD (95%) CI | Mean ± SD (95%) CI | ||
| Biceps Femoris | 6 km | 8.86 ± 1.55 (8.14–9.59) | 8.56 ± 1.47 (7.87–9.25) | 8.30 ± 1.72 (7.50–9.10) | 7.37 ± 1.59 (6.62–8.11) |
| 10 km | 15.6 ± 1.80 (14.7–16.4) | 13.7 ± 1.37 (13.1–14.4) | 12.5 ± 1.36 (11.9–13.14) | 10.7 ± 1.15 (10.1–11.2) | |
| 14 km | 21.8 ± 1.98 (20.8–22.7) | 19.2 ± 2.28 (18.1–20.3) | 16.6 ± 1.79 (15.8–17.4) | 14.0 ± 1.92 (13.1–14.8) | |
| 18 km | 26.9 ± 3.15 (25.4–28.4) | 24.5 ± 2.78 (23.1–25.8) | 21.7 ± 1.91 (20.8–22.6) | 18.4 ± 1.92 (17.5–19.3) | |
| Muscle | Speed | Body Weight Relief | |||
|---|---|---|---|---|---|
| 100% | 75% | 50% | 25% | ||
| Mean ± SD (95%) CI | Mean ± SD (95%) CI | Mean ± SD (95%) CI | Mean ± SD (95%) CI | ||
| Gluteus maximus | 6 km | 7.97 ± 1.77 (7.14–8.79) | 8.05 ± 1.54 (7.32–8.77) | 7.59 ± 1.56 (6.86–8.32) | 6.89 ± 1.69 (6.11–7.68) |
| 10 km | 18.9 ± 4.88 (16.6–21.2) | 15.5 ± 4.46 (13.4–17.6) | 13.3 ± 3.46 (11.7–14.9) | 11.3 ± 3.28 (9.76–12.8) | |
| 14 km | 25.4 ± 6.22 (22.5–28.3) | 20.2 ± 5.32 (17.7–22.6) | 17.7 ± 4.16 (15.7–19.6) | 14.8 ± 3.93 (13.0–16.7) | |
| 18 km | 31.1 ± 7.78 (27.5–34.7) | 25.5 ± 6.56 (22.4–28.5) | 23.2 ± 6.03 (20.4–26.0) | 19.5 ± 5.90 (16.7–22.2) | |
Disclaimer/Publisher’s Note: The statements, opinions and data contained in all publications are solely those of the individual author(s) and contributor(s) and not of MDPI and/or the editor(s). MDPI and/or the editor(s) disclaim responsibility for any injury to people or property resulting from any ideas, methods, instructions or products referred to in the content. |
© 2024 by the authors. Licensee MDPI, Basel, Switzerland. This article is an open access article distributed under the terms and conditions of the Creative Commons Attribution (CC BY) license (https://creativecommons.org/licenses/by/4.0/).
Share and Cite
Pietraszewski, P.; Gołaś, A.; Roczniok, R.; Gepfert, M.; Zając, A. EMG Activity of Lower Limb Muscles during Anti-Gravity Treadmill Running with Different Loads and Speeds. Appl. Sci. 2024, 14, 7518. https://doi.org/10.3390/app14177518
Pietraszewski P, Gołaś A, Roczniok R, Gepfert M, Zając A. EMG Activity of Lower Limb Muscles during Anti-Gravity Treadmill Running with Different Loads and Speeds. Applied Sciences. 2024; 14(17):7518. https://doi.org/10.3390/app14177518
Chicago/Turabian StylePietraszewski, Przemysław, Artur Gołaś, Robert Roczniok, Mariola Gepfert, and Adam Zając. 2024. "EMG Activity of Lower Limb Muscles during Anti-Gravity Treadmill Running with Different Loads and Speeds" Applied Sciences 14, no. 17: 7518. https://doi.org/10.3390/app14177518
APA StylePietraszewski, P., Gołaś, A., Roczniok, R., Gepfert, M., & Zając, A. (2024). EMG Activity of Lower Limb Muscles during Anti-Gravity Treadmill Running with Different Loads and Speeds. Applied Sciences, 14(17), 7518. https://doi.org/10.3390/app14177518