Article

A Machine Learning Predictive Model for Ship Fuel Consumption

by
Rhuan Fracalossi Melo
1,
Nelio Moura de Figueiredo
1,
Maisa Sales Gama Tobias
1 and
Paulo Afonso
2,*
1
Institute of Technology, Federal University of Pará, Belém 66075-110, PA, Brazil
2
Centro ALGORITMI, Department of Production and Systems, University of Minho, 4804-533 Guimarães, Portugal
*
Author to whom correspondence should be addressed.
Appl. Sci. 2024, 14(17), 7534; https://doi.org/10.3390/app14177534
Submission received: 31 July 2024 / Revised: 14 August 2024 / Accepted: 20 August 2024 / Published: 26 August 2024
(This article belongs to the Special Issue Advances in Intelligent Logistics System and Supply Chain Management)

Abstract

:

Featured Application

Featured Application: The machine learning predictive model of fuel consumption proposed can help shipping companies toward an increasingly efficient and sustainable energy consumption with reduced operational and logistics costs, supporting a more competitive position in the market in compliance with environmental and safety regulatory standards.

Abstract

Water navigation is crucial for the movement of people and goods in many locations, including the Amazon region. It is essential for the flow of inputs and outputs, and for certain Amazon cities, boat access is the only option. Fuel consumption accounts for over 25% of a vessel’s total operational costs. Shipping companies are therefore seeking procedures and technologies to reduce energy consumption. This research aimed to develop a fuel consumption prediction model for vessels operating in the Amazon region. Machine learning techniques such as Decision Tree, Random Forest, Extra Tree, Gradient Boosting, Extreme Gradient Boosting, and CatBoost can be used for this purpose. The input variables were based on the main design characteristics of the vessels, such as length and draft. Through metrics like mean, median, and coefficient of determination (R2), six different algorithms were assessed. CatBoost was identified as the model with the best performance and suitability for the data. Indeed, it achieved an R2 value higher than 91% in predicting and optimizing fuel consumption for vessels operating in the Amazon and similar regions.

1. Introduction

Shipping is crucial for global economic development, with 90% of goods transported between ports [1,2]. Maritime trade is expected to grow from 10 billion tons in 2014 to 20 billion tons by 2030 [3]. In the Amazon, waterway transport of passengers and cargo is vital, with 10 million passengers and 5 million tons of cargo moved in 2017 [4]. The North region of Brazil, with its extensive waterway network, depends on these routes for commodity export to European, Asian, and North American markets [5]. For economically sustainable navigation in the Amazon, the knowledge of the buoyancy of water levels [6] and the hydrodynamic and energetic characteristics of rivers [7] presents great importance in estimating the fuel consumption of Amazonian vessels. The aging Brazilian fleet, with vessels often over 20 years old, impacts fuel consumption [8].
Shipping companies seek efficient, sustainable energy use to reduce costs and meet environmental standards such as IMO and SOLAS [9]. Fuel consumption accounts for two-thirds of voyage costs and over 25% of total operating costs [10]. In 2018, 900 million tons of CO2 were emitted, a figure expected to rise [11]. Efficient fuel management is critical and is influenced by factors such as speed, draft, displacement, weather, hull, and propeller roughness [12,13]. Studies have explored various methods to reduce fuel consumption and minimize environmental impacts. These methods include hull cleaning [14], trim adjustment [15], and the use of alternative energies like wind [16], solar [17,18], and wave energy [19], as well as fuel cells [20]. The studies also cover how speed reduction impacts fuel consumption [21,22]. However, there is limited research on fuel consumption in the Amazon region.
Characterizing relationships between parameters and fuel consumption is complex, making it challenging for companies to prioritize parameters for fuel reduction. Developing a model to reveal key factors affecting fuel consumption can optimize efficiency [23]. A robust modeling framework is needed to consider relevant parameters and their interdependencies [24]. Machine learning methods offer better results compared to traditional approaches in predictive and prescriptive analysis [23].
This research develops a predictive model for fuel consumption using vessel data from the Amazon region. It includes data collection, feature selection, and model validation. Techniques such as Decision Tree, Random Forest, Extra Tree, Gradient Boosting, Extreme Gradient Boosting, and CatBoost were used [25,26,27]. Performance was assessed using metrics like computational time. The most accurate model was validated across different vessel types and Amazon regions [28,29].
Wickramanayake and Bandara [30] compared Random Forest, Neural Networks, and Gradient Boosting for public bus fuel prediction in Sri Lanka, finding Random Forest methods to be the most accurate. Karagiannidis et al. [31] developed an ANN model for vessel fuel consumption, evaluated by RMSE and R2. Gkerekos et al. [32] compared regression algorithms, finding Extra Tree the best. Uyanik et al. [33] used various models, with Multiple Linear Regression providing the closest estimates. Stepec et al. [34] applied CatBoost for port stay estimation using historical data, evaluating performance with MAE and MSE. Abebe et al. [25] predicted cruising speed using multiple models, with Extra Tree performing best. Hu et al. [26] integrated Random Forest, XGBoost, and Multiple Linear Regression (MLR) for fuel consumption prediction, while Okumus et al. [35] used Linear Regression, Polynomial Regression, and XGBoost for engine power prediction.
The methodology in this research is applicable to fuel consumption models for vessels in the Amazon or similar regions.

2. Materials and Methods

The developed prediction model, which presented as output variable a regional stratigraphy of fuel consumption of vessels sailing in the Amazon region, was based on machine learning techniques, such as those presented by Wickramanayake and Bandara [30], Karagiannidis et al. [31], Gkerekos et al. [32], Uyanık et al. [33], Stepec et al. [34], Abebe et al. [25], Hu et al. [26], and Okumuş et al. [35] based on the design characteristics and operational performance of typical vessels operating in the Amazon.
The steps of the fuel prediction model construction [25,32] are presented, comprising data acquisition, the application of information processing techniques and the selection of the main parameters present in the database. The development and implementation of six models built from machine learning algorithms were addressed and consecutively evaluated through performance metrics that supported the choice of the model with the best predictive ability. The hyperparameter optimization method was applied with the aim of a model whose predictions were more assertive. The detailed flow of model building can be seen in the flow chart in Figure 1.

2.1. Data Acquisition

Data acquisition was important in terms of recognition and interpretation of the system [26]. In the research, the data acquisition step was based on the collection of necessary, sufficient data to characterize the variables in the development of the proposed predictor model, such as draft, mouth, length, etc. The “Study on the Characterization of the Supply and Demand of River Transportation of Passengers and Cargo in the Amazon Region-SCTPC” [4] served as a source of information and data collection necessary for the development of the model.
The SCTPC [4] was prepared by the School of Naval Engineering of the Universidade Federal do Pará (UFPA) in partnership with the Agência Nacional de Transporte Aquaviário (ANTAQ), with the purpose of knowing and dimensioning the demand of passengers and mixed (cargo and passengers) transported by the Amazon rivers. It also sought to update and verify the evolution of data on the longitudinal transport of passengers and cargo in mixed vessels that navigate in the region since 2013, the year in which the last study was conducted, in addition to deepening the diagnosis of the operational conditions of terminals and ports.

2.2. Database

The data analysis for developing the proposed model was based on information collected about vessels operating in the Amazon region. This information was derived from the Study on the Characterization of the Supply and Demand of River Transportation of Passengers and Cargo in the Amazon Region (SCTPC) [4]. The study was prepared by the School of Naval Engineering of the Universidade Federal do Pará (UFPA) in conjunction with the Agência Nacional de Transporte Aquaviário (ANTAQ).
The goal was to verify the evolution of data on the longitudinal transport of passengers and cargo in mixed vessels navigating the Amazon Hydrographic Region. This region includes rivers that connect the states of Pará (PA), Amapá (AP), Amazonas (AM), and Rondônia (RO), as shown in Figure 2.
The SCTPC [4] provided all the parameters collected from the vessels that composed the sample space of the research. These parameters were applied in all learning machine models. In Figure 3, one can observe the characterization of the physical, constructive, propulsive, operational, functional, and sustainability parameters of the vessels. Figure 3 presents the parameters used in the models.
The available data were initially composed of 30 parameters contained in the SCTPC, the main instrument of the data acquisition process, based on 1342 vessels operating in the Amazon in 2015 and 2017. Every vessel cataloged in SCTPC represented a record in the database, organized according to parameters regarding vessel characteristics and physical and constructive, propulsive, operational, functional, and sustainability aspects listed in the previous figure.
To improve model performance, it is essential to reduce the number of relevant attributes [36,37]. Therefore, a preliminary analysis was conducted to identify and select the most relevant features, resulting in the removal of duplicate or redundant ones. Duplicate attributes occur when identical information is stored in multiple attributes [37]. This analysis was carried out using the filter method for feature selection [38], which helps streamline the data by eliminating unnecessary attributes.
All attributes present in the database were analyzed, and only those related to vessel design characteristics, operational performance, and environmental conditions were kept—parameters considered intrinsically related to fuel consumption, as addressed by Gainza and Brinati [22] and Schiller [21]. The remaining 17 predictors, shown in Table 1, along with their respective acronyms and measurement units, were initially chosen as inputs for model building.
The 17 parameters selected from the 30 characteristics collected for each of the 1343 vessels through SCTPC were organized in a table, with the FOC as the target column. This resulted in the construction of a records matrix, as shown in Table 2, where the first ten records of the database are presented. In this pattern, the algorithm identifies that each row represents a vessel (a record), and each column highlights one of the characteristics presented previously in Table 1. These characteristics, whether numerical or categorical, are essential for the later development phases of the project.
The identification and removal of redundant attributes that, perhaps, still remained in the system after the data acquisition step was performed using attribute selection methods [33].

2.3. Data Processing

Data used to train the model that were inconsistent or incorrectly recorded were carefully treated and analyzed [33]. The SCTPC information collected from field surveys was prone to errors due to inaccuracies in recording vessel characteristics on forms. The data treatment phase was crucial because inaccuracies or missing information could negatively impact the model’s performance. Therefore, a data treatment step was implemented to identify, address, and remove such erroneous information.

2.3.1. Filling in Missing Data

To handle records with null values—those missing in the dataset but present in the measurement context—two techniques were applied to obtain consistent data: (a) replacing the null values with the attribute mean [39,40]; and (b) removing the records [41,42].
According to the application of Petersen et al. [39], the average of each attribute was calculated from the sum of the values of each record divided by the total number of records, as presented in Equation (1):
M e a n = 1 M n = 0 M x n
where M is the number of records used and x n is the value presented by the sample given the analyzed attribute.
Based on Kuhn et al.’s research [41], since the portion of unknown values was small compared to the large total amount of database records used to develop the model, the unknown values that could not be filled with the mean were removed from the database.

2.3.2. Transformation of Categorical Variables

Transforming categorical (nominal) variables into numeric variables allows for the application of learning algorithms to the data used for model development [43]. For better machine interpretation and improved performance, nominal values should be converted into numeric (binary) format.
Using the Coding Method, also known as the One-Hot Encoding Method [44], each categorical attribute (e.g., Type of Vessel and Hull Material) was transformed into new attribute columns. For each value in these categorical attributes, as listed in Table 3, a corresponding column was created, where a value of 1 was assigned to indicate the presence of that attribute in the record, while all other columns were set to 0. This method provides a numerical representation of nominal characteristics [45,46], ultimately increasing the total number of attributes to 24.

2.3.3. Removing the Outliers

Parametric detection of outliers—points that fall outside the expected curve—was performed using Mahalanobis Distance [47,48]. This method identifies records whose values are significantly different from those of 99% of the samples.
To better visualize and detect these divergent records, box-plot diagrams were used. As defined by Tukey et al. [49] and adapted by Kwak and Kim [42], box plots provide a graphical representation of data based on median and quartiles.
By using the median and quartile range, outliers could be identified as any data points falling outside the upper or lower fences, calculated from these measures [42,48]. Following Han et al. [50], 34 extreme data points were removed from the dataset, mainly corresponding to vessels with a high number of propellers, as this is not a typical pattern for the targeted region.

2.3.4. Standardization

The normalization process was employed because of the existing scale differences between the input predictors considered in the design. For this reason, the values of the numeric columns in the dataset were changed to use a common scale without distorting the differences in ranges or causing loss of information [50]. To this end, the Z-score normalization technique [32,51,52] was applied, in which the normalized value of a sample x was obtained by the quotient of the difference between its original value and the average of the considered records of the attribute by the standard deviation of all samples, as set forth in Equation (2):
Z i = x i μ σ
where μ is the average of the considered records, σ is the standard deviation of all samples, and x i is the value of each observed record.
The resulting z-scores were set over an unlimited range of negative and positive numbers. Unlike the normalized values, there was no predefined minimum and maximum.

2.4. Feature Selection

The Feature Selection Method [26] was used to select the minimum set of attributes originating from the database extracted from the SCTPC, aiming to achieve a desired performance criterion. Characteristics that had no relationship with the class variable were considered irrelevant, while attributes with a high correlation in function to the other variables were labeled as redundant since they contributed to a decrease in model performance [53].
The Jupyter Notebook programming environment was used to develop the Python script and use the machine learning libraries dedicated to attribute selection available on the server.
To determine the existing relationship between the predictors presented in Table 1, Pearson’s correlation coefficient (r) was calculated, defined through the covariance between two variables divided by the product of their standard deviations, as presented in Equation (3), having been applied by and by Pani [54], Brillante et al. [55], and Schober et al. [56]:
r = i = 1 n ( x i x ) ( y i y ) i = 1 n ( x i x _ ) 2 i = 1 n ( y i y _ ) 2
where n is the size of the sample bank; x i and y i are the individual values of the records indexed with i; and x _ = 1 n i = 1 n ( x i ) is the sample measure and analogously for y.
The application of the correlation coefficient allowed us to portray the strength of the linear association between two distinct parameters characteristic of the vessels through values ranging from −1 to +1 since it is a dimensionless index Uyanık et al. [33]. Consequently, it was assumed that:
  • The strength of the relationship between the variables could admit any value between −1 and +1, and the closer to one of the extremes, the stronger the correlation would be; it is further assumed that for a perfect linear relationship to occur, the correlation shown should be equal to −1 or +1;
  • When equal to zero, there is no linear relationship between the two variables under analysis;
  • A positive value of the correlation coefficient would determine the existence of a directly proportional relationship between two variables; that is, as one of them grows, the behavior of the curve of the other variable will also increase; on the other hand, for a negative coefficient, the attributes would be considered inversely proportional, which, in other words, means that as one attribute increases, the other decreases).
Once the coefficients pertinent to the linear relationships between pairs of attributes were obtained, to better identify the intensity of each of the correlations, a heat map was generated, combining warm colors for correlations close to +1 and cold colors as the correlation represented a value close to −1. Pearson’s correlation coefficient was also represented in the intersection between the columns and rows of the horizontal and vertical axes, where the predictors are exposed, as applied in the studies of Singh et al. [57] and Xu and Deng [58].

2.5. Model Building and Training

Through a classical machine learning approach employed by Izbicki and Santos [59], the database was divided into two sets: training and validation. In total, 1342 records characterized by 24 parameters were selected to compose the model’s input, from which two partitions were created: one for training, containing 90% of the dataset, and another, with the other 10% of the remaining samples, reserved exclusively for validation of the winning model through the hold-out technique, an additional step in which the chosen model must be able to predict random samples, previously unseen [60].
The K-fold Cross-Validation technique was applied to the training data set, having been divided into ten subsets of samples, from which seven sets were intended for training, while the rest were for testing, alternating among themselves until all subsets were used for both testing and training [61], i.e., the model was run k times iteratively. In each iteration of a combined hyperparameter configuration, various model performance results were obtained and calculated. The proposed distribution of data is presented in Figure 4.
The development of the model, in fact, began as the six CART-type algorithms chosen: Decision Tree (DT), Random Forest (RF), Extra Tree (ET), Gradient Boosting (GB), Extreme Gradient Boosting (XGBoost), and CatBoost were trained using Python programming from the scikit-learn library.

2.5.1. Decision Tree

In the proposed project, we used the Classification and Regression Tree (CART) method, one of the most common methods for decision tree-based regression methods. In a CART model, after choosing the optimal split point to obtain the best model fit defined through the Gini Criterion, the parameter space is split into two paths, a process executed recursively until the stopping rules are reached and the final prediction is obtained [62].
The available parameter set was then divided into a number of regions K, called R K and the model’s prediction value was obtained by using the average value of the record found in the K-nesia value region, that is, the last region. The average value of the K-region was found by developing the values in the previous regions. The nonlinear combination involving the regression vector is given by Equation (4), as expounded by Abebe et al. [25]:
y ^ i = m e a n ( y i | x i ϵ R k )
The value corresponding to a more concise prediction based on the observed data, y ^ i was achieved due to the minimization of the minimum square error, σ , resulting in a higher performance of the model. For this reason, the minimization of σ indicates the improvement of y ^ i defined by Equation (5) [61]:
σ = ( y i y ^ i ) 2

2.5.2. Assembly Method

The basic concept in using the Ensemble Method is the development of a predictive model formed from the integration of simple models to obtain a better-performing model [25]. Two techniques of the Ensemble Method were used in the proposed project: Boosting [23] and Bagging [61].
The basic idea behind the ensemble method is the derivation of a predictive model by combining several simpler models. The Bagging method uses samples with replacement from the original data set to train reduced variance models [61,63]. In contrast, each partition of the Augmentation Method uses the entire dataset, assigning higher weights to observations where previous models have underperformed [63].

Random Forest

The random forest algorithm proposed by Breiman [60] relied on the bagging technique to reduce variance by averaging many imprecise but approximately unbiased decision trees [64].
To build a Random Forest model, a series of independent Regressor Decision Trees (RDTs) were generated using the training database laid out. The model response was determined by averaging the individual results of the decision trees, as laid out by Equation (6):
y ^ i ( x ) = 1 M m , i = 1 M f m ( x i )
where M is the number of decision trees in the model (n_estimators).

Extra Trees

Similar to the Random Forest (RFs) algorithm, the Extra Tree (ET) method is based on the principle of developing a set of regression-type decision trees from a standard structure containing sequentially root, child and leaf nodes, built from the top to the bottom of the tree. However, for an Extra Tree model, the cut-off points selected for splitting the tree nodes are extremely random, and it does not apply to the subsampling of the training database—all training samples are used [65].
In a scikit-learn implementation, the hyperparameters were similar to those used in a Decision Tree, including the parameter for the number of trees in the forest. Usually, a larger number of trees trains the data better. However, adding too many trees can slow down the training process considerably, so a parametric search to find the optimal configuration was necessary.

Gradient Boosting (GB)

The Gradient Boosting (GB) model is based on the boosting method, which produces an effective predictive model from a set of weak regression models, usually using decision trees [66]. A new regressor is built in addition to the model at different stages, allowing for optimization of the loss functions. In developing a Gradient Boosting model, a set of trees uses M additive functions to estimate the output, according to Equation (7):
y i ^ ( x ) = m = 1 M f m ( x i ) , f m ζ
As presented in Equation (8), ζ denotes the domain of the function that includes all regression trees:
ζ = f ( x ) = w q ( x ) , w R T , q : R d T ;
where q denotes the structure of each tree that maps to the corresponding leaf index; T denotes the number of leaves in a tree. Each fm corresponds to an independent tree structure (q) and a leaf weight (w). Different from DTs, each regression tree contains a continuous score on each leaf, wj being the score of the respective leaf jth.

Extreme Gradient Boosting (XGBoost)

During the prediction process, the results of each tree were summed to obtain the final model results. The parameters of each tree ( f t ), which included the structure of the tree and the scores obtained by each leaf node, were determined. Using the additive training method, the results of a tree are added to the model at a given time. The predicted value ( y ^ i ( t ) ) obtained at step t could be used in the algorithm development process, according to Equation (9) [25]:
y ^ i ( t ) = m = 1 M f m ( x i ) = y ^ i ( t 1 ) + f t ( x i )
When setting the initial parameters of the model, each observation was predicted as the average of all observed response variables, determining an equal weight for all. The adjustment of the weights occurred throughout each iteration, where the more a prediction failed, the greater the weight of that observed data in that tree since the algorithm was forced to focus on this observation.
Consequently, the trees added in sequence were trained from the variations of the set of records not adequately “recognized” by the model. The stopping criterion regarding the creation of new trees was triggered when the maximum number of trees was reached or when the predictions were no longer contributing with considerable progress, i.e., the model’s ability to predict new records was no longer showing significant progress.

CatBoost

To effectively deal with the presence of categorical parameters, the CatBoost algorithm uses the Target Statistics method, similar to average encoding, in which the attribute y k i for iteration K is replaced by a numerical equivalent equal to the statistic of the target variable. The estimation of the expected value is conditional on the attribute, according to Hancock and Khoshgoftaar [67] and shown by Equation (10):
y ^ k i E ( y | y i = y K i )
For the transformation of the categorical variable into a numerical one, according to Equation (11), the mean target value is then determined through an estimator based on samples of the same category as y i corresponding to the sample of value K . In this way, the residual is smoothed by virtue of certain thorough learning, with a > 0 .
y ^ k i = j = 1 n l { y j i = y k i } . y j + a p j = 1 n l { y j i = y k i } + a
where the value is defined by the average of the target value over the sample, identified as a parameter that plays a function of the degree of regularization [68].

2.6. Hyperparameters Tuning

For the proposed project, referring to Bergstra and Bengio [69], Random Search was applied as a technique for hyperparameter optimization, in which the values of the hyperparameters are chosen randomly from a normal distribution given a specific given hyperparameter space [70]. Initially, a range of possible parameter bounds is set manually, and the algorithm searches for them for the predetermined number of iterations.
As applied by Bergstra et al. [69], when in a hyperparametric optimization problem, the Random Search method generates candidate values for each hyperparameter of the learning algorithm as a sample for this regression case by defining a density function. Thus, it consists of a sampling followed by the training and evaluation of the model using the sampled vector. These two tasks are cycled in a recursive manner until a stopping condition occurs, either by the maximum number of training runs or by the processing time.

2.7. Model Performance Evaluation

Cross-validation was utilized to partition the sample space into training and testing sets, with the subsets being alternated in each round. The performance of each model was evaluated based on its capacity to identify patterns and predict the target variable, considering the diversity of records in the database. The performance metrics chosen based on the most commonly used criteria and the goals of each metric were: Mean Absolute Error (MAE), Mean Squared Error (MSE), Root Mean Square Error (RMSE), and Coefficient of Determination (R2).

2.7.1. Mean Absolute Error (MAE)

The difference between the predicted value and the actual value through an arithmetic mean, as a function of the size of the prediction set, determines the Mean Absolute Error (MAE), as follows in Equation (12), explained by Pani [54], Kitsikoudis et al. [71], Toqué et al. [72,73], and Fan et al. [73].
M A E = 1 n j = 1 n | y j y ^ j |
in which y ^ is defined as the predicted value, y is determined as the actual value of the sample, and n is described as the number of times the difference between the terms was calculated.

2.7.2. Mean Squared Error (MSE)

By means of the Mean Square Error (MSE), the prediction quality measure was determined by comparing the value of the mean squared difference between the actual and the predicted value, as addressed by Equation (13) [26,28,74]:
M S E = 1 n j = 1 n ( y j y ^ j ) 2
where y is the actual value of the sample; y ^ is the value predicted by the model; and n is the number of times the difference between the terms was calculated.

2.7.3. Root Mean Square Error (RMSE)

To evaluate and compare the prediction errors of different models applied to a particular dataset, the Mean Squared Error (MSE) was employed in the proposed project [40,75,76], as presented by Equation (14):
R M S E = i = 1 n ( X 0 X m ) 2 n
where X 0 represents the sample values and X m represents the values predicted by the model.

2.7.4. Coefficient of Determination (R2)

The coefficient of determination was based on two main parameters [25]:
S S r e s is assumed as the sum of squares of the difference between the observed and predicted values, as shown in Equation (15), responsible for quantifying how far the predictions generated by the model were from the original records;
S S r e s = Σ y i y ^ i 2
where y i represents each original record and y ^ i is the value predicted by the model.
S S t o t is defined by Equation (16) as the sum of the squares of the difference between the observed values and the average of the input samples, whose result showed the deviation of the original data from the average value of all the records.
S S t o t = Σ y i y _ 2
where y i represents each original record, and y _ is the average of the original records.
The difference between the two factors demonstrated how close the data predicted by the regressor model were to the average model precisely because when such difference was divided by S S t o t , it was possible to find the Determination Coefficient, R2, as shown in Equation (17), which is an indicator of the representativeness of the model’s good adequacy [77].
R 2 = S S t o t S S r e s     R 2 = 1 S S r e s S S t o t

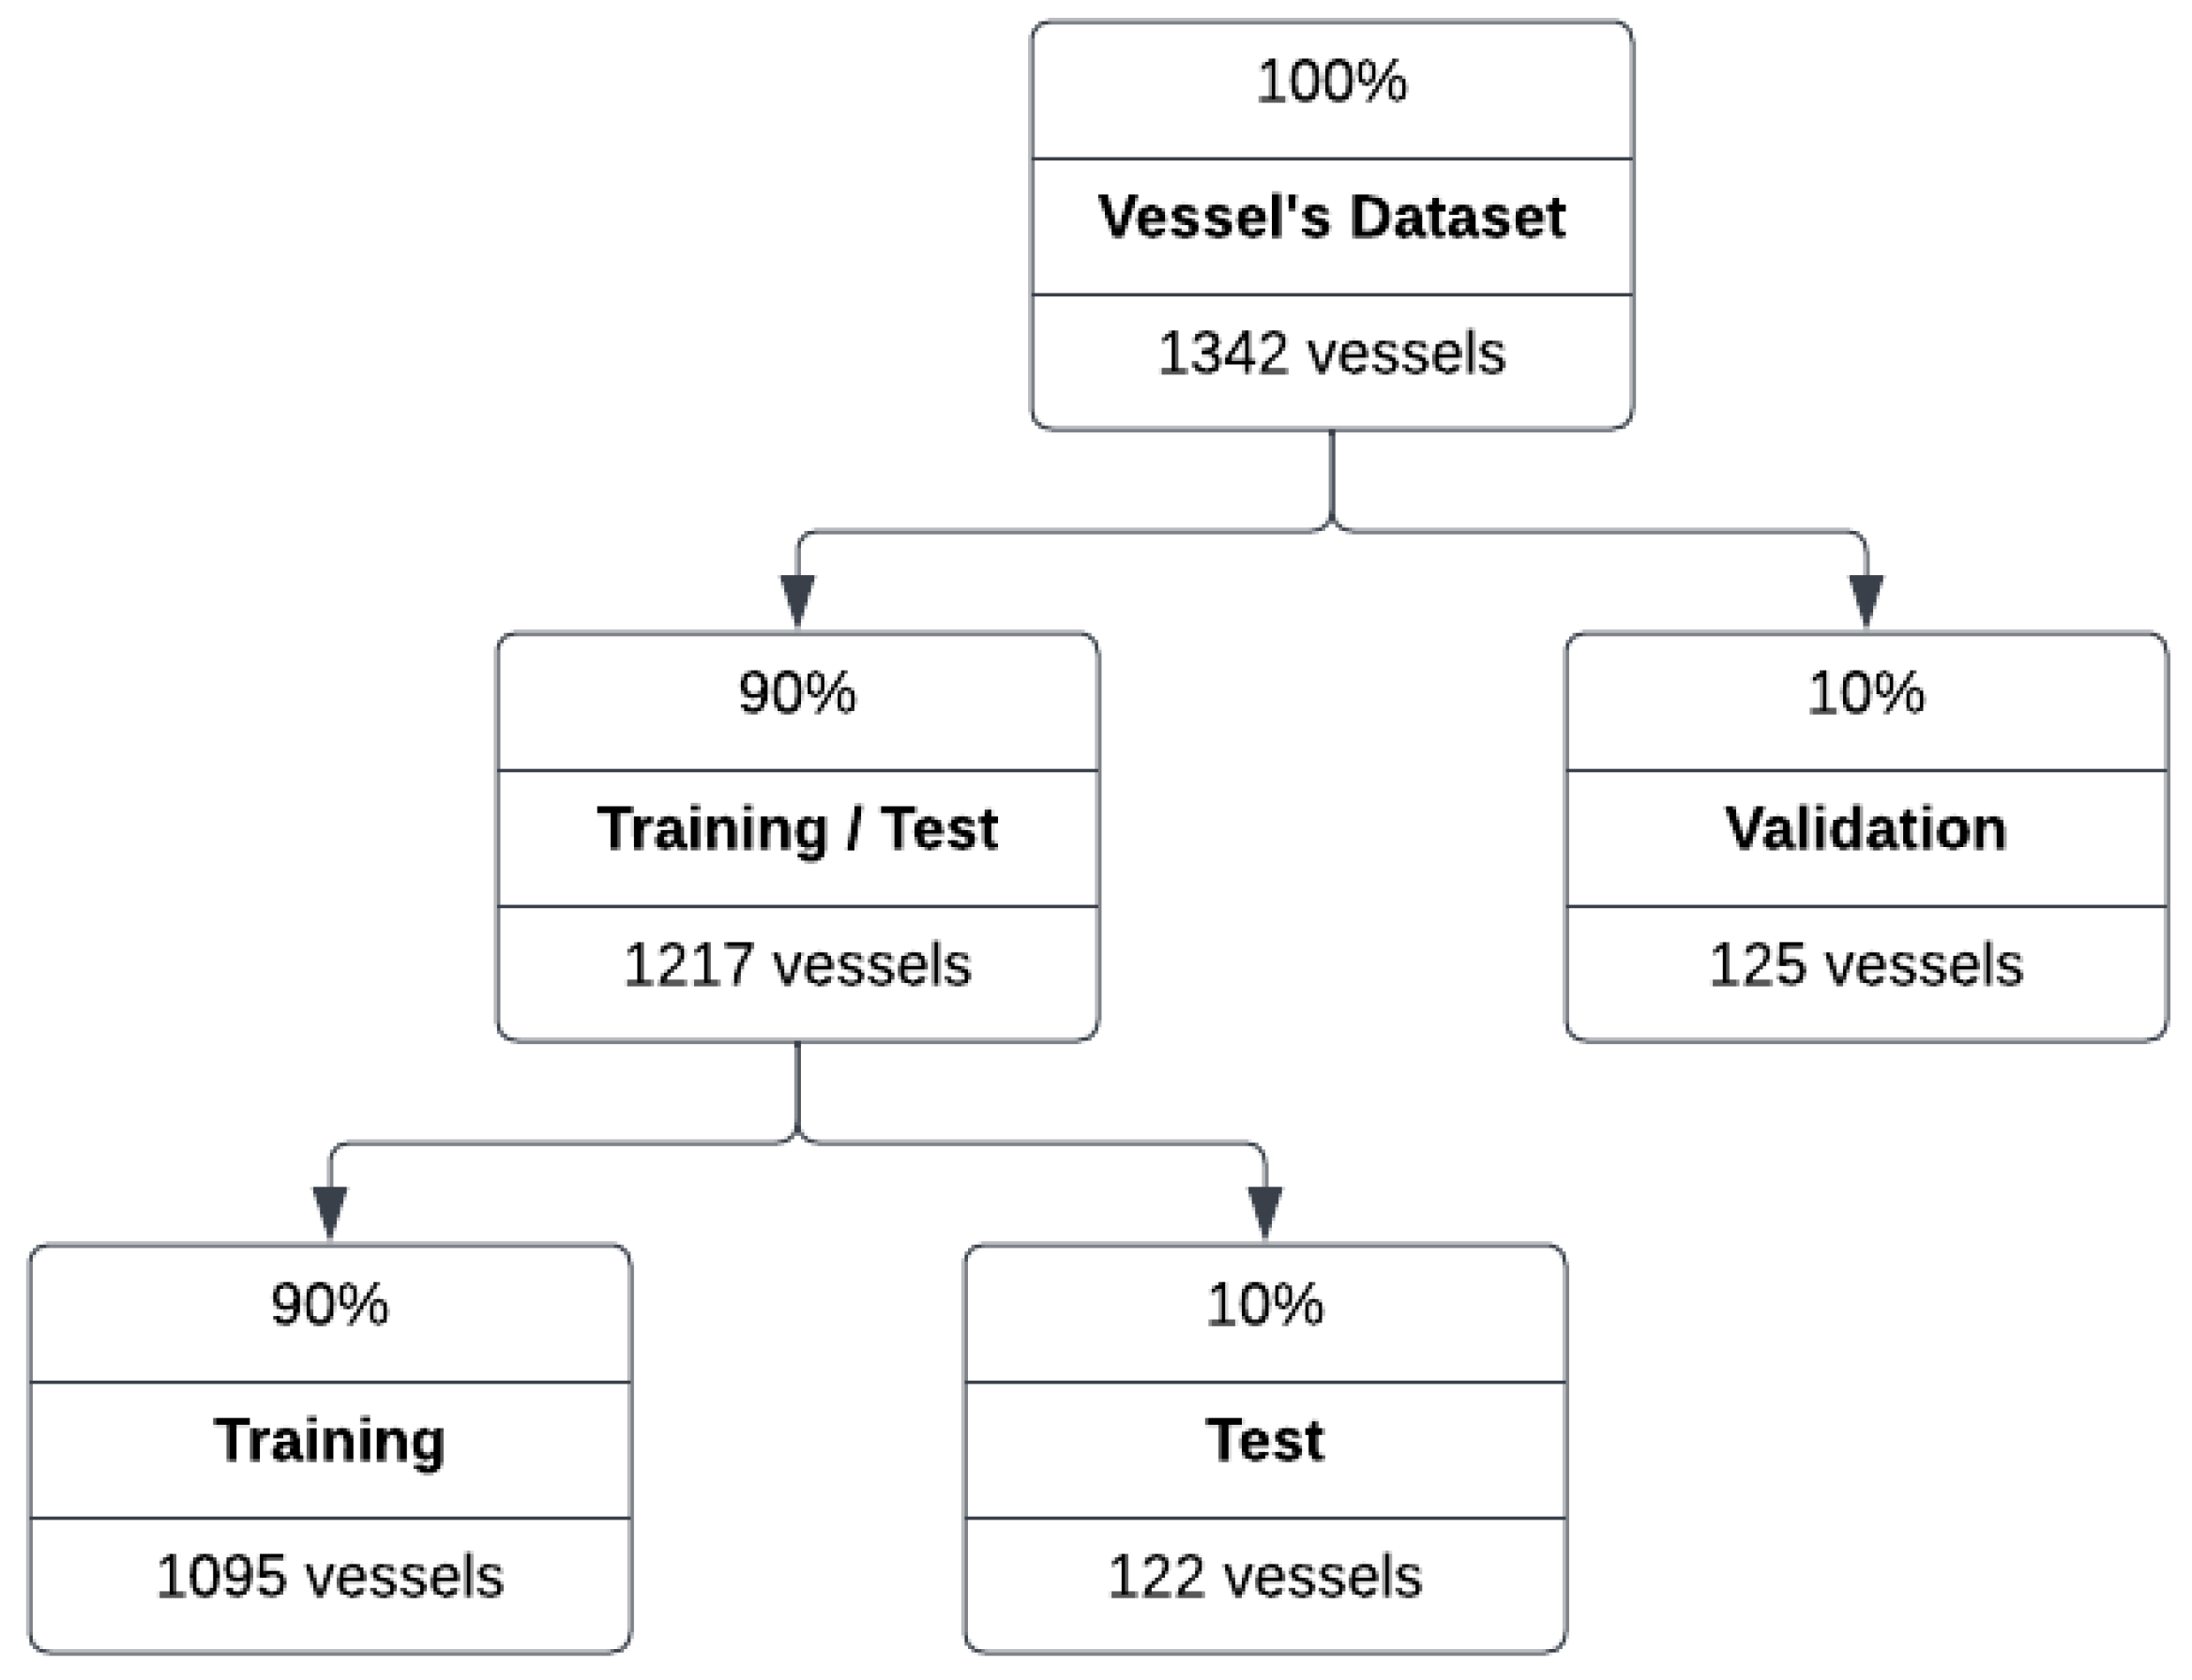
2.8. Model Validation

To mitigate the overfitting problem generated during the training and testing phases of the model, Hold-out Validation [78] was adopted. The data were initially separated into three non-overlapping parts for training, testing (hold-out), and final validation [79]. A total of 852 vessels were selected for training and 365 for the test stage. Another 125 vessels remained for the additional validation step via the Hold-Out Method, exclusive to the best-performing model still in the model building and training phase.
Retention validation can have different percentages of data being retained for testing, from 20% retention validation or up to 10% hold-out validation [79]. The records belonging to each partition were chosen in a random manner, and the database was divided without an evaluative criterion for doing so, keeping in mind the expected generalizability of the chosen model [27]. Different approximations of generalization performance can lead to different test performances [80].

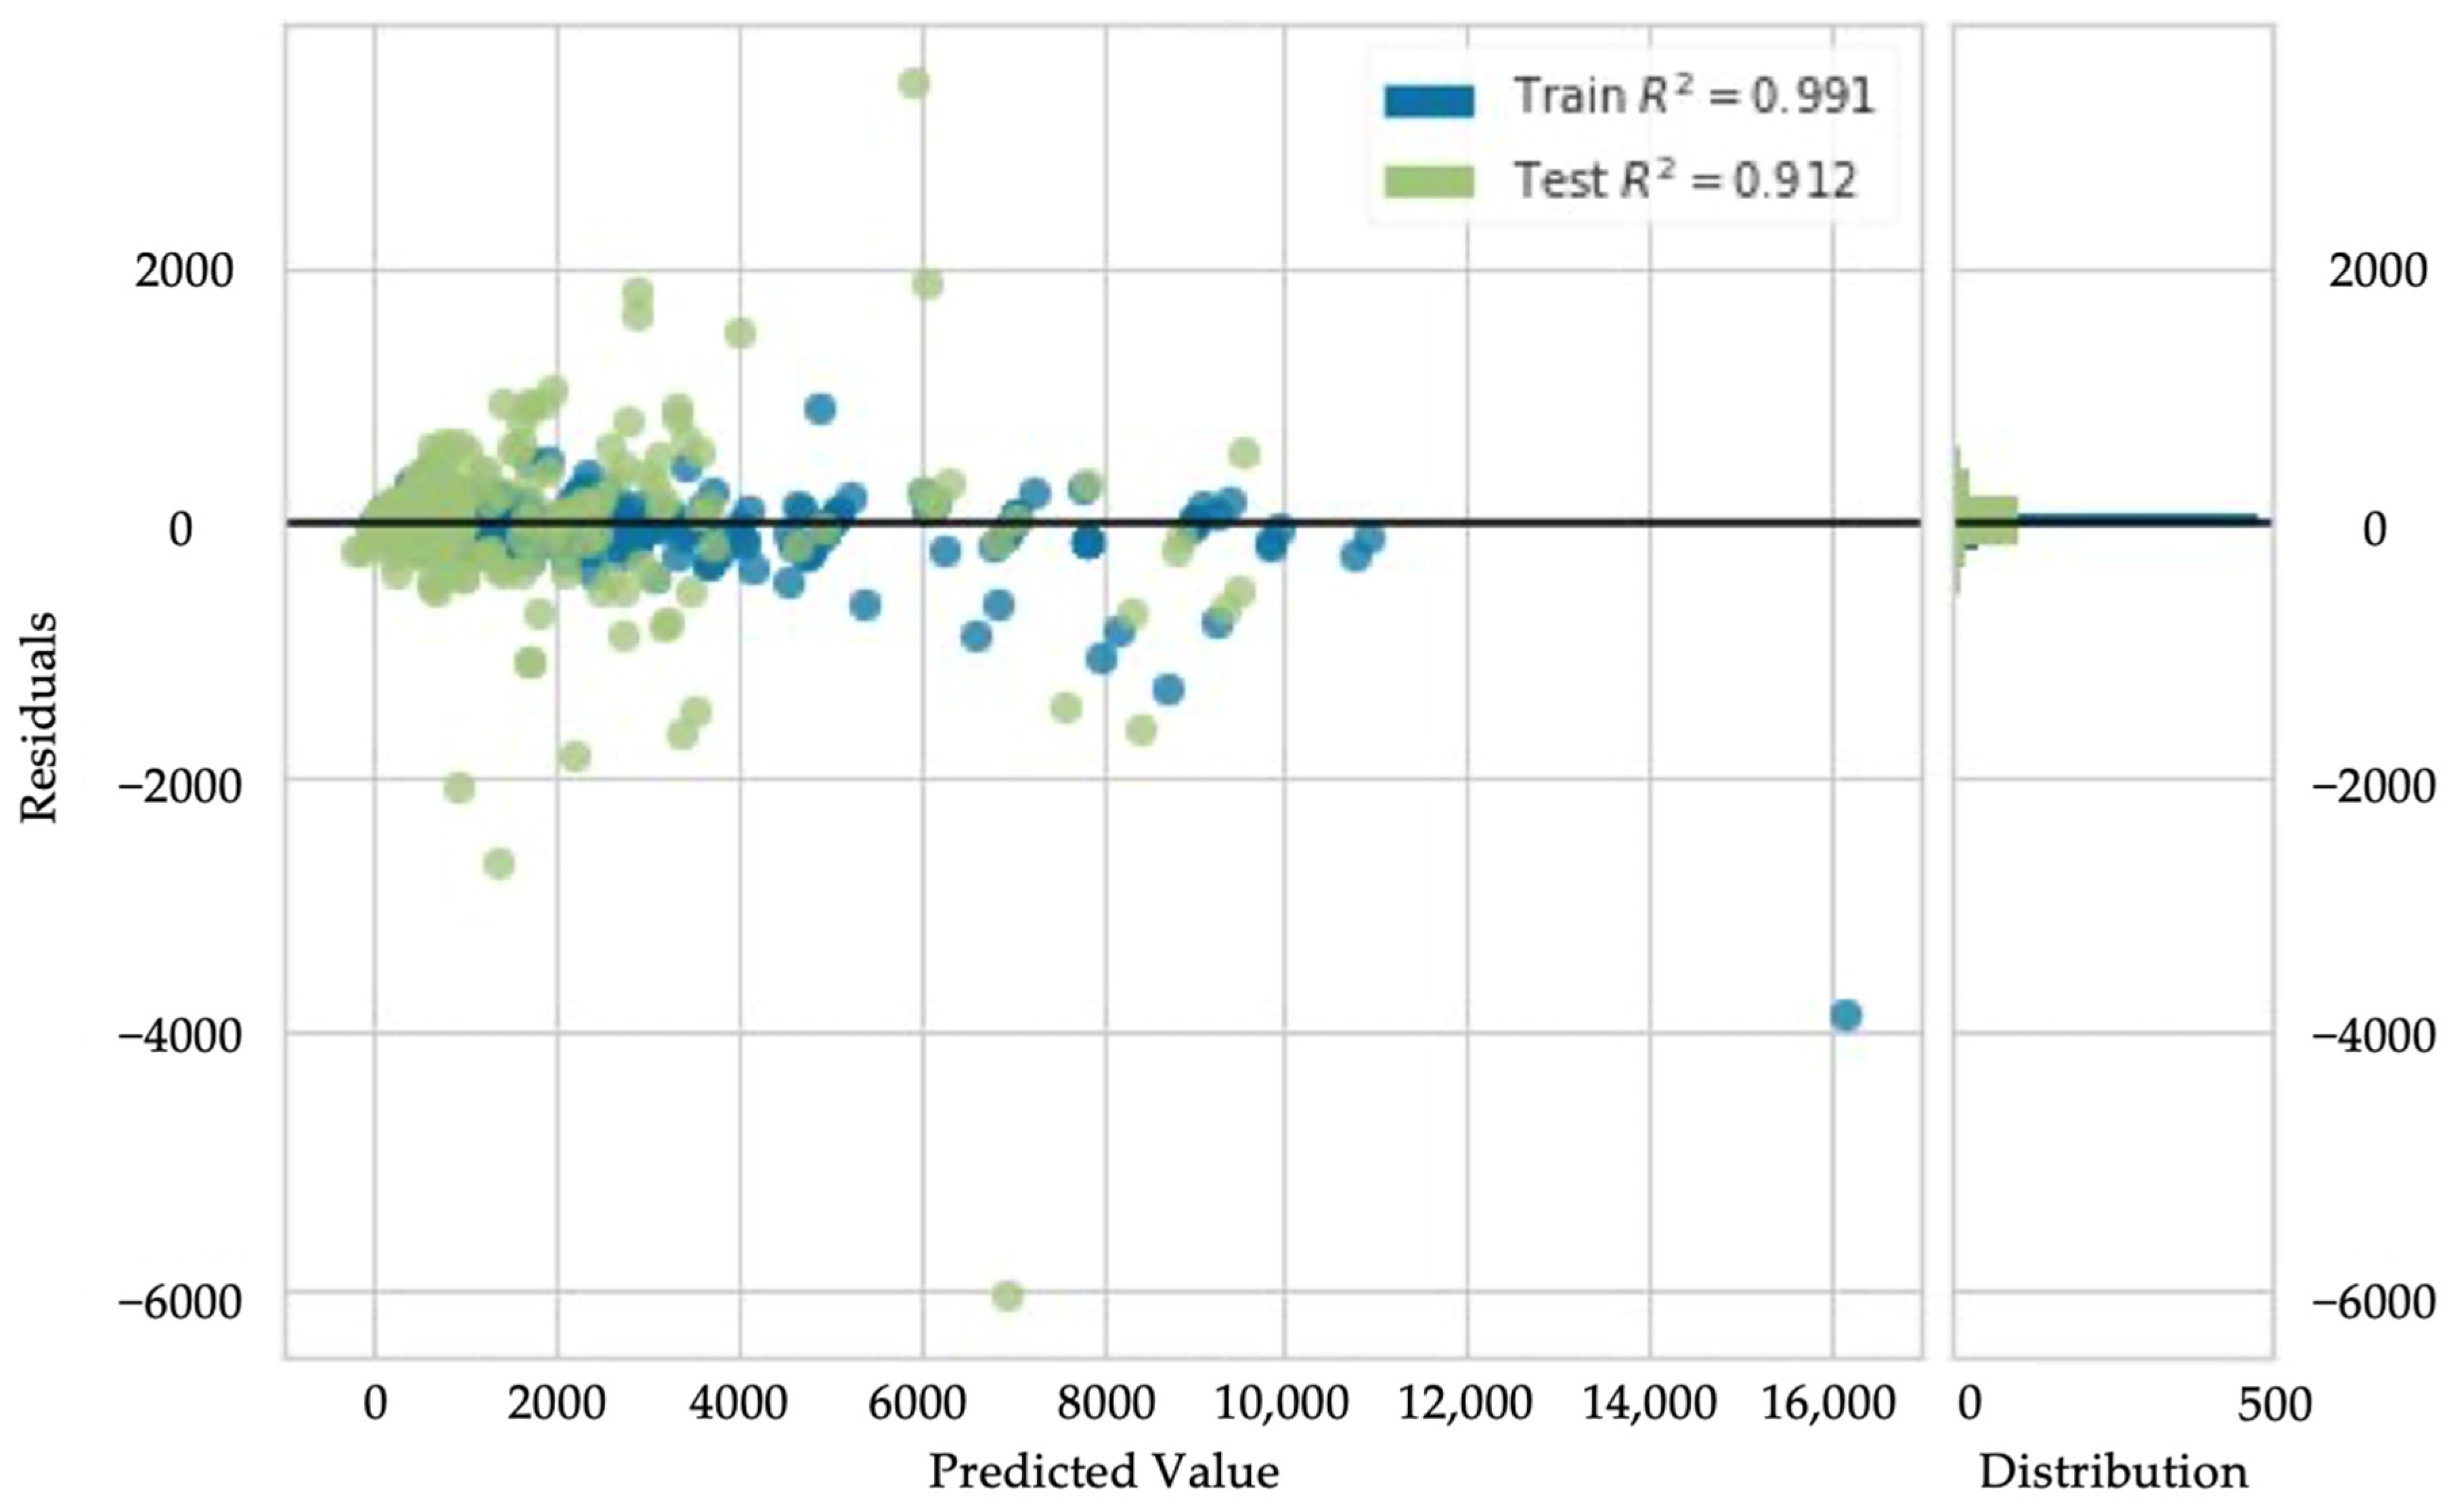
3. Analysis of Results

The number of input variables was reduced from 30 to 17 main parameters and one target variable only, fuel consumption, as model output. The statistical results, such as mean, median, minimum and maximum, denoting the database records concerning the numerical variables after the preprocessing phase, can be seen in Table 4.
For validation of the proposed algorithms—Decision Tree, Random Forest, Extra Tree, Gradient Boosting, Extreme Gradient Boosting, and CatBoost—a regression analysis was developed by partitioning the database of surveyed vessels into plots for training, testing and validation in the proportion of 70%, 20%, and 10%, respectively, of the total contingent of records.
For the Feature Selection step, as advocated by the works developed by Abebe et al. [25] and Uyanık et al. [33], due to the need to know the existing relationship between the input and target variables of the model, it was decided to apply the Pearson Correlation Method.
The correlation matrix between the parameters is shown in Figure 5, whose values range from −1 to +1 between light and dark shades, demonstrating the affinity between such variables: the greater the dependence between two variables, the closer to +1 will be the term contained in the intersection between both, besides assuming a lighter shade color, a factor that may even represent redundancy between variables. The input parameters of the model are identified on the x and y axes, while the main diagonal presents a spread of the relationships between the parameters in which, whether in the triangle below or above the main diagonal, the variables and relationships do not change [81].
For the operational parameters—travel time, distance and speed—the correlation coefficients obtained were +0.85, +0.78, and −0.21. The longer a vessel is sailing, consequently, the greater amount of oil will be demanded for combustion, impacting the volume of fuel consumed. The same premise applied to trips over long distances: trips with longer itineraries tend to consume more fuel than if compared to fast trips.
Speed, in turn, presented the strongest negative correlation of all the predictors surveyed. The higher the cruising speed of the vessel, the lower its fuel consumption since the travel time will be shorter.
Taking into account only the dimensional attributes of the collected records, the length (+0.58) stood out with the highest correlation with fuel consumption, demonstrating that the larger the vessel in its longitudinal direction, the greater the tendency of the vessel to consume a considerable volume of fuel. The other dimensional and physical attributes, such as breadth (+0.56), draft (+0.55) and depth (+0.42), presented the same behavior, whose relation is directly proportional in function of the fuel consumption, but with less correlative intensity when compared to the length. For the designer, it is extremely important to know the physical dimension of construction that will contribute to high fuel consumption since, opting for cost optimization, the length should be the first parameter to be reviewed.
Since the drag coefficient and frictional resistance are functions dependent on the size of the ship, the longer the ship, the larger the contact area with respect to the fluid; this is an intuitive finding and is proven by the intrinsic correlation of the ships operating in the Amazon region.
The inversely proportional correlation between wooden boats (−0.17) and fuel consumption becomes evident in (Figure 4). In a scenario where two boats have similar dimensions and identical operational conditions, but one is built in marine steel and the other in wood, the former will present a higher fuel consumption than the latter. In other words, boats made of marine steel (+0.42) tend to have a higher fuel consumption volume when compared to boats made of aluminum (+0.19), fiber (−0.074), and wood (−0.17). In contrast, from an economic point of view, boats designed with wooden hulls were more advantageous because of their lower fuel consumption.
Hulls made of marine steel showed the most significant correlation with fuel consumption, about +0.42. The more pronounced roughness of the hull directly impacts the coefficient of friction. In addition, most of these vessels carry a high volume of cargo, requiring materials with greater strength and durability. Consequently, larger and larger combustion engines are required to sustain the propulsive power necessary to overcome the weight and the difficulty of displacement of the vessel.
From the perspective of propulsive parameters, the number of generators showed the highest correlation (+0.39), followed by engine power (+0.31) and the number of thrusters (+0.28). It is understood that larger vessels adopt a redundant number of generators for safety factors: in the shutdown or malfunction of one generator, a second one should immediately be put on standby. Since the auxiliary engines (generators) are responsible for providing electrical power for the operation of the command and navigation equipment, the boat would be adrift or extremely susceptible to a collision with another ship in the event of a blackout.
The engine power determines the carrying capacity and/or speed developed by the vessel. The greater the weight and dimensions or speed a vessel performs, the greater the power required to move it. Considering the performance curve of the vessel, fuel consumption will tend to increase as well. The number of thrusters, in turn, showed similar behavior: to achieve the necessary force for displacement or glide of the boat and to preserve the life of the engines, a greater number of thrusters is required.
Ferry boat type vessels, intrinsic to the Amazon region on account of their large dimensions and cargo capacity used, including for transporting cars along with passengers, showed the highest correlation, +0.19, as to the premise of vessel types, followed by passenger and general cargo transport vessels (+0.15), flat (−0.09), passenger transport (−0.16), and speedboat (−0.19). Comparing the two extremes, it is understood that the higher the cargo capacity required, for example, for a ferry boat, the higher the fuel consumption, while the higher the speed performed by a speedboat, the lower the fuel consumption since the duration of the trip will be reduced.
It is possible to infer, therefore, that the length of the trip is the attribute that most influences fuel consumption, followed by the use of wood as a hull, and thirdly, the length of the vessel. Thus, a long-distance trip or a vessel built of wood or of great length are factors that will certainly cause greater fuel consumption by the vessel, while the reverse is also true.
In order to optimize the hyperparameters of the model, the Grid Search Method was adopted, as advocated by Stepec et al. [34] and Zhang et al. [27]. The values that best fit the model and provide greater efficiency are achieved through a step-by-step increment, that is, through an iterative feature in which the machine changes the hyperparameters until the stopping criterion is reached when the model is no longer capable of presenting more assertive predictions [25].
To define the winning model, which obtained the best performance in predicting in a more satisfactory way the vessels’ fuel consumption during the training stage, the performance metrics Mean Absolute Error (MAE), Mean Square Error (MSE), Root Mean Square Error (RMSE), Coefficient of Determination (R2), and Computational Processing Time (CPT) were evaluated, as proposed by Abebe et al. [25] in their study. Through the Cross-Validation Method applied by Gkerekos et al. [32], each model participated in nine training rounds and one test round, and the performance was evaluated from the average of these ten rounds. The performances of each model are presented in Table 5.
The model with the highest performance score was CatBoost, achieving 0.852. This was due to its unique technique for handling categorical variables, its robustness to outliers, and its advantages when dealing with tabular data, aligning with the approach applied by Stepec et al. [34]. In second, third and fourth places, Extreme Gradient Boosting [26], Random Forest [30], and Gradient Boosting [33], whose Coefficient of Determination (R2) values were 0.797, 0.790 and 0.787, respectively. The last positions were presented: Extra Tree [32] with 0.751 and Decision Tree [25] with 0.669; the latter had the lowest R2 among the six models considered.
For the performance parameters MSE and RMSE, employed by Ahmad et al. [82], it remains the same performance order of the models generated in the function of the determination coefficient (R2) in which the predictions made by CatBoost were the most assertive and, therefore, presented lower MSE and RMSE when compared to the other models. On the other hand, the evaluation of the MAE shows that CatBoost presented the lowest error (348.48), followed by Extra Tree (352.67), Random Forest (387.08), Gradient Boosting (406.33), Extreme Gradient Boosting (409.23), and Decision Tree (433.02). The MAE and MSE values have the same units as the measured variables [83].
From the point of view related to computational time, as done by Abebe et al. [25], the Decision Tree stood out as the fastest one to process the data and reach a result, even if, as seen, presenting a higher error and, consequently, divergent predictions from the observed data. CatBoost, in turn, due to its complexity in working with categorical records, presented the longest processing time, about 3.80 s. In the subsequent positions, emphasis is given to the Extreme Gradient Boosting and Random Forest models that obtained an excellent performance in the predictions, although they also spent a longer processing time.
CatBoost was chosen as the winning model due to satisfactory performance evaluations for data processing and target variable prediction. Hyperparameter adjustment was performed once again with the goal of making the model even more effective, refining its treatment of residuals and, consequently, achieving a higher R2, according to Okumuş et al. [35].
The hyperparameters found via application of the Random Search Method [27,34] generated final values that can be checked in Table 6, which ensure the generated model a more effective predictive performance among the sets of hyperparameters tested.
The Table 7 shows the Mean Absolute Error (MAE), Mean Square Error (MSE), Root Mean Square Error (RMSE), and Coefficient of Determination (R2); however, based only on the results presented by CatBoost after the final hyperparameter optimization step. By applying the Cross-Validation Method [32], a given row exposes the results obtained in one round, in which a part of the data was removed from the set and put back in the subsequent round. It was aimed to reduce model bias and avoid overfitting the model relative to the training and test data.
The hyperparameter optimization performed caused the CatBoost model performance metrics to improve, increasing the Coefficient of Determination (R2) by +1.5% and varying the others: MAE by −5.91%, MSE by −7.01% and RMSE by −4.97%.
Emphasizing the Coefficient of Determination (R2), under the guidance of Chicco et al. [84], round 9 presented the best performance, something around 0.937. Accordingly, rounds 8 and 1, 0.932 and 0.931, respectively, ranked second and third, considered high values of predicted values fitting the actual values. The lowest results, in turn, occurred in rounds 3 and 5, where the R2 achieved were 0.693 and 0.788.
The residual analysis of the model played a crucial role in verifying the performance of the regression model in a generalized way, as advocated by Okumus et al. [35], given that the residuals represent the difference between the values estimated by the model and the actual observed values. Considering the adverse characteristics contained in the database, it is clear from Figure 6 that the model presented divergent predictions from the actual observed data throughout the training and testing phases, generating residuals that allowed the model to adjust the next predictions from these residuals, increasing its final performance.
The distribution of the records in Figure 6 is characterized as a function of the prediction value on the x-axis by the residual error on the y-axis. The smaller the residual error, the more accurate the estimation generated by the model. The blue points refer to the training phase, while the green points refer to the testing phase.
It is inferred that the model performed very well during the training phase, given the concentration of records around the line positioned at the origin and the optimal Coefficient of Determination (R2) equal to 0.991. However, it is possible to notice some outliers, predictions far from the actual value observed, that generate high residuals. The same happens when considering only the predictions during the test phase in which there is a higher number of residuals, impacting a lower Coefficient of Determination (R2), 0.912, indicating a loss of model performance; however, within normality, since they are data never before seen by the model and caused by means of the Cross Validation Method, avoiding model bias [32].
It can also be observed from Figure 6 that the model had difficulty in predicting records from the range of 4000 L, having generated, even in the test phase, three of the highest residuals. As a consequence, this data can certainly influence the increase in metrics such as RMSE, which penalizes large errors between prediction and observed reality [84].
The distribution of the records presented in Figure 7 was made dependent on each actual value of the observed record (x-axis) and the estimates provided by the model during the training phase (y-axis). The black dashed line represents a linear regression best suited to estimate the correlation between the predicted and measured value of the target variable. The dashed line in gray, called identity, outlines a function where y = x, forming 45 degrees, just to highlight whether the model is over or underestimated for the values analyzed [35].
The accumulation of predictions along the dashed lines for the range near the origin determines that the model has an assertive capacity for vessels that consume more than 2000 L. It is clear from Figure 7 that after this range, a larger number of outliers occur, that is, predictions with high residuals. This is caused because:
The share of vessels consuming more than 2000 L is small compared to the rest of the database (about 29.3% of the amount), leaving the model more susceptible to errors in the case of vessels with discrepant dimensions than those contained in large numbers;
These outliers may be an indication of fuel consumption beyond what is normal for vessels of this size, evidencing fraudulent operational behavior.
For the final validation of the model developed through the hold-out validation method, records were randomly chosen and separated from the initial database to assess the performance of the model against the new input data. A total of 125 vessels were separated, 5 of which are listed in Table 8. The numbers in the first row indicate the model’s input predictors as well as the target variable.
Faced with the new data, Table 9 shows the main performance parameters. The Coefficient of Determination reached was 0.910, thus demonstrating its high performance even for records never seen before.

4. Conclusions

This research comprised the development and application of machine learning techniques to estimate the fuel consumption of vessels used in the Amazon based on physical, constructive, propulsive, and operational attributes. It was found that the use of machine learning techniques to predict fuel consumption is a very effective approach. The models’ predictions aligned well with the observed fuel consumption levels, indicating a satisfactory fit. The application of these models is of paramount importance since a large part of the vessels that made up the database were built in the Amazon without a technical and scientific background. In the Amazon, boat builders prioritize empirical knowledge and the replication of previous projects full of uncertainties and risks.
Machine learning algorithms applied to the central problem of the research played an important role in the discovery of correlated properties, bringing scientific background and cost reduction to companies operating in inland navigation in the Amazon. In this research, the CatBoost algorithm was chosen for its high performance in predicting fuel consumption in Amazonian vessels. The following conclusions could be observed with the application of the models: the methodology applied in this study can serve essentially any vessel whose operational parameters are similar to those employed in the vessels of this study; the predictive capability of the models can be enhanced by increasing the amount of data; and the residual values referring to the predictions of vessels with high fuel consumption influenced the values of the performance metrics QME and EQM. As for future research, the goal may be to produce a stratification according to the navigation regimes of vessels operating in the Amazon region and to develop specific models for predicting fuel consumption for each of these regimes.

Author Contributions

Conceptualization, R.F.M. and N.M.d.F.; methodology, R.F.M. and N.M.d.F.; validation, R.F.M. and N.M.d.F.; formal analysis, R.F.M., N.M.d.F. and P.A.; investigation, R.F.M.; writing—original draft preparation, R.F.M., N.M.d.F., M.S.G.T. and P.A.; writing—review and editing, R.F.M., M.S.G.T. and P.A. All authors have read and agreed to the published version of the manuscript.

Funding

This research received no external funding.

Institutional Review Board Statement

Not applicable.

Informed Consent Statement

Not applicable.

Data Availability Statement

The original data presented in the study are openly available at https://github.com/rhuanfracalossi/Article (accessed on 14 August 2024).

Acknowledgments

The authors acknowledge the contributions made by the research team, the Naval Construction Technology Research Group, from the Institute of Technology—Federal University of Pará and ALGORITMI Research Center from the University of Minho, and all who supported this research, particularly the availability of software for data generation, and several contributions to technical discussions of the results.

Conflicts of Interest

The authors declare no conflicts of interest.

References

  1. Kee, K.-K.; Simon, B.-Y.L.; Renco, K.-H.Y. Prediction of Ship Fuel Consumption and Speed Curve by Using Statistical Method. J. Comput. Sci. Comput. Math 2018, 8, 19–24. [Google Scholar] [CrossRef]
  2. Wu, Z.; Xia, X. Tariff-Driven Demand Side Management of Green Ship. Sol. Energy 2018, 170, 991–1000. [Google Scholar] [CrossRef]
  3. IMO. Third IMO GHG Study; International Maritime Organization: London, UK, 2014. [Google Scholar]
  4. Figueiredo, N.; Moraes, H.; Loureiro, E.; Lameira, P. Caracterização Da Oferta e Da Demanda Do Transporte Fluvial de Passageiros e Cargas Na Região Amazônica; Agência Nacional de Transportes Aquaviários(ANTAQ); Universidade Federal do Pará—UFPA: Belém, Brazil, 2018. [Google Scholar]
  5. da Costa, D.S.; de Assis, M.V.G.S.; de Figueiredo, N.M.; de Moraes, H.B.; Ferreira, R.C.B. The Efficiency of Container Terminals in the Northern Region of Brazil. Util. Policy 2021, 72, 101278. [Google Scholar] [CrossRef]
  6. De Figueiredo, N.M.; Blanco, C.J.C. Water Level Forecasting and Navigability Conditions of the Tapajós River-Amazon-Brazil. La Houille Blanche 2016, 102, 53–64. [Google Scholar] [CrossRef]
  7. Da Silva Holanda, P.; Blanco, C.J.C.; Mesquita, A.L.A.; Junior, A.C.P.B.; de Figueiredo, N.M.; Macêdo, E.N.; Secretan, Y. Assessment of Hydrokinetic Energy Resources Downstream of Hydropower Plants. Renew. Energy 2017, 101, 1203–1214. [Google Scholar] [CrossRef]
  8. Benjamin, C.; Figueiredo, N. The Ship Recycling Market in Brazil-The Amazon Potential. J. Environ. Manag. 2020, 253, 109540. [Google Scholar] [CrossRef]
  9. Beşikçi, E.B.; Arslan, O.; Turan, O.; Ölçer, A.I. An Artificial Neural Network Based Decision Support System for Energy Efficient Ship Operations. Comput. Oper. Res. 2016, 66, 393–401. [Google Scholar] [CrossRef]
  10. Stopford, M. Maritime Economics 3e; Routledge: New York, NY, USA, 2009. [Google Scholar]
  11. Buhaug, Ø.; Corbett, J.; Endresen, Ø.; Eyring, V.; Faber, J.; Hanayama, S.; Lee, D.S.; Lee, D.; Lindstad, H.; Markowska, A.; et al. Second IMO GHG Study 2009; International Maritime Organization: London, UK, 2009. [Google Scholar]
  12. Eide, M.S.; Longva, T.; Hoffmann, P.; Endresen, Ø.; Dalsøren, S.B. Future Cost Scenarios for Reduction of Ship CO2 Emissions. Marit. Policy Manag. 2011, 38, 11–37. [Google Scholar] [CrossRef]
  13. Hochkirch, K.; Heimann, J.; Bertram, V. Hull Optimization for Operational Profile–the next Game Level. In Proceedings of the MARINE V: Proceedings of the V International Conference on Computational Methods in Marine Engineering, Hamburg, Germany, 29–31 May 2013; CIMNE: Barcelona, Spain, 2013; pp. 81–88. [Google Scholar]
  14. Adland, R.; Cariou, P.; Jia, H.; Wolff, F.-C. The Energy Efficiency Effects of Periodic Ship Hull Cleaning. J. Clean. Prod. 2018, 178, 1–13. [Google Scholar] [CrossRef]
  15. Islam, H.; Soares, C.G. Effect of Trim on Container Ship Resistance at Different Ship Speeds and Drafts. Ocean Eng. 2019, 183, 106–115. [Google Scholar] [CrossRef]
  16. Ionescu, R.D.; Szava, I.; Vlase, S.; Ivanoiu, M.; Munteanu, R. Innovative Solutions for Portable Wind Turbines, Used on Ships. Procedia Technol. 2015, 19, 722–729. [Google Scholar] [CrossRef]
  17. Wang, H.; Oguz, E.; Jeong, B.; Zhou, P. Life Cycle and Economic Assessment of a Solar Panel Array Applied to a Short Route Ferry. J. Clean. Prod. 2019, 219, 471–484. [Google Scholar] [CrossRef]
  18. Yu, W.; Zhou, P.; Wang, H. Evaluation on the Energy Efficiency and Emissions Reduction of a Short-Route Hybrid Sightseeing Ship. Ocean Eng. 2018, 162, 34–42. [Google Scholar] [CrossRef]
  19. Alujević, N.; Ćatipović, I.; Malenica, Š.; Senjanović, I.; Vladimir, N. Ship Roll Control and Energy Harvesting Using a U-Tube Anti-Roll Tank. In Proceedings of the International Conference on Noise and Vibration Engineering (ISMA2018), Leuven, Belgium, 17–19 September 2018; pp. 1621–1634. [Google Scholar]
  20. Shih, N.-C.; Weng, B.-J.; Lee, J.-Y.; Hsiao, Y.-C. Development of a 20 kW Generic Hybrid Fuel Cell Power System for Small Ships and Underwater Vehicles. Int. J. Hydrogen Energy 2014, 39, 13894–13901. [Google Scholar] [CrossRef]
  21. Schiller, R.A. Análise da Eficiência Energética em Navios Mercantes e Estudo de Caso do Consumo de Combustível em Navio Aliviador do Tipo Suezmax. Ph.D. Thesis, Universidade de São Paulo, São Paulo, Brazil, 2016. Available online: https://www.teses.usp.br/teses/disponiveis/3/3135/tde-03032017-135911/publico/RodrigoAchillesSchillerOrig16 (accessed on 15 February 2021).
  22. Gainza, J.A.N.; Brinati, H.L. Análise da Operação de Navios Porta Contêineres em Velocidade Reduzida. Inst. Pan-Am. Eng. Nav. 2010, 1–15. [Google Scholar]
  23. Barua, L.; Zou, B.; Zhou, Y. Machine Learning for International Freight Transportation Management: A Comprehensive Review. Res. Transp. Bus. Manag. 2020, 34, 100453. [Google Scholar] [CrossRef]
  24. Cipollini, F.; Oneto, L.; Coraddu, A.; Murphy, A.J.; Anguita, D. Condition-Based Maintenance of Naval Propulsion Systems: Data Analysis with Minimal Feedback. Reliab. Eng. Syst. Saf. 2018, 177, 12–23. [Google Scholar] [CrossRef]
  25. Abebe, M.; Shin, Y.; Noh, Y.; Lee, S.; Lee, I. Machine Learning Approaches for Ship Speed Prediction towards Energy Efficient Shipping. Appl. Sci. 2020, 10, 2325. [Google Scholar] [CrossRef]
  26. Hu, Z.; Zhou, T.; Osman, M.T.; Li, X.; Jin, Y.; Zhen, R. A Novel Hybrid Fuel Consumption Prediction Model for Ocean-Going Container Ships Based on Sensor Data. J. Mar. Sci. Eng. 2021, 9, 449. [Google Scholar] [CrossRef]
  27. Zhang, C.; Zou, X.; Lin, C. Fusing XGBoost and SHAP Models for Maritime Accident Prediction and Causality Interpretability Analysis. J. Mar. Sci. Eng. 2022, 10, 1154. [Google Scholar] [CrossRef]
  28. Coraddu, A.; Oneto, L.; Baldi, F.; Anguita, D. Vessels Fuel Consumption Forecast and Trim Optimisation: A Data Analytics Perspective. Ocean Eng. 2017, 130, 351–370. [Google Scholar] [CrossRef]
  29. Jeon, M.; Noh, Y.; Shin, Y.; Lim, O.; Lee, I.; Cho, D. Prediction of Ship Fuel Consumption by Using an Artificial Neural Network. J. Mech. Sci. Technol. 2018, 32, 5785–5796. [Google Scholar] [CrossRef]
  30. Wickramanayake, S.; Bandara, H.D. Fuel Consumption Prediction of Fleet Vehicles Using Machine Learning: A Comparative Study. In Proceedings of the 2016 Moratuwa Engineering Research Conference (MERCon), Moratuwa, Sri Lanka, 5–6 April 2016; pp. 90–95. [Google Scholar]
  31. Theodoropoulos, P.; Spandonidis, C.C.; Themelis, N.; Giordamlis, C.; Fassois, S. Evaluation of Different Deep-Learning Models for the Prediction of a Ship’s Propulsion Power. J. Mar. Sci. Eng. 2021, 9, 116. [Google Scholar] [CrossRef]
  32. Gkerekos, C.; Lazakis, I.; Theotokatos, G. Machine Learning Models for Predicting Ship Main Engine Fuel Oil Consumption: A Comparative Study. Ocean Eng. 2019, 188, 106282. [Google Scholar] [CrossRef]
  33. Uyanık, T.; Karatuğ, Ç.; Arslanoğlu, Y. Machine Learning Approach to Ship Fuel Consumption: A Case of Container Vessel. Transp. Res. Part D Transp. Environ. 2020, 84, 102389. [Google Scholar] [CrossRef]
  34. Štepec, D.; Martinčič, T.; Klein, F.; Vladušič, D.; Costa, J.P. Machine Learning Based System for Vessel Turnaround Time Prediction. In Proceedings of the 2020 21st IEEE International Conference on Mobile Data Management (MDM), Versailles, France, 30 June–3 July 2020; pp. 258–263. [Google Scholar]
  35. Okumuş, F.; Ekmekçioğlu, A.; Kara, S.S. Modelling Ships Main and Auxiliary Engine Powers with Regression-Based Machine Learning Algorithms. Pol. Marit. Res. 2021, 28, 83–96. [Google Scholar] [CrossRef]
  36. Dietterich, T.G. Approximate Statistical Tests for Comparing Supervised Classification Learning Algorithms. Neural Comput. 1998, 10, 1895–1923. [Google Scholar] [CrossRef] [PubMed]
  37. Batista, G.E.d.A.P.A. Pré-Processamento de Dados Em Aprendizado de Máquina Supervisionado. Ph.D. Thesis, Universidade de São Paulo, São Paulo, Brazil, 2003. [Google Scholar]
  38. Baranauskas, J.A.; Monard, M.C. Metodologias Para a Seleção de Atributos Relevantes. XIII Simpósio Bras. De Inteligência Artif. 1998, 1–6. Available online: https://www.researchgate.net/profile/Maria-Carolina-Monard/publication/267780870 (accessed on 15 February 2022).
  39. Petersen, J.P.; Winther, O.; Jacobsen, D.J. A Machine-Learning Approach to Predict Main Energy Consumption under Realistic Operational Conditions. Ship Technol. Res. 2012, 59, 64–72. [Google Scholar] [CrossRef]
  40. Liang, Y.; Wu, J.; Wang, W.; Cao, Y.; Zhong, B.; Chen, Z.; Li, Z. Product Marketing Prediction Based on XGboost and LightGBM Algorithm. In Proceedings of the 2nd International Conference on Artificial Intelligence and Pattern Recognition, London, UK, 16–18 August 2019; pp. 150–153. [Google Scholar]
  41. Kuhn, M.; Johnson, K. Applied Predictive Modeling; Springer: Berlin/Heidelberg, Germany, 2013; Volume 26. [Google Scholar]
  42. Kwak, S.K.; Kim, J.H. Statistical Data Preparation: Management of Missing Values and Outliers. Korean J. Anesthesiol. 2017, 70, 407–411. [Google Scholar] [CrossRef]
  43. Jian, S.; Cao, L.; Pang, G.; Lu, K.; Gao, H. Embedding-Based Representation of Categorical Data by Hierarchical Value Coupling Learning. In Proceedings of the IJCAI International Joint Conference on Artificial Intelligence, Stockholm, Sweden, 13–19 July 2017. [Google Scholar]
  44. Tan, P.-N.; Steinbach, M.; Kumar, V. Data Mining Cluster Analysis: Basic Concepts and Algorithms. Introd. Data Min. 2013, 487, 533. [Google Scholar]
  45. Potdar, K.; Pardawala, T.S.; Pai, C.D. A Comparative Study of Categorical Variable Encoding Techniques for Neural Network Classifiers. Int. J. Comput. Appl. 2017, 175, 7–9. [Google Scholar] [CrossRef]
  46. Yin, W. Machine Learning for Adaptive Cruise Control Target Selection. 2019. Available online: https://www.diva-portal.org/smash/record.jsf?pid=diva2%3A1375828&dswid=120 (accessed on 15 February 2021).
  47. De Maesschalck, R.; Jouan-Rimbaud, D.; Massart, D.L. The Mahalanobis Distance. Chemom. Intell. Lab. Syst. 2000, 50, 1–18. [Google Scholar] [CrossRef]
  48. Leys, C.; Klein, O.; Dominicy, Y.; Ley, C. Detecting Multivariate Outliers: Use a Robust Variant of the Mahalanobis Distance. J. Exp. Soc. Psychol. 2018, 74, 150–156. [Google Scholar] [CrossRef]
  49. Tukey, J.W. Exploratory Data Analysis; Pearson: London, UK, 1977. [Google Scholar]
  50. Singh, D.; Singh, B. Investigating the Impact of Data Normalization on Classification Performance. Appl. Soft Comput. 2020, 97, 105524. [Google Scholar] [CrossRef]
  51. Han, J.; Pei, J.; Tong, H. Data Mining: Concepts and Techniques; Morgan kaufmann: Burlington, MA, USA, 2022. [Google Scholar]
  52. Pandey, A.; Jain, A. Comparative Analysis of KNN Algorithm Using Various Normalization Techniques. Int. J. Comput. Netw. Inf. Secur. 2017, 9, 36. [Google Scholar] [CrossRef]
  53. Manju, N.; Harish, B.; Prajwal, V. Ensemble Feature Selection and Classification of Internet Traffic Using XGBoost Classifier. Int. J. Comput. Netw. Inf. Secur. 2019, 10, 37. [Google Scholar] [CrossRef]
  54. Pani, C. Managing Vessel Arrival Uncertainty in Container Terminals: A Machine Learning Approach. 2014. Available online: https://hdl.handle.net/11584/266426 (accessed on 15 February 2021).
  55. Brillante, L.; Gaiotti, F.; Lovat, L.; Vincenzi, S.; Giacosa, S.; Torchio, F.; Segade, S.R.; Rolle, L.; Tomasi, D. Investigating the Use of Gradient Boosting Machine, Random Forest and Their Ensemble to Predict Skin Flavonoid Content from Berry Physical–Mechanical Characteristics in Wine Grapes. Comput. Electron. Agric. 2015, 117, 186–193. [Google Scholar] [CrossRef]
  56. Schober, P.; Boer, C.; Schwarte, L.A. Correlation Coefficients: Appropriate Use and Interpretation. Anesth. Analg. 2018, 126, 1763–1768. [Google Scholar] [CrossRef]
  57. Singh, K.K.; Kumar, S.; Dixit, P.; Bajpai, M.K. Kalman Filter Based Short Term Prediction Model for COVID-19 Spread. Appl. Intell. 2021, 51, 2714–2726. [Google Scholar] [CrossRef]
  58. Xu, H.; Deng, Y. Dependent Evidence Combination Based on Shearman Coefficient and Pearson Coefficient. IEEE Access 2017, 6, 11634–11640. [Google Scholar] [CrossRef]
  59. Izbicki, R.; dos Santos, T.M. Machine Learning Sob a Ótica Estatística: Uma Abordagem Preditivista Para Estatística com Exemplos em R; Ufscar/Insper: São Paulo, Brazil, 2018; Available online: https://www.est.ufmg.br/~marcosop/est171-ML/MachineLearning_Izbicki (accessed on 15 February 2021).
  60. Breiman, L. Random Forests. Mach. Learn. 2001, 45, 5–32. [Google Scholar] [CrossRef]
  61. Hastie, T.; Tibshirani, R.; Friedman, J.H.; Friedman, J.H. The Elements of Statistical Learning: Data Mining, Inference, and Prediction; Springer: Berlin/Heidelberg, Germany, 2009; Volume 2. [Google Scholar]
  62. Huang, G.; Wu, L.; Ma, X.; Zhang, W.; Fan, J.; Yu, X.; Zeng, W.; Zhou, H. Evaluation of CatBoost Method for Prediction of Reference Evapotranspiration in Humid Regions. J. Hydrol. 2019, 574, 1029–1041. [Google Scholar] [CrossRef]
  63. Bishop, C.M.; Nasrabadi, N.M. Pattern Recognition and Machine Learning; Springer: Berlin/Heidelberg, Germany, 2006; Volume 4. [Google Scholar]
  64. James, G.; Witten, D.; Hastie, T.; Tibshirani, R. An Introduction to Statistical Learning; Springer: Berlin/Heidelberg, Germany, 2013; Volume 112. [Google Scholar]
  65. Geurts, P.; Ernst, D.; Wehenkel, L. Extremely Randomized Trees. Mach. Learn. 2006, 63, 3–42. [Google Scholar] [CrossRef]
  66. Friedman, J.H. Stochastic Gradient Boosting. Comput. Stat. Data Anal. 2002, 38, 367–378. [Google Scholar] [CrossRef]
  67. Hancock, J.T.; Khoshgoftaar, T.M. CatBoost for Big Data: An Interdisciplinary Review. J. Big Data 2020, 7, 94. [Google Scholar] [CrossRef]
  68. Prokhorenkova, L.; Gusev, G.; Vorobev, A.; Dorogush, A.V.; Gulin, A. CatBoost: Unbiased Boosting with Categorical Features. In Proceedings of the 32nd Conference on Neural Information Processing Systems (NeurIPS 2018), Montreal, QC, Canada, 3–8 December 2018; pp. 6638–6648. [Google Scholar]
  69. Bergstra, J.; Bengio, Y. Random Search for Hyper-Parameter Optimization. J. Mach. Learn. Res. 2012, 13, 281–305. [Google Scholar]
  70. Probst, P.; Wright, M.N.; Boulesteix, A.-L. Hyperparameters and Tuning Strategies for Random Forest. Wiley Interdiscip. Rev. Data Min. Knowl. Discov. 2019, 9, e1301. [Google Scholar] [CrossRef]
  71. Kitsikoudis, V.; Sidiropoulos, E.; Hrissanthou, V. Machine Learning Utilization for Bed Load Transport in Gravel-Bed Rivers. Water Resour. Manag. 2014, 28, 3727–3743. [Google Scholar] [CrossRef]
  72. Toqué, F.; Khouadjia, M.; Come, E.; Trepanier, M.; Oukhellou, L. Short & Long Term Forecasting of Multimodal Transport Passenger Flows with Machine Learning Methods. In Proceedings of the 2017 IEEE 20th International Conference on Intelligent Transportation Systems (ITSC), Yokohama, Japan, 16–19 October 2017; pp. 560–566. [Google Scholar]
  73. Fan, J.; Wang, X.; Wu, L.; Zhou, H.; Zhang, F.; Yu, X.; Lu, X.; Xiang, Y. Comparison of Support Vector Machine and Extreme Gradient Boosting for Predicting Daily Global Solar Radiation Using Temperature and Precipitation in Humid Subtropical Climates: A Case Study in China. Energy Convers. Manag. 2018, 164, 102–111. [Google Scholar] [CrossRef]
  74. Dawood, E.G. Geo-Locating UEs Using Multi-Output Decision Tree Regressor. Ph.D. Thesis, Florida Institute of Technology, Melbourne, FL, USA, 2019. [Google Scholar]
  75. Alawadi, S.; Mera, D.; Fernández-Delgado, M.; Alkhabbas, F.; Olsson, C.M.; Davidsson, P. A Comparison of Machine Learning Algorithms for Forecasting Indoor Temperature in Smart Buildings. Energy Syst. 2020, 13, 689–705. [Google Scholar] [CrossRef]
  76. Yuan, Z.; Liu, J.; Liu, Y.; Yuan, Y.; Zhang, Q.; Li, Z. Fitting Analysis of Inland Ship Fuel Consumption Considering Navigation Status and Environmental Factors. IEEE Access 2020, 8, 187441–187454. [Google Scholar] [CrossRef]
  77. Panapakidis, I.; Sourtzi, V.-M.; Dagoumas, A. Forecasting the Fuel Consumption of Passenger Ships with a Combination of Shallow and Deep Learning. Electronics 2020, 9, 776. [Google Scholar] [CrossRef]
  78. Mohr, F.; Wever, M.; Hüllermeier, E. ML-Plan: Automated Machine Learning via Hierarchical Planning. Mach. Learn. 2018, 107, 1495–1515. [Google Scholar] [CrossRef]
  79. Yadav, S.; Shukla, S. Analysis of K-Fold Cross-Validation over Hold-out Validation on Colossal Datasets for Quality Classification. In Proceedings of the 2016 IEEE 6th International Conference on Advanced Computing (IACC), Bhimavaram, India, 27–28 February 2016; pp. 78–83. [Google Scholar]
  80. Zeng, X.; Luo, G. Progressive Sampling-Based Bayesian Optimization for Efficient and Automatic Machine Learning Model Selection. Health Inf. Sci. Syst. 2017, 5, 2. [Google Scholar] [CrossRef] [PubMed]
  81. Liu, Y.; Liao, S.; Jiang, S.; Ding, L.; Lin, H.; Wang, W. Fast Cross-Validation for Kernel-Based Algorithms. IEEE Trans. Pattern Anal. Mach. Intell. 2019, 42, 1083–1096. [Google Scholar] [CrossRef] [PubMed]
  82. Ahmad, A.; Ostrowski, K.A.; Maślak, M.; Farooq, F.; Mehmood, I.; Nafees, A. Comparative Study of Supervised Machine Learning Algorithms for Predicting the Compressive Strength of Concrete at High Temperature. Materials 2021, 14, 4222. [Google Scholar] [CrossRef]
  83. Afrifa-Yamoah, E.; Mueller, U.A.; Taylor, S.; Fisher, A. Missing Data Imputation of High-Resolution Temporal Climate Time Series Data. Meteorol. Appl. 2020, 27, e1873. [Google Scholar] [CrossRef]
  84. Chicco, D.; Warrens, M.J.; Jurman, G. The Coefficient of Determination R-Squared Is More Informative than SMAPE, MAE, MAPE, MSE and RMSE in Regression Analysis Evaluation. PeerJ Comput. Sci. 2021, 7, e623. [Google Scholar] [CrossRef]
Figure 1. Flowchart of the proposed model design. * K is the number of iterations performed by each model.
Applsci 14 07534 g001
Figure 2. Existing waterway network in the Brazilian Amazon basin. Source: SCTPC [4].
Applsci 14 07534 g002
Figure 3. Characterization of the parameters used in the models.
Applsci 14 07534 g003
Figure 4. Data distribution for training, testing, and hold-out validation.
Applsci 14 07534 g004
Figure 5. Pearson’s Correlation matrix between the model features.
Applsci 14 07534 g005
Figure 6. Existing residual curve between predicted and actual observed values.
Applsci 14 07534 g006
Figure 7. Model performance curve adherence to the best-fit condition.
Applsci 14 07534 g007
Table 1. Model input features.
AcronymInput VariableUnit
VTVessel TypePassenger, Cargo, Mixed
HMHull MaterialWood, Marine Steel, Fiber, Aluminum
LENLengthMeters
BRHBreadthMeters
DFTDraftMeters
DPHDepthMeters
NTNumber of ThrustersUnits
NGNumber of GeneratorsUnits
MPMotor PowerHorse Power
TVTravel TimeDays
LDLight DisplacementCubic Meters
CSCruising SpeedKnots
TGSGross Tonnage ShippingTons
PCPassenger CapacityPassengers
CCCargo CapacityTons
NCMNumber of Crew MembersCrew members
FOCFuel ConsumptionLiters
Table 2. Model input parameters after applying the filter method.
VT 1HMLENBRHDFTDPHNTNGMPTVLDCSTGSPCCCNCMFOC 2
1SpeedboatAluminum173.451.21.92152213570100030.4570
2Ferry BoatMarine steel32856450191528982996708363000
3SpeedboatMarine steel25.66.31.82.231518121629002242500
4SpeedboatMarine steel24.896.31.42.355018121629002242500
5Passenger/
General Cargo
Wood195.31.82.8200102109212652537300
6Passenger/
General Cargo
Wood2462.152.8315153109212883438400
7Passenger/
General Cargo
Wood3282.434002031092111262887402300
8Passenger/
General Cargo
Wood287.41.51.753671421092121309051445000
9Passenger/
General Cargo
Wood17.64.21.81.8612151109211601926180
10SpeedboatAluminum122.411.848120135703501287
1 TV—Vessel Type; HM—Hull Material; LEN—Length; BRH—Breadth; DFT—Draft; DPH—Depth; NT—Number of Thrusters; NG—Number of Generators; MP—Motor Power; TV—Travel Time; LD—Light Displacement; CS—Cruising Speed; TGS—Tonnage Gross Shipping; PC—Passenger Capacity; CC—Cargo Capacity; NCM—Number of Crew Members. 2 FOC—Fuel Consumption, regarded as the target column.
Table 3. Application of the One-Hot technique to create new numerical parameters to characterize the Hull Type of ships A and B.
Vessel 1WoodMarine SteelAluminumFiber
Vessel A1000
Vessel B0010
1 These hypothetical vessels were created solely for illustrative purposes.
Table 4. Database distribution after the processing phase.
Features 1MMDMN25%50%75%MX
Length26.010.96.019.023.331.376.0
Breadth5.92.61.54.05.77.421.4
Draft1.50.580.31.11.51.85.0
Depth2.10.790.61.62.02.514.0
Motor Power393.1281.180.0200350.0480.02750.0
Cruising Speed16.26.348.012.015.019.740.0
Number of Thrusters1.30.591.01.01.02.05.0
TGS150.6187.35.035.0109.0141.51600.0
Light Displacement29.035.52.07.021.028.0297.0
Number of Generators1.20.70.01.01.02.05.0
Passenger Capacity140.0159.310.052.088.0145.01400.0
Cargo Capacity113.3182.10.05.046.0130.01600.0
Crew4.42.421.03.04.06.022.0
Travel Duration20.437.50.23.09.021.7768.0
Fuel Consumption1270.82136.65.0150.0400.01300.020,000.0
1 For a clearer understanding regarding the metrics used: M—Mean; MD—Median; MN—Minimum; MX—Maximum.
Table 5. Performance metrics of the six models trained using the cross-validation method in 10 rounds.
ModelMAEMSERMSECPTR2
1CatBoost348.48728,175779.983.8020.852
2Extreme Gradient Boosting409.23979,122899.791.4990.797
3Random Forest387.081,006,461909.400.6470.790
4Gradient Boosting406.331,018,512916.010.2400.787
5Extra Tree352.671,054,447912.190.5260.751
6Decision Tree433.021,581,3471144.340.0150.669
Table 6. Hyperparameters values after optimization implementation.
HyperparametersValues
base_estimator_iterations1000
base_estimator_learning_rate0.2
base_estimator_depth5.0
base_estimator_l2_leaf_reg10.0
base_estimator_loss_functionRMSE
base_estimator_border_count32.0
base_estimator_random_state955.0
base_estimatorCatBoost Regressor
n_estimators10.0
Table 7. Performance metrics of the winning model CatBoost.
FoldMAEMSERMSER2
1294.056261,096510.9760.931
2325.923381,541617.6900.908
3569.9902,726,2211651.1270.693
4237.294465,902682.5700.877
5382.0791,078,4871038.5020.788
6429.818796,458892.4450.791
7271.196219,112468.0940.919
8297.043378,350615.1020.932
9209.607124,925353.4470.937
10261.891339,094582.3180.870
Mean327.890677,119741.2270.865
Table 8. Vessel records initially separated for the hold-out validation phase.
VT 1HMLENBRHDFTDPHNTNGMPTVLDCSTGSPCCCNCMFOC
1SpeedboatAluminum173.41.21.92152213570100030.4570
2Ferry BoatMarine steel32856450191528982996708363000
3SpeedboatMarine steel25.66.31.82.231518121629002242500
4SpeedboatMarine steel24.86.31.42.355018121629002242500
5Passenger/
General Cargo
Wood195.31.82.8200102109212652537300
1 TV—Vessel Type; HM—Hull Material; LEN—Length; BRH—Breadth; DFT—Draft; DPH—Depth; NT—Number of Thrusters; NG—Number of Generators; MP—Motor Power; TV—Travel Time; LD—Light Displacement; CS—Cruising Speed; TGS—Tonnage Gross Shipping; PC—Passenger Capacity; CC—Cargo Capacity; NCM—Number of Crew Members; FOC—Fuel Consumption.
Table 9. CatBoost model metrics for the validation data.
ModelMAEMSERMSER2
CatBoost274.5346,143588.340.91
Disclaimer/Publisher’s Note: The statements, opinions and data contained in all publications are solely those of the individual author(s) and contributor(s) and not of MDPI and/or the editor(s). MDPI and/or the editor(s) disclaim responsibility for any injury to people or property resulting from any ideas, methods, instructions or products referred to in the content.

