Abstract
The empowerment of educational reform and innovation through AI technology has become a topic of increasing interest in the field of education. The advent of AI technology has made comprehensive and in-depth teaching evaluation possible, serving as a significant driving force for efficient and precise teaching. There were few empirical studies on the application of high-quality precision teaching models in the field of compulsory education, and the learning difficulty of technology and the teaching burden on teachers have become significant factors hindering the use of technology to support education. This study analyzed teaching models from the perspectives of teachers’ teaching burdens and students’ learning obstacles, and was committed to relying on intelligent technology to construct a new precision teaching model, an educational diagnosis–feedback–intervention path that covered the entire teaching process, from the dimensions of teacher behavior, student behavior, and parent behavior, aiming to assist teachers in efficient teaching and students in personalized learning. This study was conducted with nine science classes, including about 540 people in the second year of high school at a Middle School in China; six classes were the intervention groups while the last three classes were control groups, and a survey of 19 teachers from the intervention classes was carried out. The results showed that this model can significantly improve students’ academic performance in science subjects, especially in mathematics and chemistry. It has increased the proportion of high-achieving students, reduced the proportion of low-achieving students, stimulated students’ self-directed learning ability, cultivated a positive attitude towards science learning, and explained the key points of using a precision teaching model in different disciplines. It has achieved a deep integration of education and technology, helping to increase the efficiency and reduce the burden of teaching.
1. Introduction
In the context of Internet and education in the 21st century, an increasing emphasis has been placed on the development of educational informatization by the government. From the “13th Five-Year Plan for the Development of Education” to “Educational Informatization 2.0”, and then to the “Horizon Report 2023: Teaching and Learning”, technology has been continuously empowering education as it evolves from informatization and digitization to intelligence. With the advancement of technology, an increasing number of educators are incorporating technology into their classrooms [1,2,3,4,5]. However, the adoption of a “one-size-fits-all” teaching approach hinders teachers from addressing the diverse needs of students [6]. Artificial intelligence (AI) technology encompasses various core technologies, such as big data analysis, cloud computing, artificial intelligence, IoT, and others, within an internet-based environment. AI facilitates learning activities in different settings through prediction algorithms, diagnostic tools, recommendation systems and decision-making processes. Consequently, its significance in the field of education is growing [7]. The integration of AI enables instructors to deliver personalized and adaptive instruction effectively by providing specialized assistance and enhancing awareness regarding knowledge gaps [8]. With the continuous development of artificial intelligence technology comes increased opportunities for collecting and analyzing learning data. This promotes teachers’ attention towards individual student needs while offering targeted instructional guidance that moves away from a one-size-fits-all approach towards precision education [9,10].
The construction of a high-quality education system relies on the digital transformation of education [11]. The integration of technology and the classroom not only offers numerous opportunities for educational development but also necessitates novel approaches to teaching and learning [12]. Although many schools have made significant investments in terms of hardware, software, infrastructure, and system platform construction to establish intelligent campuses or intelligent educational environments, acquiring proficiency in using technological tools poses a challenge for teachers, and leveraging technology effectively for teaching purposes presents an even greater difficulty. Research has demonstrated that incorporating machine learning into education theory can enhance learning outcomes [13,14], while instructional methods and strategies can be tailored from specific theoretical perspectives to cater to individual student needs and specific teaching objectives [15]. Recent studies have highlighted the significance of precision teaching in acknowledging learner differences within the educational environment, identifying at-risk students, and providing timely personalized interventions which may encompass instructional materials, strategies, as well as learning activities [6,10]. However, the precision teaching strategies have certain limitations [16,17,18]. For instance, teachers face challenges in balancing the workload distribution for personalized instruction and efficiently selecting the most effective teaching tools and other unresolved issues. Teachers need to transfer more labor towards implementing personalized instructional paths and relinquishing their mechanized labor processes through artificial intelligence technology. Therefore, it is crucial to thoroughly consider the rationality of human–machine collaboration and the division of labor when designing precision teaching models. Numerous studies have explored the application effects of precision teaching models under man–machine collaboration across various fields [19,20,21,22]. However, empirical research on high-quality teaching applications remains scarce [23].
To address the gap, this study, combining the characteristics of artificial intelligence technology to help teachers increase efficiency and reduce burden, charts the design of a personalized teaching and learning path from the perspective of precision teaching theory, applied in the process of high school science teaching, and the application effect is explored from the perspective of empirical data analysis.
1.1. Development and Application of Precision Teaching
In the 1960s, Lindsley proposed the precision teaching method based on Skinner’s behavioral learning theory [24]. Precision teaching was developed as a measurement system comprising four crucial stages [25]: precise identification, recording, modification, and retry. These stages laid the foundation for its application in the field of education. During the initial research stage, scholars abroad perceived precision teaching as a pedagogical strategy or method and conducted theoretical discussions and relevant research to enhance classroom teachers’ instructional effectiveness [26,27,28].
Liu Chang and Zhang Liang performed data analysis to categorize domestic precision teaching research into three developmental stages [29]. With the development of AI technology, precision teaching has made significant advancements in theory, technology, and methodology; the landmark achievement is the Precision Teaching 2.0 model proposed by Guo Liming in 2019 [30].
Under the guidance of Precision Teaching 2.0, teaching is now more focused on individual student development while respecting their unique differences. Additionally, education–technology integration has shifted from a quantitative to qualitative approach that emphasizes greater efficiency and reduced workload for teachers and students alike. Precision education serves as a solid foundation for personalized learning [18]. The pursuit of individualized instruction is also becoming increasingly prevalent as measurement-based learning takes center stage [31], emphasizing the importance of teachers designing learning activities based on individual characteristics and the learning behavior data of students, while dynamically adjusting teaching strategies according to feedback received during the learning process [32]. Furthermore, AI technology has enabled precise prediction and real-time data collection for personalized learning opportunities [33], making it possible for teachers to take on greater responsibilities within an intelligent educational environment, where personalized teaching is key to replacing traditional methods [34].
Although there is a greater body of research on precision teaching, encompassing theoretical analysis and the verification of its effectiveness. Gallagher [35] and Strømgren [36] have investigated the impact of precision teaching on students’ academic performance, with experimental results demonstrating significant improvements in grades. Combining task practice frequency with precision teaching strategies is an effective approach to enhance various skills among school-age children [37], certain scholars focus on developing models and examining the application effects of technology-enabled precision teaching. For instance, Wang Yonggu et al. [23] developed a precision teaching model utilizing e-textbooks, which was applied in a junior high school mathematics review class; results indicated that this model significantly improved students’ math achievement levels while enhancing their learning effectiveness. Furthermore, there are relevant studies on the prediction of the dropout rate of online learning [9], academic achievement prediction [10], the diagnosis of high-risk students [38], and the teaching evaluation of college students [21] in the field of precision study supported by technologies.
The visual analysis of literature on precision teaching reveals a limited number of high-level empirical research papers addressing this topic [29], and most studies concentrated on predicting academic performance or dropout rates among college students majoring in computer science or STEM fields within online or blended learning environments, utilizing diverse data sources [18]. Existing research cases primarily focus on small-scale teaching investigations, while there is a lack of empirical studies and research on the widespread implementation and impact of the precision teaching model. Meanwhile, precision teaching strategies should avoid the burden of technology on teachers and provide training that can improve teachers’ digital literacy [39].
1.2. The Present Study
The current research on precision teaching faces two major challenges. The first comprises the gap between teachers’ insufficient digital literacy and the design of intelligent technology to support teaching, and the burden of technology on teachers. Simple and easy to understand training for teachers and students on the use of technology and precise teaching guidance paths with increasing efficiency and decreasing negative effects are necessary. Secondly, there is a dearth of empirical studies pertaining to precision teaching both domestically and internationally; instead, more emphasis has been placed on exploring pedagogical approaches and investigating theoretical frameworks. Therefore, the research objective of this study is to develop a technology-supported precision teaching model based on a theoretical framework which aims to assist educators in improving efficiency and reducing workload, while also enhancing student learning quality. Additionally, the study will investigate the specific impact of implementing this teaching model on high school science education through empirical research.
The issues explored by this study are as follows: (1) how to promote the deep integration of technology and teaching, and build an easy-to-use, useful, and user-friendly precision teaching model; (2) what are outcomes through empirical investigations in real-world teaching scenarios on the implementation of the precision teaching model? The hypothesis of this study posits that the precision teaching model effectively enhances the instruction of science subjects, and responds to question (1) in the theoretical analysis section.
2. Precision Teaching Model Supported by AI Technology
A literature review revealed several issues with precision teaching in traditional models, including the lack of personalized teaching resources, the excessive burden on teachers, the prevalence of precision diagnostics and prediction as the primary application scenario, and the limited use of precision intervention strategies [16,17,18]. Intelligent education systems that integrate big data, AI and image recognition technologies into teaching to provide personalized education solutions for teachers, students, schools, as well as educational regulatory bodies are also explored.
As depicted in Figure 1, teachers typically incorporate the following steps for effective instruction in their daily teaching practice: homework assessment, focused explanation, personalized training, and targeted tutoring. However, in reality, most traditional teachers allocate a significant amount of time to the initial two steps, leaving limited room for personalized training and targeted tutoring. To enhance teachers’ productivity and alleviate their workload burden, intelligent education systems employ cloud-based grading to replace manual grading by teachers. Students answer on specially processed paper with a smart pen, and the intelligent system recognizes and judges students’ answers through artificial intelligence, BP, OCR, machine learning and other technologies, and automatically completes the correction. With the support of data mining analysis, big data, cloud computing, knowledge graphs and other technologies, learning progress reports are automatically generated and accessible to teachers to help them understand students’ learning, while each student has a personalized error log, enabling teachers to effectively identify and address knowledge gaps for consolidation and improvement purposes. In addition, adaptive recommendation technology can provide tailored exercises for students’ weak areas of knowledge acquisition, thus promoting better understanding and autonomous growth.

Figure 1.
Teaching process supported by AI technology Note. Figure 1, Figure 2 and Figure 3 were created by the author, with reference to the intelligent teaching system product materials, and drawn by a diagramming website (www.processon.com, accessed on 1 May 2024).
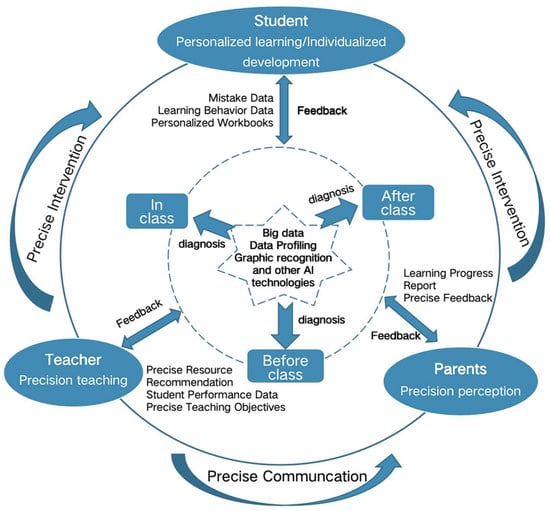
Figure 2.
Precision teaching model based on AI technology.
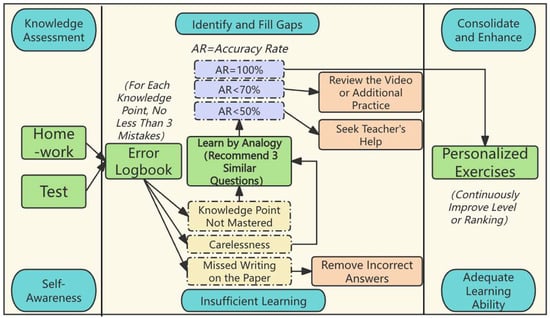
Figure 3.
Personalized learning pathways based on intelligent error logbook.
Figure 1.
Teaching process supported by AI technology Note. Figure 1, Figure 2 and Figure 3 were created by the author, with reference to the intelligent teaching system product materials, and drawn by a diagramming website (www.processon.com, accessed on 1 May 2024).

In order to bridge the gap between teachers’ limited digital literacy and the design of intelligent technology assistance for teaching, this study has developed an AI-based precision teaching model (as depicted in Figure 2). This model leverages advanced technologies such as big data analytics, data profiling, and image recognition to intelligently monitor, analyze, and diagnose students’ learning progress throughout the pre-class, in-class, and post-class educational process. The diagnostic results are then presented through visually informative data reports to facilitate timely teaching interventions and response strategies for teachers, students, and parents. By integrating hardware and software terminals seamlessly, a closed-loop teaching process is established that caters simultaneously to students’ personalized learning, teachers’ precise instruction, and parents’ accurate perception.
The specific implementation paths for the high-quality teaching supported by the AI technology-enabled precision teaching model are as follows:
2.1. Teachers and Parents: Precision Teaching and Precision Intervention Supported by Formative Assessment
The theory of the “zone of proximal development”, proposed by psychologist Lev Vygotsky, posits that students exhibit two levels of development [40,41]: their actual developmental level, denoting their capacity to independently solve problems, and their potential developmental level, indicating their ability to solve problems with the guidance of adults or more capable peers. The zone of proximal development represents the disparity between these two levels. Leveraging big data and artificial intelligence technology can assist educators in accurately diagnosing students’ zone of proximal development, encouraging teachers to selectively explain knowledge and push exercises to achieve precision teaching [42]. The intelligent teaching system constructs user profiles by incorporating personal basic information [43], interest preferences [44], resource styles [45], preference behaviors [46], interaction information [47,48], situational information, interest changes [49], etc. Various mathematical modeling methods and big data processing technologies are employed to measure, analyze, and compare the data results in order to obtain a tagged user feature model that predicts students’ future learning performance trends and prompts teachers to continuously adjust their teaching intervention strategies.
2.1.1. Learning Preview
Teachers can access learning preview data, including student count, average browsing time, viewing frequency, number of students struggling to comprehend the material, number of students submitting exercises, average exercise completion time, average accuracy rate, exercise answer analysis, and individual student response patterns. This enables teachers to gain insights into each student’s progress and tailor precise teaching strategies accordingly.
2.1.2. Classroom Interaction
Teachers can effectively coordinate classroom activities using a combination of software and hardware terminals, while also receiving prompt feedback and being able to intervene in students’ activities.
2.1.3. Learning Report
The comprehensive learning report collects and analyzes all data related to students’ learning previews, homework assignments, and exams. It provides an in-depth analysis of individualized student needs while predicting developmental trends and identifying potential challenges. Moreover, it assists teachers in offering targeted guidance based on these findings.
2.1.4. Stage Report
Parents receive periodic stage reports that encompass classroom performance data across various subjects at different proficiency levels, as well as homework completion rates. These reports facilitate parents’ understanding of their children’s learning dynamics while fostering effective communication with teachers.
2.2. Students: Personalized Learning and Individual Development Supported by Intelligent Technology Systems
Accurately comprehending the essence of personalized learning is fundamental and pivotal in establishing a big data-driven personalized learning service system. Research suggests that the ability to dynamically provide tailored content is a favorable factor for achieving effective learning support, while also respecting students’ diverse personalities, preferences [50], and challenges encountered in virtual learning environments. A literature review reveals that personalized learning has been attributed with varying interpretations over time. In 2010, the National Education Technology Plan defined personalized learning as empowering students to make decisions regarding what, how, and at what pace they learn through diversified options that foster lifelong education mindset development and enhance their autonomy [51]. Similarly, in 2010, UK’s Department for Education and Communications Technology described personalized learning as an inclusive approach centered on students’ needs and catering especially to those facing difficulties in their educational journey [52]. In 2010, the Education and Communications Technology Agency of the UK stated that personalized learning is an inclusive approach that prioritizes students and caters to the needs of all learners, particularly those facing difficulties [52]. In 2019, Yu proposed a three-tiered interpretation of personalized learning [53]. Hui Luan et al. argue that future research on precision teaching should focus on personalized learning towards individualized learning [54], demonstrating how intelligent technology can enable individualized instruction. Barbara Bray and Kathleen McClaskey have conducted an extensive analysis highlighting the distinctions between personalized learning and individualized learning [55], noting that student growth necessitates both teacher-led personalized instruction and technology-supported individualized development.
The emerging definition of personalized learning encompasses two essential features: (1) Student-led self-directed learning, wherein students have control over the pace and content of their education. (2) Adaptive and individualized learning supported by AI technology, which collects data on students’ learning behaviors to provide concrete analysis results and deliver adaptive tasks for precise teaching by educators and personalized learning experiences for students.
With the assistance of intelligent teaching systems, students can independently enhance their knowledge through self-study, examinations, and feedback from a misconceptions notebook. Additionally, they can receive personalized instruction by providing feedback on their progress through homework assignments and practice exercises.
2.2.1. Pre-Class Study
Students are able to access pre-class materials, answer questions related to them, receive feedback reports, self-assess their understanding of the material, and adequately prepare for upcoming classes.
2.2.2. Homework
By utilizing comprehensive records of student data, including handwriting samples, among others, teachers gain insights into each student’s learning status in advance. This enables them to assign differentiated homework that helps reduce workload while addressing specific areas requiring improvement.
2.2.3. Practice
Teachers accurately identify knowledge gaps based on student responses and subsequently provide adaptive training exercises after class to help fill these gaps, effectively improving overall learning efficiency.
2.2.4. Exams
The precise analysis of weak knowledge points allows for the automatic generation of personalized learning plans tailored specifically towards each student’s needs, enabling them to understand their current stage of development better while facilitating targeted practice sessions.
2.2.5. Error Logbook
The system automatically collects and organizes students’ mistakes in homework, exams, and self-practice exercises, and creates a “error logbook” based on the results of knowledge assessments, intelligently analyzing the context of the mistake, which can be used to help students who are not proficient in their studies to identify and fill in gaps in their knowledge, and to help students who are academically strong to consolidate and improve. The system also generates corresponding training and improvement paths intelligently, as shown in the figure below. Students can also analyze the reasons for their mistakes and correct them in time, thus solving the problem of repetitive and ineffective training and truly helping each student’s individual development.
2.3. Examples of Pedagogical Models in Use
Case 1. The math teacher of Class A, Grade 2, in the intervention class, teaches geometry knowledge points by conducting a pre-class quiz and analyzing the data of the students’ stage reports to understand their learning situation (as shown in Figure 4(A1)). After the class, the teacher divides the students in the class into three different level groups on the educational platform and assigns corresponding after-class assignments. After receiving the task, the group members collaborate to complete the assignment (as shown in Figure 4(A2)) and showcase it during breaktime. The teacher reviews the group report and comments on the assignments of the different groups in class, and invites representatives to introduce their problem-solving ideas. During this process, the tasks assigned by the teacher stimulate the students’ self-directed exploration and hands-on ability, while the group assignment meets individual needs, and reviewing the report helps to provide precise guidance for teaching.
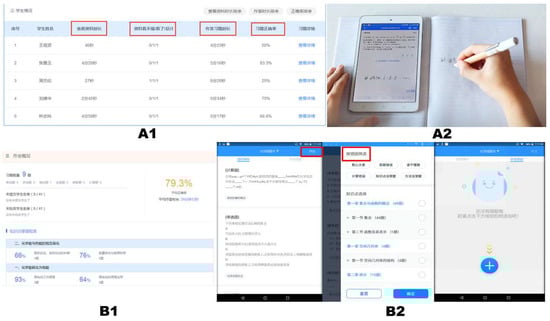
Figure 4.
The pictures of teachers and students using intelligent teaching products Note. (A) represents intelligent teaching in mathematics. (A1) is the data from teacher’s terminal in intelligent teaching system about students’ pre-class preparation, including the time for student spends on review and exercises, learning condition, and correctness rates. (A2) illustrates how does student use smart pens, exercise books, and pads to complete exercise. (B) represents intelligent teaching in chemistry. (B1) provides data from teacher’s terminal about students’ homework responses, such as class average correctness rate, understanding of knowledge, and exercise practice condition. (B2) showcases the interface where students use smart pads for independent practice - generating personalized error logbooks based on their learning profiles followed by targeted practice according to error causes.
Case 2. The chemistry teacher of Class B, Senior 2, an intervention class, is skilled at delivering lectures through the model of homework review. He believes that the key approach to assisting students in improving their learning quality is for students to do exercises (diagnostics), teachers to give feedback (feedback), and teachers to guide students to learn from one example to apply to others (intervention). The teacher uses the function of pushing exercise topics in the teaching system to examine the students’ level of mastery of knowledge points in class (as shown in Figure 4(B1)). He also gives explanations on typical answers in class to create an efficient classroom teaching environment. After class, Teacher B holds a weekly ranking competition for the “completion of error book”, guiding students to find and fill in gaps, consolidate and improve, and by sending students’ reports and after-class assignments to parents, he encourages parents to help students complete their homework more effectively. After class, students independently practice their mistakes to create a learning culture with strong chemistry (as shown in Figure 4(B2)).
3. Methods
During the high school stage, subjects such as mathematics, physics, and chemistry are relatively more difficult and have a strong practical nature. They are also important pathways for cultivating students’ logical thinking skills. As a result, as schools are increasingly focusing on the development of science education, teachers should base their approach on the contemporary characteristics, consider the value of big data technology applications, and combine the requirements of science teaching to innovate on teaching models. To achieve the research goal, this study employs experimental methodologies and survey questionnaires to validate the efficacy of the precision teaching model in terms of students’ learning outcomes and teachers’ utilization effectiveness.
3.1. Procedure and Sample
This study selected nine Grade 2 classes from a high school in the middle of China as the research subjects, with classes 1 to 6 in Grade 2 assigned as the intervention groups, while classes 7 to 9 were the control groups. The quantitative data of students are utilized in the form of mean scores and the difference in mean scores; thus, the disparity in the number of students between the intervention group and control group can be considered as a confounding variable. The teachers implemented the precision teaching model in conjunction with an intelligent education system from 9 October 2022 to 31 October 2023. Data were collected and analyzed for math, physics, chemistry, and biology scores of all nine classes during both the November 2022 (pre-test) and November 2023 (post-test) midterm exams. Additionally, data on students’ self-directed learning behavior and teachers’ emotional attitudes were collected specifically for the intervention groups during this period. Teacher training and student training sessions were held before the start of the experiment. The teacher training included an introduction to the precision teaching model, such as the main roles of the model, theoretical foundations, technical support, etc., the functions of the intelligent teaching system, subject case applications of the intelligent teaching system, as well as the research cycle and project personnel’s technical support. To ensure that teachers could effectively utilize the model, during the experiment, project team members were at the school as technical support to promptly assist teachers with any issues and to record experimental logs. Student training mainly included the functions of the intelligent terminal and usage tips, the skills for connecting the smart pen and terminal via Bluetooth, and the pathways for personalized practice. To ensure the effectiveness of the students’ use, during the experiment, when there was significant student turnover in the class, project team members conducted a new round of student training. At the end of the experiment, 19 teachers from the intervention group were selected as subjects for the survey on the effectiveness of the teaching model usage.
3.2. Measures
3.2.1. Midterm Examination Papers
The mid-term examination papers from the academic years 2022 and 2023 were used as the pre-test and post-test tools, respectively. Before the test data analysis, the difficulty of the two test papers were analyzed to eliminate its influence on the data analysis. Assuming that each test question is independent, and because the difficulty coefficient is directly proportional to the point loss probability [56], the difficulty coefficient can be derived from the point loss probability or the point loss rate, by the formula D = [57]; obtain the Test Difficulty index D, the larger the d value, the lower the difficulty. From the analysis of standard deviation and difficulty (the mean value calculated based on the students who actually participate the exam), the discrepancy in D between pre-test and the post-test converge towards 0.1 across all scientific disciplines, as illustrated in Table 1, thereby suggesting that the impact of D on the experimental results can be neglected.

Table 1.
Difficulty values of science papers.
3.2.2. Self-Directed Learning Report
The intelligent teaching system provides self-directed learning data during a specified period for every class and student, which includes ranking changes in a student’s subject grades, homework submission rate, homework completion rate, average correct rate per person, number of similar questions completed and accuracy rate, number of personalized exercises completed and accuracy rate, etc.
3.2.3. Teacher Emotional Attitude Survey Questionnaire (Questionnaire S1)
The questionnaire comprises 22 items, including 6 demographic background questions aimed at obtaining basic information from the 19 teachers in the intervention group. Additionally, there are 5 teacher satisfaction questions regarding commonly utilized system functions, while the remaining questions focus on usage patterns and directions for improvement.
3.3. Data Analysis
t-Test: Utilized to explicate the efficacy of precision teaching model by examining alterations in students’ science scores. It included an independent sample t-test and comparative analysis. The independent sample t-test analyzed the significant difference between the mean scores of the intervention group (classes 1–6) and the control group (classes 7–9) in pre-test and post-test, from the perspective of the four disciplines of mathematics, physics, chemistry and biology. The comparative analysis compares the difference between the average score before and after the test and the average score of the grade, and also analyzes the data of four subjects.
Regression Analysis: It is used to illustrate the effect of the precision teaching model on the frequency distribution of high-achieving students and high-achieving students. The frequency distribution of students with different scores and the trend in the fitting curve in mathematics and chemistry were analyzed.
Correlation analysis: The correlation analysis includes the correlation between the average score difference pre- and post-tests of different classes in the intervention class (classes 1–6) and the students’ independent practice data of corresponding classes, as well as the correlation between the progress ranking of typical students in the subject and the corresponding students’ independent practice data.
Descriptive analysis: used to elaborate on teachers’ experiences with utilizing intelligent teaching systems, which includes an analysis of teacher satisfaction, an analysis of teacher’s use function/use duration/use environment of the intelligent teaching system, as well as an analysis of teacher’s use frequency and the duration of the intelligent operating system.
Among these, mid-term exam scores were provided by the school; data regarding students’ self-directed exercises, including homework exercises, similar exercises, and personalized exercises, were recorded in each teacher’s intelligent teaching system account and obtained from the teacher; questionnaire data were collected through voluntary responses from 19 teachers in the intervention group.
4. Results
It was found through investigation that there was considerable student movement between classes during the year in class 3–class 6, including 26 students leaving the grade and 10 joining it; therefore, we will not compare the two sets of grades of the midterm exam from the perspective of class dimensions, but only compare the average scores of the entire grade from the subject perspective.
4.1. Results of t-Test
In order to eliminate the influence of irrelevant variables, the researchers excluded students in the intervention group who had no prior experience with intelligent devices and other students who did not participate in the cultural exam from the list, and statistically analyzed the list of students who had participated in both semester midterm exams and their corresponding scores, as shown in Table 2.
Table 2.
Overall class average score status table.
The average score difference between the control group (classes 7–9) and the intervention group (classes 1–6) in pre-test and post-test was analyzed for the significant difference in each subject. As shown in Figure 5A, the average score difference in the intervention group was greater than that of the control group, and the p value of mathematics and chemistry were both less than 0.05, showing statistically significant differences. The statistical values of physics and biology showed non-significant differences. The p value of the total science value is 0.0035, which is less than 0.05, so the mean difference in the total science value is significantly different between the intervention group and the control group. The above data show that the application of the precision teaching model to the science teaching of the intervention class (class 1–6) has a significant overall effect, in which the teaching effect of mathematics and chemistry is particularly significant, while that of physics and biology is vice versa.
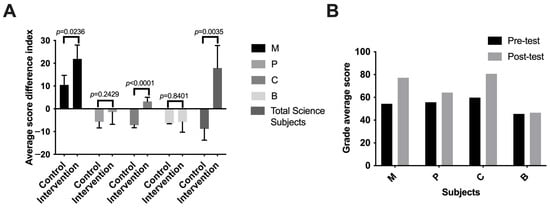
Figure 5.
The significance of differences in mean scores pre- and post- science tests Note. (A) Significance analysis of mean score difference between intervention group and control group; (B) comparison of the difference in average scores between the intervention group and the grade average in pre-test and post-test.
To further verify the effectiveness of the precision teaching model in the intervention class, researchers compared the difference between the science scores of classes 1–6 in this exam and the grade average with the previous value, as shown in Figure 5B. It was found that the difference in this exam has increased compared to the last time, with mathematics showing the largest increase, followed by chemistry, and biology ranking last. This is consistent with the above data analysis results.
The data analysis results indicate that the precision teaching model is effective for science education overall, with varying degrees of effectiveness for mathematics, physics, chemistry, and biology. Among them, the effectiveness is strongest for mathematics and chemistry. Therefore, we will divide the following analysis into two parts: (1). Besides the significant improvement in scores, are there any other changes in mathematics and chemistry? (2). What are the reasons for the different score changes across the four subjects? (from the perspective of teachers’ and students’ use of intelligent products).
4.2. Results of Regression Analysis
To observe the score differences between the two exams in mathematics and chemistry, the pre-test and post-test data from nine classes were analyzed for frequency distribution across different score ranges, a descriptive analysis of quartiles, and a regression analysis of fitted curves.
From Figure 6, it can be observed that the pre-test and post-test scores in mathematics and chemistry are approximately normally distributed. The R-values for all four sets of data are close to 1, indicating a high degree of curve fitting. An analysis of score shifts is conducted using the peak points of the curves in each graph. Students’ learning levels can be categorized based on their exam performance [58], with scores from 0 to 40 considered the low range for low-achieving students, and scores from 100 to 150 the high range for high-achieving students in the subject of math. It can be seen from the chart that the post-test overall distribution of scores has shifted towards the higher score group compared to pre-test, and there has been a significant increase in the proportion of high-achieving students and a significant decrease in the proportion of low-achieving students (0–40) in post-test. The average values and quartiles of the chemistry subject in Figure 6B show a changing trend similar to that of the math scores in Figure 6A. There are more students in the high score group (80–100) in the post-test compared to the pre-test, and fewer students in the low score group (0–40) compared to the pre-test for chemistry subject. Although the increase is not significant, it has the same trend in change as the math subject.
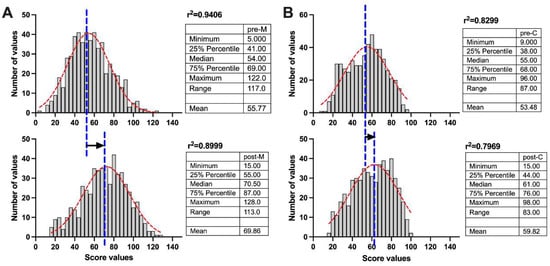
Figure 6.
Average score frequency distribution. Note. The chart shows the distribution of scores from the pre-test and post-test in math (A) and chemistry (B). In the histogram, each bar represents the number of students within a specific score range. The superimposed normal distribution curve illustrates the distribution of the data, with its peak (the middle line) indicating the median, highlighted with a blue line. The shape and position of the curve represent the concentration tendency and dispersion of the score distribution. The quartile table for each graph is displayed on the right side of the chart.
Thus, this responds to the first part of the previous question (1), indicating that science teaching has brought positive teaching effects through the use of the precision teaching model over a year. In addition to the significant improvement in math and chemistry scores, it has also helped increase the number of students in the high score group and decrease the number of students in the low score group.
4.3. Results of Correlation Analysis
To explore the reasons for the inconsistent significance of the differences in the scores of the four science subjects, the researchers analyzed the data from the perspective of technological support for teachers and students.
Teachers: Three intelligent teaching system functions that are frequently used by teachers in daily teaching were selected, as shown on the x-axis of the following Figure 7A, and their usage frequency in the four subjects was compared. From the bar chart, it can be seen that mathematics has the highest usage frequency for the three major functions, and biology ranks last in usage frequency for all subjects, which is consistent with the trend in the above-mentioned significant differences. The physics subject has a lower usage frequency of the “homework question” function than the chemistry subject, but has a higher usage frequency for the other two functions, yet it did not show a corresponding impact on teaching effectiveness.
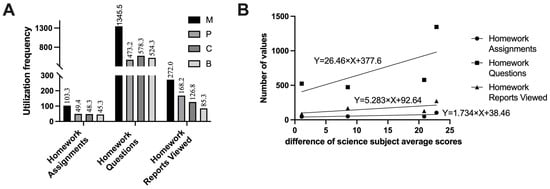
Figure 7.
Class student self-directed learning.
Through the correlation analysis in Figure 7B, it can be seen that the slopes of the three functional curves are positive, all positively correlated, with the slope values being “homework questions” (26.46) > “homework reports viewed” (5.238) > “homework assignment” (1.734), proving that “homework questions” have a more significant impact on the variability of score changes across different subjects. In the precision teaching model, in addition to teachers, another important role is the student. Teachers are responsible for teaching, monitoring, and feedback, while the initiative of learning lies with the students. Therefore, the reasons affecting teaching effectiveness should also be explored from the perspective of students’ self-directed learning effectiveness. The following parts analyze the effectiveness of self-directed learning from the perspective of the class and typical students.
Students: The correlation between students’ self-directed learning through the intelligent system and their final exam scores was explored. This study, from the perspective of various disciplines, conducts a correlation analysis on the relationship between the difference in pre and post average scores of intervention classes and students’ self-directed learning, including homework completion rate, the number of similar problems completed, and the number of personalized exercises completed. The homework completion rate reflects students’ enthusiasm and seriousness towards the subject, the number of similar problems completed reflects the ability of identifying and filling gaps, and the personalized exercises reflect the ability of improvement and advancement; the “Personalized Learning Pathways” diagram can be referred to for context. The results of the correlation analysis are represented by a linear function, where the sign of the slope reflects whether there is a correlation, and the magnitude of the slope value reflects the degree of correlation. The analysis results are shown in Table 3 below.
Table 3.
Class 1–6 students’ self-directed learning data table.
From Table 3, it can be seen that the correlation data for each subject follows different patterns. The patterns for mathematics and chemistry are approximately the same. The improvement in mathematics scores is negatively correlated with the number of similar problem exercises, and positively correlated with the other two autonomous practice data. This may be related to the frequency with which the mathematics teacher uses the homework release function. The mathematics teacher will check the homework report promptly and re-release exercises that students are prone to make mistakes on for students to practice, leading to a reduced frequency of students’ autonomous similar problem exercises, but still achieving the learning effects.
The improvement in chemistry subject scores is positively correlated with each student’s autonomous practice data; the similar problem exercises, especially, show a relatively strong correlation. Looking back, the chemistry subject score improvement, ranking second, the teacher’s frequency of using homework functions is not high, and it is speculated that the reason for this is the high frequency of students’ autonomous similar problem and personalized problem exercises. Physics and biology both show a positive correlation in similar problem exercises, proving that the frequency of students’ self-directed gap-checking exercises affects their score improvement.
Typical Student Improvement Ranking: In order to further investigate the correlation between students’ self-directed learning and their learning outcomes under personalized learning paths, the researchers selected typical students for analysis. Researchers will rank the students in the intervention class for mathematics, physics, chemistry, and biology according to their improvement in rank, select the top five students who made the greatest progress and the five students who experienced the greatest regression in each subject, and analyze their autonomous learning data to explore its correlation. The individual’s autonomous practice data includes the number of similar problems completed and the number of personalized problems completed. The analysis results are shown in Table 4 below.
Table 4.
Typical student’s self-directed learning data table.
The data in the table show that for mathematics, physics, and chemistry, the slope of the function corresponding to the degree of improvement of the typical students is positive, proving that there is a positive correlation. For the biology subject, the slope of the function corresponding to the degree of improvement of the typical students is negative with the number of personalized exercises, showing no correlation, but it is positively correlated with the number of similar problem exercises. Combining this with the “Results of correlation analysis of Class student self-directed learning,” it is concluded that practice with similar problems helps to improve the scores in mathematics, physics, chemistry, and biology. The two subjects with greater progress in scores, mathematics and chemistry, also show a positive impact in terms of homework completion rate and the number of personalized exercises practiced. This also answers the second question raised above: the quantity of students’ autonomous practice with similar problems is the reason for the difference in effectiveness of the precision teaching model in teaching mathematics, physics, chemistry, and biology. The homework completion rate and the number of personalized exercises only affect the two subjects of mathematics and chemistry.
4.4. Results of Descriptive Analysis
The experience of teachers using intelligent teaching systems has a great impact on the application effect of precision teaching models. In order to understand the attitudes and usage situations of the teachers in the intervention class towards the intelligent teaching system, this study conducted a survey among 19 teachers in the intervention class. The questionnaire is shown in Table 5; among the 19 teachers, 1 is the grade leader who teaches physics, and the other 18 teachers are relatively evenly distributed across the subjects of mathematics, physics, chemistry, and biology, and 84% of the teachers have never used intelligent classrooms. Five questions were collected about the teachers’ satisfaction with the use of the intelligent system, as shown in the following Table 5:
Table 5.
Teacher satisfaction survey results.
From the data in the table, it can be seen that 78.95% of the teachers in the intervention group believe that the pre-class guidance function in the intelligent teaching system is very helpful to their teaching, while 21.05% believe it is not very helpful, which shows that most teachers believe that this function is helpful to their teaching. The intelligent homework function is a function that teachers often access and use. The other four questions include satisfaction surveys on the types of homework, the difficulty of homework, the grading of homework, and the source of errors in the class; from the data in the table, the dissatisfaction rate of teachers is zero, and the satisfaction rate (which includes the satisfied and acceptable options) is relatively high.
Through the analysis of the functions, usage time, frequency, and environment of the teachers, as below in Figure 8(A1), it was found that the seven mainstream functions in the system were all tried by the 19 teachers, with the top four usage percentages being: homework report: 94.74%, cloud grading: 73.68%, physical screen projection: 68.42%, resource playback: 52.63%, the same as the interactive questions. According to these data, teachers often use intelligent system functions to assist teaching in the precision teaching model’s pre-class and in-class segments, and the proportion of teachers who record classroom videos for post-class reflection is relatively small.
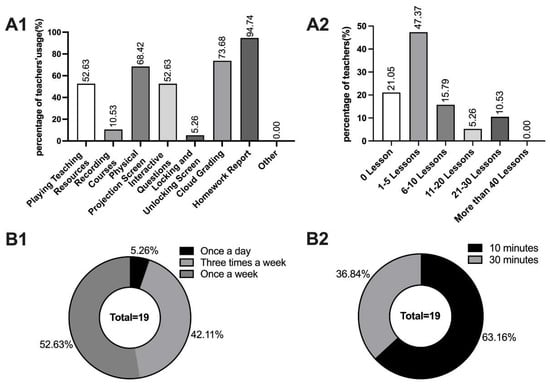
Figure 8.
Teachers’ usage of intelligent teaching systems. Note. (A1) The functional usage of AI intelligent teaching systems by teachers; (A2) the frequency of teachers using AI intelligent teaching systems for class instruction; (B1) the frequency of teachers using AI intelligent teaching systems to assign homework; (B2) the duration of teachers reading AI-generated homework reports.
Compared to other applications, 68.42% of teachers opted for the utilization of this instructional system in regular classes, while its usage for external demonstrations, teaching research activities, or non-self-initiated purposes was relatively limited. This finding suggests that the intelligent teaching system’s report interpretation feature can enhance teachers’ classroom efficiency and stimulate their interest in incorporating it into daily instruction. Additionally, teachers were surveyed regarding the number of classes they taught using the intelligent teaching system, as depicted in Figure 8(A2). The majority (47.3%) reported utilizing it for 1-5 classes per year, with no instances of non-usage among participants. A minority of educators employed the system more frequently for instructional purposes. Data analysis reveals a higher adoption rate of the precise teaching mode by teachers in the intervention group; however, only a small proportion utilized it frequently.
The teacher was asked about the frequency and duration of using intelligent homework support in teaching, and the pie chart (Figure 8(B1,B2)) shows that most teachers can maintain a normal frequency of using intelligent systems for precise teaching, such as once a week or three times a week. A total of 63% of teachers believe that reading homework reports in the intelligent system takes them 10 min, which proves that the intelligent system is easy to use and useful.
5. Discussion
The present study promotes the deep integration of technology and teaching, and builds an easy-to-use, useful, and user-friendly precision teaching model, which places teachers as the primary actors, parents as assistants, and students as the subjects. It collects data throughout the entire process of pre-class, in-class, and post-class teaching activities and conducts comprehensive data mining and analysis to create user profiles for different roles involved in educational activities, which empowers (1) teachers with real-time and accurate student learning data to adjust their teaching goals and designs accordingly, thereby achieving individualized and efficient instruction. (2) Parents can regularly monitor their children’s learning progress while providing appropriate guidance, care, and supervision. (3) Students can experience personalized development by organizing their learning progression under the guidance of teachers and parents while selecting suitable learning paths based on their abilities. The technology-supported precision teaching model construction addresses study question (1) and is detailed in Part 2 of this study. To investigate study question (2), the impact of the precision teaching model on teaching and learning was analyzed as below from the perspectives of two primary subjects: teachers and students.
5.1. Measures 1 and 2
After one year of application of the precision teaching model, the teaching effect of intervention class is remarkable; the t-test in Section 4.1. analyzed the significant difference between the mean scores of the intervention group (classes 1–6) and the control group (classes 7–9) in pre-test and post-test, from the perspective of the four disciplines of mathematics, physics, chemistry and biology. The comparative analysis compares the difference between the average score before and after the test and the average score of the grade, and also analyzes the data of four subjects, both analysis results indicate that the post-test scores in mathematics, physics, chemistry, and biology have improved compared to the pre-test scores, with mathematics and chemistry showing significant enhancement, while the improvement in physics and biology is not significant. This suggests that the application of the precision teaching model generally has a positive effect on the teaching outcomes in science subjects, with the most noticeable improvement in the teaching of mathematics and chemistry. The regression analysis in Section 4.2. analyzed the frequency distribution of students with different scores and the trend in the fitting curve in mathematics and chemistry; taking the significantly improved subjects of mathematics and chemistry as the objects of analysis, the results indicate an increase in the proportion of high-achieving students and a decrease in the proportion of low-achieving students, supporting the effectiveness of the precision teaching model in enhancing science scores.
To explore the reasons for the differences in the effectiveness of score improvement in mathematics, physics, chemistry, and biology, the correlation analysis in Section 4.3 compared the frequency of the three most commonly used intelligent teaching system functions by teachers with the progress in scores across the four subjects. The three major functions frequently used by teachers, “homework assignment”, “homework questions” and “homework report viewed” can all effectively help improve the scores in all four subjects, among which the “homework questions” function is the main reason for the different score improvements in the four subjects.
The correlation analysis also analyzed the correlation between the average score difference pre- and post-tests of different classes in the intervention class (classes 1–6) and the students’ independent practice data of corresponding classes, as well as the correlation between the progress ranking of typical students in the subject and the corresponding students’ independent practice data, which indicated similar questions exercises, can effectively help students achieve personalized learning and improve their learning outcomes, but students also need to pay attention to improving the accuracy of their exercises, as personalized exercises only have a positive impact on the scores of mathematics, physics, and chemistry. The homework completion rate has a positive effect on the improvement of scores in mathematics and chemistry. Overall, the application of the precision teaching model in science teaching can promote students’ personalized learning outcomes, with particularly significant effects in mathematics and chemistry. For physics, attention should be focused on the learning outcomes that similar problem exercises and personalized exercises bring to students. As for biology, the emphasis should be on the practice of similar problems.
Incorporating the conclusions from the previous correlation analysis regarding the frequency of teachers’ use of different intelligent systems, teachers should allocate more time to selecting appropriate homework questions and reviewing homework reports. At the same time, based on the personalized learning outcomes of students, they should assign homework in appropriate amounts and with precision, provide feedback in class, ensure teaching effectiveness, and relieve students of excessive homework burdens, thus giving them more motivation to engage in self-directed learning. The implementation of the precision teaching model is a systematic activity that requires the coordination and cooperation of all roles to achieve the best results.
5.2. Measure 3
The impact of the precision teaching model on instructional effectiveness is closely intertwined with educators’ perceptions of the functionality and technological aspects of intelligent teaching systems. The questionnaire survey of the teachers on the use of intelligent systems aims to analyze the applicability of the system in the teaching environment from the perspectives of the teachers’ use of the system and their emotional and attitudinal dimensions. Through the analysis of the questionnaire data, it is indicated that the data presents a positive trend in terms of both teachers’ satisfaction with use and the usability and usefulness of the system, which indicates that this model exhibits lower implementation difficulties, while being highly useful for teachers by increasing efficiency and reducing workload, and also answers the initial research question of “how to bridge the gap between teachers’ insufficient digital literacy and the assistance of intelligent technology in the classroom?”. (1) From the perspective of the technology acceptance model (Davis, 1993), the use of intelligent systems has helped teachers better apply precision teaching models; (2) the application effects of precision teaching models using AI technology are well explained in Measures 1 and 2 of this chapter.
5.3. Limitations for Research
There are several limitations in this study that warrant further exploration. Firstly, the model construction and the integration with disciplines require additional investigation and refinement, and the effectiveness of the precision teaching model in the subjects of physics and biology needs to be supported by more data. Based on the conclusions of this study, different disciplines can be further developed into discipline-based precision teaching models; Secondly, as this study represents an initial exploration of model-based teaching practice, there is insufficient data to adequately verify the effectiveness of the teaching model, including limited information on students’ attitudes and ability change. Thirdly, this study tested and analyzed the effect data of teachers and students, two of the three roles in the precision teaching model, but did not test the effect data of parents; we anticipate future research efforts to address these limitations comprehensively.
6. Conclusions
This study, through theoretical and technical analysis, constructs an intelligent, precision diagnostic teaching model that covers the entire teaching process, which is an empirical study based on the high school science teaching scenario. The study verifies the effectiveness of the precision teaching model from the perspectives of teaching effectiveness, personalized learning outcomes, and user experience of the intelligent teaching system, proving the model’s positive impact on science teaching, and increasing the proportion of high-achieving students and decreasing the proportion of low-achieving students, especially in mathematics [59,60] and chemistry. It can help teachers to improve teaching efficiency and reduce burdens [10,60], support students’ personalized learning, and also points out that teachers should pay more attention to the effectiveness of intelligent homework, as assigning homework in appropriate amounts and with precision can help students be more motivated to engage in self-directed learning.
Supplementary Materials
The following supporting information can be downloaded at: https://www.mdpi.com/article/10.3390/app14177544/s1, Questionnaire S1: Intelligent Classroom System Application Survey Questionnaire.
Author Contributions
Conceptualization, M.H.; methodology, M.H.; validation, Y.W.; formal analysis, M.H. and Y.W.; resources, Y.W.; writing—original draft preparation, M.H.; writing—review and editing, J.P.; visualization, M.H.; supervision, J.P.; project administration, M.H.; funding acquisition, J.P. All authors have read and agreed to the published version of the manuscript.
Funding
This research was financially supported by Macao Foundation’s research project “Research on the Construction of ‘Deep Classroom’ Teaching model and the current situation and Development Strategy of University Students digital competency in the Guangdong-Hong Kong-Macao Greater Bay Area” (Number: MF2342).
Institutional Review Board Statement
Not applicable.
Informed Consent Statement
Not applicable.
Data Availability Statement
The original contributions presented in the study are included in the article; further inquiries can be directed to the corresponding author.
Conflicts of Interest
The authors declare no conflicts of interest.
References
- Schmitz, M.-L.; Antonietti, C.; Cattaneo, A.; Gonon, P.; Petko, D. When barriers are not an issue: Tracing the relationship between hindering factors and technology use in secondary schools across Europe. Comput. Educ. 2022, 179, 104411. [Google Scholar] [CrossRef]
- European Commission. European Commission 2nd Survey of Schools–ICT in Education–Objective 1–Benchmark Progress in ICT in Schools, Final Report; Publications Office: Luxembourg, 2019. [Google Scholar]
- European Commission. EU European Commission Survey of Schools–ICT in Education–Benchmarking Access, Use and Attitudes to Technology in Europe’s Schools; Publications Office of the European Union: Luxembourg, 2013. [Google Scholar]
- Zhan, Z.; Tong, Y.; Lan, X.; Zhong, B. A systematic literature review of game-based learning in Artificial Intelligence education. Interact. Learn. Environ. 2024, 32, 1137–1158. [Google Scholar] [CrossRef]
- Park, W.; Kwon, H. Implementing artificial intelligence education for middle school technology education in Republic of Korea. Int. J. Technol. Des. Educ. 2024, 34, 109–135. [Google Scholar] [CrossRef]
- Cook, C.R.; Kilgus, S.P.; Burns, M.K. Advancing the science and practice of precision education to enhance student outcomes. J. Sch. Psychol. 2018, 66, 4–10. [Google Scholar] [CrossRef]
- Hwang, G.-J.; Xie, H.; Wah, B.W.; Gašević, D. Vision, challenges, roles and research issues of Artificial Intelligence in Education. Comput. Educ. Artif. Intell. 2020, 1, 100001. [Google Scholar] [CrossRef]
- Guan, C.; Mou, J.; Jiang, Z. Artificial intelligence innovation in education: A twenty-year data-driven historical analysis. Int. J. Innov. Stud. 2020, 4, 134–147. [Google Scholar] [CrossRef]
- Tsai, S.-C.; Chen, C.-H.; Shiao, Y.-T.; Ciou, J.-S.; Wu, T.-N. Precision education with statistical learning and deep learning: A case study in Taiwan. Int. J. Educ. Technol. High. Educ. 2020, 17, 12. [Google Scholar] [CrossRef]
- Lu, O.H.; Huang, A.Y.; Huang, J.C.; Lin, A.J.; Ogata, H.; Yang, S.J. Applying Learning Analytics for the Early Prediction of Students’ Academic Performance in Blended Learning. J. Educ. Technol. Soc. 2018, 21, 220–232. [Google Scholar]
- Forero-Corba, W.; Bennasar, F.N. Techniques and Applications of Machine Learning and Artificial Intelligence in Education: A Systematic Review. RIED-Rev. Iberoam. Educ. Distancia 2024, 27, 1–19. [Google Scholar]
- Deepika, A.; Kandakatla, R.; Saida, A.; Reddy, V.B. Implementation of ICAP Principles through Technology Tools: Exploring the Alignment between Pedagogy and Technology. J. Eng. Educ. Transform. 2021, 34, 542. [Google Scholar] [CrossRef]
- Hew, K.F.; Lan, M.; Tang, Y.; Jia, C.; Lo, C.K. Where is the “theory” within the field of educational technology research? Br. J. Educ. Technol. 2019, 50, 956–971. [Google Scholar] [CrossRef]
- Chen, X.; Xie, H.; Zou, D.; Hwang, G.-J. Application and theory gaps during the rise of Artificial Intelligence in Education. Comput. Educ. Artif. Intell. 2020, 1, 100002. [Google Scholar] [CrossRef]
- Schunk, D.H. Learning Theories an Educational Perspective, 8th ed.; Pearson Education, Inc.: London, UK, 2020. [Google Scholar]
- Sønderlund, A.L.; Hughes, E.; Smith, J. The efficacy of learning analytics interventions in higher education: A systematic review. Br. J. Educ. Technol. 2019, 50, 2594–2618. [Google Scholar] [CrossRef]
- Viberg, O.; Hatakka, M.; Bälter, O.; Mavroudi, A. The Current Landscape of Learning Analytics in Higher Education. Comput. Hum. Behav. 2018, 89, 98–110. [Google Scholar] [CrossRef]
- Luan, H.; Tsai, C.-C. A Review of Using Machine Learning Approaches for Precision Education. Educ. Technol. Soc. 2021, 24, 250–266. [Google Scholar]
- Shan, S.; Liu, Y. Blended Teaching Design of College Students’ Mental Health Education Course Based on Artificial Intelligence Flipped Class. Math. Probl. Eng. 2021, 2021, 1–10. [Google Scholar] [CrossRef]
- Dong, X. Application of Precision Teaching Under the Guidance of Big Data in The Course of Internal Medicine Nursing. Front. Bus. Econ. Manag. 2022, 5, 37–39. [Google Scholar] [CrossRef]
- Wei, X.; Jiang, J.; Zhang, L.; Feng, H. Research on Precision Teaching Management Methods in Universities in the Era of Big Data Based on Entropy Weight Method. In Frontiers in Artificial Intelligence and Applications; Grigoras, G., Lorenz, P., Eds.; IOS Press: Amsterdam, The Netherlands, 2023; ISBN 978-1-64368-444-4. [Google Scholar]
- Yanfei, M. Online and Offline Mixed Intelligent Teaching Assistant Mode of English Based on Mobile Information System. Mob. Inf. Syst. 2021, 2021, 7074629. [Google Scholar] [CrossRef]
- Wang, Y.; Xiao, L.; Mo, S.; Shen, Y.; Tong, G. Research on the Effectiveness of Precision Teaching Model Empowered by e-Schoolbag—A Case Study of Mathematics Review Lessons in Junior High School. China Educ. Technol. 2019, 5, 106–113+119. Available online: https://qikan.cqvip.com/Qikan/Article/Detail?id=7002036138 (accessed on 20 August 2024).
- Lindsley, O.R. Precision teaching: Discoveries and effects. J. Appl. Behav. Anal. 1992, 25, 51–57. [Google Scholar] [CrossRef]
- Kubina, R.M.; Yurich, K.K. Precision Teaching Book; Greatness Achieved Publishing Company Lemont: Pittsburgh, PA, USA, 2012; ISBN 0-615-55420-2. [Google Scholar]
- Yin, B.; Yuan, C.-H. Precision Teaching and Learning Performance in a Blended Learning Environment. Front. Psychol. 2021, 12, 631125. [Google Scholar] [CrossRef]
- Binder, C.; Watkins, C.L. Precision Teaching and Direct Instruction: Measurably Superior Instructional Technology in Schools. Perform. Improv. Q. 1990, 3, 74–96. [Google Scholar] [CrossRef]
- Hughes, J.C.; Beverley, M.; Whitehead, J. Using precision teaching to increase the fluency of word reading with problem readers. Eur. J. Behav. Anal. 2007, 8, 221–238. [Google Scholar] [CrossRef]
- Liu, C.; Zhang, L. Research Focuses and Future Directions of Precision Teaching in China: A Visualized Analysis Based on CiteSpace. J. Suzhou Vocat. Univ. 2023, 34, 72–78. [Google Scholar]
- Guo, L.; Yang, X.; Zhang, Y. Analysis on New Development and Value Orientation of Precision Teaching in the Era of Big Data. E-Educ. Res. 2019, 40, 76–81+88. [Google Scholar]
- Yang, X.; Luo, J.; Liu, Y.; Chen, S. Data-Driven Instruction: A New Trend of Teaching Paradigm in Big Data Era. E-Educ. Res. 2017, 38, 13–20+26. [Google Scholar]
- Zhang, X.; Mou, Z. The Research on the Design of Precise Instruction Model Facing Personalized Learning under the Data Learning Environment. Mod. Distance Educ. 2018, 5, 65–72. Available online: https://qikan.cqvip.com/Qikan/Article/Detail?id=676261576 (accessed on 20 August 2024).
- Yang, Z.; Wang, J.; Wu, D.; Wang, M. Developing Intelligent Education to Promote Sustainable Development of Education. E-Educ. Res. 2022, 43, 5–10+17. [Google Scholar]
- Shemshack, A.; Spector, J.M. A systematic literature review of personalized learning terms. Smart Learn. Environ. 2020, 7, 1–20. [Google Scholar] [CrossRef]
- Gallagher, E. Improving a mathematical key skill using precision teaching. Ir. Educ. Stud. 2006, 25, 303–319. [Google Scholar] [CrossRef]
- Strømgren, B.; Berg-Mortensen, C.; Tangen, L. The Use of Precision Teaching to Teach Basic Math Facts. Eur. J. Behav. Anal. 2014, 15, 225–240. [Google Scholar] [CrossRef][Green Version]
- Gist, C.; Bulla, A.J. A Systematic Review of Frequency Building and Precision Teaching with School-Aged Children. J. Behav. Educ. 2022, 31, 43–68. [Google Scholar] [CrossRef]
- Yang, S.J.H. Precision Education: New Challenges for AI in Education [Conference Keynote]. In Proceedings of the 27th International Conference on Computers in Education (ICCE), Kenting, Taiwan, 2–6 December 2019; Asia-Pacific Society for Computers in Education (APSCE): Taoyuan City, Taiwan, 2019; pp. XXVII–XXVIII. [Google Scholar]
- Peng, X.; Wu, B. How Is Data-Driven Precision Teaching Possible?From the Perspective of Cultivating Teacher’s Data Wisdom. J. East China Norm. Univ. Sci. 2021, 39, 45–56. [Google Scholar]
- Taber, K.S. Mediated Learning Leading Development—The Social Development Theory of Lev Vygotsky. In Science Education in Theory and Practice: An Introductory Guide to Learning Theory; Springer: Cham, Switzerland, 2020; pp. 277–291. [Google Scholar]
- Ness, I.J. Zone of Proximal Development. In The Palgrave Encyclopedia of the Possible; Springer: Berlin/Heidelberg, Germany, 2023; pp. 1781–1786. [Google Scholar]
- Liu, N.; Yu, S. Research on Precision Teaching Based on Zone of Proximal Development. E-Educ. Res. 2020, 41, 77–85. [Google Scholar]
- Liu, H.; Sun, J.; Chen, J.; Zhang, Y. Persona Model and Its Application in Library. Libr. Theory Pract. 2018, 92, 97. Available online: https://qikan.cqvip.com/Qikan/Article/Detail?id=7000905917 (accessed on 20 August 2024).
- Liu, H.; Sun, J.; Su, Y.; Zhang, Y. A Multi Contextual Interest Recommender Method for Library Big Data Knowledge Service. J. Mod. Inf. 2018, 38, 62–67,156. [Google Scholar]
- Liu, H.; Sun, J.; Su, Y.; Zhang, Y. Research on the Tourism Situational Recommendation Service Based on Persona. Inf. Stud. Theory Appl. 2018, 41, 87–92. [Google Scholar]
- Liu, H. Contextual Recommendation for the Big Data Knowledge Service Oriented the Cloud Computing. Libr. Dev. 2014, 31–35. Available online: https://qikan.cqvip.com/Qikan/Article/Detail?id=661733950 (accessed on 20 August 2024).
- Liu, H.; Liu, X.; Yao, S.; Xie, S. Statistical Analysis of Information Behavior Characteristics of Online Social Users Based on Public Opinion Portrait. J. Mod. Inf. 2019, 39, 64–73. [Google Scholar]
- Liu, H.; Sun, J.; Zhang, Y.; Zhao, P. Research on User Portrayal and Information Dissemination Behavior in Online Social Activities. Inf. Sci. 2018, 36, 17–21. [Google Scholar]
- Liu, H.; Huang, W.; Xie, S. Research on the Situational Recommendation-Oriented Library User Profiles. Res. Libr. Sci. 2018, 62–68. Available online: https://qikan.cqvip.com/Qikan/Article/Detail?id=676852789 (accessed on 20 August 2024).
- Erümit, A.K.; Çetin, I. Design framework of adaptive intelligent tutoring systems. Educ. Inf. Technol. 2020, 25, 4477–4500. [Google Scholar] [CrossRef]
- U.S. Department of Education, Office of Educational Technology. Transforming American Education: Learning Powered by Technology; U.S. Department of Education, Office of Educational Technology: Washington, DC, USA, 2010. [Google Scholar]
- Fei, L.; Ma, Y. Developing Personalized Learning to Promote Educational Equity: An Exploration of the Basic Theory and Practical Experience of Personalized Learning in the UK. Glob. Educ. 2010, 39, 42–46. Available online: https://qikan.cqvip.com/Qikan/Article/Detail?id=34931923 (accessed on 20 August 2024).
- Yu, S. Internet Plus Education: Future Schools; Publishing House of Electronics Industry: Beijing, China, 2019; ISBN 978-7-121-36043-5. [Google Scholar]
- Luan, H.; Geczy, P.; Lai, H.; Gobert, J.; Yang, S.J.; Ogata, H.; Baltes, J.; Guerra, R.; Li, P.; Tsai, C.-C. Challenges and Future Directions of Big Data and Artificial Intelligence in Education. Front. Psychol. 2020, 11, 580820. [Google Scholar] [CrossRef]
- Bray, B.; McClaskey, K. Personalization vs. Differentiation vs Individualization. Dostopno Na Httpeducation Ky Govschool-innovDocumentsBB-KM-Pers.-2012 Pdf Pridobljeno 12 10 2013 2012. Available online: https://www.marshfieldschools.org/cms/lib/WI01919828/Centricity/Domain/82/PL_Diff_Indiv.pdf (accessed on 20 August 2024).
- Li, y.; Zhang, S. Self-study and Adaptive Adjusting of Exam-question Difficulty Coefficient. Comput. Eng. 2005, 31, 181–182. [Google Scholar]
- Lourdusamy, R.; Magendiran, P. A systematic analysis of difficulty level of the question paper using student’s marks: A case study. Int. J. Inf. Technol. 2021, 13, 1127–1143. [Google Scholar] [CrossRef]
- Peng, J.; Sun, M.; Yuan, B.; Lim, C.P.; van Merriënboer, J.J.G.; Wang, M. Visible thinking to support online project-based learning: Narrowing the achievement gap between high- and low-achieving students. Educ. Inf. Technol. 2024, 29, 2329–2363. [Google Scholar] [CrossRef]
- Chiesa, M.; Robertson, A. Precision Teaching and Fluency Training: Making maths easier for pupils and teachers. Educ. Psychol. Pract. 2000, 16, 297–310. [Google Scholar] [CrossRef]
- Yang, Z. Empowering Teaching and Learning with Artificial Intelligence. Front. Digit. Educ. 2024, 1, 1–3. [Google Scholar]


Disclaimer/Publisher’s Note: The statements, opinions and data contained in all publications are solely those of the individual author(s) and contributor(s) and not of MDPI and/or the editor(s). MDPI and/or the editor(s) disclaim responsibility for any injury to people or property resulting from any ideas, methods, instructions or products referred to in the content. |
© 2024 by the authors. Licensee MDPI, Basel, Switzerland. This article is an open access article distributed under the terms and conditions of the Creative Commons Attribution (CC BY) license (https://creativecommons.org/licenses/by/4.0/).