Article

Improved Subsidence Assessment for More Reliable Excavation Activity in Tehran

Department of Mining and Geotechnical Engineering, University of Miskolc, H-3515 Miskolc, Hungary
*
Author to whom correspondence should be addressed.
Appl. Sci. 2024, 14(17), 7547; https://doi.org/10.3390/app14177547
Submission received: 19 July 2024 / Revised: 8 August 2024 / Accepted: 20 August 2024 / Published: 26 August 2024

Abstract

:
This paper presents a particular tunneling method, the new Austrian tunneling method (NATM), which plays an important role in reducing subsidence of the surface and damage to structures in urban areas. It has a wide range of applications in shallow tunneling projects all over the world. In this study, numerical modeling of the third-line Metro tunnel in Tehran, which is designed and stabilized by the NATM, is under discussion. The foregoing tunnel is excavated manually with a one-meter advancing step. In this project, the constructors use a lattice girder and spray concrete with 31 cm thickness as the initial lining. A suitable numerical software for this modeling is PLAXIS 3D Tunnel, which allows high-resolution finite element modeling (FEM) of the studied object. The performance of this method is investigated and compared with that of other NATMs. The numerical modeling yielded a value of 30.01 mm for earth subsidence in the most damaged area of the settlement, which was confirmed with a dramatically low difference by earth surface monitoring. Moreover, this tunnel was drilled and excavated using various methods, among which the least settlement was obtained by the proposed method. The results are promising, and they indicate that tunneling with this method should continue to be used to expand the subway line in the city.

1. Introduction

Reducing further congestion is part of the evolution of the urban environment. Subterranean buildings are utilized whenever feasible to alleviate traffic jams. In order to encounter as few barriers during implementation as feasible, it is imperative to have a comprehensive understanding of the geological environment prior to beginning construction. To provide the detailed results of the geological exploration, data collection is carried out using constantly evolving methodologies [1]. Because there is already a growing requirement for super-large-section tunnels to fulfil the increased transportation needs, tunnel design is also becoming more and more complex [2]. We have come to the point at which the networks of subterranean tunnels are overcrowded in many places. The construction of new tunnels frequently crosses existing ones, altering the geotechnical conditions, and in order to address the issues that emerge, new technological approaches must be employed [3].
Over the past several decades, subsidence has emerged as a significant issue affecting urban, coastal, and mining areas worldwide [4]. Because of ground deformation, tunnel construction, especially using weak materials, may have unintended repercussions on already-existing structures. Because stability, surface deformation, and efficient supports are necessary for safe tunnel design and construction, the ground settlement assessment and its impact on structures above the tunnel are crucial for tunnel projects [5]. Stratum loss, i.e., the discrepancy between the amount of excavated soil and the volume of the created tunnel, is thought to be the primary cause of land subsidence [6].
When feasible, tunnels should be driven full face; however, this is often not practical, especially on rough terrain, in which heading and benching must be used. It can even be required in the most challenging situations to drive a top pilot heading before opening it out to the entire sector [7]. It is common knowledge that a pile creates stresses around it by supporting the weight of the superstructure by transferring it to the ground. Conversely, tunneling is a stress-relieving procedure that causes ground movements surrounding the tunnel that spread through the soil to the ground surface [8,9]. To fulfil the requirements of significant projects in hydraulic engineering, transportation engineering, etc., in order to enhance the use of subterranean space and minimize backfilling, large-scale non-circular tunnels are currently becoming increasingly prevalent. To lessen the impact of excavation on the surrounding rock, the cross-section is sequentially excavated, typically using the drill and blast method, in a large-scale tunnel building project. In sequential excavation, the entire cross-section is divided into many portions, with excavation taking place over various periods for each segment [10,11,12,13].
The NATM building approach is highly adaptable to shifting cross-sectional geometries and subsurface circumstances. The shotcrete membrane’s main job when it interacts with the subsoil is to create a carrying arch around the tunnel. It is feasible to eliminate or significantly reduce bending moments and shearing forces in the shotcrete membrane by designing the tunnel’s cross-section in a way that maximizes its benefits. Thus, shotcrete membranes that are relatively thin can sustain huge subterranean holes. Additionally, surface sinking can be kept to relatively low levels with a suitable design. However, a successful tunnel heading using this method requires stability assessments, in which the subsoil–support interaction is modeled in a realistic manner. The authors firmly believe that only numerical calculation techniques can make this feasible. Therefore, finite element codes should be used for stability studies in general [14].
In his 1964 work, “The New Austrian Tunneling Method” (NATM), Rabcewicz presented the first cross-section of the NATM (Figure 1) in relation to an Austrian tunneling project. The NATM is used extensively in several nations to build tunnels through rocks and soil. This is mostly because it uses basic equipment and is adaptable to various ground conditions [7].
Because of its benefits, the NATM is frequently chosen. These benefits include the ability to instantly interface with tunnel support systems, modify support systems, and implement specific support configurations in accordance with the encountered ground types and adapt and change support types based on ground conditions [15]. However, experience demonstrates that it is crucial to understand its drawbacks and restrictions, which can call for adjustment because it might not work well in all geological settings [16].
Before face passage, a large portion of the ultimate stabilized settlement is induced. Only 3D analyses are able to replicate this sufficiently. Two-dimensional analyses are unable to capture important details such as load transfer in the longitudinal direction caused by soil arching. However, a suitable constitutive model is also crucial for an accurate displacement forecast. The most important single component examined in lowering induced settlements is the tunnel support lining. Even though the support is not yet fully operational, the displacements are smaller the closer the lining is to the face. The induced displacements are likewise significantly reduced by full activation with inverted closure [17]. In our further investigations, Figure 2 was utilized as the optimal method of staged excavation.
The information at hand is used to modify the driving parameters in order to maximize tunneling efficiency or to assure safety [18].
This implies that there is a minimal difference in good rock mass between support following the Q-system and the support following the NATM. Significant variations exist in the selection of supports between the Q-system and the NATM due to swelling rock mass situations. We believe that the NATM permits more flexible support in low-quality rock mass classes. At each advancement phase, a prompt and specific response to the various rock mass behavior types can be provided using the NATM [19].
Controlling settlements caused by tunnel excavation is the primary problem with tunneling in urban contexts, which are usually characterized by a low overburden thickness and the presence of surface infrastructure. An accurate prediction of the displacement field caused by tunneling is the first step toward designing any protective measure that lessens the impact of the tunnel on nearby buildings. The application of a sophisticated soil constitutive model, along with high-quality experimental data and 3D finite element analysis, has been demonstrated to produce forward-looking estimates of the displacement field caused by a tunnel with a low overburden thickness that are correct [20]. Iran’s Geological Organization states that Kahrizak silts completely blanket the land, just like in Tehran’s north. Currently, fine-grained, untidy sediments from the current alluvium are faintly covering this silt. Because of tectonic forces, the region’s soil is extremely compacted and very ancient. Additionally, the soil has a high over-consolidation ratio (OCR) due to pre-consolidation caused by the studies. Numerous deep underground canals in the field have collapsed and been damaged over time. Furthermore, the experiments demonstrate that the region is smooth and level despite the former rivers having been filled in with soil [21]. There is a discernible relationship between the design specifications and the prevailing stress conditions, as evidenced by the different priorities of the excavation methods based on the in situ stress levels [22]. This observation highlights the need in this specific area for a dynamic and adaptive approach to excavation design, which can be selected by numerical modeling.
This study introduces the new Austrian tunneling method (NATM), a specific tunneling technique that is very effective in minimizing surface subsidence and structural damage in metropolitan settings. This paper discusses the numerical modeling of Tehran’s third-line Metro tunnel, which is planned and stabilized using the NATM. PLAXIS 3D Tunnel is a good numerical software for this kind of modeling since it enables high-resolution finite element modeling (FEM) of the object under study. This method’s performance is examined and contrasted with that of other NATM techniques.

2. Numerical Modeling

For this study, PLAXIS 3D Tunnel (version 1.2) was utilized. PLAXIS 3D Tunnel is a specialized three-dimensional finite element computer program that is utilized to assess the stability and deformation for different kinds of tunnels in rock and soil. Although the program can be used for various geotechnical structures, it has features specifically designed for NATM and shield tunnels. Additionally, because soil is a multi-phase material, handling the hydrostatic and non-hydrostatic pore pressure in the soil requires specialized techniques. Many tunnel projects include the modeling of structures and the interaction between the structures and the soil, even though the modeling of the soil itself is a significant topic. Special characteristics of PLAXIS 3D Tunnel are designed to address the various facets of intricate geotechnical structures.
A practical way to construct both circular and non-circular tunnels out of arcs and lines is to use the PLAXIS 3D Tunnel program. To simulate the tunnel lining and its interaction with the surrounding soil, plates and interfaces can be incorporated. Curved boundaries within the mesh are modeled by fully isoperimetric elements. A range of pragmatic techniques have been employed to examine the distortion resulting from the tunnel’s construction. Additionally, by turning on and off groups of pieces, the staged construction function makes it possible to simulate the construction and excavation processes in a realistic manner. Furthermore, the application of loads enables a practical evaluation of the stresses and displacements brought by, for instance, tunnel excavation or subterranean building [23].

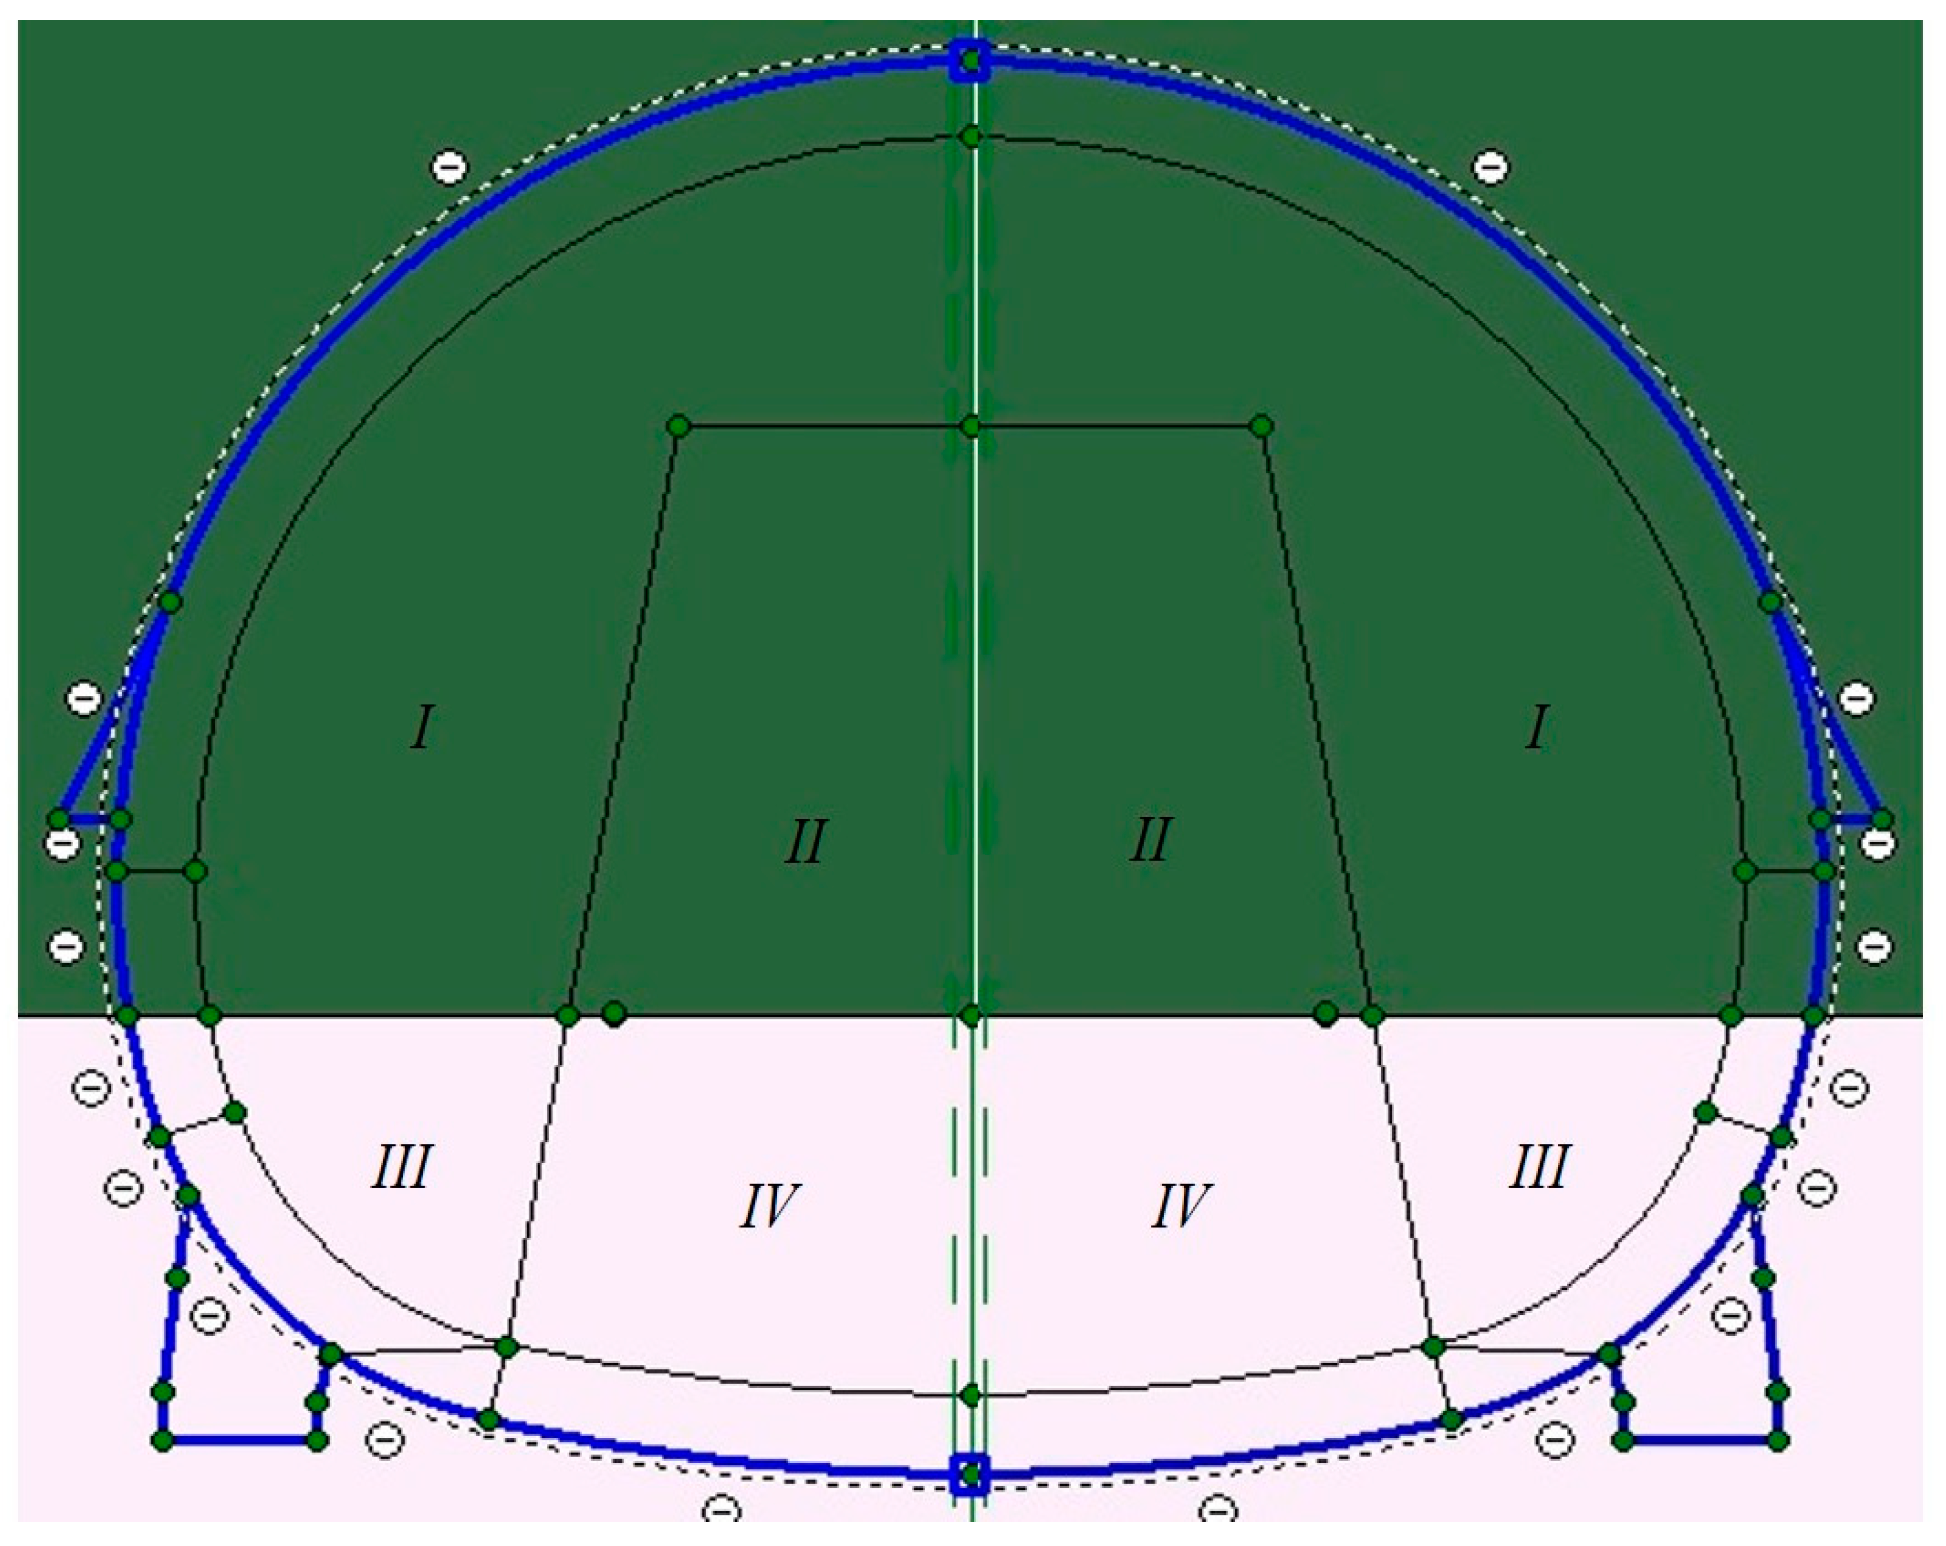
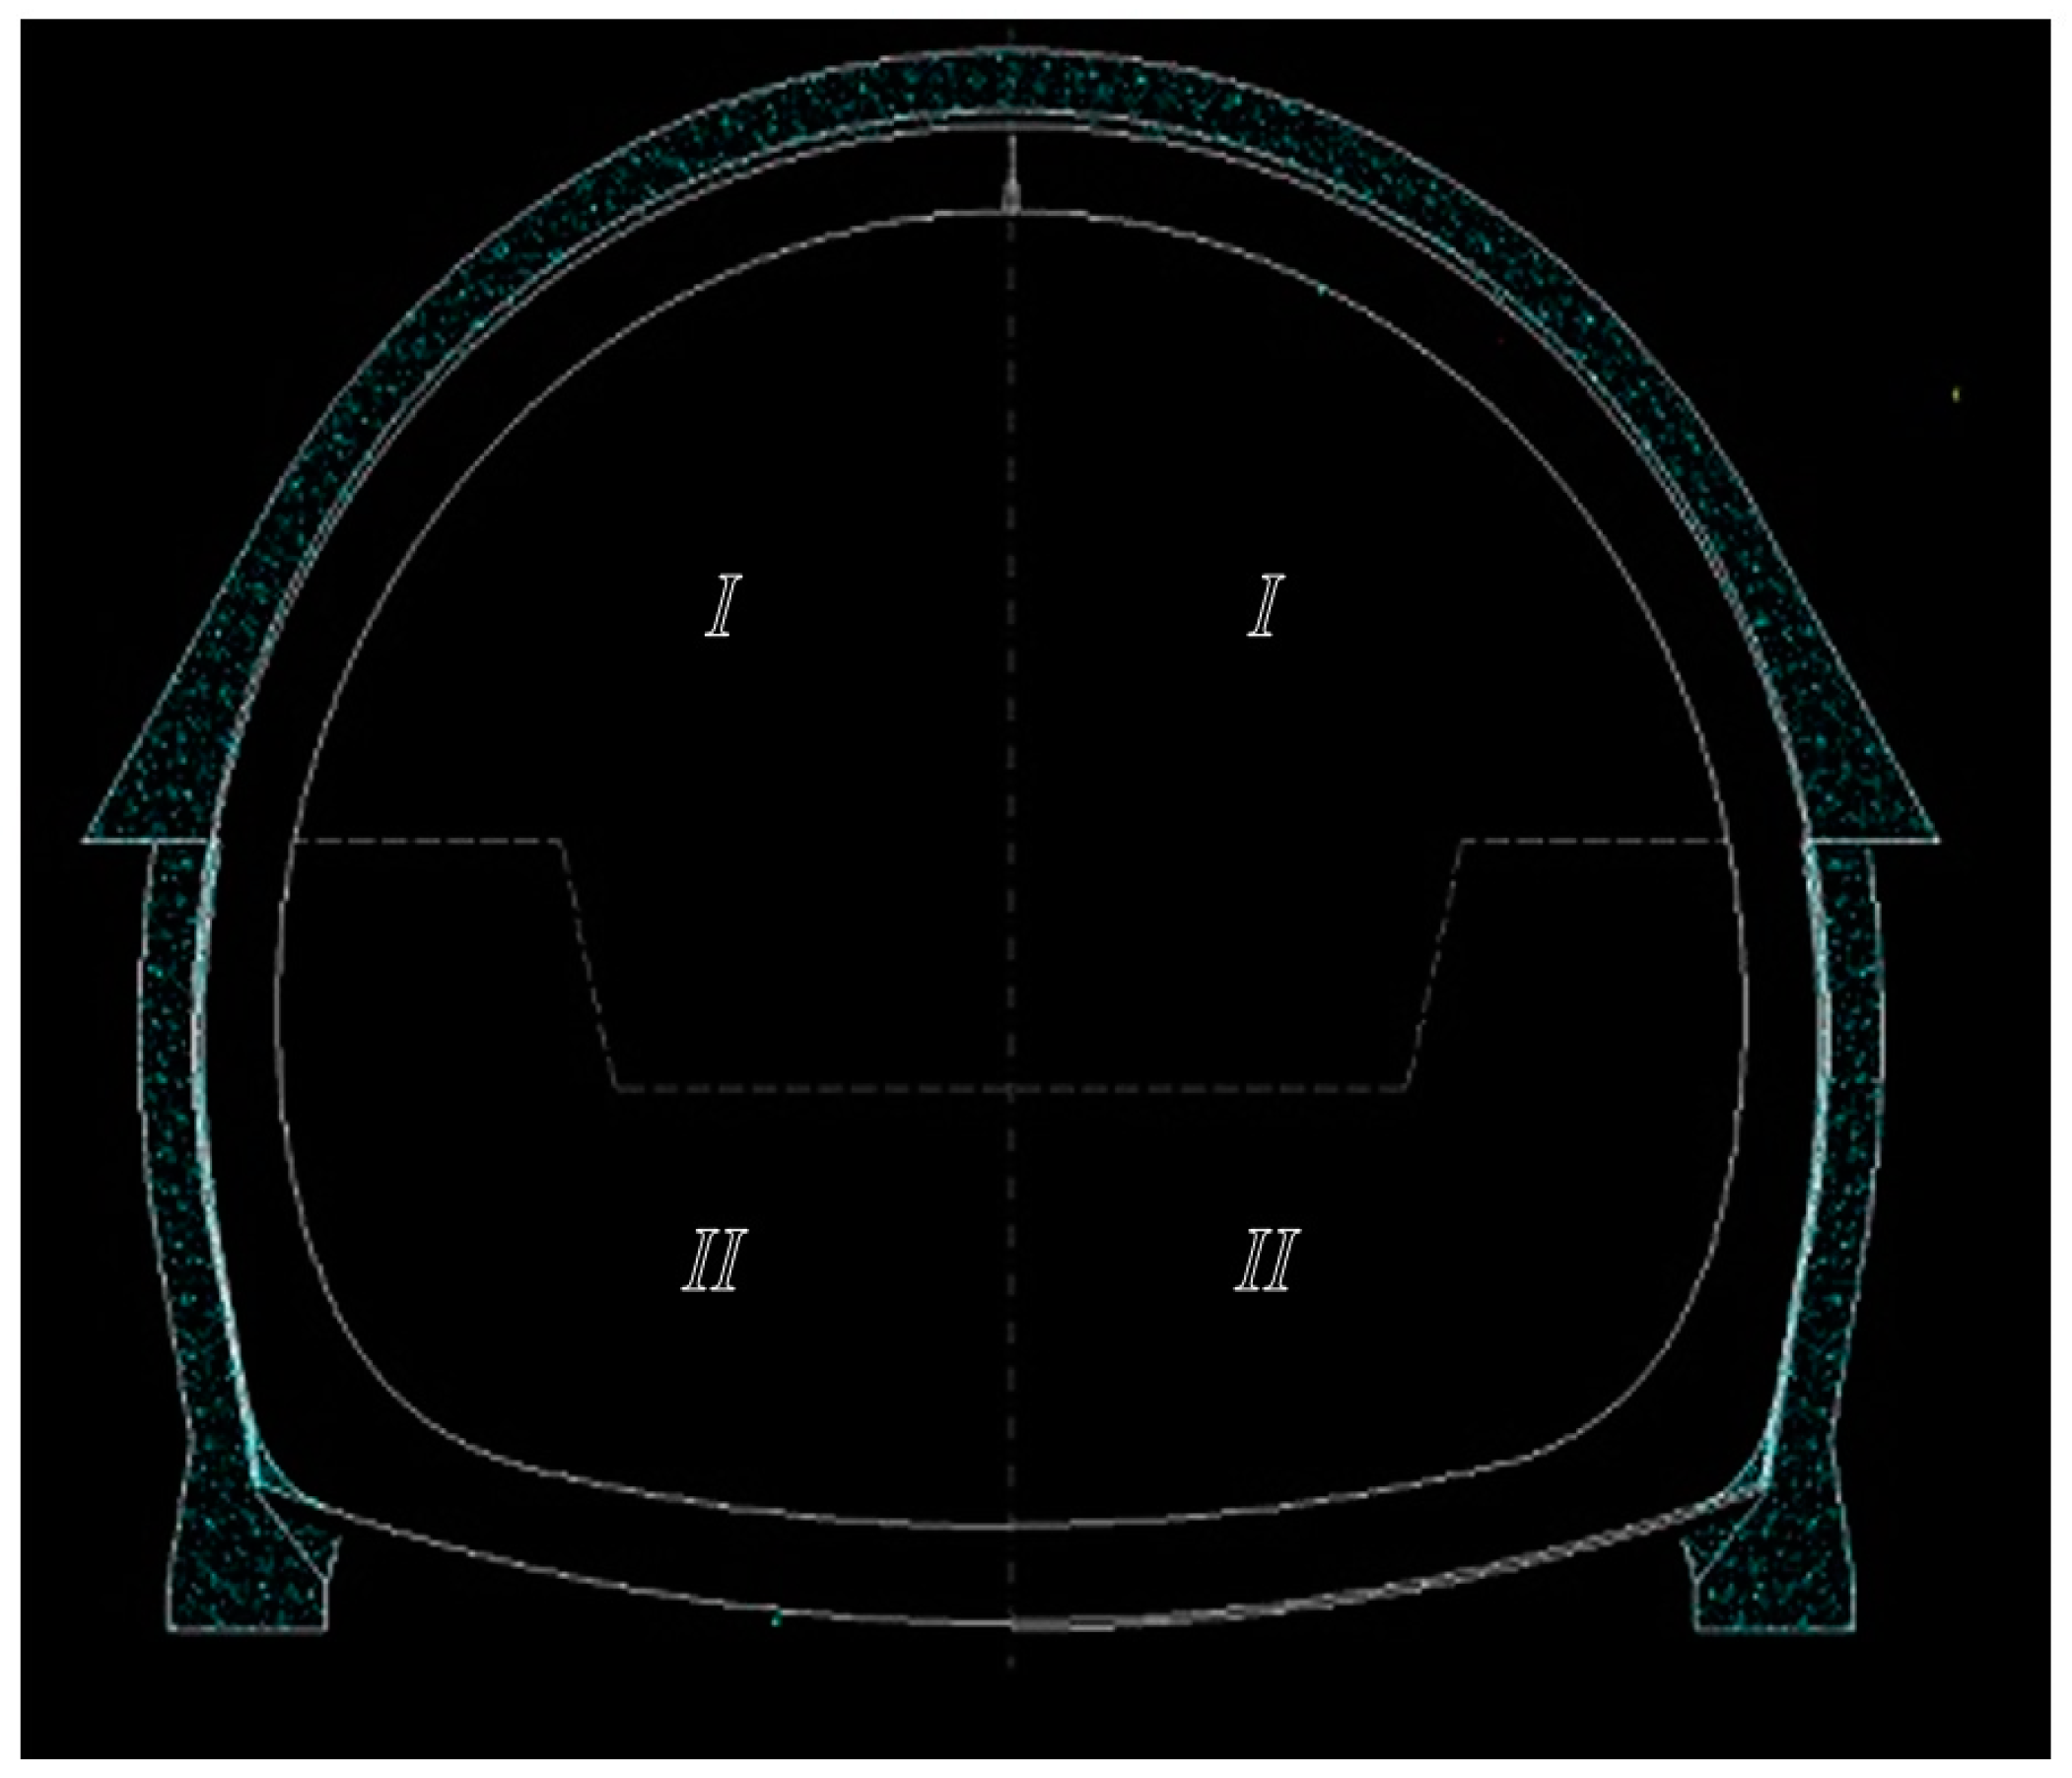
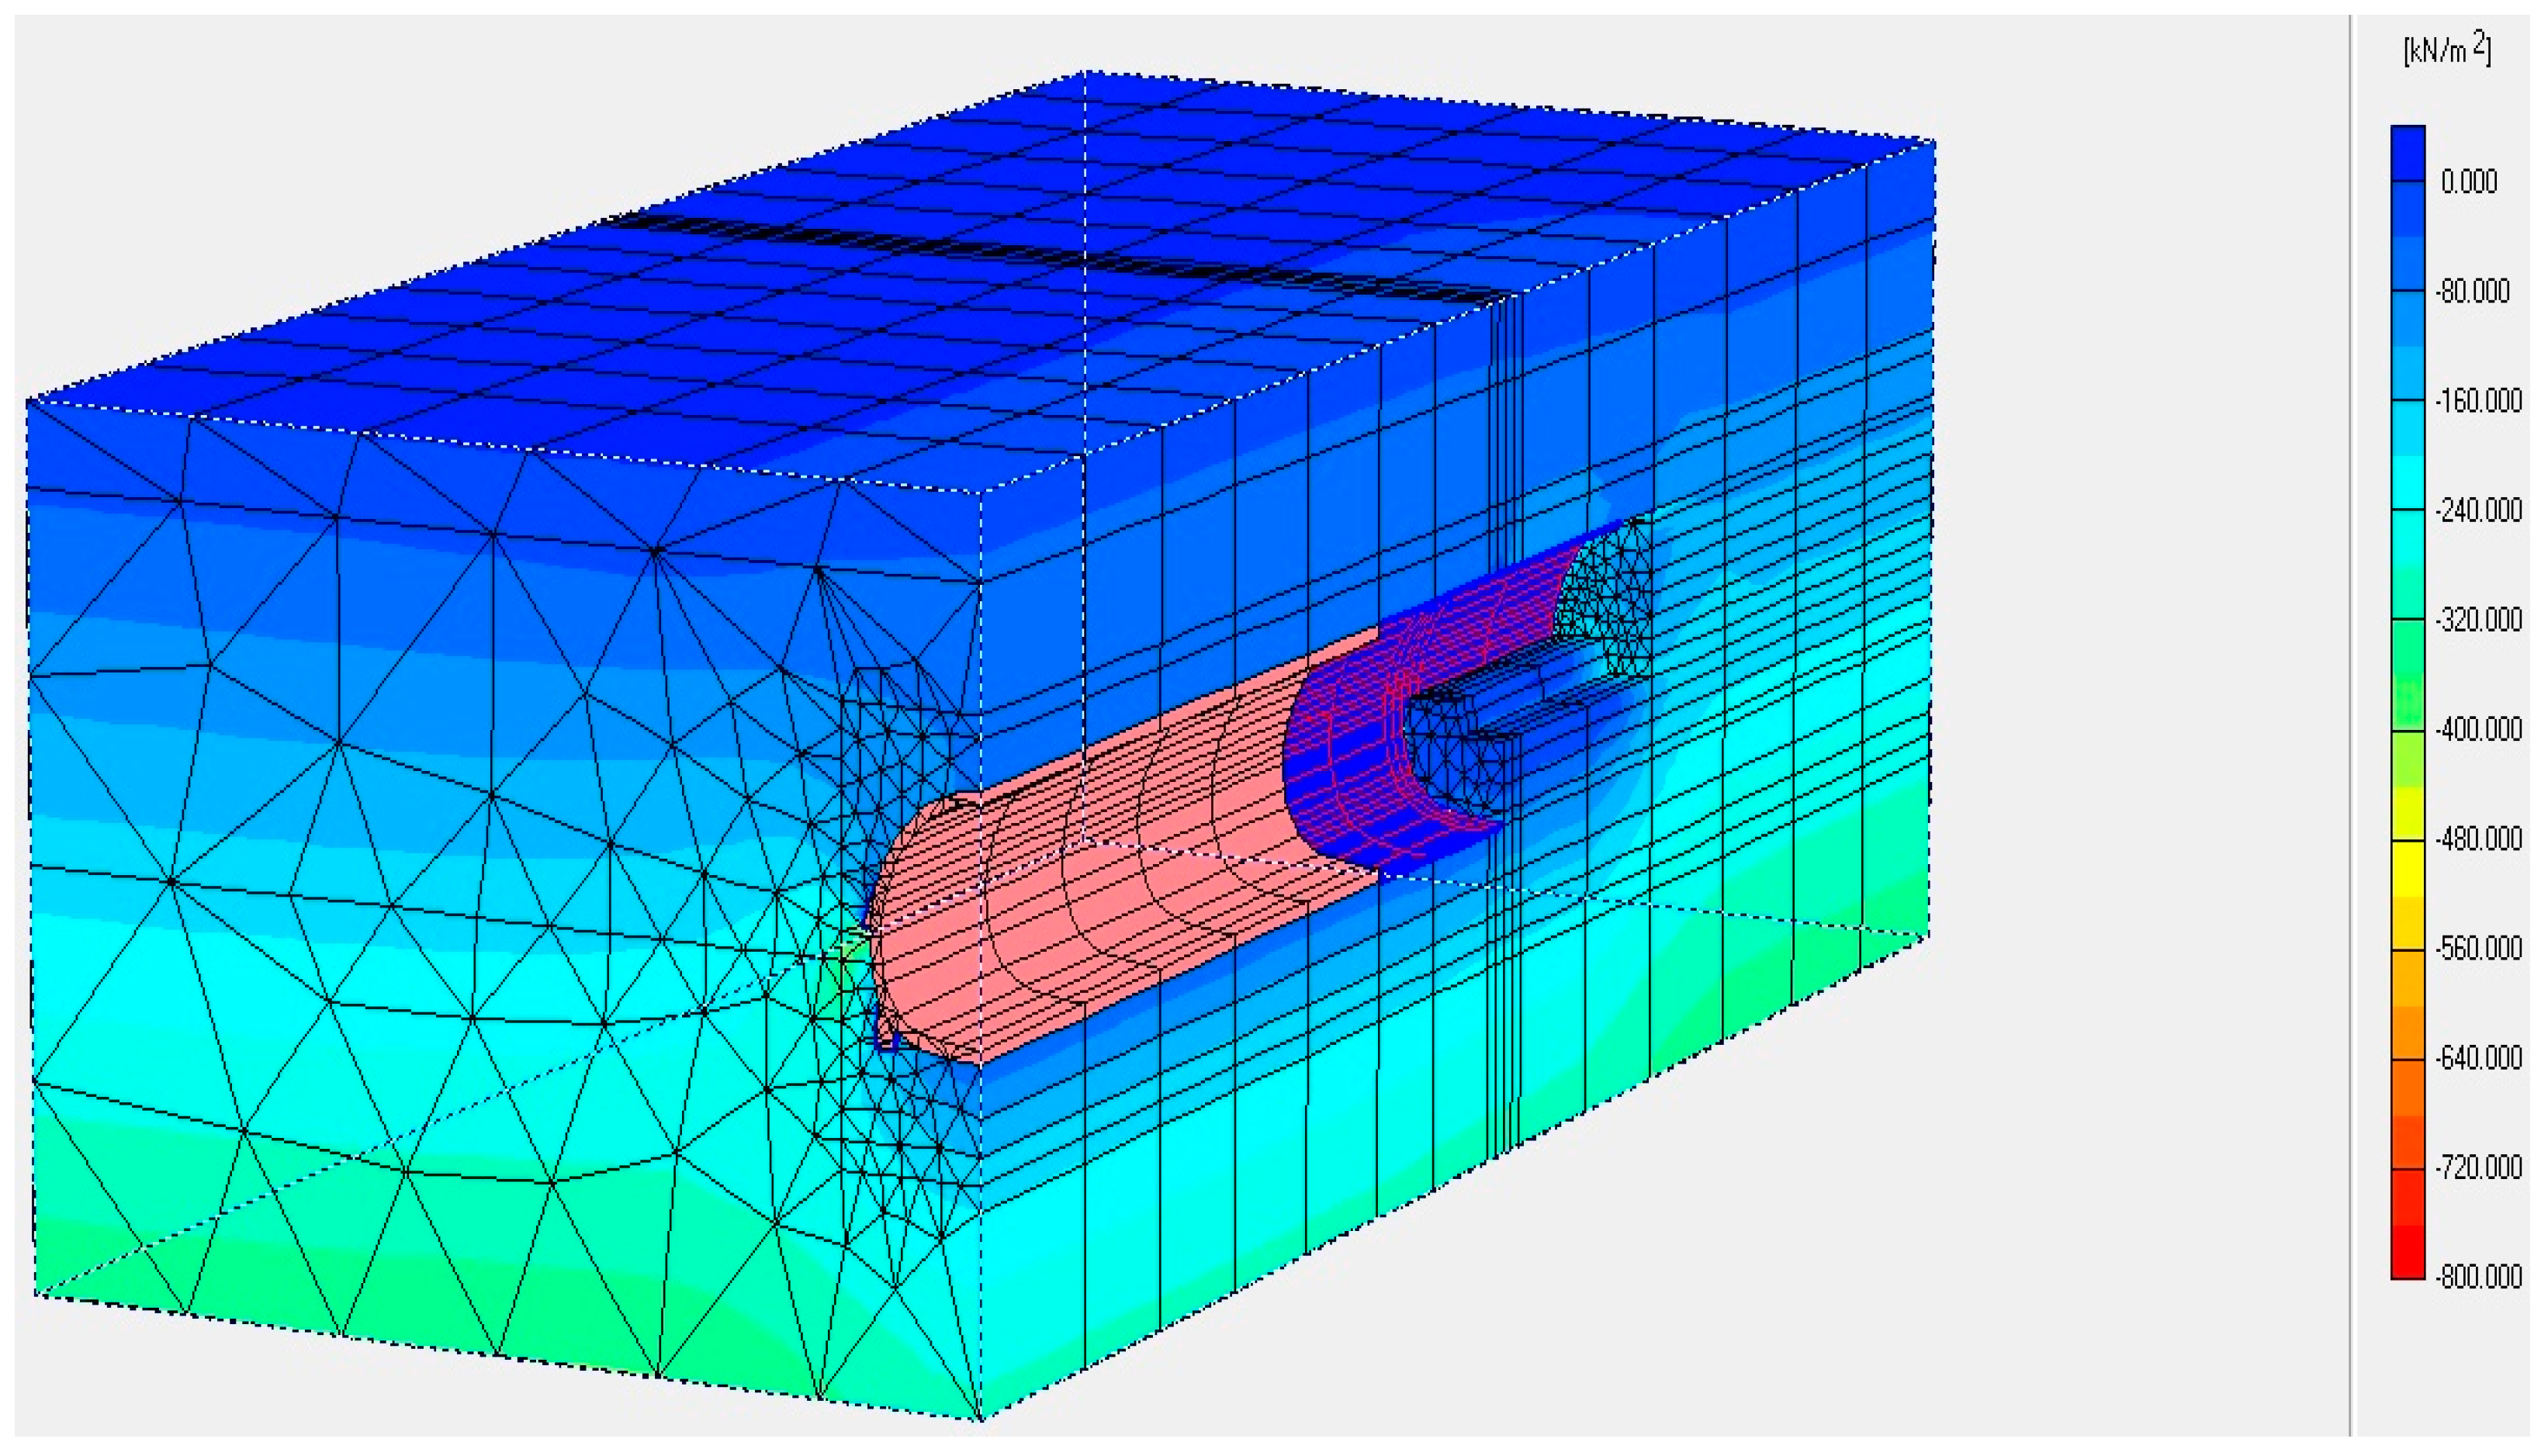
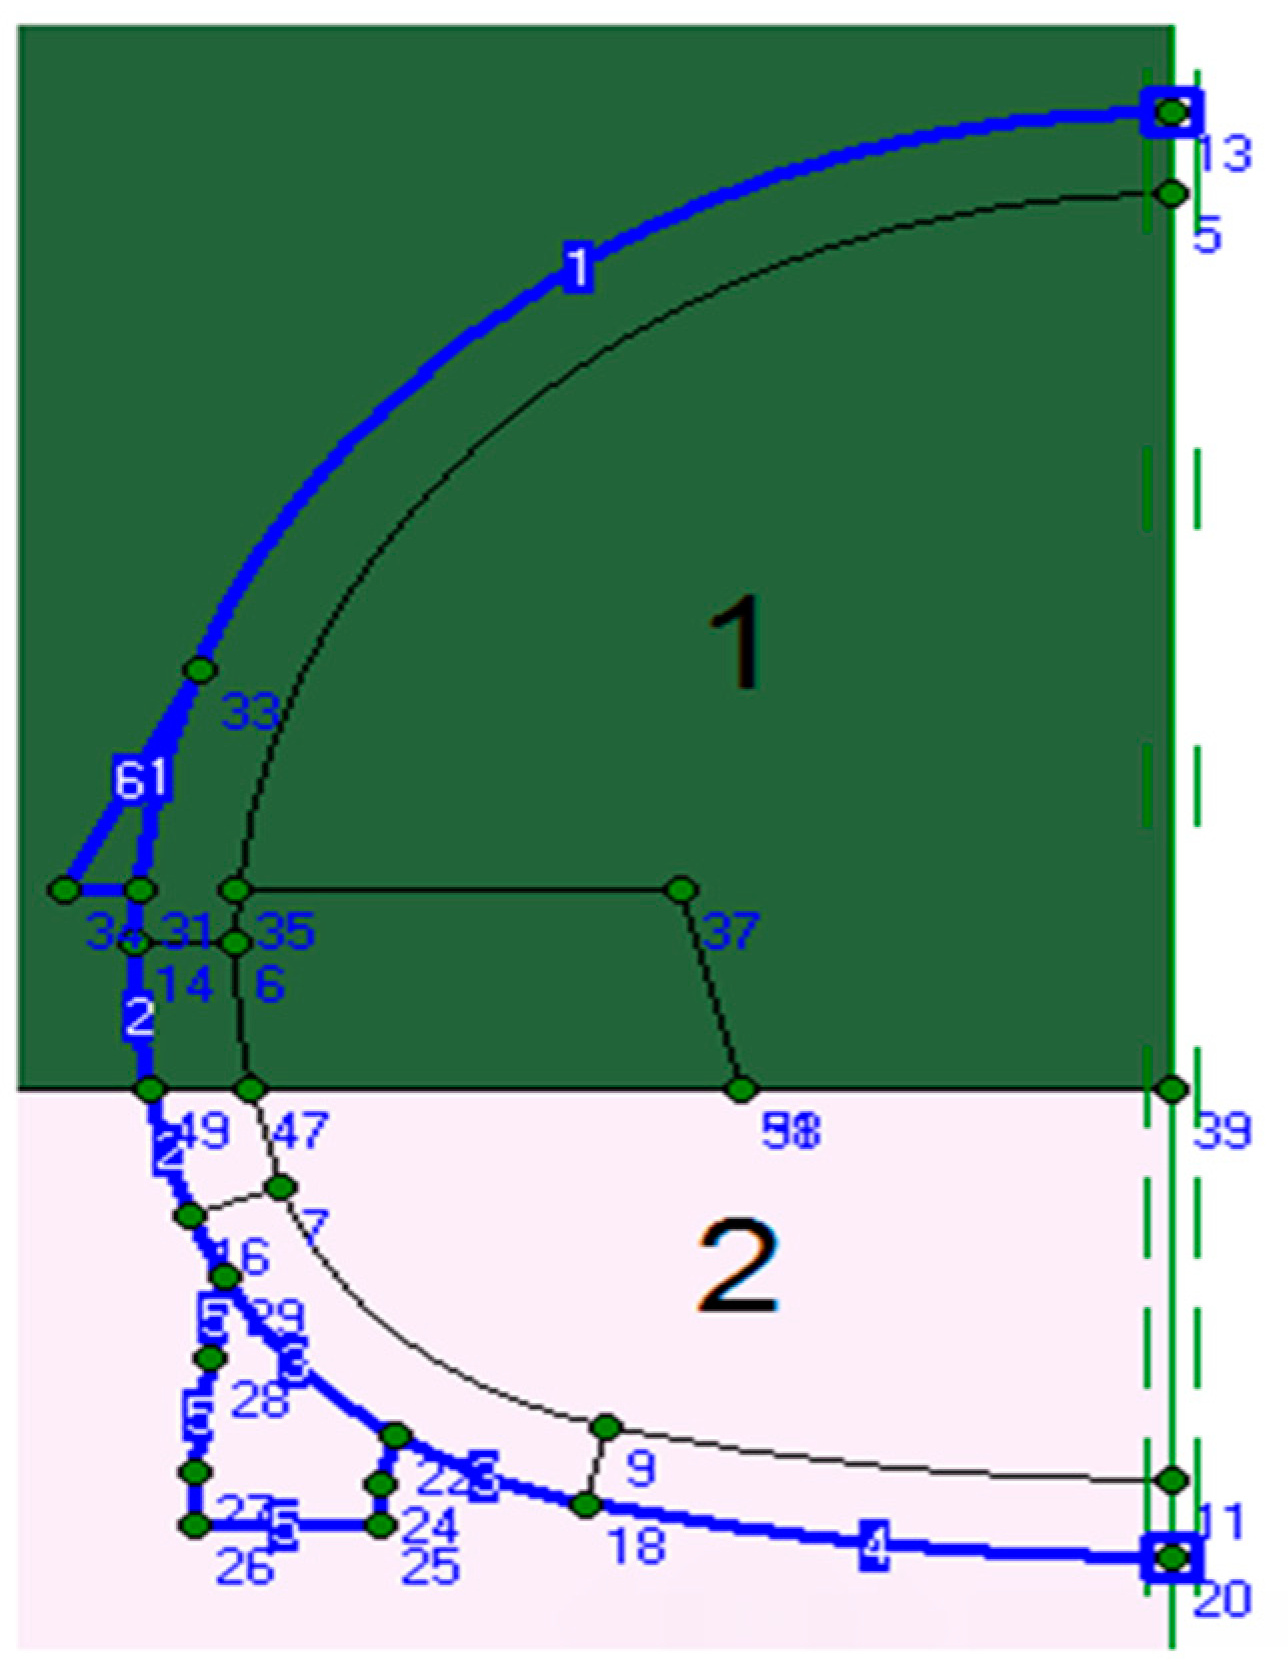
2.1. Creating the Model and Generating the Mesh

The two-dimensional pattern of the tunnel designed for the project is in Figure 3. According to the pattern, the height of the tunnel was 8.335 m and its width was 8.593 m. Also, the thickness of concrete applied for this tunnel was 500 mm, and the thickness of sprayed concrete (shotcrete) was 310 mm [24].
After the creation of the geometry of the model, a finite element model composed of six-node triangles can automatically be generated, based on the composition of clusters and lines in the geometry model [23]. Due to the fact that the geometry was symmetrical, only one-half of the model was created. Symmetry conditions were also adopted in the center plane (Figure 4). The Mohr–Coulomb model was accomplished because of the soil condition and the region. Moreover, it was assumed that the soil’s behavior was semi-continuous; hence, the Mohr–Coulomb model was considered for this region.

2.2. Material Parameters

Some data about the soil layers needed to be input in the software. The soil is mixed mostly with clay and silt, i.e., the tunnel’s surrounding soil is weak, and the best method for excavation is the NATM, because this method meets the requirements of economic efficiency and safety in this kind of earth situation. There were three soil layers, and their parameters are presented in Table 1 [21].
Also, the data associated with first and final supports are given in Table 2 [24].
The definitions of these parameters are shown in Table 3.

3. Subsidence Calculation Due to the Excavation Procedure in the Project

At first, the excavation pattern of the project was modeled in PLAXIS in order to determine the subsidence; then, this subsidence was compared with the subsidence in the instrument report. According to the excavation method employed in the project, first, the top part was excavated; then, after 14 m, the bench part followed [25]. Figure 5 shows only half of the tunnel.
We developed the model based on the symmetry of the geometry. After the geometry creation, the mesh was generated, and then, the parameters were input to develop a realistic output model in the third dimension just like in Figure 4.
After the calculation process, the output was represented as figures. Figure 6 shows a longitudinal profile, in which the vertical axis shows the settlement, and the horizontal axis shows the length of the tunnel. Figure 7 shows the cross-section of the most subsided area, in which the vertical axis stands for the surface settlement, and the horizontal axis indicates the distance from the zero axis, which means the tunnel axis.
The maximum settlement of the surface was 32.9 mm according to the monitoring and instrumentation report (Monitoring and instrumenting of tunnel behavior, CVR consultant engineers, design consultant of Tehran third south subway line [24,25]). On the other hand, the subsidence obtained from PLAXIS was 30.01 mm regarding Figure 6 and Figure 7. So, not only is PLAXIS 3D Tunnel reliable for this region, but these numbers are also an approval for the validation and accuracy of modeling with this software.

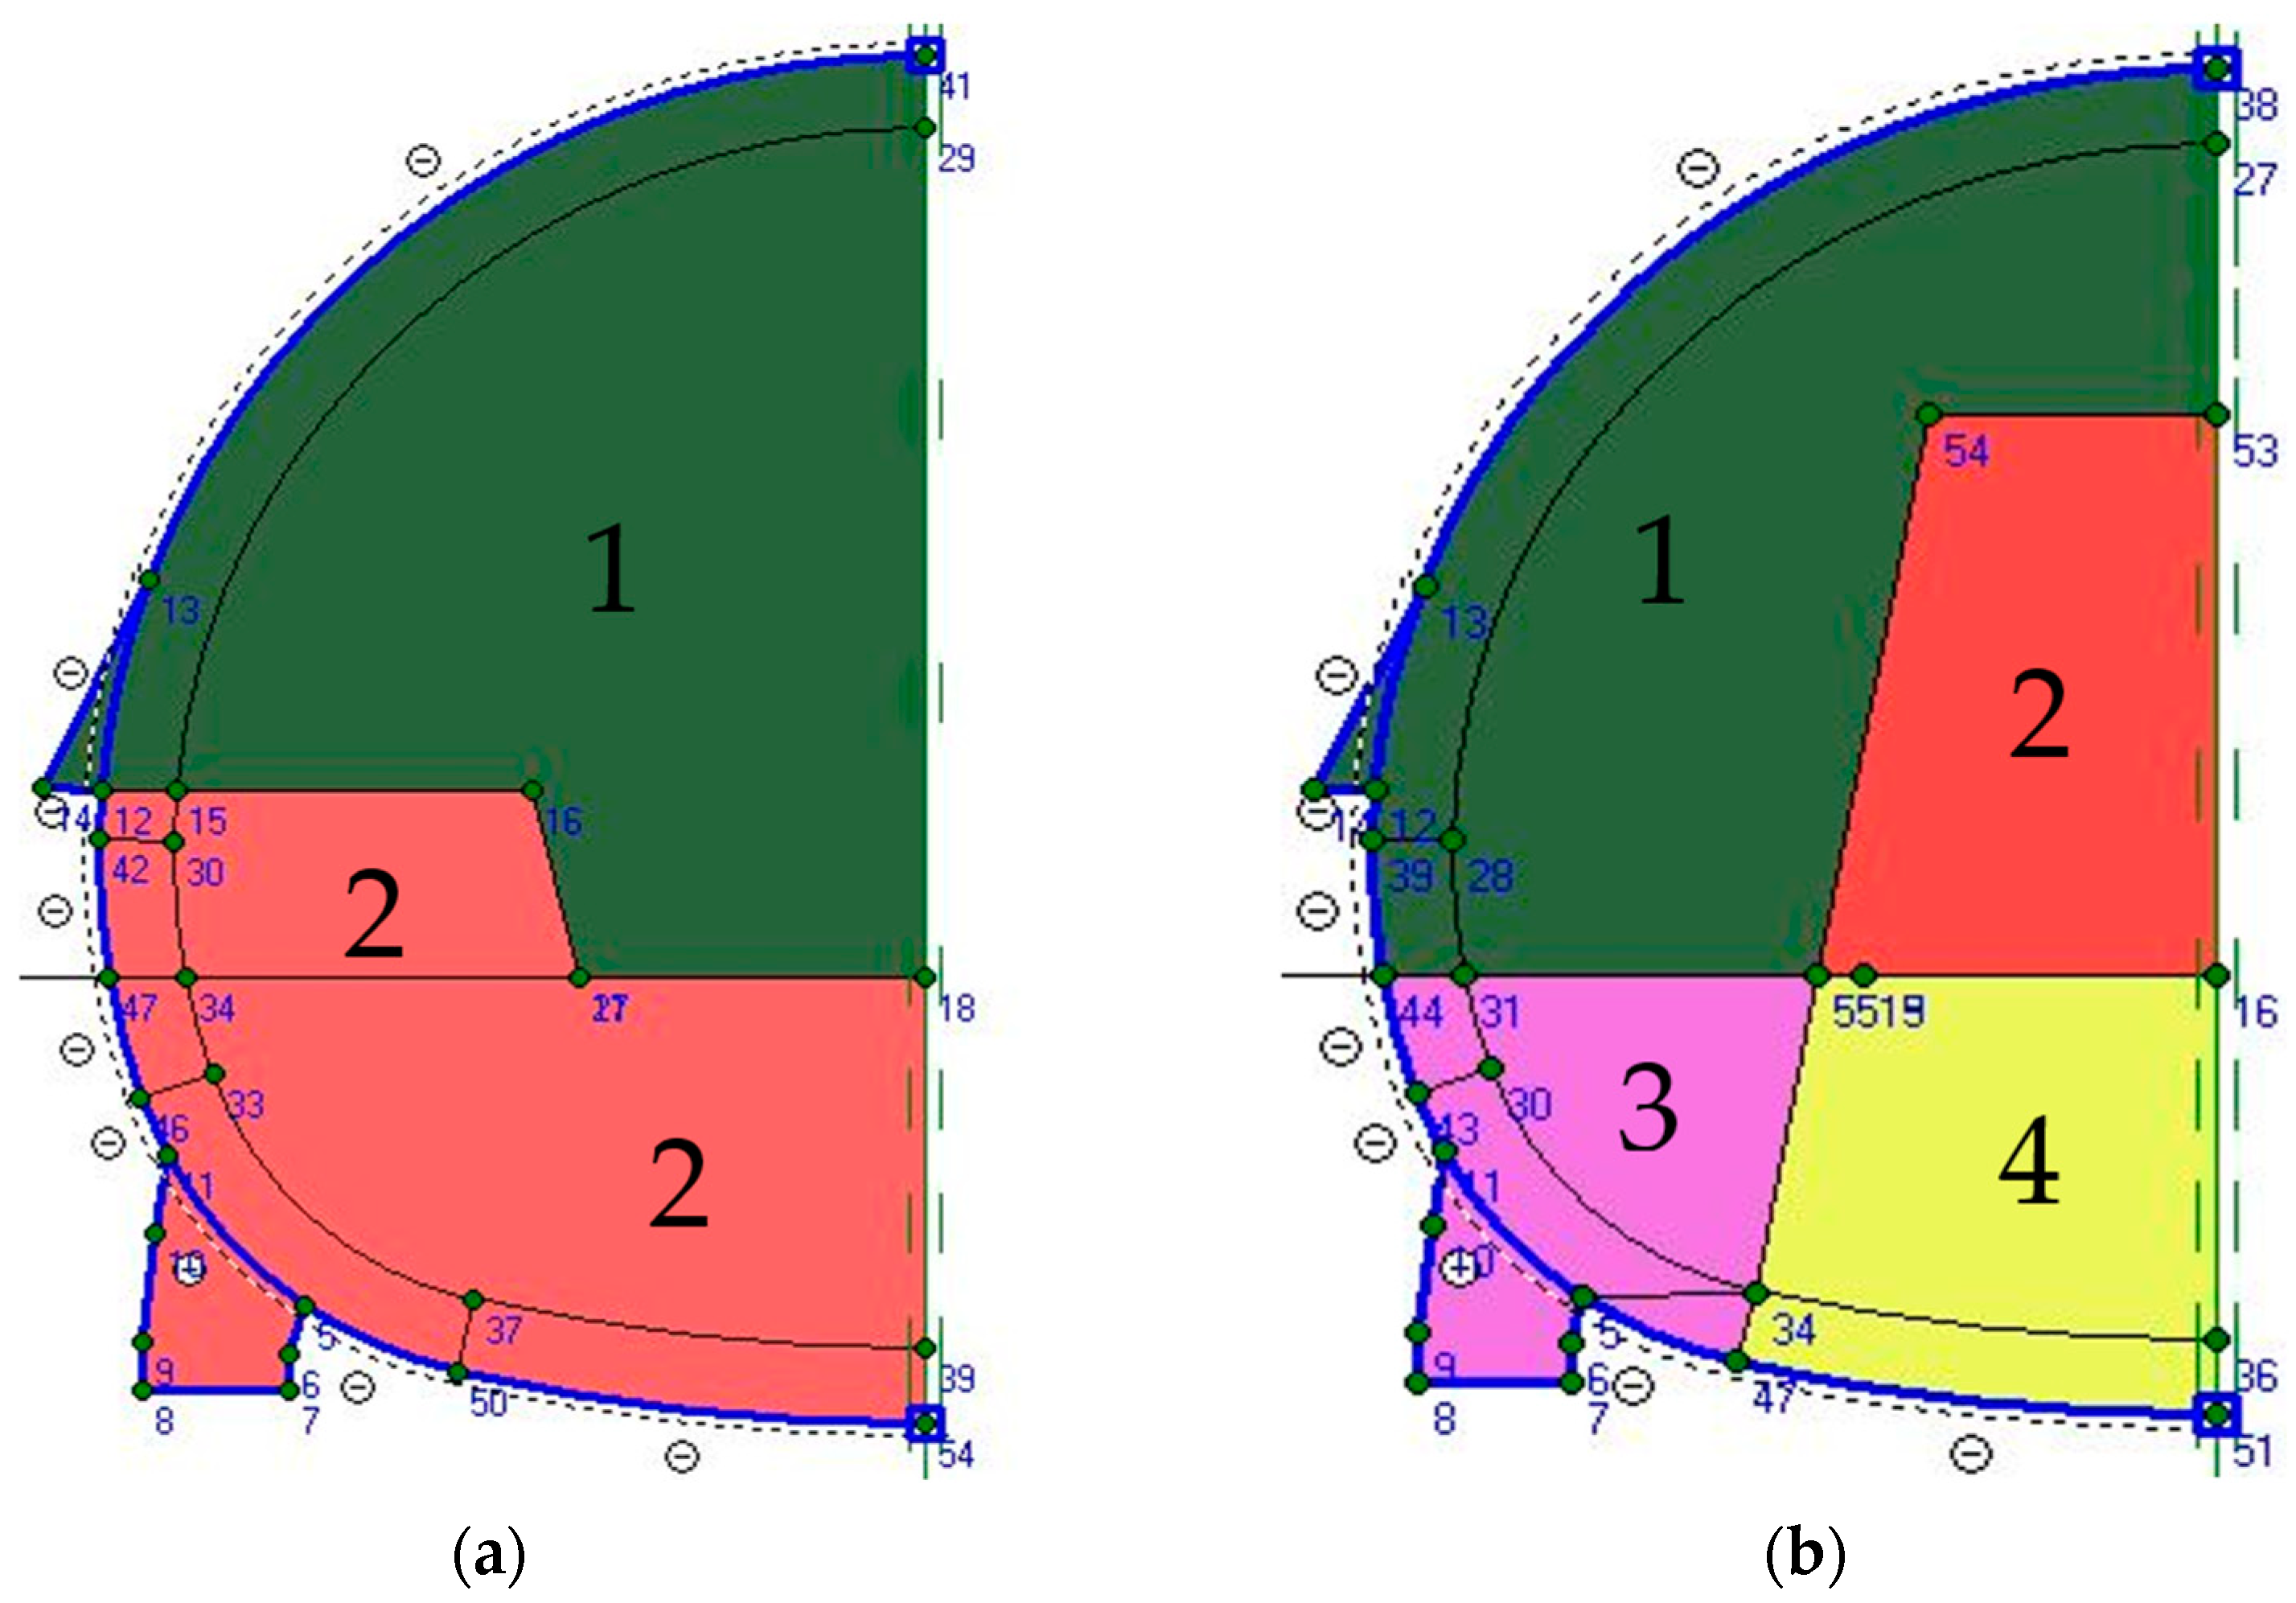
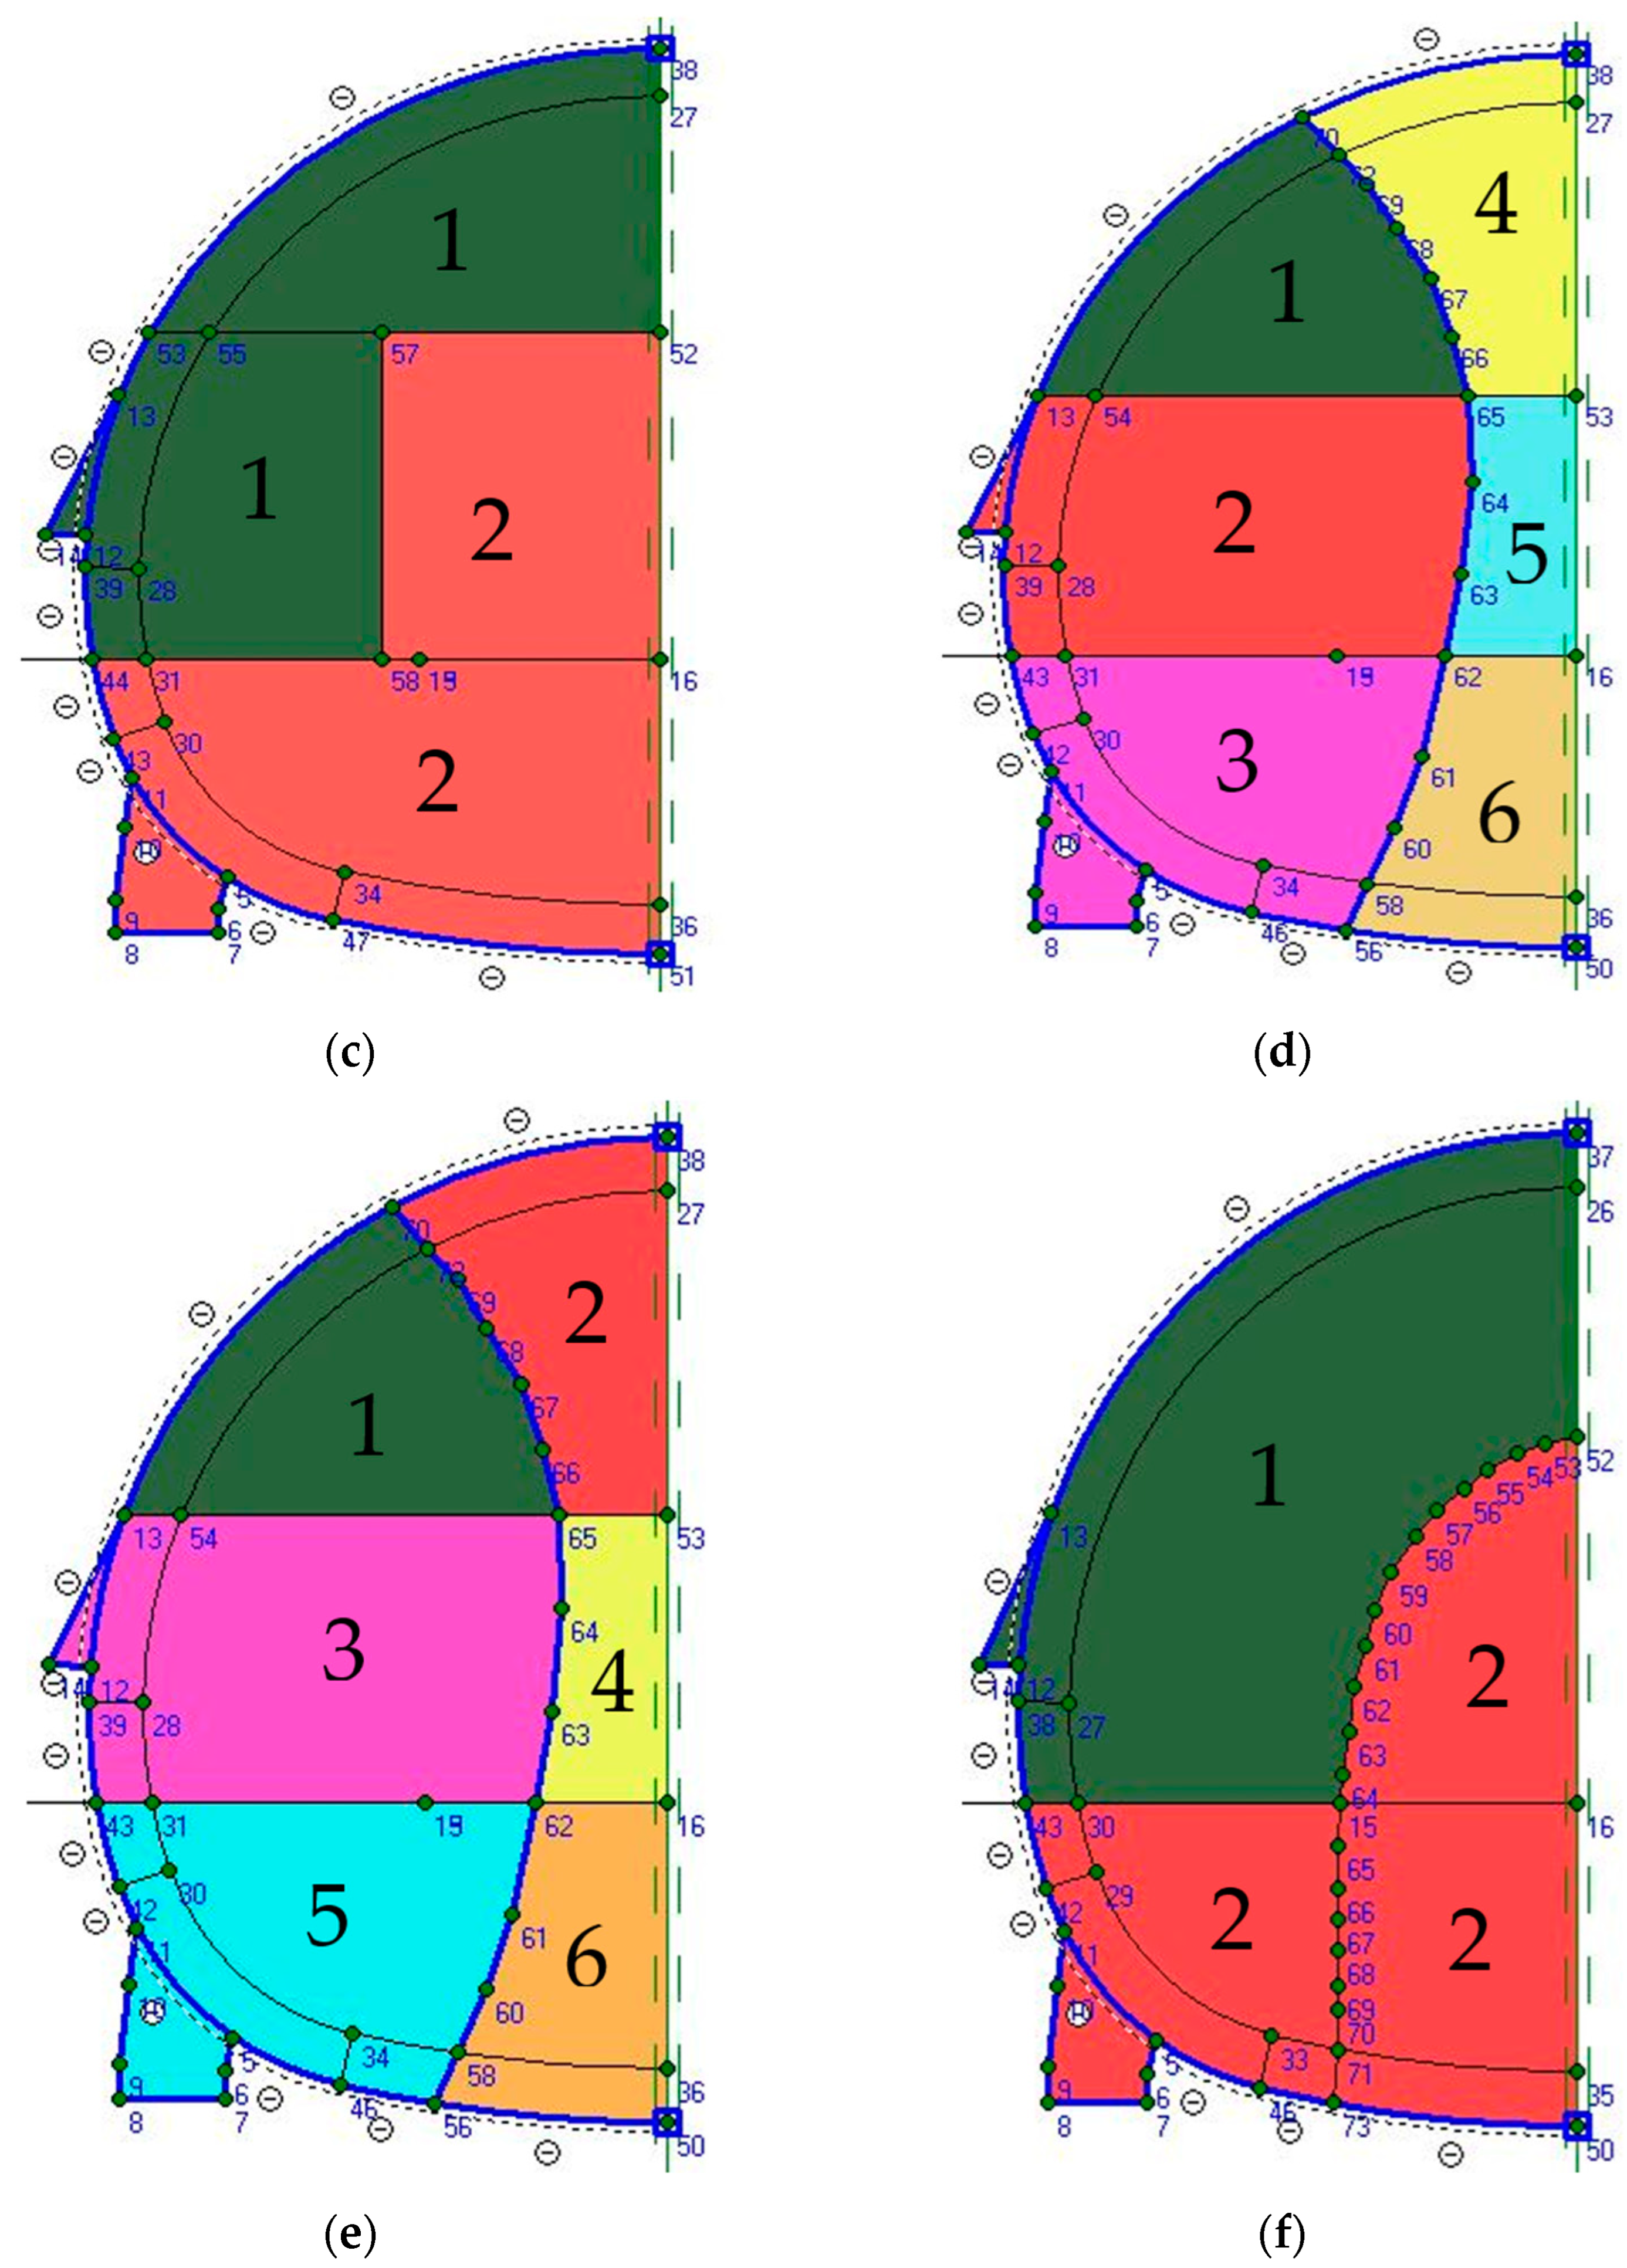
4. The Comparison between Excavation Patterns of the NATM

All the patterns can be seen in Figure 8; Pattern A is the one that was applied in the project. Pattern B followed the Rabcewicz recommendation. Case C was one of Farias’s optimized patterns, which was rather similar to case B. Although patterns D and E were almost equal, their difference was in their excavation priority. The last one came from trial and error based on pattern C.

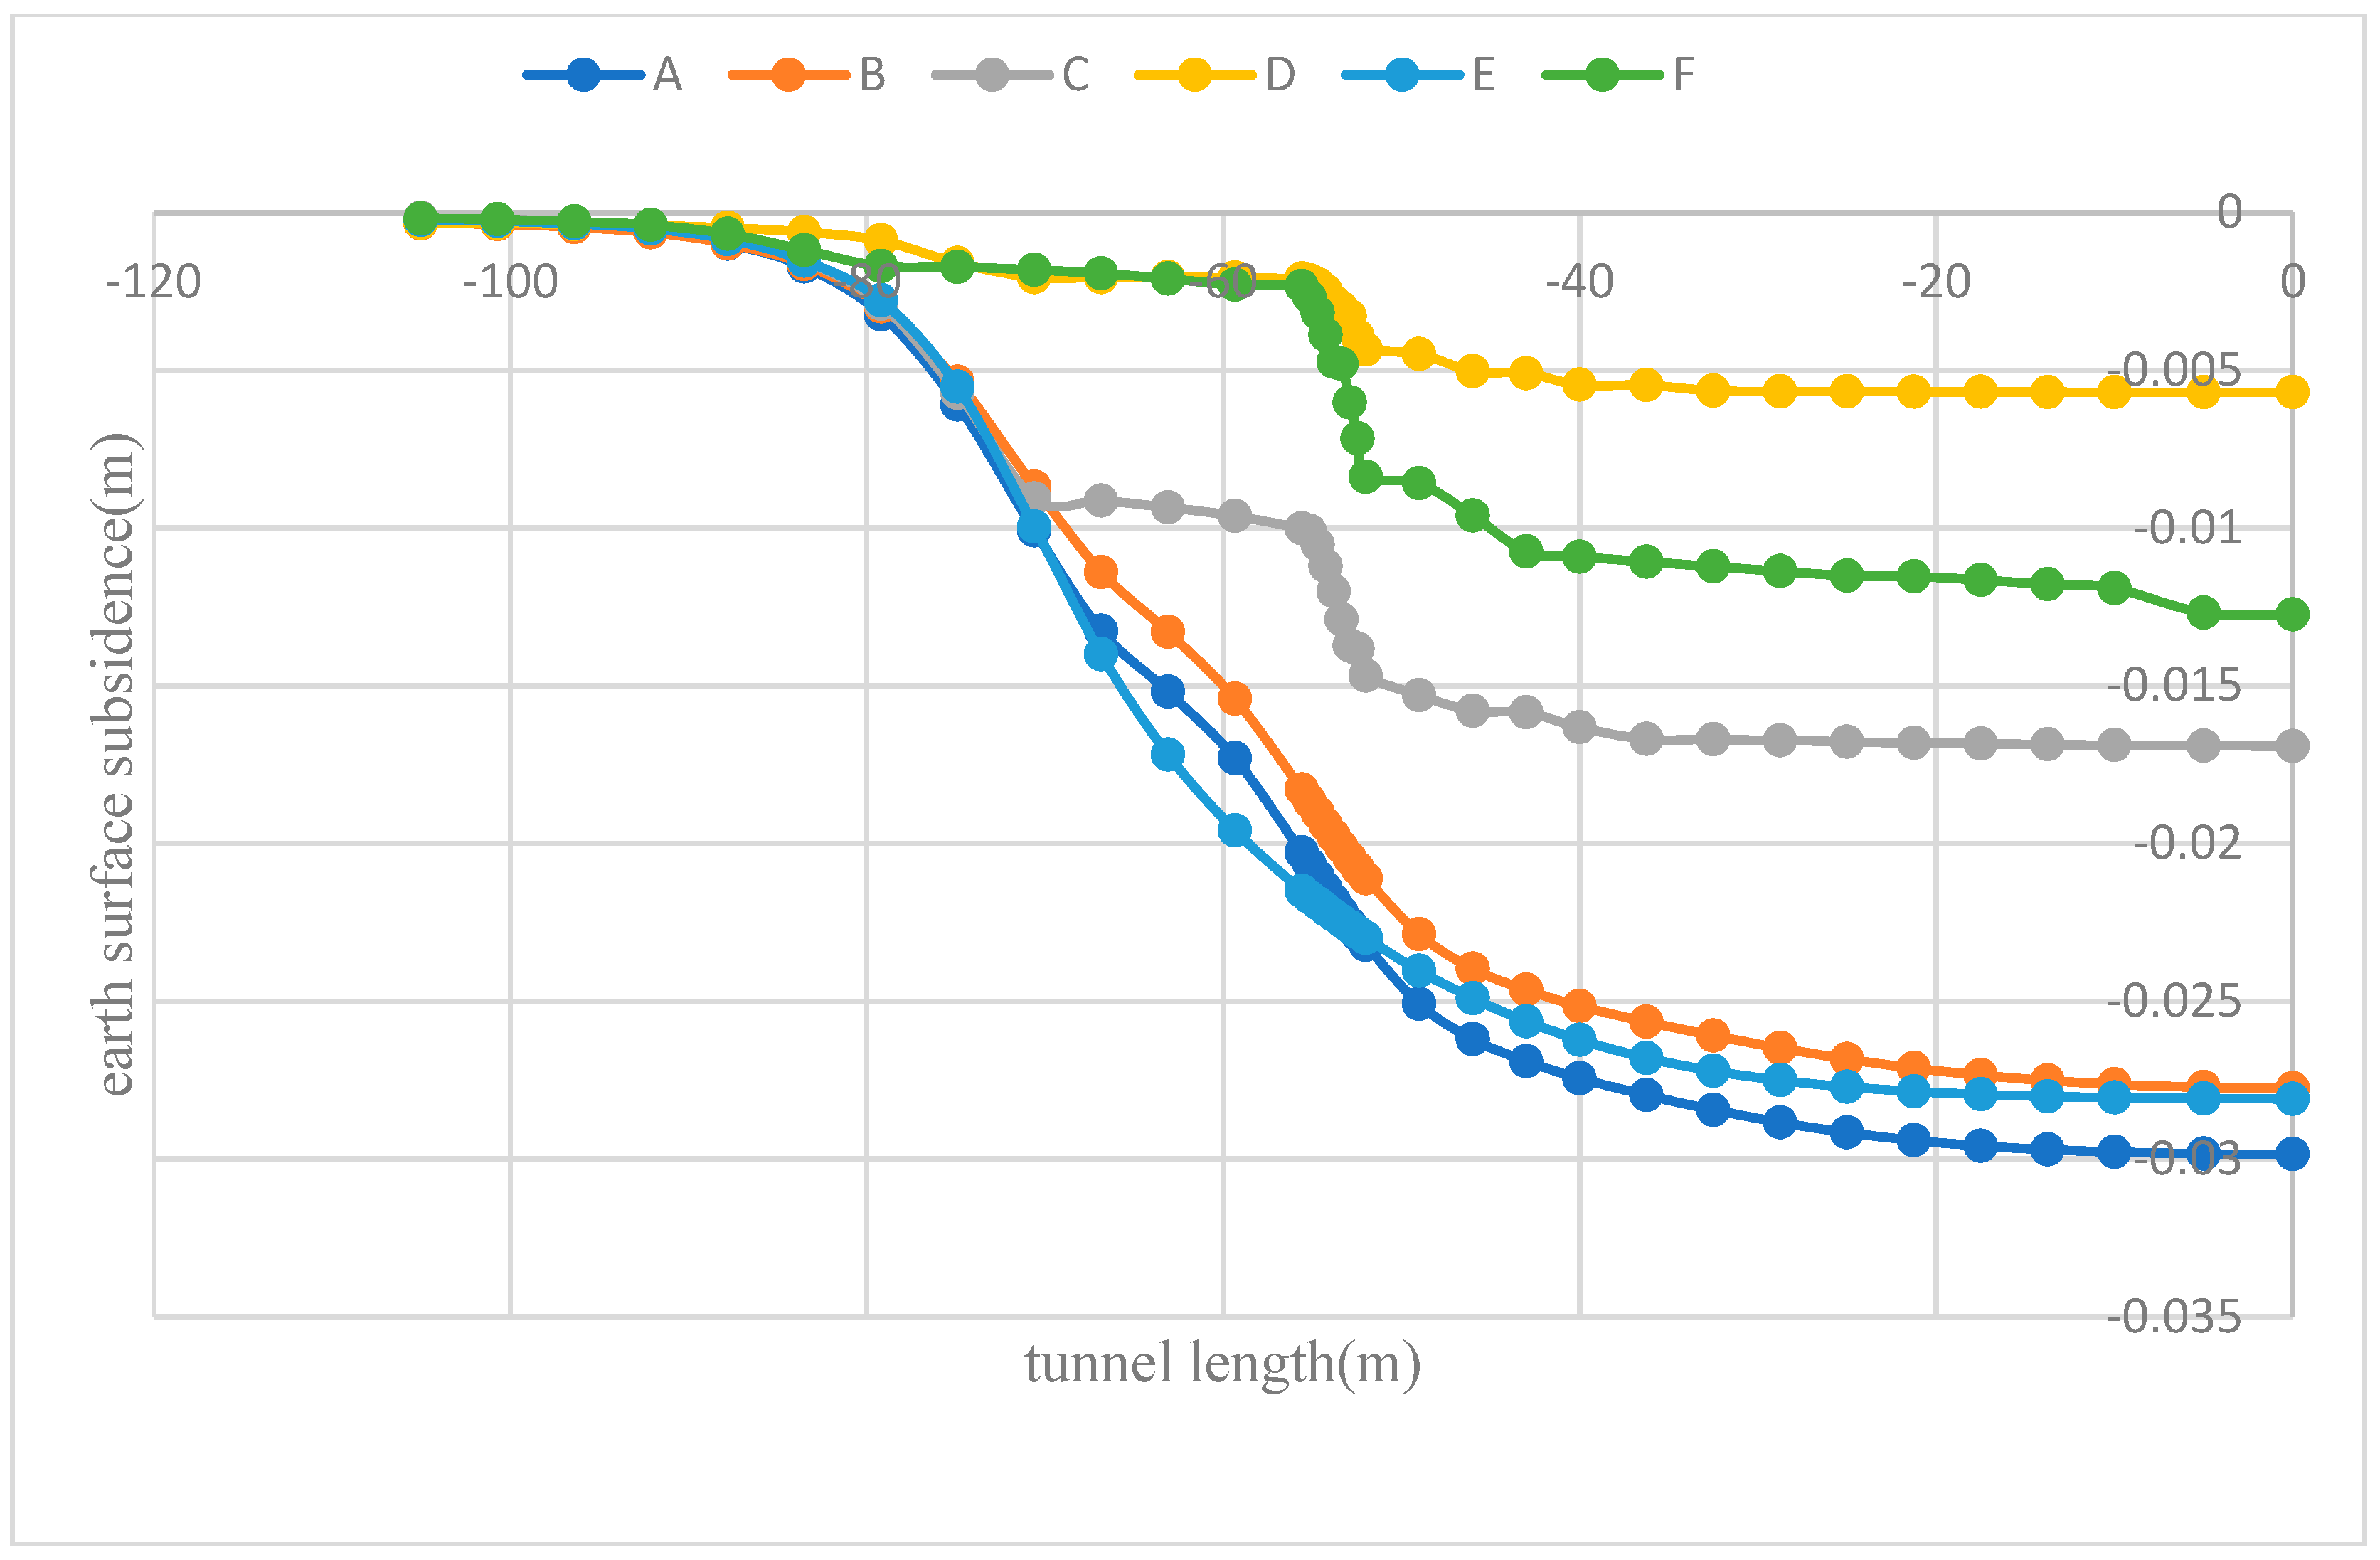
4.1. Comparison of Surface Subsidence between All Patterns

This comparison was conducted to determine the best pattern. All these patterns were modeled in PLAXIS based on the exact situation of the project, and all the stages and excavation steps of the Tehran Third South subway line project were simulated precisely for all patterns by PLAXIS 3D Tunnel. This gave us longitudinal and cross-sectional profiles for each of the patterns, which were then merged into one longitudinal profile (Figure 9) and one cross-sectional profile (Figure 10) to obtain a better view for comparison.
In Figure 9, profiles C, F, and D have similar behavior due to their priority of excavation according to Figure 8. Also, in this chart, the excavation faces are at the end of the top part and at the end of the bench part. The excavation direction is from right to left, and the vertical axis represents surface settlement; meanwhile, the horizontal axis shows tunnel length.
Figure 10 shows the cross-sectional profiles of all the patterns simultaneously. Patterns B and E have similar behavior in the settlement, which is justifiable due to their pattern and excavation procedure. In this chart, the vertical axis indicates subsidence, and the horizontal axis indicates distance from the tunnel axis. In both charts, pattern D had the lowest amount of subsidence.

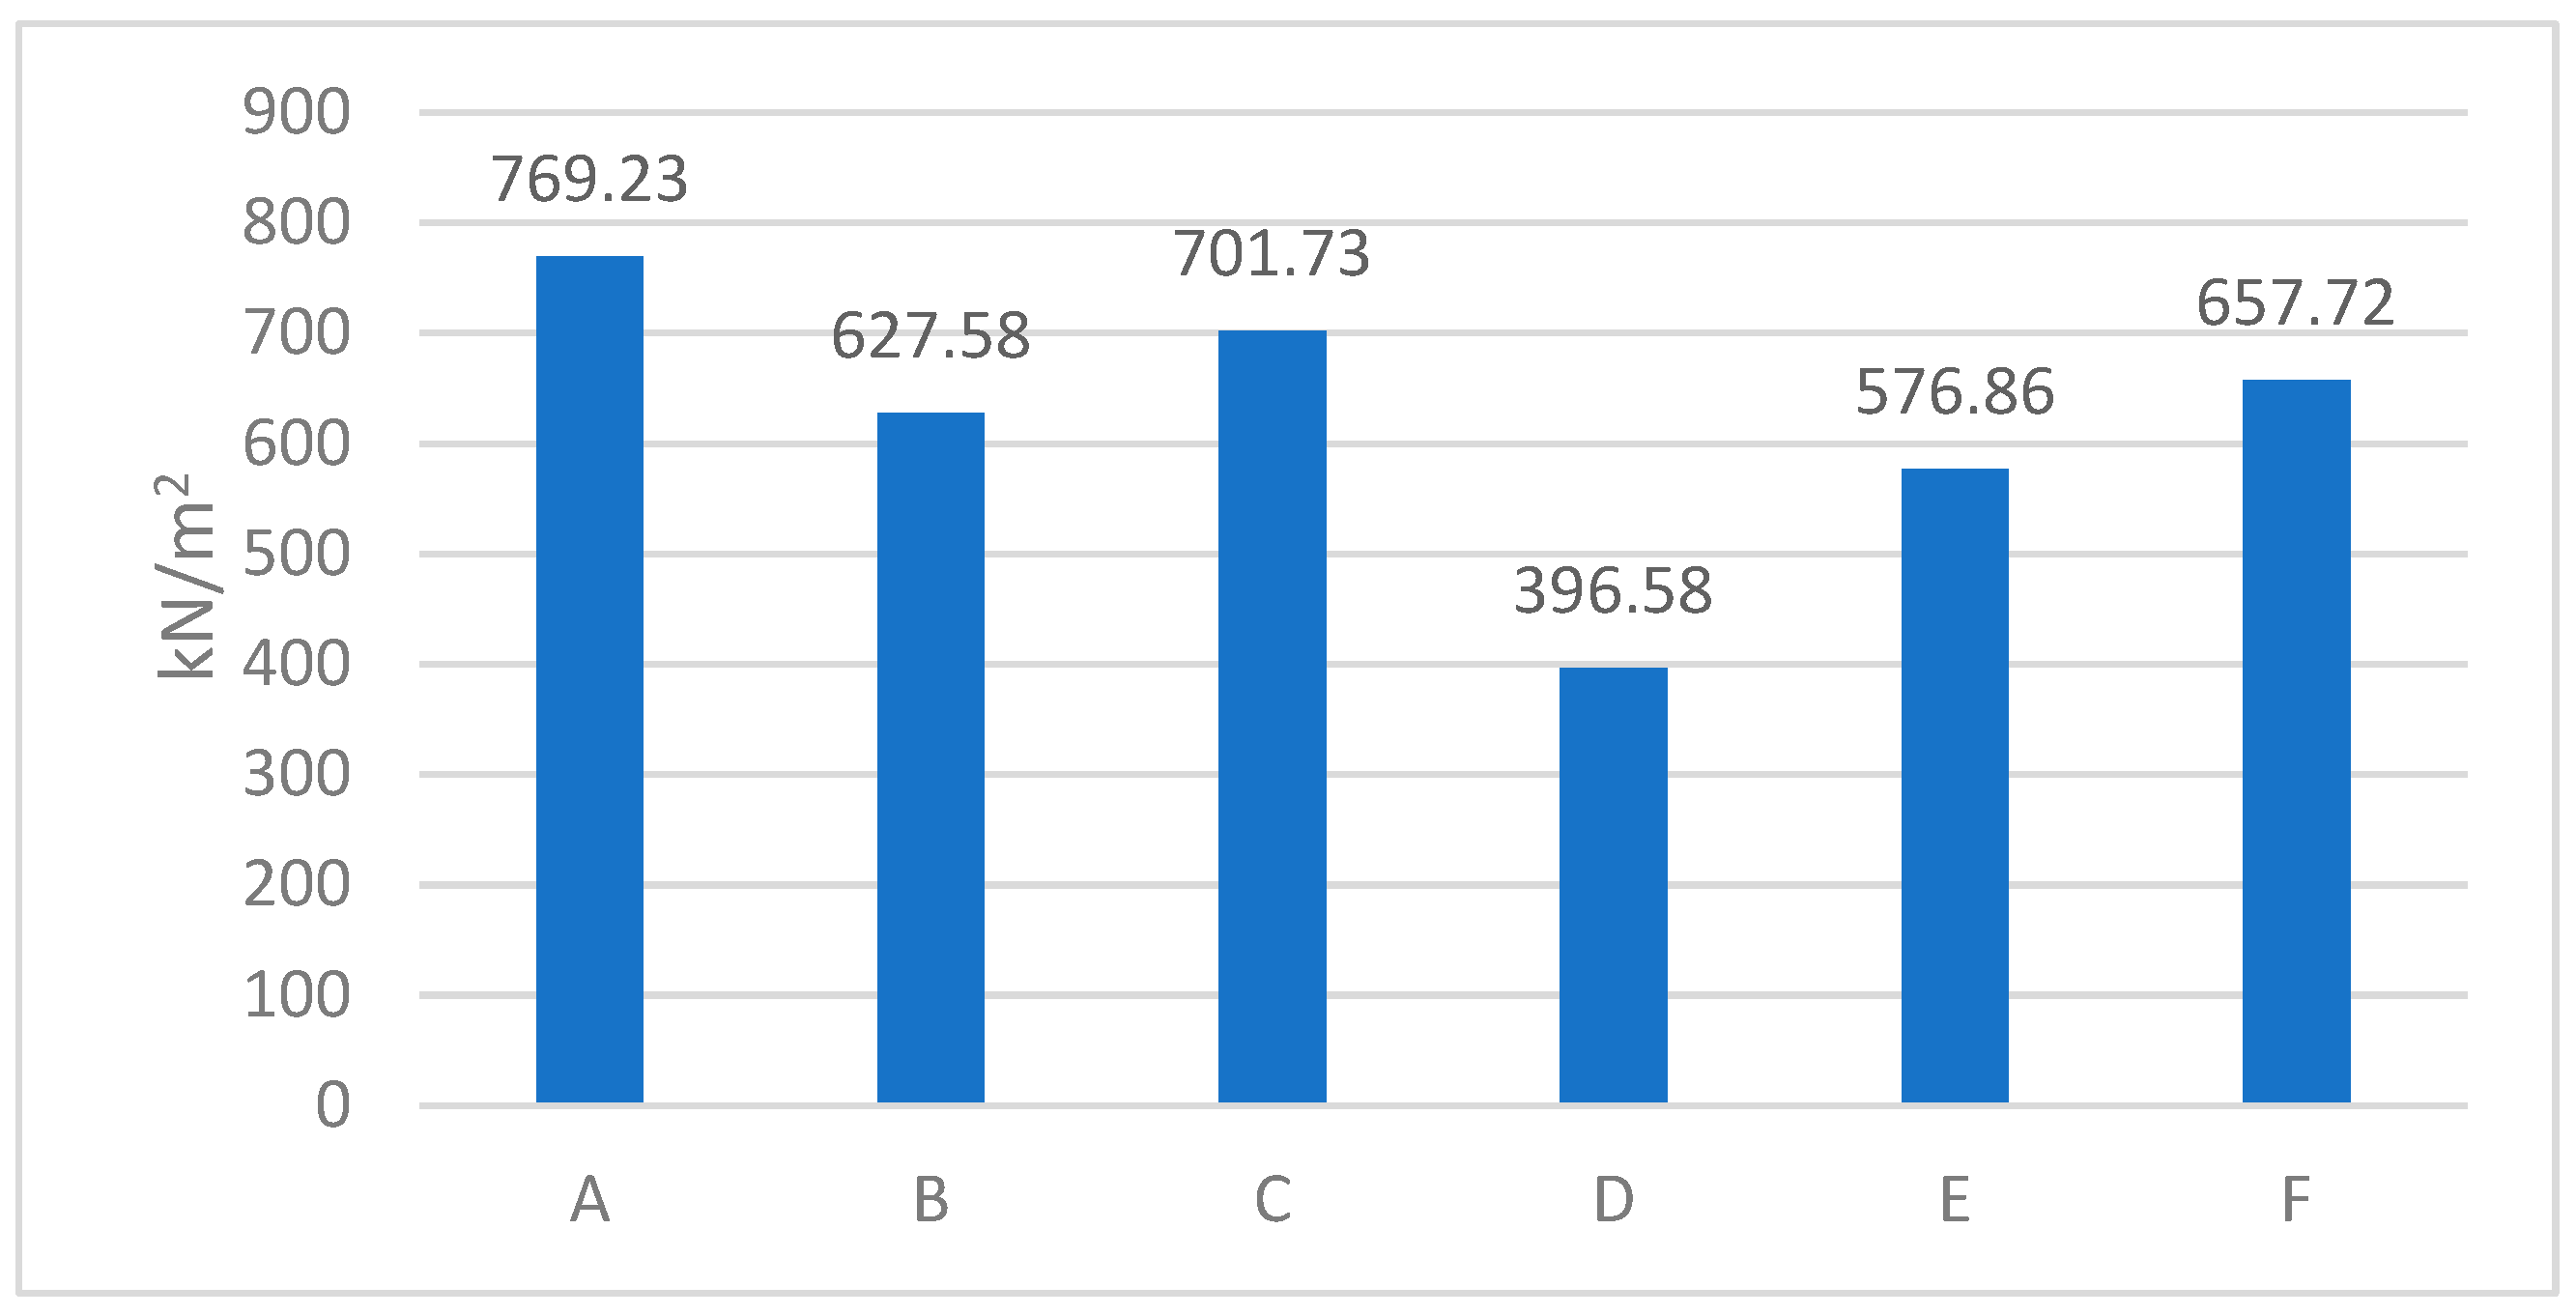
4.2. Comparison of Effective Mean Stresses of All Patterns

In addition to subsidence, a comparison of the effective mean stresses of all the patterns was accomplished in order to identify the optimized patterns. Fortunately, PLAXIS 3D Tunnel provided the required data for this collation, which is charted in Figure 11. As can be seen from this figure, pattern D had the least amount of effective mean stress.
Considering Figure 9, Figure 10 and Figure 11, pattern D is the most suitable excavation procedure for this region. It could also be used for similar geological conditions and in megacities with high traffic congestion in order to alleviate surface settlement as far as possible.

5. Conclusions

The maximum settlement of the surface was 32.9 mm according to the instrument report (Monitoring and instrumenting of tunnel behavior, CVR consultant engineers, design consultant of Tehran third south subway line). On the other hand, the subsidence obtained from PLAXIS was 30.01 mm, regarding Figure 6 and Figure 7; hence, these numbers prove the validation and accuracy of the modeling and also the reliability of PLAXIS 3D Tunnel for this region.
Analyzing Figure 9, Figure 10 and Figure 11, it becomes evident that pattern D emerges as the most viable excavation procedure for the region under consideration. Moreover, its applicability extends to comparable geological conditions and mega cities grappling with high traffic congestion. Implementing pattern D not only addresses existing challenges but also strives to minimize surface settlement, offering an effective solution for complex urban environments. This strategic approach not only ensures optimal excavation outcomes but also underscores the potential for widespread application in regions facing similar infrastructural and geological constraints.
The conducted research underscores the significant impact of adopting specific excavation patterns and altering the priority of excavation on both surface subsidence and effective mean stress. The findings suggest that the choice of excavation pattern plays a crucial role in influencing these outcomes. By strategically modifying the excavation priorities, it is possible to observe substantial changes in surface subsidence and the effective mean stress experienced in the geological context under consideration. This recognition highlights the importance of thoughtful planning and decision-making in excavation methodologies, as they can directly contribute to minimizing surface subsidence and optimizing the distribution of the effective mean stress during the construction process.

Author Contributions

Methodology, M.D.; validation, M.D. and Z.V.; data curation, M.D.; writing—original draft preparation, M.D. and Z.V.; writing—review and editing, Z.V.; supervision, Z.V. All authors have read and agreed to the published version of the manuscript.

Funding

This research received no external funding.

Institutional Review Board Statement

Not applicable.

Informed Consent Statement

Not applicable.

Data Availability Statement

The data that supports the findings of this study are available within the article.

Conflicts of Interest

The authors declare no conflicts of interest.

References

  1. Wang, Z.; Sheng, J.; Wang, R.; Li, X.; Xiao, Y.; Yi, Z. Analysis of Microtremor Exploration Application and Construction Monitoring in a Large-Diameter Shield Tunnel. Appl. Sci. 2023, 13, 263. [Google Scholar] [CrossRef]
  2. Wu, X.; Li, Y.; Gong, M.; Wu, H.; Wu, Y. Deformation and Stress Law of Surrounding Rock for a Bifurcated Tunnel with a Super-Large Section: A Case Study. Appl. Sci. 2023, 13, 12852. [Google Scholar] [CrossRef]
  3. Zhou, Z.; Zhou, X.; Li, L.; Liu, X.; Wang, L.; Wang, Z. The Construction Methods and Control Mechanisms for Subway Station Undercrossing an Existing Tunnel at Zero Distance. Appl. Sci. 2023, 13, 8826. [Google Scholar] [CrossRef]
  4. Ranjan, S.S.; Singh, R.K. Analysis of Land subsidence in coastal and urban areas by using various techniques. Indones. J. Geogr. 2023, 55, 488–495. [Google Scholar] [CrossRef]
  5. Ağbay, E.; Topal, T. Evaluation of twin tunnel-induced surface ground deformation by empirical and numerical analyses (NATM part of Eurasia tunnel, Turkey). Comput. Geotech. 2020, 119, 103367. [Google Scholar] [CrossRef]
  6. Fang, K.; Yang, Z.; Jiang, Y.; Sun, Z.; Wang, Z. Surface subsidence characteristics of fully overlapping tunnels constructed using tunnel boring machine in a clay stratum. Comput. Geotech. 2020, 125, 103679. [Google Scholar] [CrossRef]
  7. Wagner, H. The New Austrian Tunneling Method. Waterpower 1964, 16, 453–457. [Google Scholar]
  8. Shi, J.W.; Fu, Z.Z.; Guo, W.L. Investigation of geomatic effects on three-dimensional tunnel deformation mechanisms due to basement excavation. Comput. Geotech. 2019, 106, 108–116. [Google Scholar] [CrossRef]
  9. Soomro, M.A.; Kumar, M.; Xiong, H.; Mangnejo, D.A.; Mangi, N. Investigation of effects of different construction sequences on settlement and load transfer mechanism of single pile due to twin stacked tunnelling. Tunn. Undergr. Space Technol. 2020, 96, 103171. [Google Scholar] [CrossRef]
  10. Zeng, G.S.; Wang, H.N.; Luo, L.S.; Jiang, M.J. Analytical solution of displacement and stress induced by the sequential excavation of noncircular tunnels in viscoelastic rock. Int. J. Rock Mech. Min. Sci. 2020, 134, 104429. [Google Scholar] [CrossRef]
  11. Liu, J.; Ma, B.; Cheng, Y. Design of the Gongbei tunnel using a very large cross-section pipe-roof and soil freezing method. Tunneling Undergr. Space Technol. 2018, 72, 28–40. [Google Scholar] [CrossRef]
  12. Yang, X.; Li, Y. Research of surface settlement for a single arch long-span subway station using the Pipe-roof Pre-construction Method. Tunneling Undergr. Space Technol. 2018, 72, 210–217. [Google Scholar] [CrossRef]
  13. Niedbalski, Z.; Małkowski, P.; Majcherczyk, T. Application of the NATM method in the road tunnelling works in difficult geological conditions-The Carpathian flysch. Tunneling Undergr. Space Technol. 2018, 74, 41–59. [Google Scholar] [CrossRef]
  14. Wittke, W.; Pierau, B.; Erichsen, C. New Austrian Tunnelling Method (NATM) Stability Analyses and 12. Design; WBI GmbH: Aachen, Germany, 2002; Volume 50, p. 52072. [Google Scholar]
  15. Gokceoglu, C.; Aygar, E.B.; Nefeslioglu, H.A.; Karahan, S.; Gullu, S. A Geotechnical Perspective on a Complex Geological Environment in a High-Speed Railway Tunnel Excavation (A Case Study from Türkiye). Infrastructures 2022, 7, 155. [Google Scholar] [CrossRef]
  16. Aygar, E.B. Performance of the Flexible and Rigid Lining under Earthquake Impact and Weakness of the New Austrian Tunneling Method (NATM) Principles, a Specific Case Study of the Bolu Tunnel. Sustainability 2023, 15, 15544. [Google Scholar] [CrossRef]
  17. Farias, M.M.; Junior, A.H.M.; Assis, A.P. Displacement control in tunnels excavated by the NATM: 3-D numerical simulations. Tunneling Undergr. Space Technol. 2004, 19, 283–293. [Google Scholar] [CrossRef]
  18. Boldini, D.; Lackner, R.; Mang, H.A. Ground-shotcrete interaction of NATM tunnels with high overburden. J. Geotech. Geoenviron. Eng. 2005, 131, 886–897. [Google Scholar] [CrossRef]
  19. Schwingenschloegl, R.; Lehmann, C. Swelling rock behaviour in a tunnel: NATM-support vs. Q-support—A comparison. Tunneling Undergr. Space Technol. 2009, 24, 356–362. [Google Scholar] [CrossRef]
  20. Svoboda, T.; Masin, D.; Bohac, J. Class A predictions of a NATM tunnel in stiff clay. Comput. Geotech. 2010, 37, 817–825. [Google Scholar] [CrossRef]
  21. Hosseini, H. Geotechnical study report on Tehran third south subway line by Soil and foundation engineering. Civ. Eng. J. 2018, 4, 1117. [Google Scholar]
  22. Liu, X.; Yan, P.; Chen, M.; Luo, S.; Lu, A.; Lu, W.; Huang, S.; Wang, G. Optimization analysis of excavation procedure design of underground powerhouses under high in situ stress in China. Appl. Sci. 2021, 11, 10252. [Google Scholar] [CrossRef]
  23. Brinkgreve, R.B.J.; Vermeer, P.A. Finite Element Code for Soil and Rock Analyses; PLAXIS Manual; Balkema: Rotterdam, The Netherlands, 2001. [Google Scholar]
  24. Design Consultant of Tehran Third South Subway Line; CVR Consultant Engineers: Tehran, Iran, 2010.
  25. Monitoring and Instrumenting of Tunnel Behavior. Design Consultant of Tehran Third South Subway Line; TUSRC/RTI/L3/CVR/C/REP/TUN/P3/H/021/REV.0; CVR Consultant Engineers: Tehran, Iran, 2011.
Figure 1. Recommended excavation pattern by Rabcewicz (I, II, III, IV shows the sequence of excavation).
Applsci 14 07547 g001
Figure 2. Recommended excavation pattern by Farias (I, II, shows the sequence of excavation).
Applsci 14 07547 g002
Figure 3. The two-dimensional pattern designed in the project (I, II, shows the sequence of excavation).
Applsci 14 07547 g003
Figure 4. The geometry of the model with generated mesh and the impact of the rock material in the software.
Applsci 14 07547 g004
Figure 5. Excavation procedure accomplished in the project (numbers show the sequence of excavation).
Applsci 14 07547 g005
Figure 6. Longitudinal profile of surface subsidence.
Applsci 14 07547 g006
Figure 7. Cross-sectional profile of surface subsidence.
Applsci 14 07547 g007
Figure 8. Varied excavation patterns of the NATM: (a) project pattern; (b) proposed pattern by Rabcewicz; (c) Farias’s optimized pattern; (d) empirical pattern 1; (e) empirical pattern 2; (f) empirical pattern 3 (numbers show the sequence of excavation).
Applsci 14 07547 g008aApplsci 14 07547 g008b
Figure 9. Longitudinal profiles of surface subsidence for all the excavation patterns.
Applsci 14 07547 g009
Figure 10. Cross-sectional profiles of surface subsidence for all the excavation patterns.
Applsci 14 07547 g010
Figure 11. Effective mean stress of excavation patterns.
Applsci 14 07547 g011
Table 1. Parameters of soil layers.
Upper Layer
(Sand)
Middle Layer
(Clay with Silt)
Bottom Layer (Clay with Silt)
E (kN/m2)1.75 × 1043.75 × 1045.5 × 104
ȣunsat (kN/m3)16.916.916.9
ȣsat (kN/m3)20,25020,25020,250
ψ (°)000
φ (°)272727
v0.350.350.35
C (kN/m2)404040
K00.5480.4920.504
Table 2. Material properties of temporary and final supports.
E
(kN/m2)
ȣunsat (kN/m3)vEA
(kN/m)
EI
(kNm2)
d (m)W (kN)
Shotcrete0.26.103 × 1062.215 × 1040.2097.2
Final concrete2.387 × 107250.2
Table 3. Definition of the parameters.
ParameterDefinition
EElasticity module
ȣunsatUnsaturated unit weight
ȣsatSaturated unit weight
ΨAngle of dilation
ΦInternal friction angle
VPoisson’s ratio
CCohesion
K0Coefficient of lateral earth pressure
EANormal stiffness (axial rigidity)
EIFlexural rigidity
dEquivalent thickness
WUnit weight
Disclaimer/Publisher’s Note: The statements, opinions and data contained in all publications are solely those of the individual author(s) and contributor(s) and not of MDPI and/or the editor(s). MDPI and/or the editor(s) disclaim responsibility for any injury to people or property resulting from any ideas, methods, instructions or products referred to in the content.

