
Prediction of Friction Coefficient Based on 3D Texture Characteristics of Road Surfaces

Abstract
:1. Introduction
2. Measurement Tools and Experimental Methods
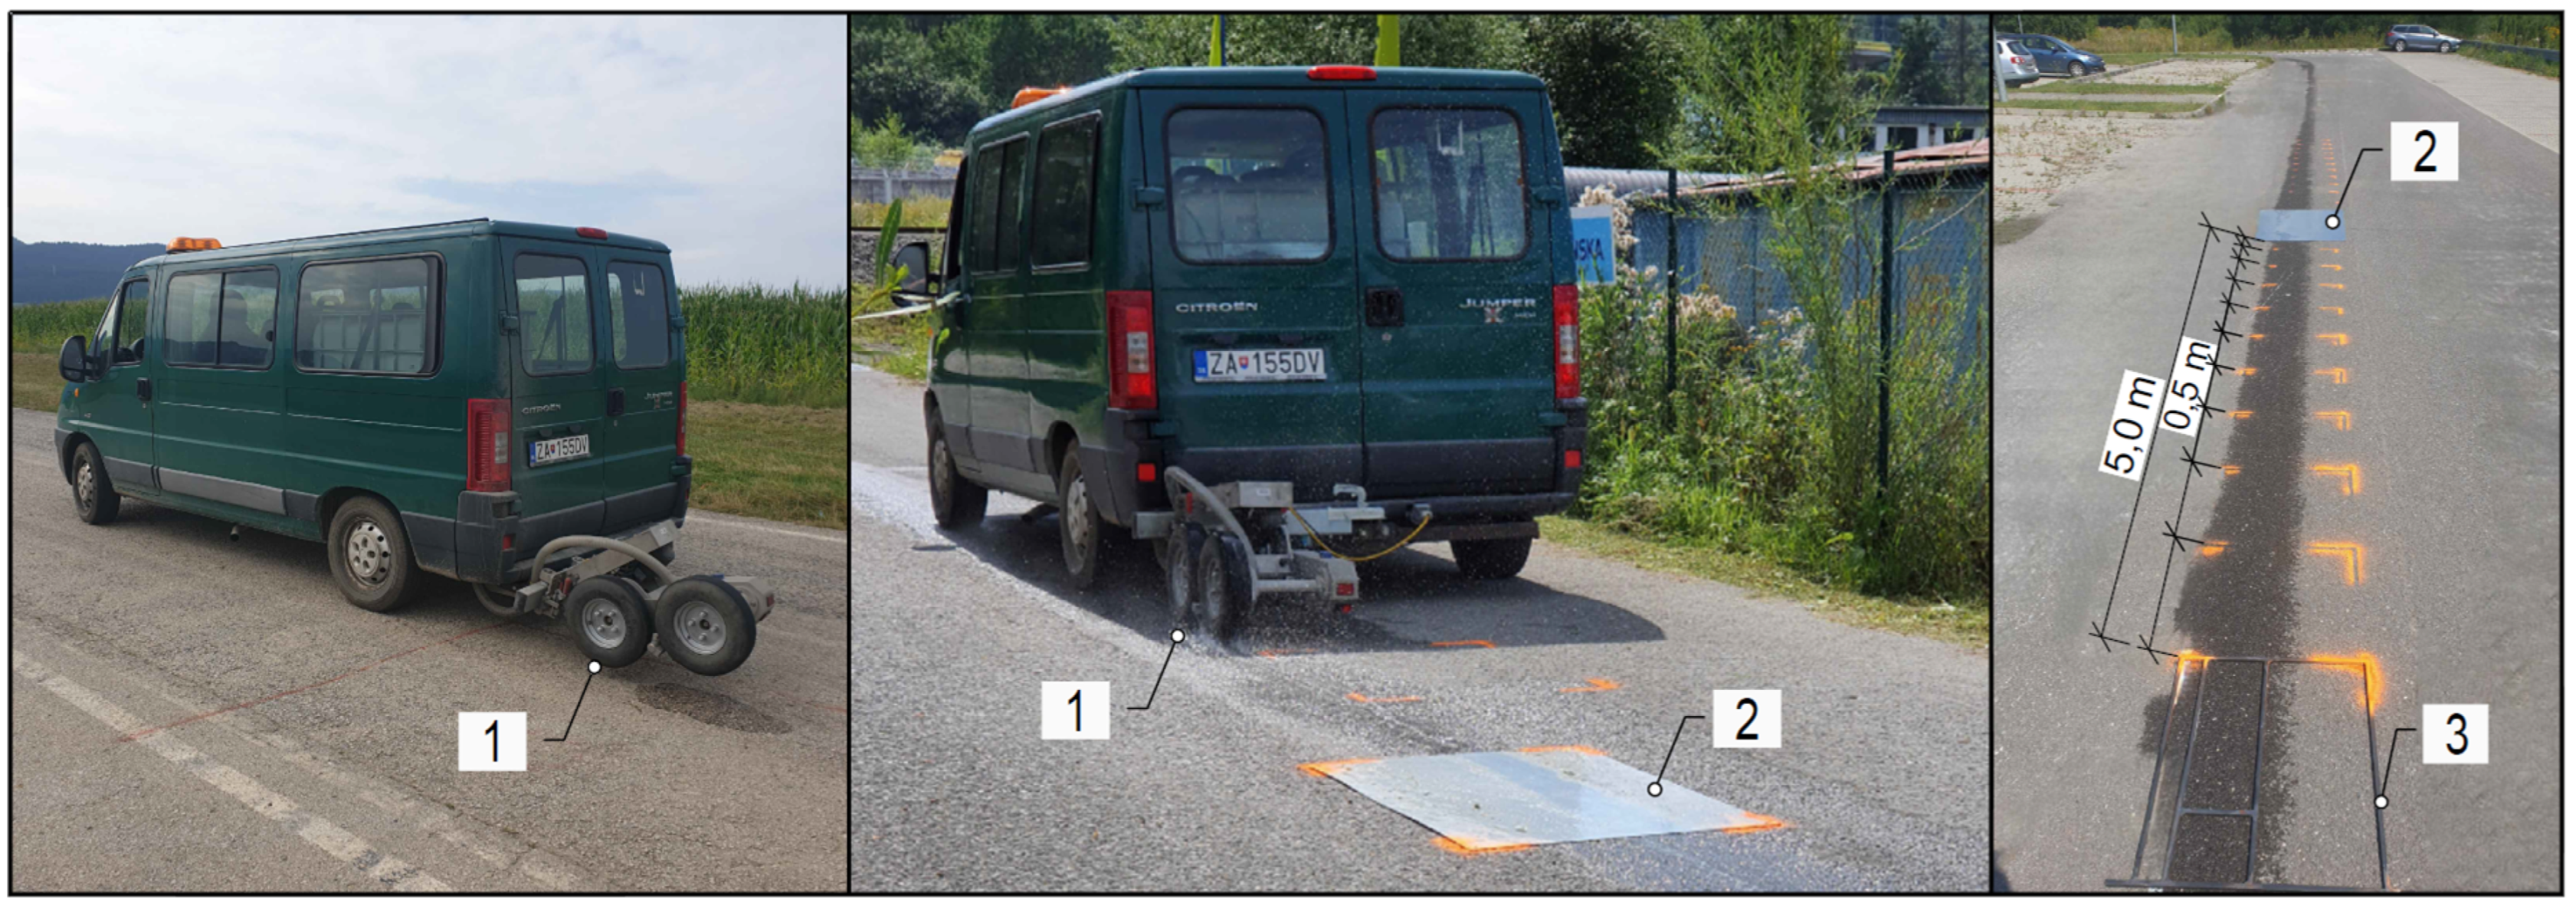
2.1. Traction Watcher One
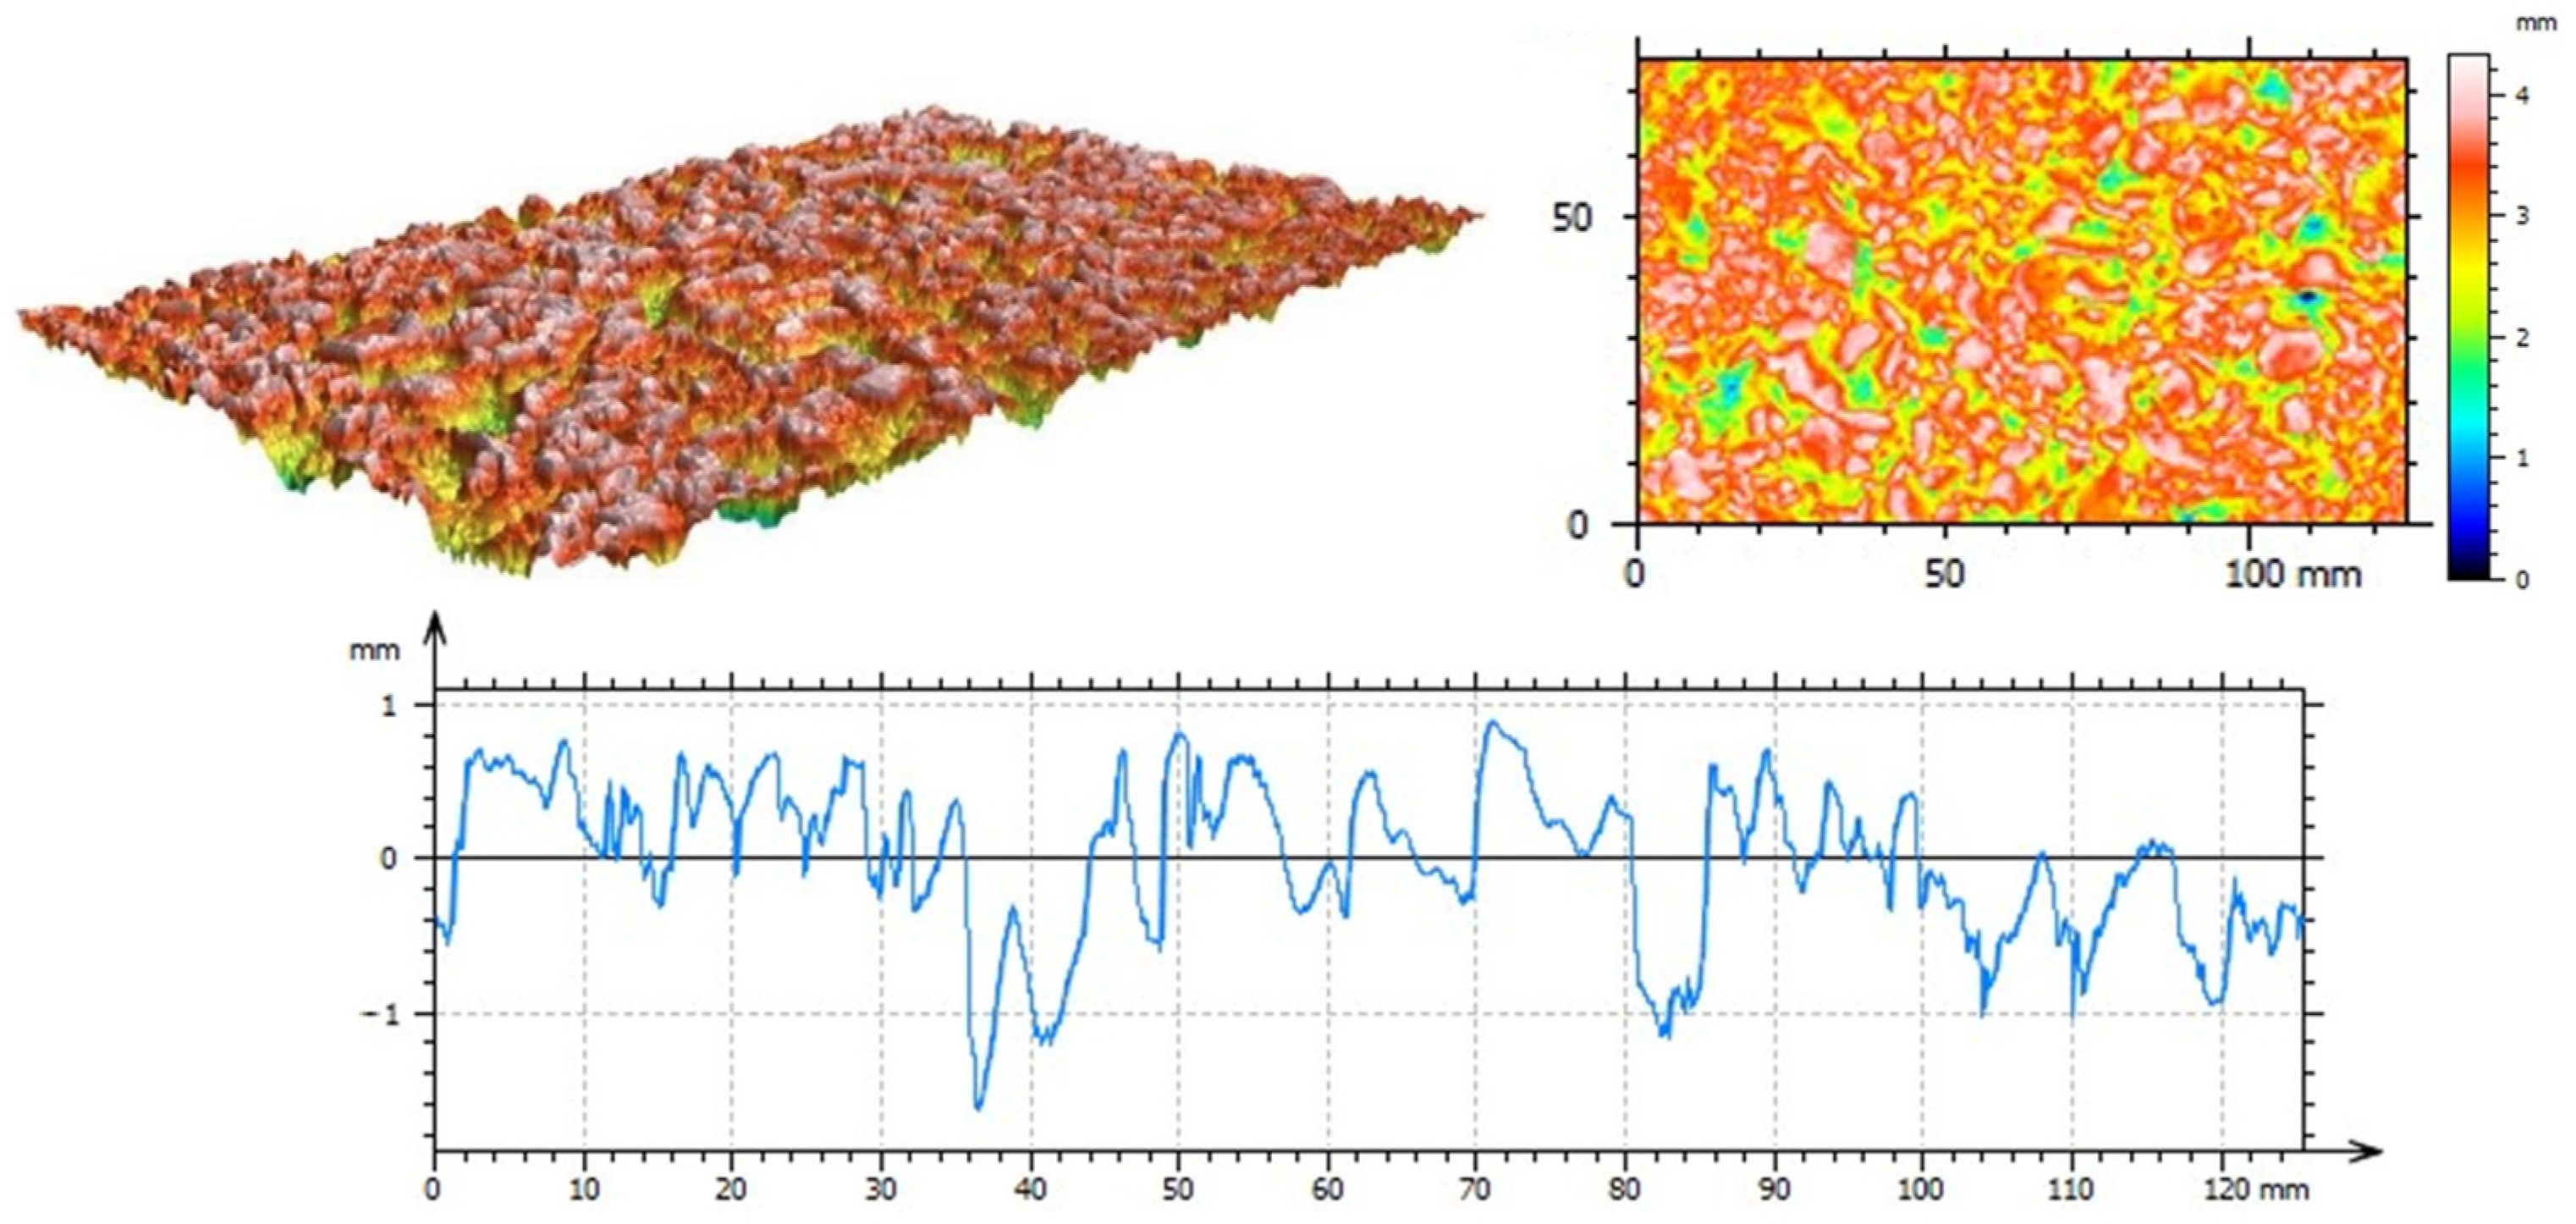
2.2. Static Road Scanner
2.3. Methodology
2.4. Key Texture Parameters for Friction Coefficient Prediction
3. Results and Discussion
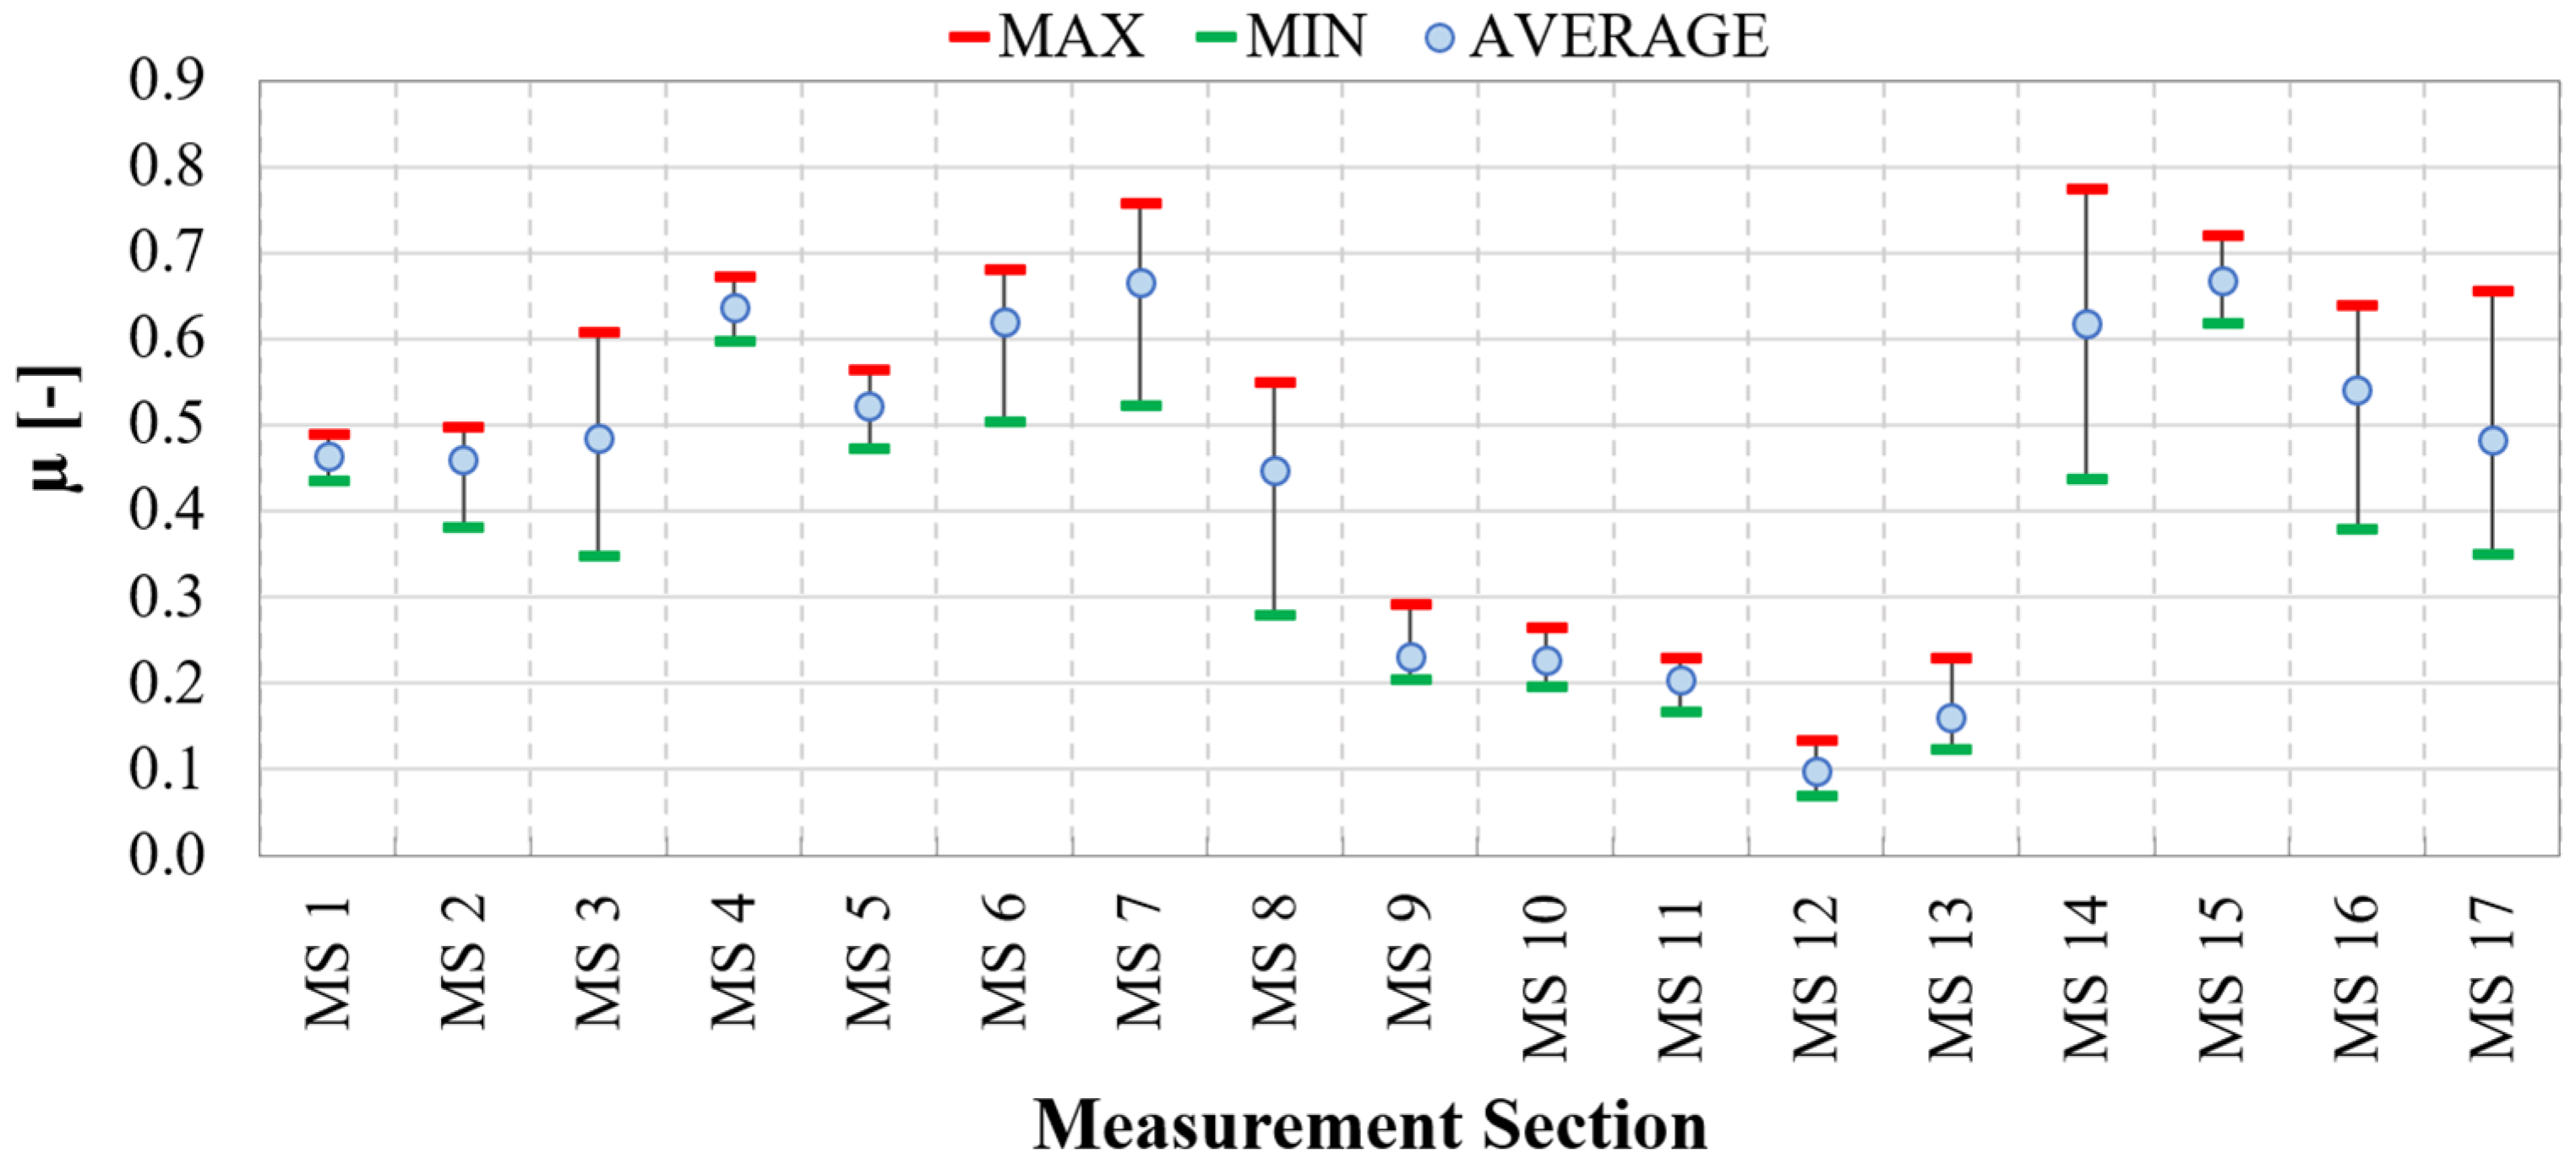
3.1. Assessment of Friction Metrics
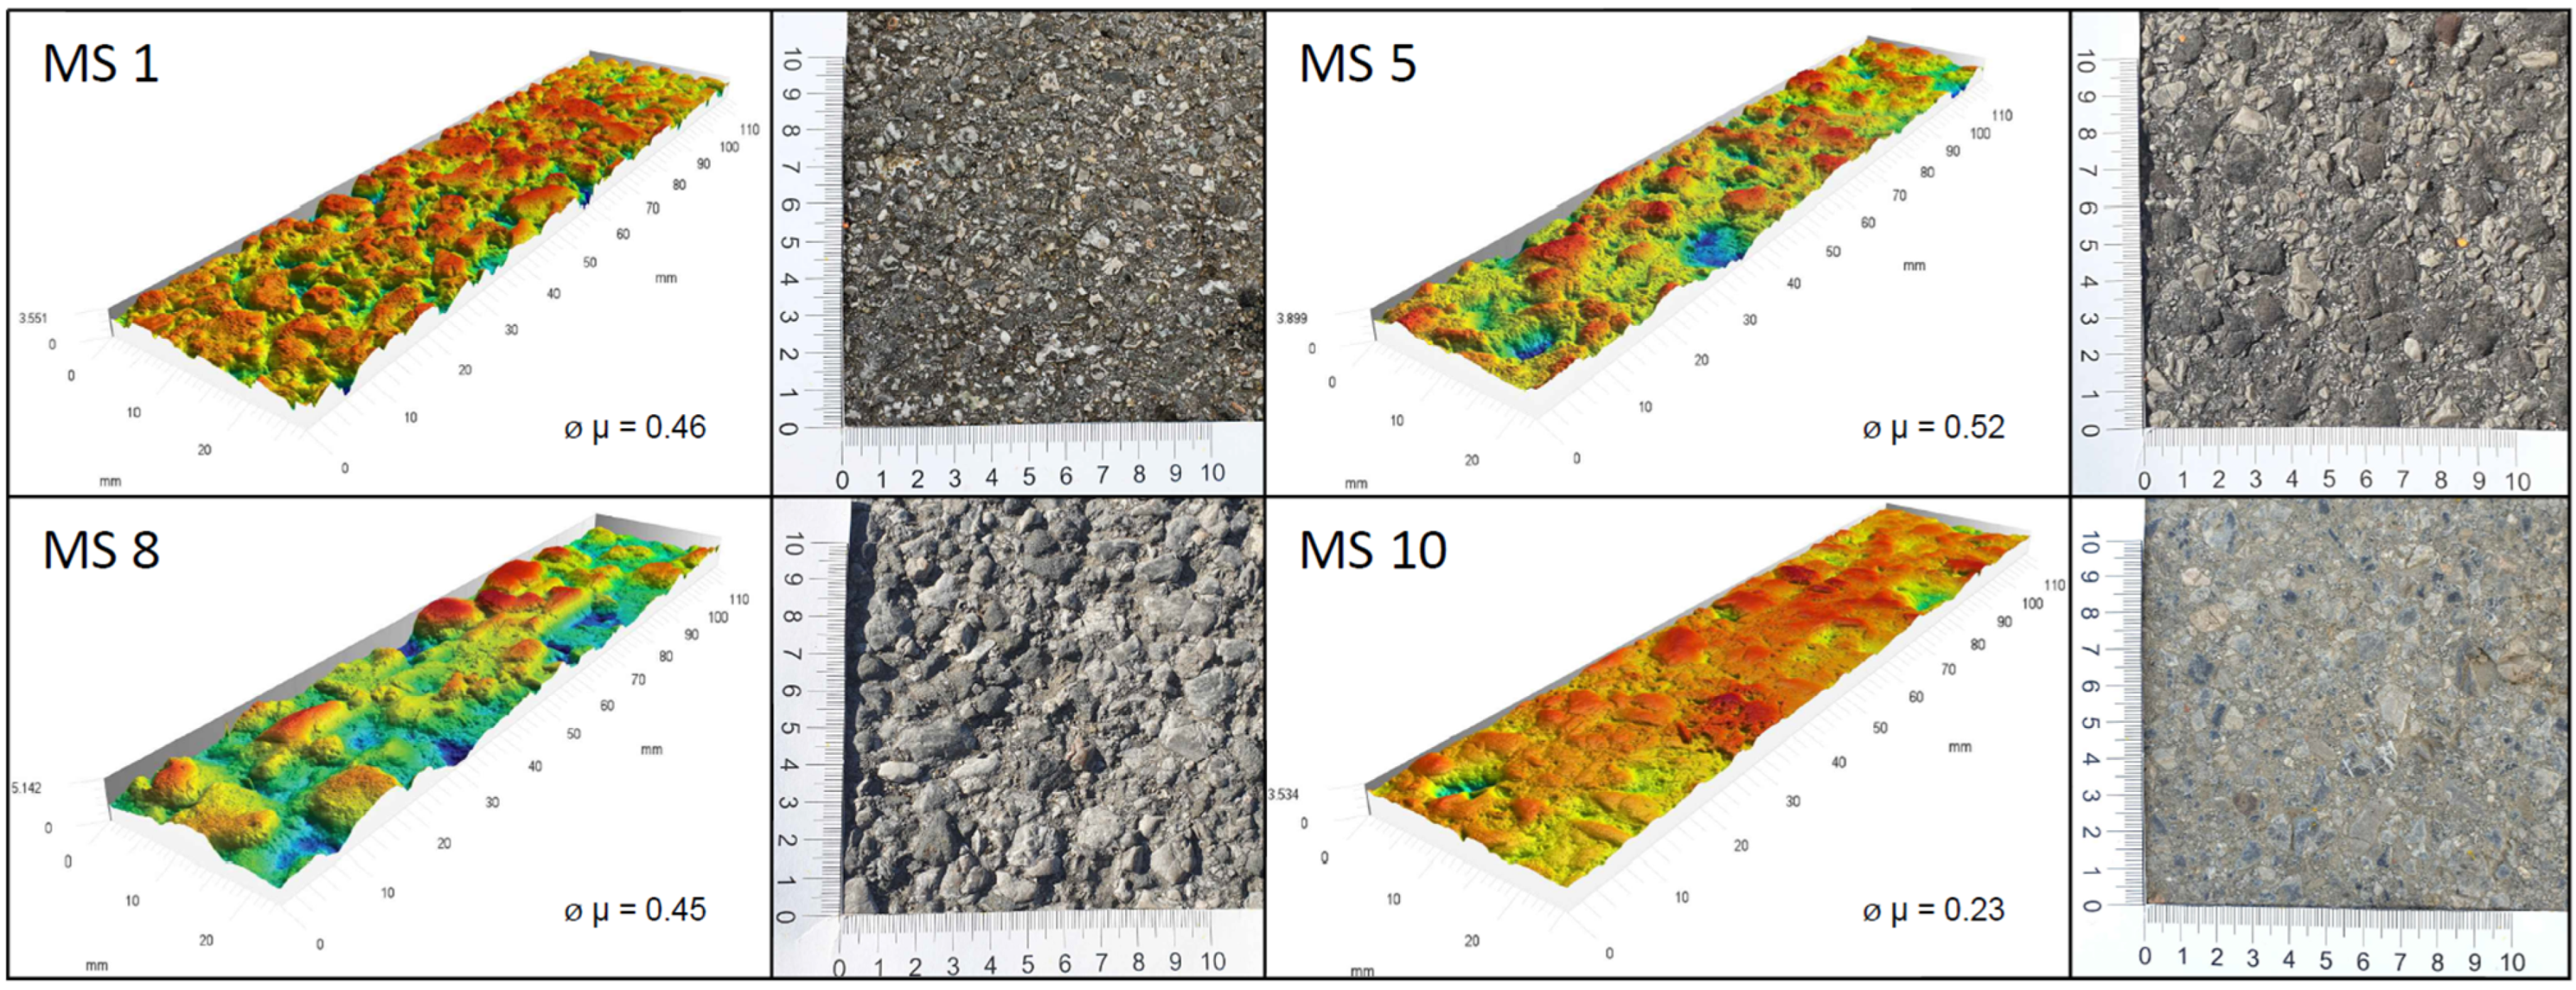
3.2. Assessment of Surface Texture Metrics
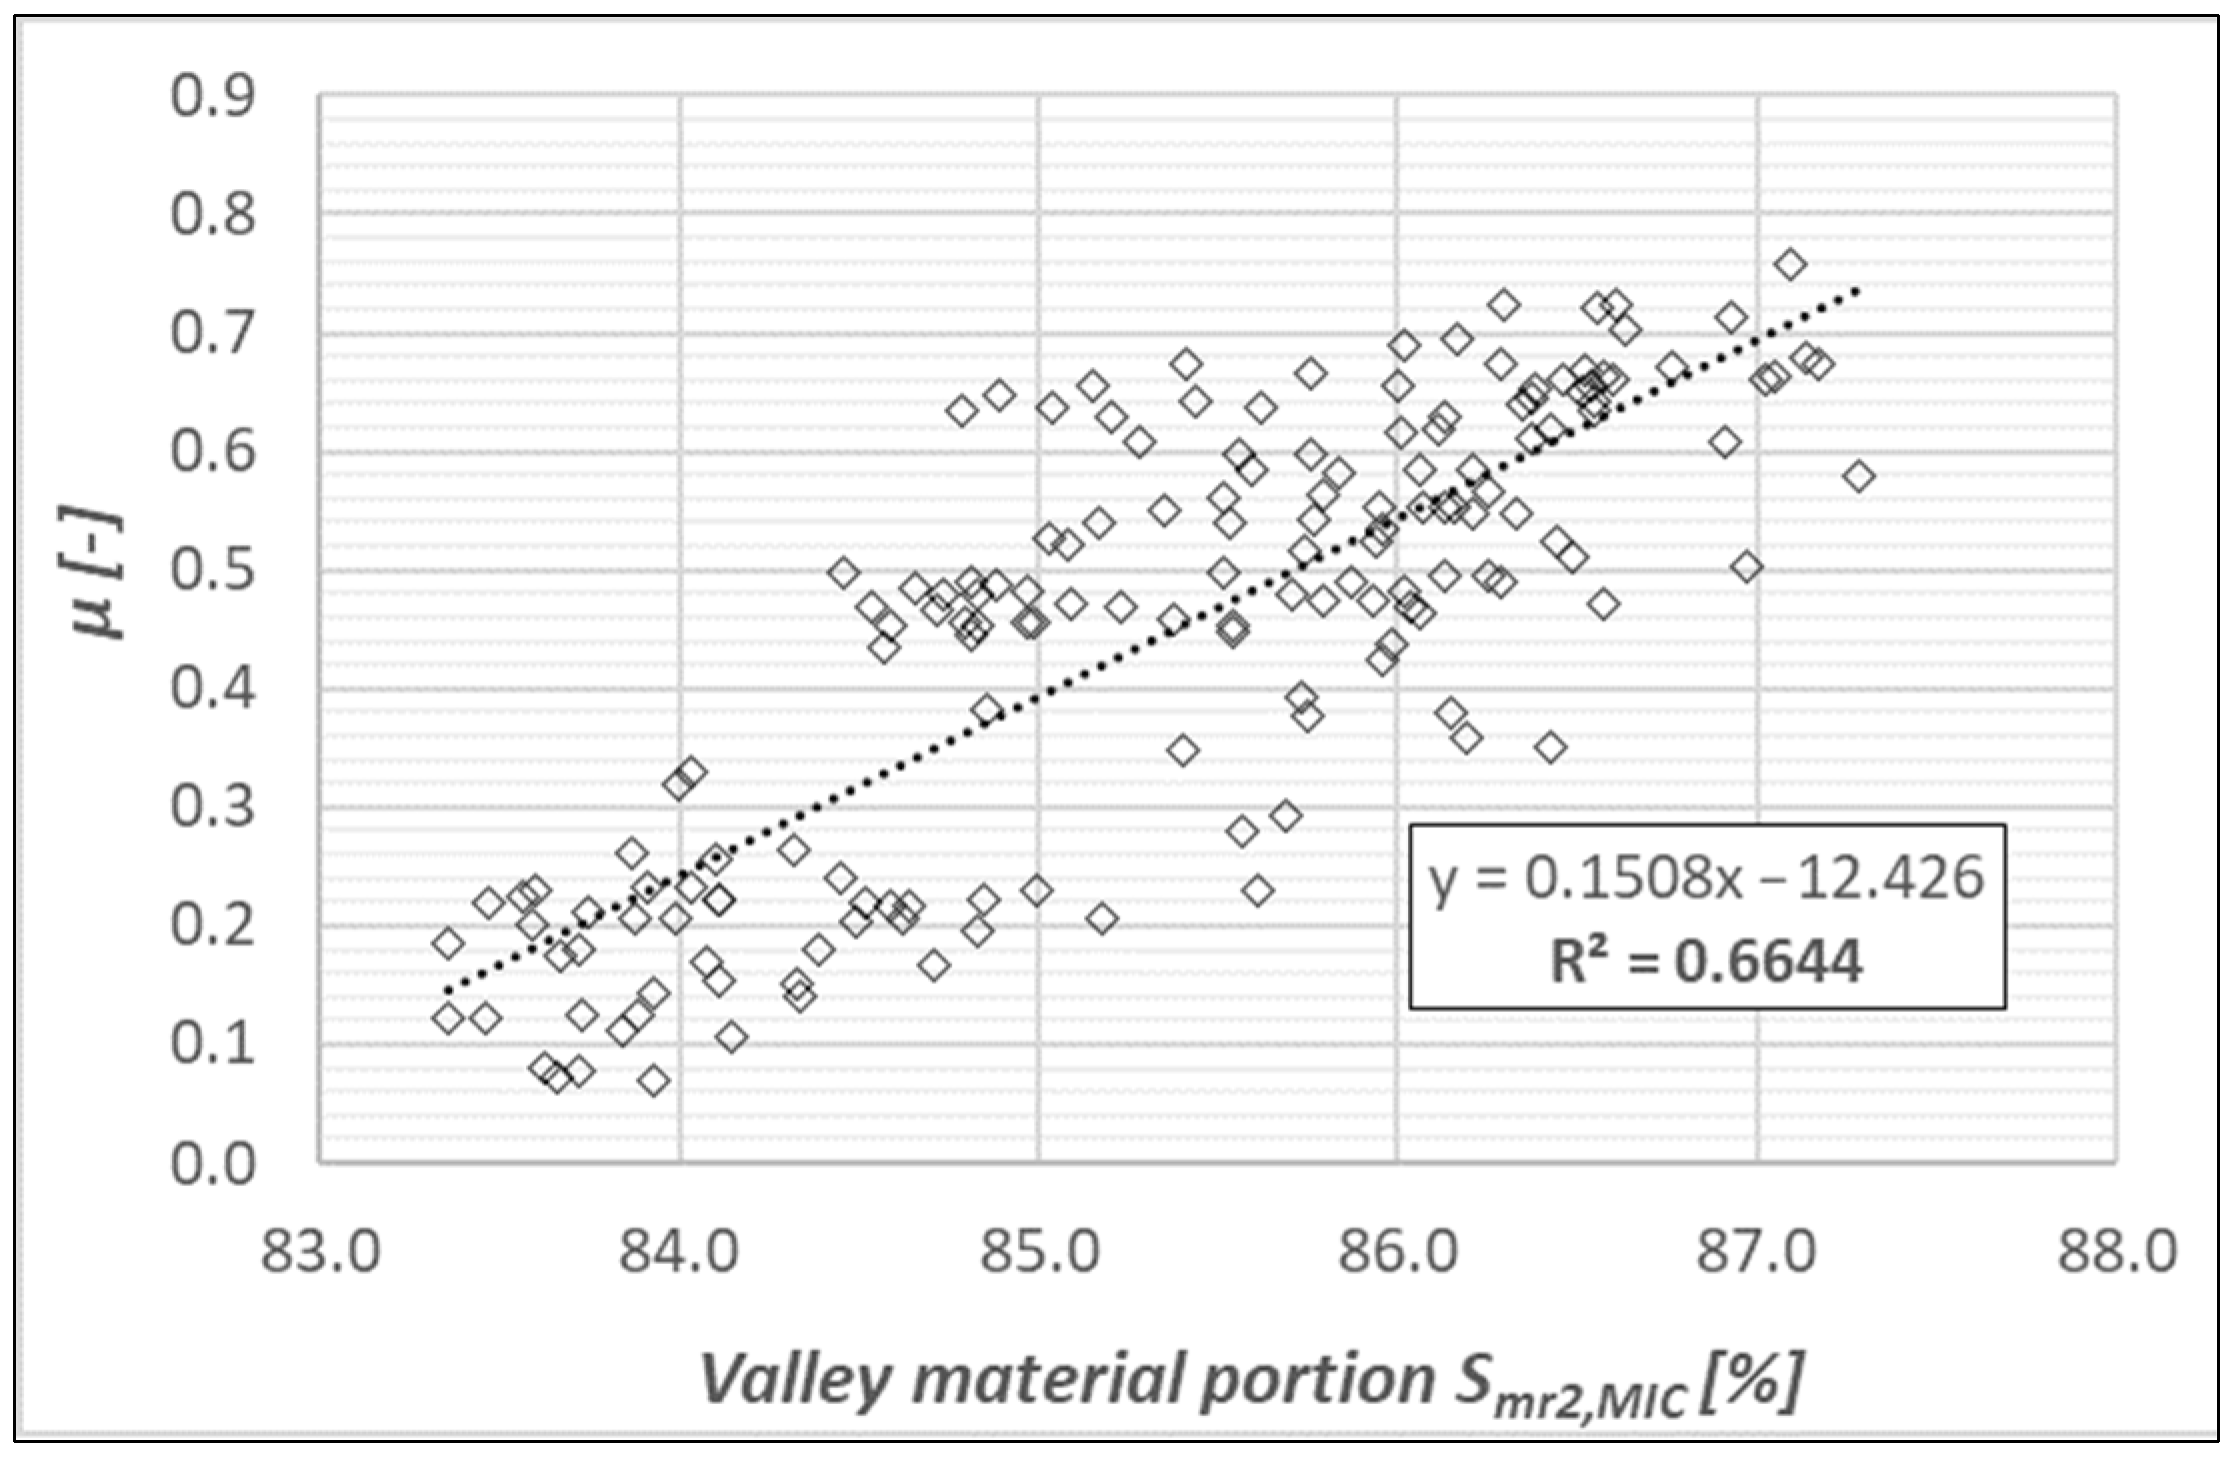
3.3. Texture–Friction Relationship Analysis
- Microtexture:
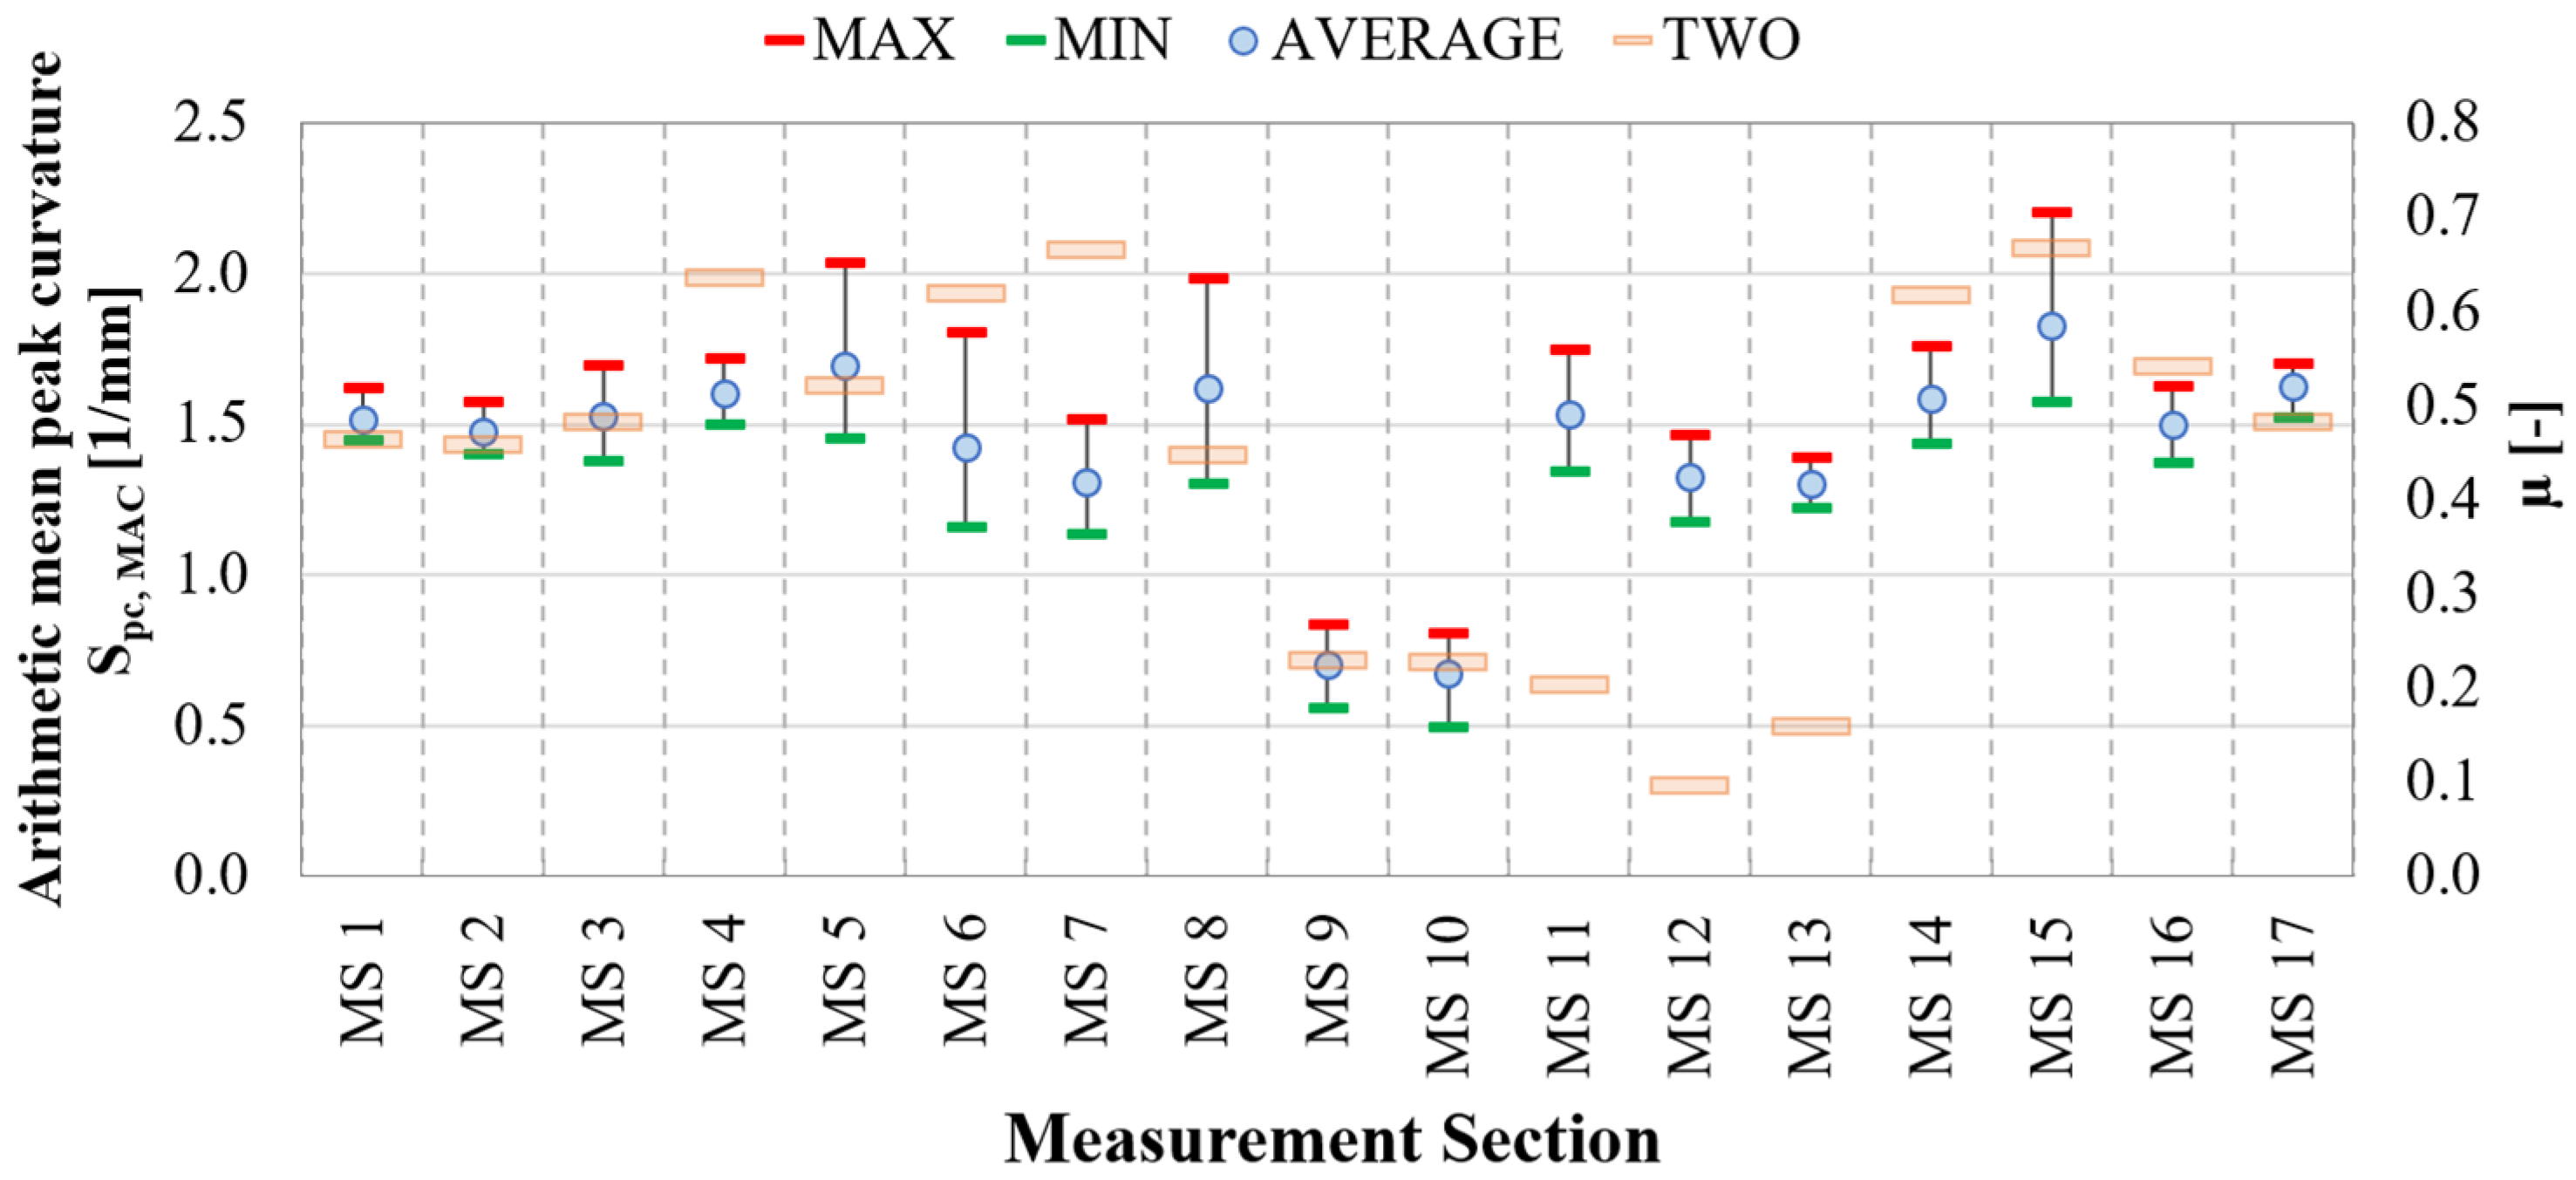
- Macrotexture:
- The relationship between Smr2,MIC and µ confirmed the undeniable impact of surface microtexture on skid resistance;
- The influence of macrotexture on the friction was best demonstrated using the parameter arithmetic mean peak curvature (Spc,MAC), as evidenced by a moderate–strong relationship with friction coefficient µ. A more pronounced effect of this parameter was observed when combined with the microtexture parameter Smr2,MIC in further analysis;
- Under the given test conditions, characteristics related to the surface features’ density, as well as some volume characteristics, did not exhibit as strong correlations as anticipated;
- It was confirmed that high values of individual texture characteristics, both on primary and micro and macrotexture surfaces, do not necessarily represent high friction coefficient values;
- It has been demonstrated that predicting the friction coefficient based solely on individual texture parameters from non-contact measurements is insufficient.
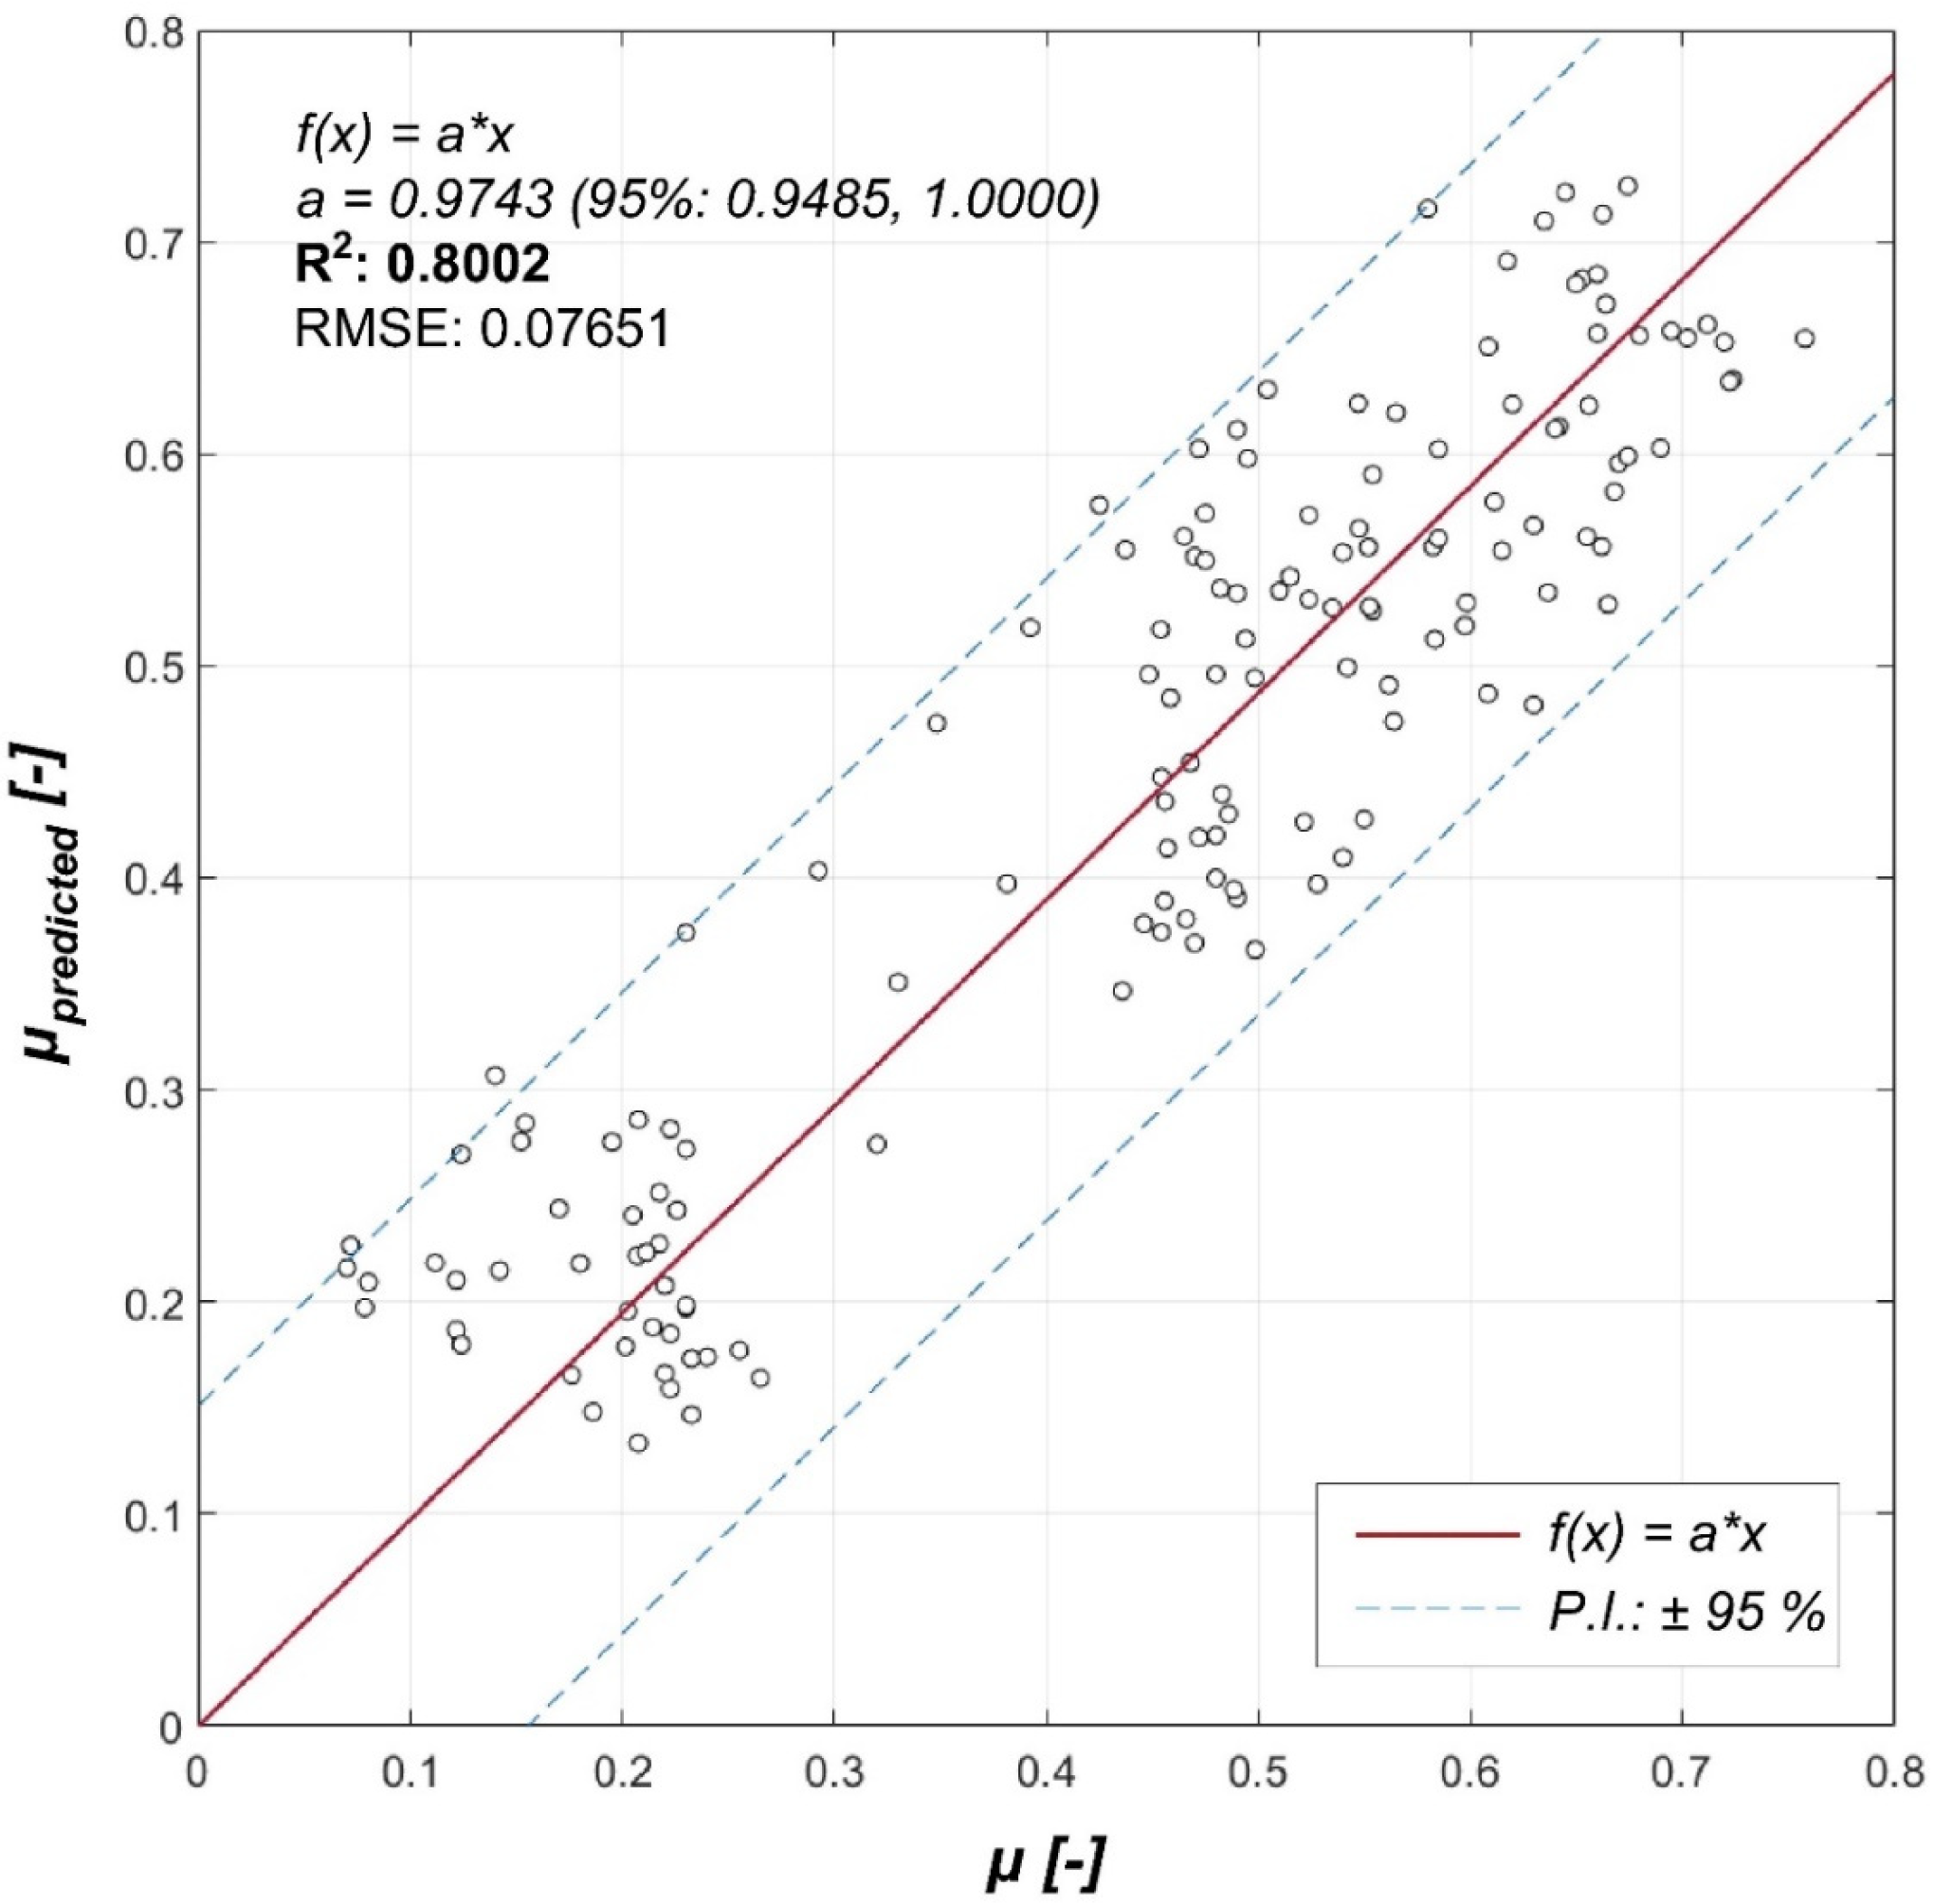
3.4. Development of a Friction Prediction Model Using Texture Parameters
4. Conclusions
Author Contributions
Funding
Institutional Review Board Statement
Informed Consent Statement
Data Availability Statement
Acknowledgments
Conflicts of Interest
References
- Pardillo Mayora, J.M.; Jurado Piña, R. An Assessment of the Skid Resistance Effect on Traffic Safety under Wet-Pavement Conditions. Accid. Anal. Prev. 2009, 41, 881–886. [Google Scholar] [CrossRef] [PubMed]
- Kogbara, R.B.; Masad, E.A.; Kassem, E.; Scarpas, A.; Anupam, K. A State-of-the-Art Review of Parameters Influencing Measurement and Modeling of Skid Resistance of Asphalt Pavements. Constr. Build. Mater. 2016, 114, 602–617. [Google Scholar] [CrossRef]
- Hall, J.W.; Smith, K.L.; Titus-Glover, L.; Wambold, J.C.; Yager, T.J.; Rado, Z. Guide for Pavement Friction; Transportation Research Board: Washington, DC, USA, 2009; ISBN 978-0-309-42974-0. [Google Scholar]
- ISO 13473-2:2002; Characterization of Pavement Texture by Use of Surface Profiles—Part 2: Terminology and Basic Requirements Related to Pavement Texture Profile Analysis. ISO: Geneva, Switzerland, 2002.
- De Martino, M.; Costa, A.L.A.; Timpone, F.; Sakhnevych, A. A Tire/Road Interaction Tool for the Evaluation of Tire Wear for Commercial Vehicles. In Advances in Service and Industrial Robotics: Results of RAAD; Springer: Cham, Switzerland, 2020; pp. 283–293. [Google Scholar]
- Boere, S.; Arteaga, I.L.; Kuijpers, A.; Nijmeijer, H. Tyre/Road Interaction Model for the Prediction of Road Texture Influence on Rolling Resistance. Int. J. Veh. Des. 2014, 65, 202. [Google Scholar] [CrossRef]
- Kane, M.; Riahi, E.; Do, M.-T. Tire/Road Rolling Resistance Modeling: Discussing the Surface Macrotexture Effect. Coatings 2021, 11, 538. [Google Scholar] [CrossRef]
- Li, T. Influencing Parameters on Tire–Pavement Interaction Noise: Review, Experiments, and Design Considerations. Designs 2018, 2, 38. [Google Scholar] [CrossRef]
- Wesołowski, M.; Blacha, K. Evaluation of Airfield Pavement Micro and Macrotexture in the Light of Skid Resistance (Friction Coefficient) Measurements. MATEC Web Conf. 2019, 262, 05017. [Google Scholar] [CrossRef]
- Gierasimiuk, P.; Wasilewska, M.; Gardziejczyk, W. A Comparative Study on Skid Resistance of Concrete Pavements Differing in Texturing Technique. Materials 2021, 14, 178. [Google Scholar] [CrossRef]
- Berardo, A.; Pugno, N.M. A Model for Hierarchical Anisotropic Friction, Adhesion and Wear. Tribol. Int. 2020, 152, 106549. [Google Scholar] [CrossRef]
- Heinrich, G.; Klüppel, M. Rubber Friction, Tread Deformation and Tire Traction. Wear 2008, 265, 1052–1060. [Google Scholar] [CrossRef]
- Singh, D.; Patel, H.; Habal, A.; Das, A.K.; Kapgate, B.P.; Rajkumar, K. Evolution of Coefficient of Friction between Tire and Pavement under Wet Conditions Using Surface Free Energy Technique. Constr. Build. Mater. 2019, 204, 105–112. [Google Scholar] [CrossRef]
- Persson, B.N.J. Theory of Rubber Friction and Contact Mechanics. J. Chem. Phys. 2001, 115, 3840–3861. [Google Scholar] [CrossRef]
- Persson, B.N.J.; Bucher, F.; Chiaia, B. Elastic Contact between Randomly Rough Surfaces: Comparison of Theory with Numerical Results. Phys. Rev. B 2002, 65, 184106. [Google Scholar] [CrossRef]
- Carbone, G.; Lorenz, B.; Persson, B.N.J.; Wohlers, A. Contact Mechanics and Rubber Friction for Randomly Rough Surfaces with Anisotropic Statistical Properties. Eur. Phys. J. E 2009, 29, 275–284. [Google Scholar] [CrossRef]
- Ueckermann, A.; Wang, D.; Oeser, M.; Steinauer, B. Calculation of Skid Resistance from Texture Measurements. J. Traffic Transp. Eng. (Engl. Ed.) 2015, 2, 3–16. [Google Scholar] [CrossRef]
- Pranjić, I.; Deluka-Tibljaš, A. Pavement Texture–Friction Relationship Establishment via Image Analysis Methods. Materials 2022, 15, 846. [Google Scholar] [CrossRef] [PubMed]
- Yan, Y.; Ran, M.; Sandberg, U.; Zhou, X.; Xiao, S. Spectral Techniques Applied to Evaluate Pavement Friction and Surface Texture. Coatings 2020, 10, 424. [Google Scholar] [CrossRef]
- Yang, G.; Wang, K.C.P.; Li, J.Q. Multiresolution Analysis of Three-Dimensional (3D) Surface Texture for Asphalt Pavement Friction Estimation. Int. J. Pavement Eng. 2021, 22, 1882–1891. [Google Scholar] [CrossRef]
- Vallejo, L.E. Fractal Assessment of the Surface Texture of Pavements. Int. J. Pavement Eng. 2001, 2, 149–156. [Google Scholar] [CrossRef]
- Panagouli, O.K.; Kokkalis, A.G. Skid Resistance and Fractal Structure of Pavement Surface. Chaos Solitons Fractals 1998, 9, 493–505. [Google Scholar] [CrossRef]
- Wang, Y.; Lai, X.; Zhou, F.; Xue, J. Evaluation of Pavement Skid Resistance Using Surface Three-Dimensional Texture Data. Coatings 2020, 10, 162. [Google Scholar] [CrossRef]
- Yan, C.; Zhang, Z.; Zhang, Y. Research on Skid Resistance Performance Assessment and Rehabilitation Decision-Making Technology of Asphalt Pavement. E3S Web Conf. 2024, 490, 03017. [Google Scholar] [CrossRef]
- Simone, A.; Lantieri, C.; Vignali, V.; Bitelli, G. 3D Laser Scanner Technique for In Situ Analysis of Road Pavement Surface Texture. In Proceedings of the 7th International Conference on Maintenance and Rehabilitation of Pavements and Technological Control, Auckland, New Zealand, 28–30 August 2012. [Google Scholar]
- Zhao, T.; He, J.; Lv, J.; Min, D.; Wei, Y. A Comprehensive Implementation of Road Surface Classification for Vehicle Driving Assistance: Dataset, Models, and Deployment. IEEE Trans. Intell. Transp. Syst. 2023, 24, 8361–8370. [Google Scholar] [CrossRef]
- Zhao, T.; Guo, P.; Wei, Y. Road Friction Estimation Based on Vision for Safe Autonomous Driving. Mech. Syst. Signal Process. 2024, 208, 111019. [Google Scholar] [CrossRef]
- ISO 16610-61:2015; Geometrical Product Specification (GPS)—Filtration—Part 61: Linear Areal Filters—Gaussian Filters. ISO: Geneva, Switzerland, 2015.
- Song, W. Correlation between Morphology Parameters and Skid Resistance of Asphalt Pavement. Transp. Saf. Environ. 2022, 4, tdac002. [Google Scholar] [CrossRef]
- Afonso, M.L.; Dinis-Almeida, M.; Fael, C.S. Characterization of the Skid Resistance and Mean Texture Depth in a Permeable Asphalt Pavement. IOP Conf. Ser. Mater. Sci. Eng. 2019, 471, 022029. [Google Scholar] [CrossRef]
- Hu, L.; Yun, D.; Liu, Z.; Du, S.; Zhang, Z.; Bao, Y. Effect of Three-Dimensional Macrotexture Characteristics on Dynamic Frictional Coefficient of Asphalt Pavement Surface. Constr. Build. Mater. 2016, 126, 720–729. [Google Scholar] [CrossRef]


| µ | Measurement Section | ||||||||||||||||
|---|---|---|---|---|---|---|---|---|---|---|---|---|---|---|---|---|---|
| 1 | 2 | 3 | 4 | 5 | 6 | 7 | 8 | 9 | 10 | 11 | 12 | 13 | 14 | 15 | 16 | 17 | |
| MIN | 0.44 | 0.38 | 0.35 | 0.60 | 0.47 | 0.50 | 0.52 | 0.28 | 0.21 | 0.20 | 0.17 | 0.07 | 0.12 | 0.44 | 0.62 | 0.38 | 0.35 |
| MAX | 0.49 | 0.50 | 0.61 | 0.67 | 0.56 | 0.68 | 0.76 | 0.55 | 0.29 | 0.27 | 0.23 | 0.13 | 0.23 | 0.78 | 0.72 | 0.64 | 0.66 |
| AVERAGE | 0.46 | 0.46 | 0.48 | 0.64 | 0.52 | 0.62 | 0.67 | 0.45 | 0.23 | 0.23 | 0.20 | 0.10 | 0.16 | 0.62 | 0.67 | 0.54 | 0.48 |
| Characteristics | Road Section | |||||||||||||||||
|---|---|---|---|---|---|---|---|---|---|---|---|---|---|---|---|---|---|---|
| 1 | 2 | 3 | 4 | 5 | 6 | 7 | 8 | 9 | 10 | 11 | 12 | 13 | 14 | 15 | 16 | 17 | ||
| Smr1,MIC | MIN | 13.0 | 12.8 | 13.1 | 14.1 | 11.4 | 11.0 | 11.1 | 11.8 | 11.3 | 11.6 | 13.6 | 12.2 | 13.3 | 11.6 | 11.6 | 11.5 | 11.6 |
| MAX | 14.0 | 13.4 | 14.3 | 14.5 | 12.3 | 11.9 | 11.9 | 13.4 | 12.5 | 13.2 | 14.6 | 13.1 | 14.3 | 12.4 | 12.1 | 12.0 | 11.9 | |
| AVER. | 13.2 | 13.1 | 13.7 | 14.2 | 11.9 | 11.5 | 11.5 | 12.5 | 11.9 | 12.3 | 13.9 | 12.8 | 13.8 | 11.9 | 11.8 | 11.6 | 11.7 | |
| SD | 0.29 | 0.19 | 0.41 | 0.13 | 0.30 | 0.30 | 0.28 | 0.51 | 0.37 | 0.47 | 0.30 | 0.29 | 0.31 | 0.23 | 0.15 | 0.15 | 0.13 | |
| Smr2,MIC | MIN | 84.6 | 84.5 | 85.1 | 84.8 | 85.8 | 86.3 | 86.5 | 84.7 | 83.9 | 83.9 | 83.1 | 83.4 | 83.4 | 85.7 | 86.4 | 85.8 | 85.7 |
| MAX | 85.2 | 85.0 | 86.2 | 85.6 | 86.6 | 87.3 | 87.1 | 85.8 | 85.7 | 85.0 | 84.7 | 84.2 | 84.3 | 86.1 | 86.6 | 86.4 | 86.3 | |
| AVER. | 84.9 | 84.8 | 85.6 | 85.2 | 86.2 | 86.8 | 86.8 | 85.3 | 84.6 | 84.4 | 83.8 | 83.7 | 83.9 | 85.9 | 86.5 | 86.1 | 86.0 | |
| SD | 0.20 | 0.19 | 0.32 | 0.29 | 0.25 | 0.39 | 0.26 | 0.38 | 0.68 | 0.34 | 0.47 | 0.25 | 0.32 | 0.18 | 0.09 | 0.15 | 0.21 | |
| Spc,MAC | MIN | 1.45 | 1.40 | 1.38 | 1.50 | 1.46 | 1.16 | 1.14 | 1.31 | 0.56 | 0.49 | 1.34 | 1.18 | 1.22 | 1.44 | 1.58 | 1.38 | 1.52 |
| MAX | 1.62 | 1.57 | 1.70 | 1.72 | 2.04 | 1.80 | 1.52 | 1.99 | 0.83 | 0.81 | 1.75 | 1.46 | 1.39 | 1.76 | 2.20 | 1.63 | 1.70 | |
| AVER. | 1.52 | 1.48 | 1.53 | 1.60 | 1.70 | 1.43 | 1.31 | 1.62 | 0.70 | 0.67 | 1.53 | 1.32 | 1.31 | 1.59 | 1.83 | 1.50 | 1.62 | |
| SD | 0.07 | 0.05 | 0.09 | 0.08 | 0.18 | 0.19 | 0.11 | 0.26 | 0.08 | 0.10 | 0.15 | 0.09 | 0.07 | 0.10 | 0.18 | 0.09 | 0.07 | |
| Smc,PS | MIN | 0.62 | 0.48 | 0.54 | 0.50 | 0.81 | 0.90 | 0.70 | 1.12 | 0.37 | 0.35 | 1.28 | 0.79 | 0.93 | 0.87 | 0.85 | 0.74 | 0.72 |
| MAX | 0.70 | 0.60 | 0.63 | 0.66 | 1.22 | 1.39 | 1.18 | 1.79 | 0.58 | 0.59 | 1.93 | 0.93 | 1.29 | 1.16 | 1.02 | 1.03 | 1.17 | |
| AVER. | 0.65 | 0.53 | 0.58 | 0.58 | 1.03 | 1.19 | 0.85 | 1.42 | 0.44 | 0.46 | 1.59 | 0.86 | 1.06 | 0.98 | 0.93 | 0.84 | 0.88 | |
| SD | 0.03 | 0.03 | 0.03 | 0.05 | 0.15 | 0.15 | 0.15 | 0.21 | 0.07 | 0.08 | 0.17 | 0.05 | 0.12 | 0.08 | 0.06 | 0.10 | 0.15 | |
| Vvv,PS | MIN | 0.09 | 0.07 | 0.09 | 0.09 | 0.15 | 0.07 | 0.06 | 0.08 | 0.03 | 0.04 | 0.11 | 0.06 | 0.09 | 0.09 | 0.09 | 0.09 | 0.10 |
| MAX | 0.12 | 0.09 | 0.12 | 0.12 | 0.32 | 0.14 | 0.09 | 0.16 | 0.09 | 0.11 | 0.19 | 0.11 | 0.15 | 0.12 | 0.12 | 0.12 | 0.12 | |
| AVER. | 0.11 | 0.08 | 0.10 | 0.11 | 0.23 | 0.10 | 0.08 | 0.12 | 0.06 | 0.07 | 0.15 | 0.08 | 0.12 | 0.11 | 0.10 | 0.10 | 0.11 | |
| SD | 0.01 | 0.01 | 0.01 | 0.01 | 0.06 | 0.02 | 0.01 | 0.02 | 0.02 | 0.02 | 0.02 | 0.01 | 0.02 | 0.01 | 0.01 | 0.01 | 0.01 | |
| Coefficients | Standard Error | p-Value | r | R2 | R2adjusted | F-Value | Ftab | ||
|---|---|---|---|---|---|---|---|---|---|
| Intercept | a0 | −11.526 | 0.557 | 3.94 × 10−45 | 0.8837 | 0.7809 | 0.814 | 321.740 | 3.058 |
| Smr2,MIC | a1 | 0.138 | 0.007 | 2.50 × 10−45 | |||||
| Spc,MAC | a2 | 0.153 | 0.021 | 1.86 × 10⁻¹¹ | |||||
| Coefficients | Standard Error | p-Value | r | R2 | R2adjusted | F-Value | Ftab | ||
|---|---|---|---|---|---|---|---|---|---|
| Intercept | a0 | −11.362 | 0.540 | 8.44 × 10−46 | 0.8945 | 0.8002 | 0.826 | 234.100 | 2.667 |
| Vvv,PS | a1 | −0.568 | 0.167 | 8.41 × 10⁻⁴ | |||||
| Smr2,MIC | a2 | 0.136 | 0.006 | 4.69 × 10−46 | |||||
| Spc,MAC | a3 | 0.192 | 0.023 | 9.07 × 10⁻¹⁴ | |||||
Disclaimer/Publisher’s Note: The statements, opinions and data contained in all publications are solely those of the individual author(s) and contributor(s) and not of MDPI and/or the editor(s). MDPI and/or the editor(s) disclaim responsibility for any injury to people or property resulting from any ideas, methods, instructions or products referred to in the content. |
© 2024 by the authors. Licensee MDPI, Basel, Switzerland. This article is an open access article distributed under the terms and conditions of the Creative Commons Attribution (CC BY) license (https://creativecommons.org/licenses/by/4.0/).
Share and Cite
Kováč, M.; Brna, M.; Pisca, P.; Decký, M. Prediction of Friction Coefficient Based on 3D Texture Characteristics of Road Surfaces. Appl. Sci. 2024, 14, 7549. https://doi.org/10.3390/app14177549
Kováč M, Brna M, Pisca P, Decký M. Prediction of Friction Coefficient Based on 3D Texture Characteristics of Road Surfaces. Applied Sciences. 2024; 14(17):7549. https://doi.org/10.3390/app14177549
Chicago/Turabian StyleKováč, Matúš, Matej Brna, Peter Pisca, and Martin Decký. 2024. "Prediction of Friction Coefficient Based on 3D Texture Characteristics of Road Surfaces" Applied Sciences 14, no. 17: 7549. https://doi.org/10.3390/app14177549