Abstract
Lithium-ion batteries, with their high energy density, long cycle life, and non-polluting advantages, are widely used in energy storage stations. Connecting lithium batteries in series to form a battery pack can achieve the required capacity and voltage. However, as the batteries are used for extended periods, some individual cells in the battery pack may experience abnormal failures, affecting the performance and safety of the battery pack. At the same time, as batteries operate in complex environments, the data collected by sensors are susceptible to random noise and drift interference, which can affect the accuracy of anomaly detection in individual battery cells. In order to solve this problem, this article proposes an anomaly detection method for battery cells based on Robust Principal Component Analysis (RPCA), taking the historical operation and maintenance data of a large-scale battery pack from an energy storage station as the research subject. Firstly, theRPCA is used to denoise the observed voltage data of the battery cells to an extreme degree, obtaining a baseline charging state curve for a cell consistency assessment. This also solves the problem of sensor outputs being affected by random noise. To further detect and identify abnormal battery cells, the RPCA is used to extract outlier components. Based on the Average Deviation-3σ principle and by utilizing Gaussian distribution probability characteristics, battery cells are conducted to screen, and the serial numbers of the anomaly cells are obtained. Finally, the effectiveness and accuracy of this anomaly detection method for battery cells are compared and verified through different statistical distributions.
1. Introduction
Owing to their high energy density, long cycle life, and non-polluting advantages, lithium-ion batteries are widely used in energy storage stations [1]. Through series and parallel connections, a lithium battery can be formed into a battery pack and achieve the required capacity and voltage, meeting the requirements of actual application scenarios [2,3]. The processes and materials used in the production of battery cells make it impossible for them to be completely consistent from the start. As lithium-ion batteries are used over time, this inconsistency will cause increasingly significant differences in capacity and voltage among battery cells, leading some battery cells to reach the end of their lives prematurely. This triggers an overall capacity loss, shortens the overall lifespan of the battery pack, and even leads to overheating, thermal runaway, and other accidents [4], affecting the performance and safety of the battery pack. Furthermore, the voltage data of battery cells in a battery pack generally consist of valid measurement data and measurement errors. The presence of measurement errors is a normal phenomenon in experiments, mainly due to the sensor drift and random noise in the sensor output data, obscuring the actual measurement data. However, when measurement errors are large and deviate from normal measurement data, they are considered abnormal voltage data. Such abnormal voltage data occur because the battery has experienced over-charging, over-discharging, imbalance, thermal runaway, and other faults [5,6], causing voltage changes abnormally. Consistency anomaly detection of the battery voltage can help to achieve early warning of battery faults and avoid safety accidents in energy storage stations.
A large number of scholars have conducted research on the detection of abnormal voltage in battery cells, mainly including data-driven approaches and statistical analysis approaches [7]. Data-driven approaches can select machine learning models based on the characteristics of the dataset and then use the model to obtain the historical regression of the voltage time series, identifying batteries that exhibit abnormal external signal characteristics under the same operating conditions [8]. Data-driven approaches usually include Local Outlier Factor (LOF) algorithms [9], K-means algorithms [10], neural network algorithms [11], Gaussian Process Regression (GPR) [12], etc. Since the K-means clustering algorithm is less efficient when dealing with large amounts of data, reference [13] proposes a fault identification method for inconsistent voltage in battery cells based on K-means++ clustering with dynamic k-values, which can identify abnormal cells up to 6 days earlier. Reference [14] uses the BP neural network and 3σ-MSS strategy to detect and calculate the abnormal changes in battery voltages within the battery pack and then verifies the calculation results using the LOF algorithm and clustering algorithms. Based on the EV data collected by NMMP-NEV, reference [15] proposes an improved GPR-based method for recognizing abnormal charging capacities and uses a Box-Cox transform with the value of 3σ to determine the threshold. However, some data-driven approaches compare detected parameters with preset thresholds, which may lead to errors or misjudgments. Others require a large amount of training data, and the calculation cost of manually preprocessing and training data is high. Moreover, the data quality, which is affected by various factors, can also affect the calculation accuracy and robustness of data-driven models.
Statistical analysis approaches estimate the probability distribution of data, identifying values with low probability density as outliers [16,17]. Common approaches include the 3σ criterion, boxplots, information entropy, and measures describing data variability such as the mean squared error, standard deviation, coefficient of variation, and interquartile range. Reference [18] uses the mean squared error (MSE) between the experimental voltage and the simulated voltage from a first-order RC equivalent circuit model to describe the characteristics of battery voltages, determining whether there are voltage anomalies, and uses an improved Z-score method to quantitatively evaluate voltage faults. Reference [19] proposes a voltage abnormal detection method for electric vehicle batteries based on modified Shannon entropy and standard deviation, which can predict the exact times and locations of faulty batteries in battery packs ahead of time. Reference [20] uses the modified Shannon entropy to describe the voltage evolution of each battery, diagnoses faulty batteries by observing and analyzing the entropy values of individual batteries, and then evaluates the degree and level of failure through the Z-score and anomaly coefficient. Reference [21] proposes a hybrid fault diagnosis method that combines Multiscale Permutation Entropy (MPE) and the Coefficient of Variation (CV), using the 3σ principle as the threshold for battery failure. Statistical analysis approaches are suitable for univariate datasets, enabling the rapid and effective identification of outliers while also representing the informational characteristics contained in the data. However, interpreting outliers detected by these methods can be challenging, and data distributions, probability models, and parameters are hard to determine, constraining their use. Moreover, as the data dimensions and volumes increase, the efficiency of these anomaly detection approaches decreases.
Robust Principal Component Analysis (RPCA) [22] is an unsupervised feature machine learning method that can effectively extract the main information from the observed data with sparse noise and severe outliers, successfully denoising the observed data. Conducting the RPCA using the Alternating Direction Method of Multipliers (ADMM) can ensure calculation accuracy while achieving a faster computational speed [23].
In summary, to solve the problem of data quality affecting the accuracy of anomaly detection in battery cells, this article proposes a method for data denoising and anomaly detection in series-connected battery cells based on historical operation and maintenance data from a large domestic energy storage station. This method combines RPCA with mathematical statistical methods to achieve screening, identification, and consistency assessments of abnormal battery cells. Firstly, the RPCA is used for the extreme denoising of the voltage observation data, obtaining a baseline charging state curve for a battery cell consistency assessment, which also resolves the problem of the sensor output data being affected by random noise. To further detect and identify abnormal battery cells, the RPCA is used to extract outlier components. Based on the Average Deviation-3σ principle and utilizing Gaussian distribution probability characteristics, battery cells are conducted to screen and the serial numbers of the anomaly cells can be obtained. Finally, by replacing the calculation of the average deviation with variance, range, Euclidean distance, and signal energy, the effectiveness and accuracy of this anomaly detection method for battery cells are compared and verified. Therefore, this article is organized as follows: Section 2 introduces the source and describes the preprocessing of the data. Section 3 describes the process of the anomaly detection method for battery cells. Section 4 provides the experimental analysis and verifications of the proposed method. Finally, Section 5 presents the conclusion.
2. Source and Preprocessing of Data
The data in this article are derived from historical operation and maintenance data of a certain energy storage station, which consists of seven battery packs connected in parallel, as shown in Figure 1.
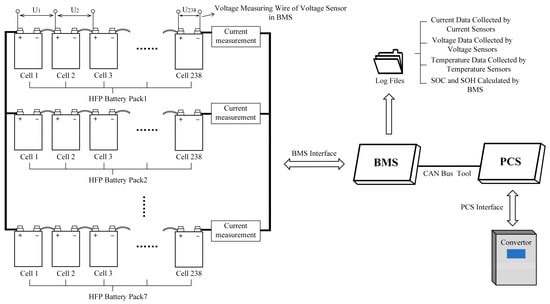
Figure 1.
The collection process of the voltages and currents of battery cells in an energy storage station.
Cell monitoring technology is one of the core functions of a Battery Management System (BMS) that is used to collect the voltage and temperature of a battery cell as well as detect the current of the battery pack. These data are collected using sensors and stored in Log Files, which facilitate extraction when conducting a data analysis. A Power Conversion System (PCS) is used to control the charging and discharging process of battery cells/battery packs, performing AC/DC conversion.
The subject of this experiment is a large-scale lithium battery pack within the station, consisting of 238 series-connected battery cells. Table 1 lists the battery specifications.

Table 1.
The battery specifications.
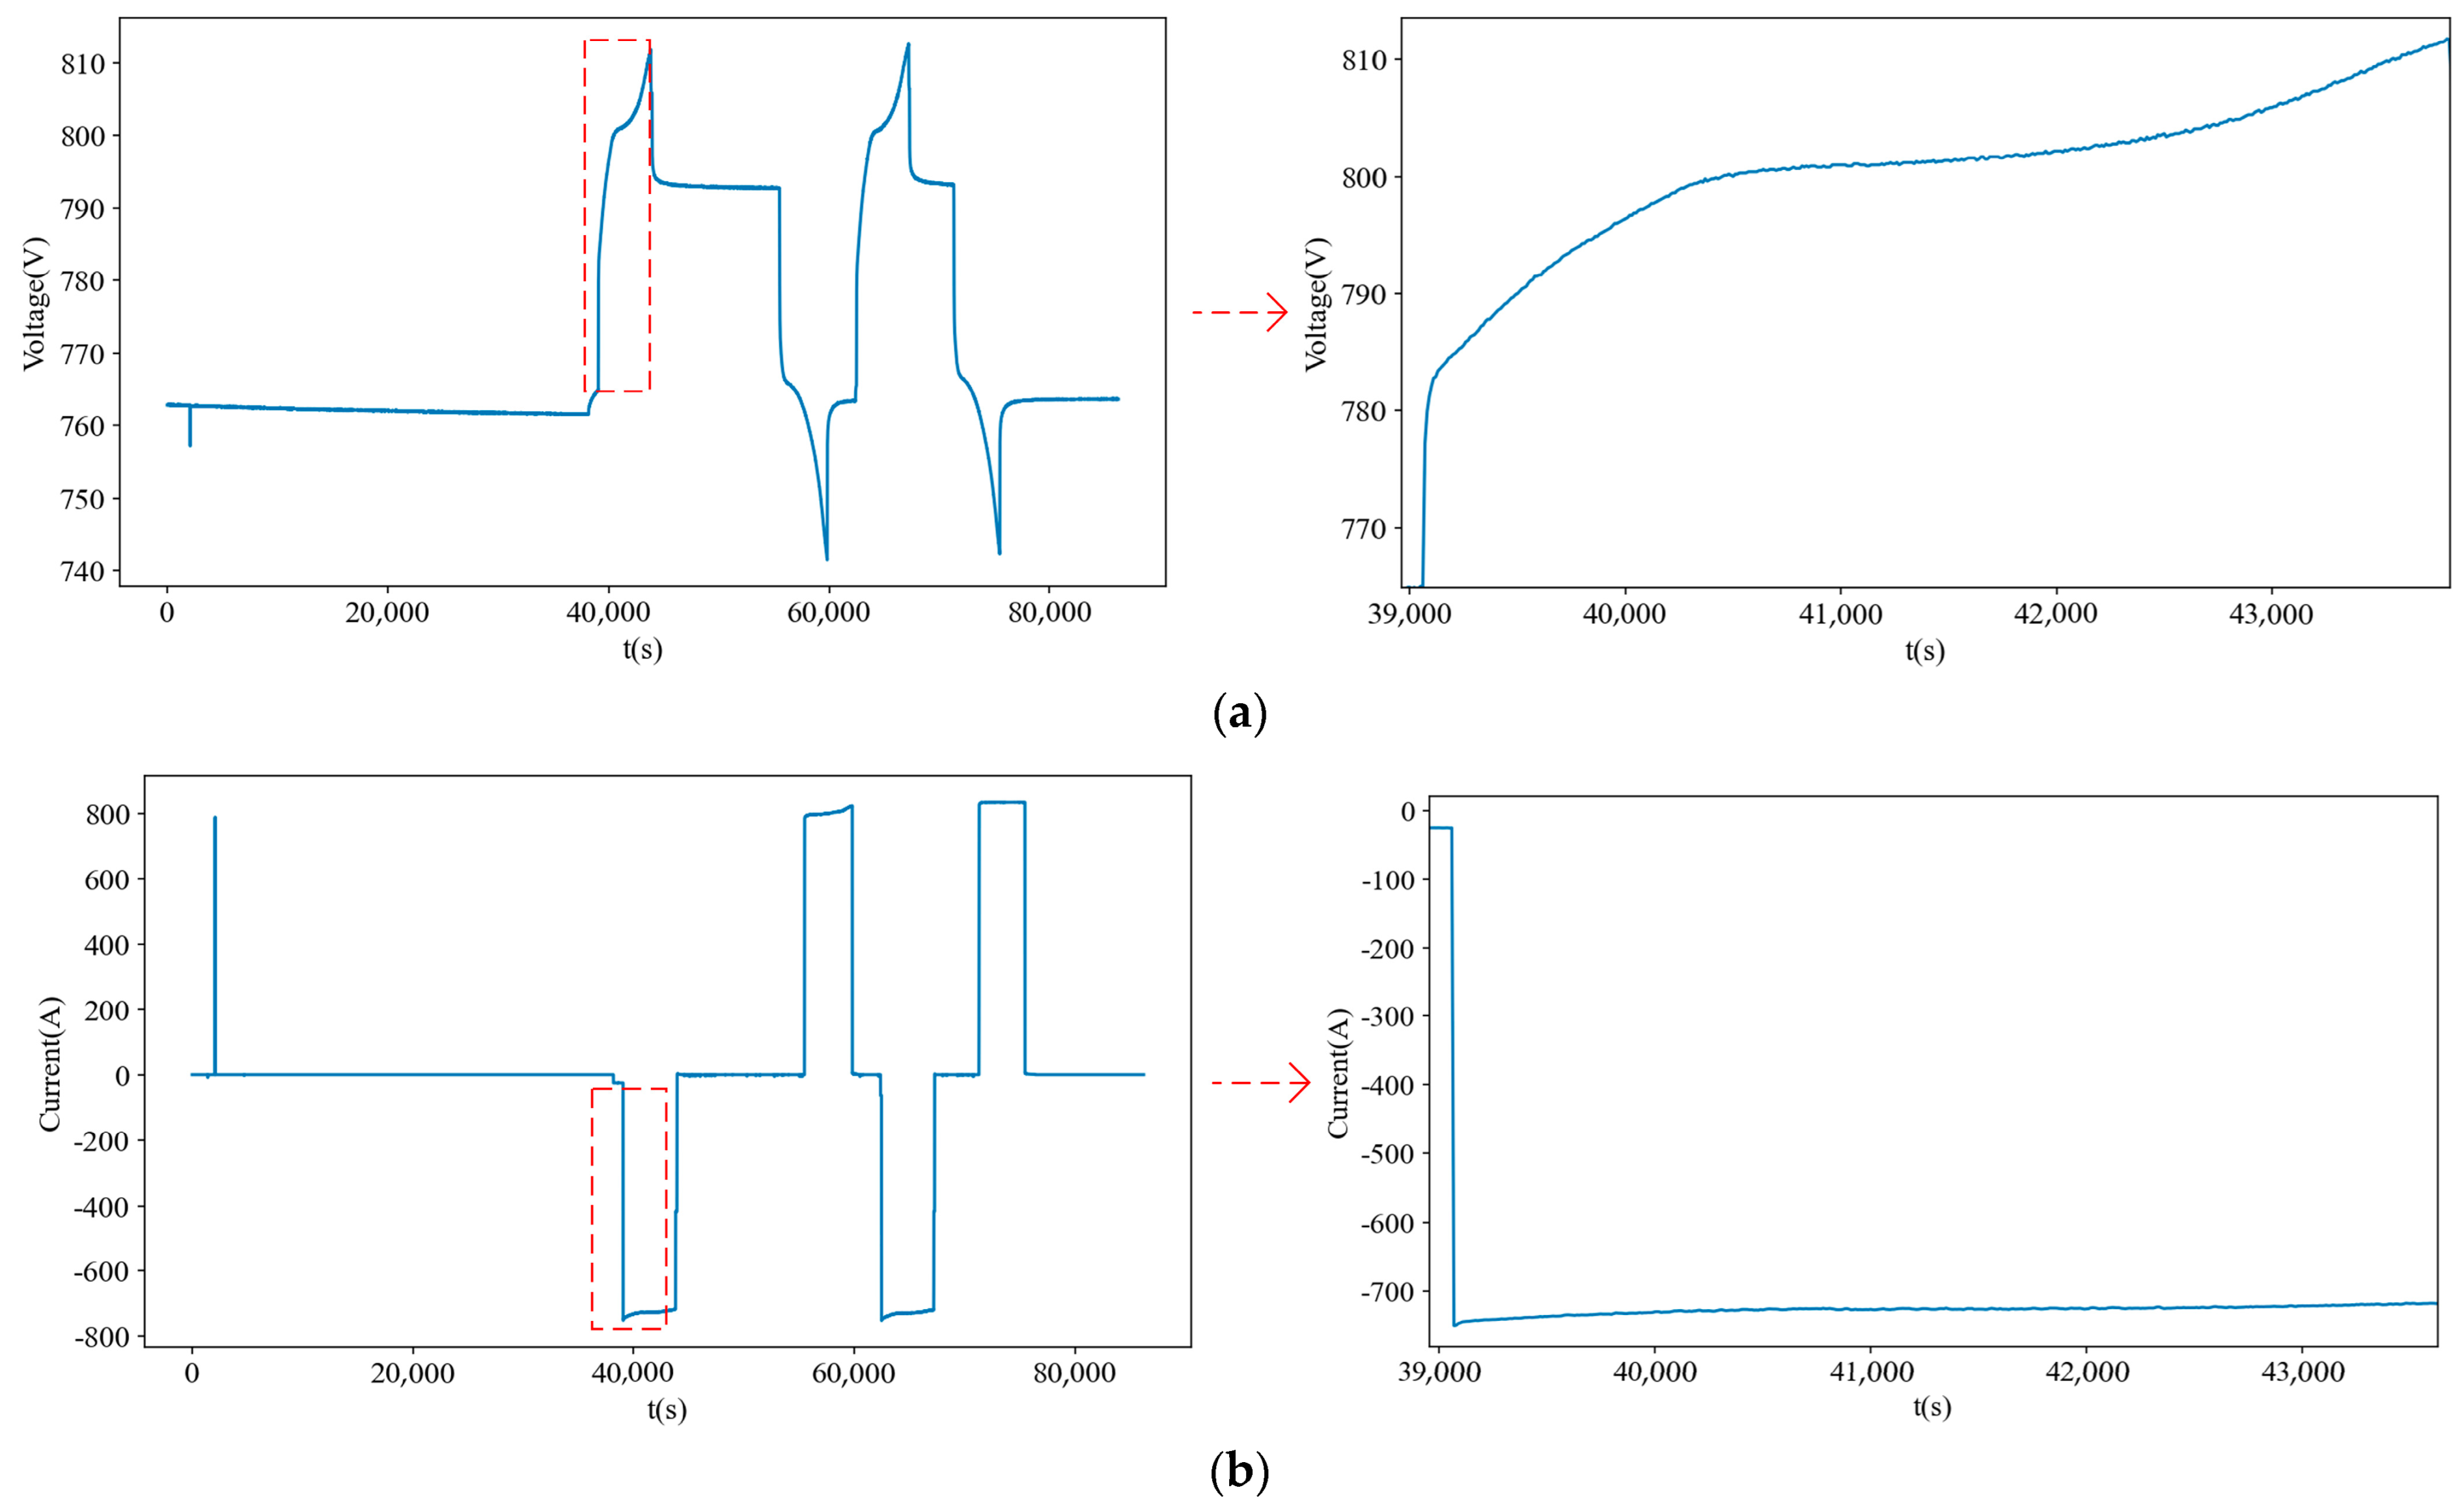
Voltage and current changes are monitored through voltage and current sensors with a sampling frequency of 10 s. The voltage and current of this battery pack on 30 June 2023 are as follows.
The data are conducted to segment using the point at which a drop in current during the charging end leads to a change in the working conditions and an increase in the battery capacity as the threshold, and then a segment of charging data for battery cells (the red areas shown in Figure 2) is extracted, as shown in Figure 3. Due to the large number of battery cells, their labels are not displayed.
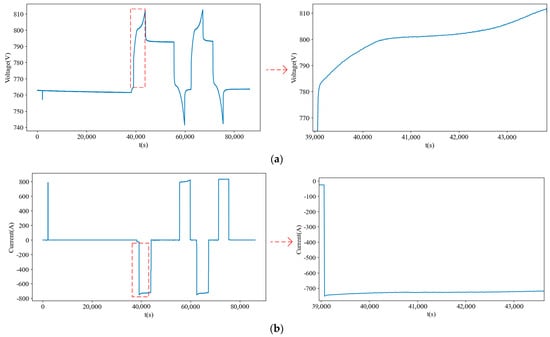
Figure 2.
June 30. (a) The voltage of the battery pack. (b) The current of the battery pack.
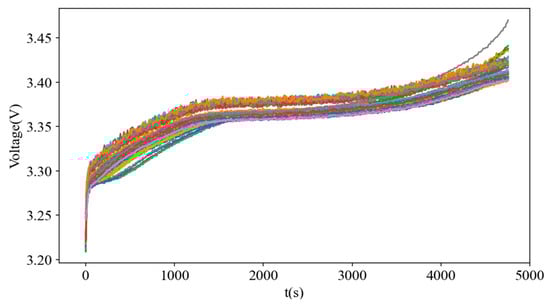
Figure 3.
Charging curves of 238 series-connected battery cells.
Based on this set of data, the anomaly detection method for battery cells is introduced in Section 3.
3. Anomaly Detection Process for Battery Cells
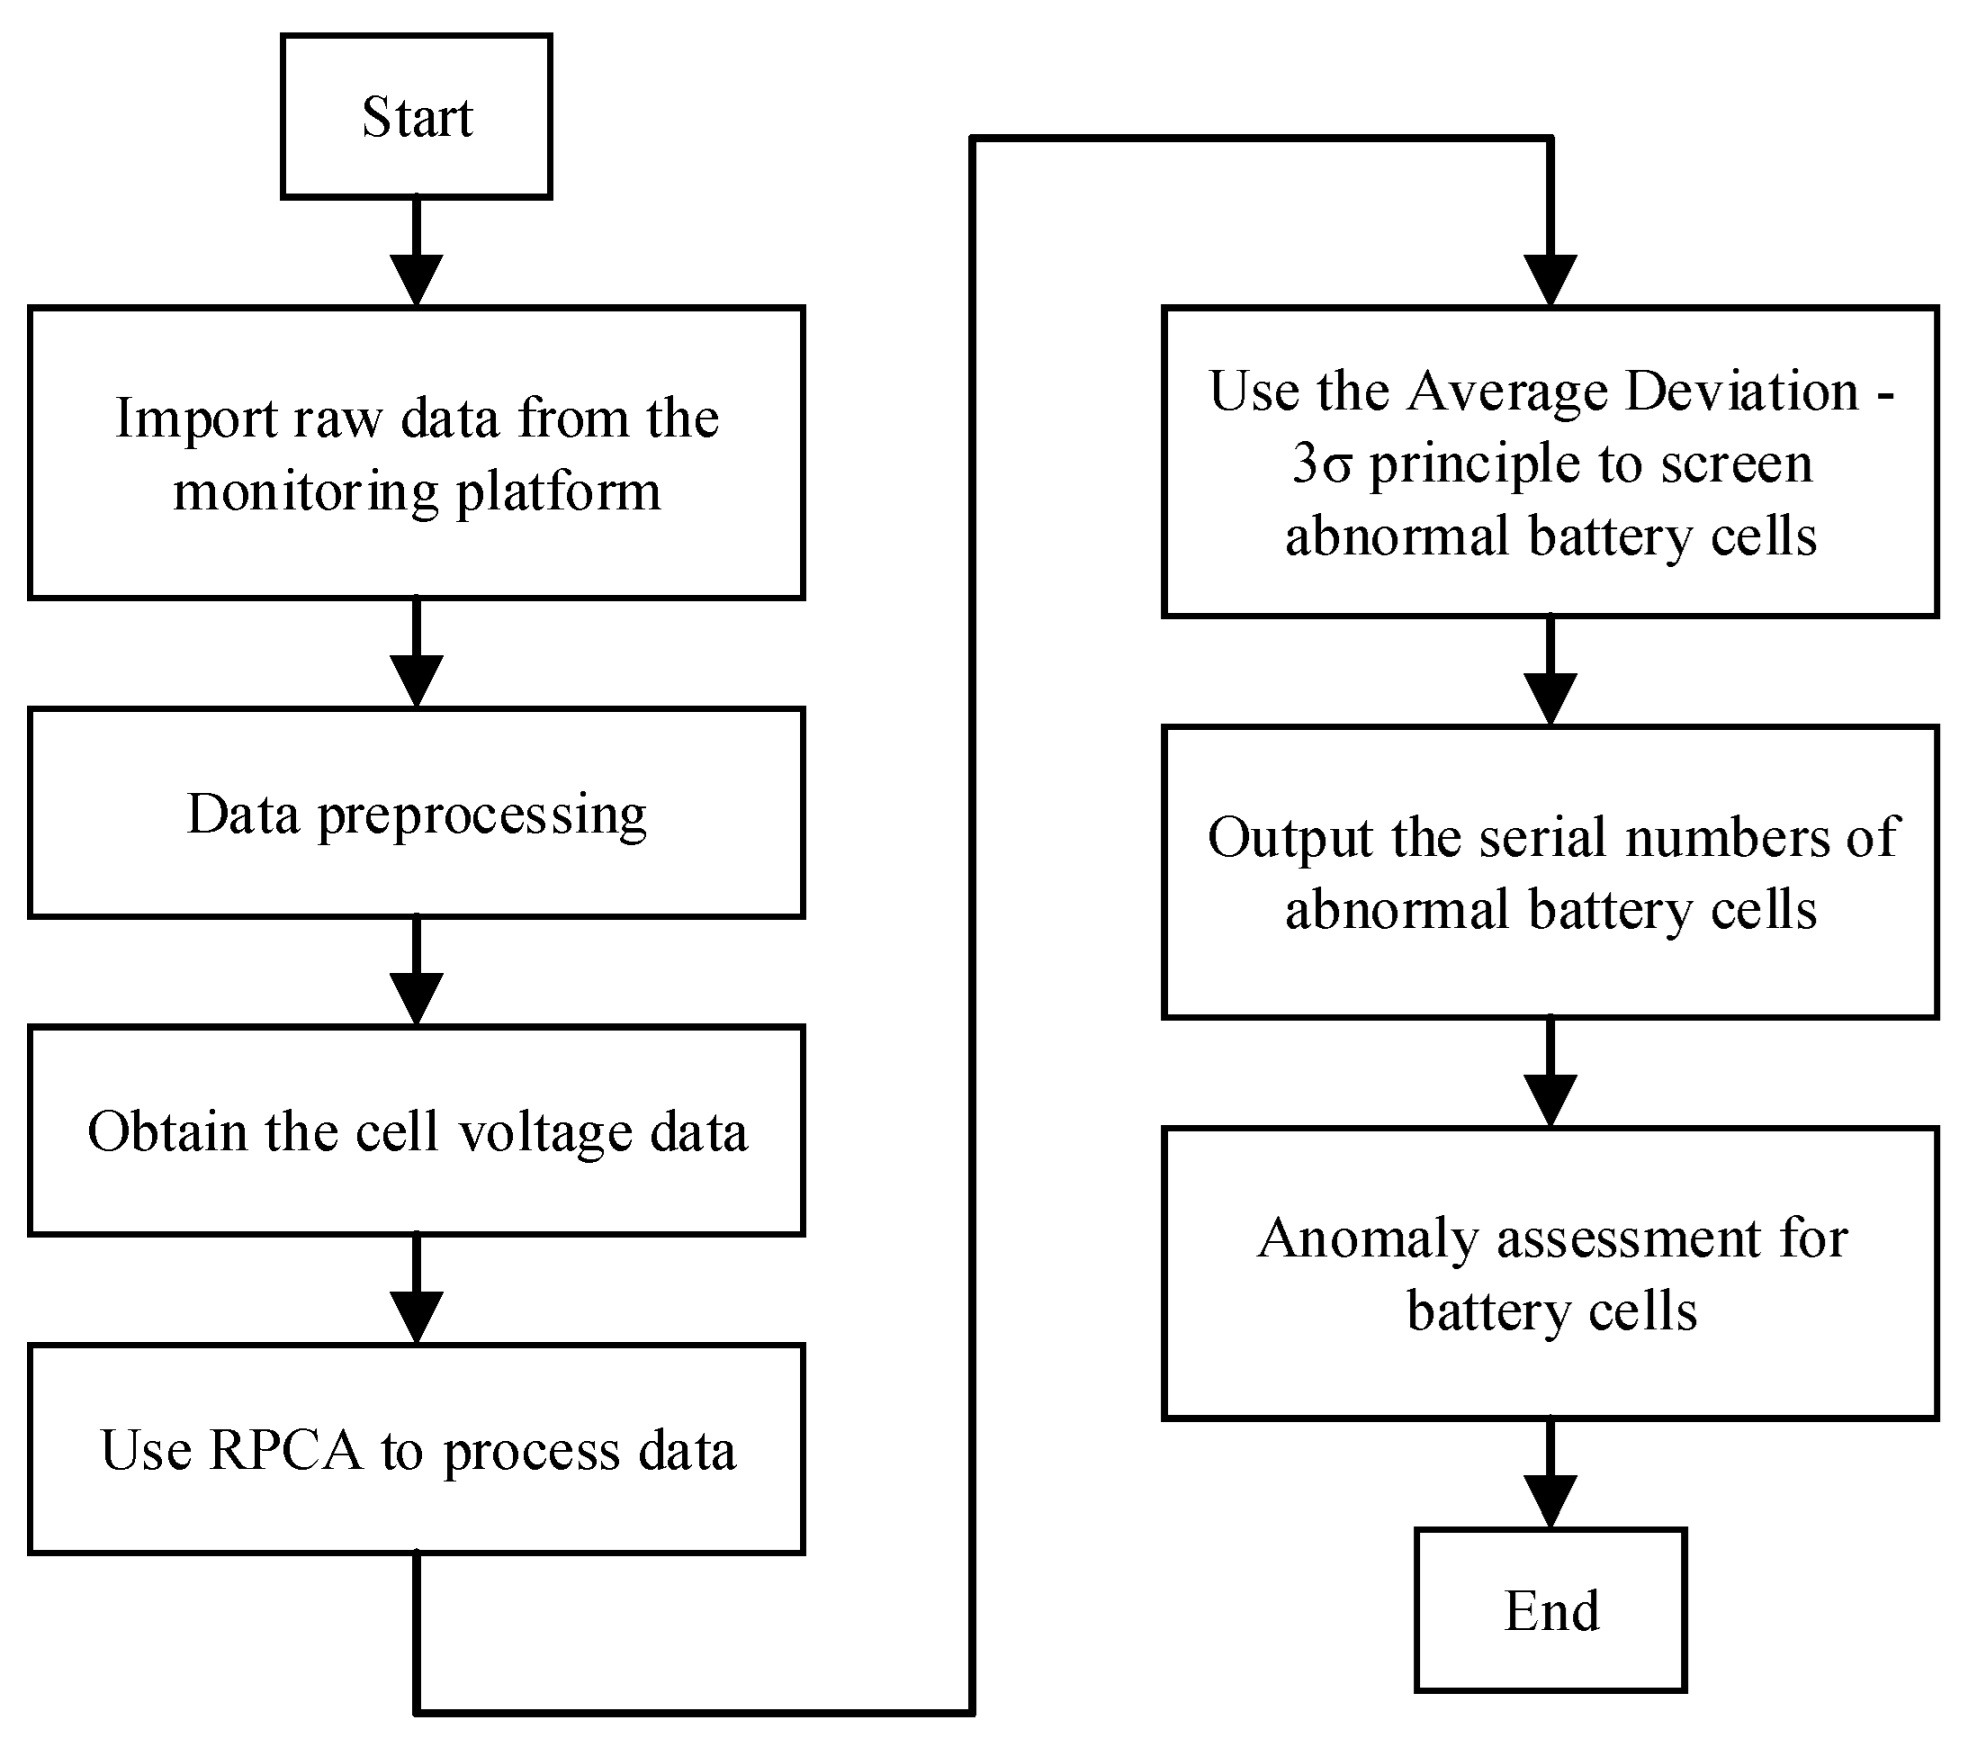
Based on the results of data preprocessing in Section 2, the anomaly detection process of battery cells is shown in Figure 4. Initially, the RPCA technique is employed for data processing, followed by the application of the Average Deviation-3σ principle to filter out anomalous battery cells and output their serial numbers. Subsequently, a consistency assessment is conducted on them.
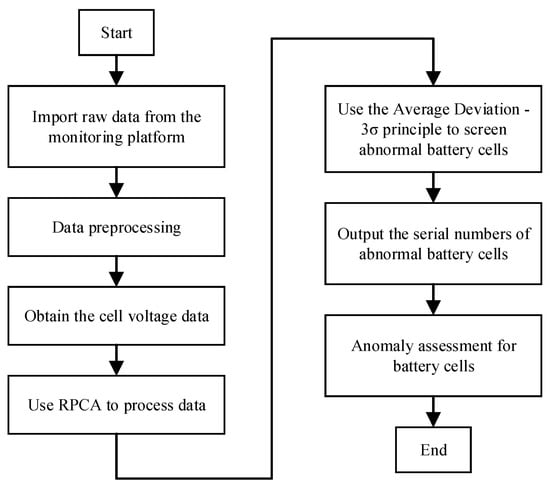
Figure 4.
Process of anomaly detection for battery cells.
3.1. The Principle of RPCA
RPCA decomposes the observation data matrix D into a low-rank matrix A and a sparse matrix E, as shown in Figure 5. Here, the low-rank matrix A retains the main components of the data, while the sparse matrix E contains random noise in the observed data. Using RPCA can identify the most essential elements and structures within the data effectively, simplifying the original data. The principle is shown below.
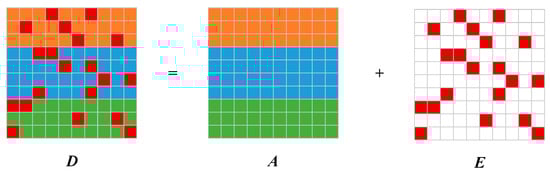
Figure 5.
The observed data matrix D is decomposed through RPCA. The non-zero elements (red squares) represent noise or outliers in different groups of data (orange, blue and green squares), while the zero values (white squares) indicate parts of the data that are unaffected by noise or outliers.
The decomposition problem of an observed data matrix can be modeled as the following convex optimization problem.
Here, .
Equation (1) is solved by using the ADMM, and an augmented Lagrangian function is constructed.
Here, is the Lagrange multiplier. When and , the alternating method is used to solve the block optimization problem:
For k = 1, 2, 3, …, the ADMM iteratively updates A and E until convergence is achieved.
Here, is the singular value threshold operator, and is the soft threshold operator.
is specifically designed to handle the low-rank approximation problems of matrices, which is implemented through Singular Value Decomposition (SVD), as shown in Equation (6).
Here, , , , U, and V are orthogonal matrices, while Σ is a diagonal matrix. Here, Σ is the singular value matrix with min (m, n) singular values.
, as a nonlinear operation, processes each element in a vector or matrix by setting a threshold. It sets elements with an absolute value less than the threshold to zero, and it shrinks elements with an absolute value greater than the threshold towards the origin.
The updated matrix Y is given by Equation (7).
The updated parameter is given by Equation (8).
Here, > 1, which is a constant, and > 0, which is a small positive number.
The characteristics of series-connected battery cells should be consistent, and the rows of the voltage data matrix composed of battery cells should have strong similarities; therefore, the data matrix should have a low rank. In an ideal state, the rank of this data matrix should be 1. However, abnormal voltages caused by inconsistency among battery cells and random noise destroy this low-rank property. Therefore, to restore the low-rank structure of the battery cell voltage data, the RPCA is used to denoise and extract the anomaly components.
3.2. Consistency Assessment for Battery Cells
In the singular value matrix Σ obtained through the RPCA, the size of the singular values reflects the weight of every component in the data matrix D. The larger the singular values are, the more corresponding components contribute when reconstructing the original data. Usually, the first singular value is the largest. Moreover, the ranking of the singular values also determines the nuclear norm of the low-rank matrix (the sum of the singular values), which is used in optimization problems to measure low rankness.
The first singular value in the singular value matrix Σ represents the most significant component in the data matrix D. Only is retained, and all other singular values are set to 0, as shown in Equation (9).
Then, the original data matrix is reconstructed through Equation (10), and the matrix can be obtained. At this point, the rank of matrix is 1, which is equivalent to extreme denoising on the original data matrix.
Here, .
Taking the average curve of 238 battery cell charging curves obtained through extreme denoising using RPCA assesses the consistency of the charging state of battery cells. A battery cell is considered normal when its charging curve remains approximately parallel to the average curve, whereas a battery cell is considered abnormal when its charging curve has a clear deviation from the average curve.
Next, a method of screening and identifying abnormal battery cells will be introduced by setting the threshold value of the charging voltage for battery cells.
3.3. Sceening and Identification
By only retaining in matrix Σ, a reconstructed matrix that contains the most significant information can be obtained. The low-rank matrix derived from the RPCA decomposes matrix , separating all noise and outliers. Normal measurement errors within the data, collected by sensors when suffering from random noise pollution, are assigned lower weights and rankings in matrix Σ. In order to eliminate the impact of sensor measurement errors and obtain as much abnormal components as possible in the data matrix composed of battery cell voltages, the singular values in Σ are retained while setting the others to 0, resulting in a new singular value matrix , as shown in Equation (11).
The reconstructed matrix is given by Equation (12).
Then, the RPCA is used to decompose the matrix into a low-rank matrix and a sparse matrix , as shown in Equation (13).
Here, contains outliers and a small amount of noise in the matrix A.
The average deviation is the average of the absolute values of the deviations of each item from their arithmetic mean in a series. When the sample is a set of curves, the fluctuation of a curve can be evaluated by calculating the average distance of each point between the curve and their average curve. The average deviation is commonly represented as A.D., given by Equation (14).
Here, X represents the sample points on the curve, represents the points on the average curve, and n is the number of sample points.
The differences among cell voltages are caused by two reasons: systematic reasons and random errors. If the cell voltages are only influenced by random errors, the statistical distribution should obey the Gaussian distribution. Therefore, the average deviation of battery cell voltages in matrix can be considered as the Gaussian distribution, as shown in Equation (15).
Here, i = 1, 2, 3, …, represents the i-th battery cell, is the mean, and is the variance.
Then, the 3 principle is used as the threshold to screen abnormal battery cells, as shown in Equation (16).
When A.D.i is within the 3 range, the battery cell is considered normal; when A.D.i is outside the 3 range, the battery cell is considered abnormal. Finally, on the basis of the threshold, the serial numbers of the abnormal battery cells can be identified.
4. Experimental Analysis and Verification
4.1. Experimental Analysis
This section analyses the charging curves on a large-scale battery pack consisting of 238 series-connected battery cells shown in Figure 3 using the battery anomaly detection method proposed in Section 3.
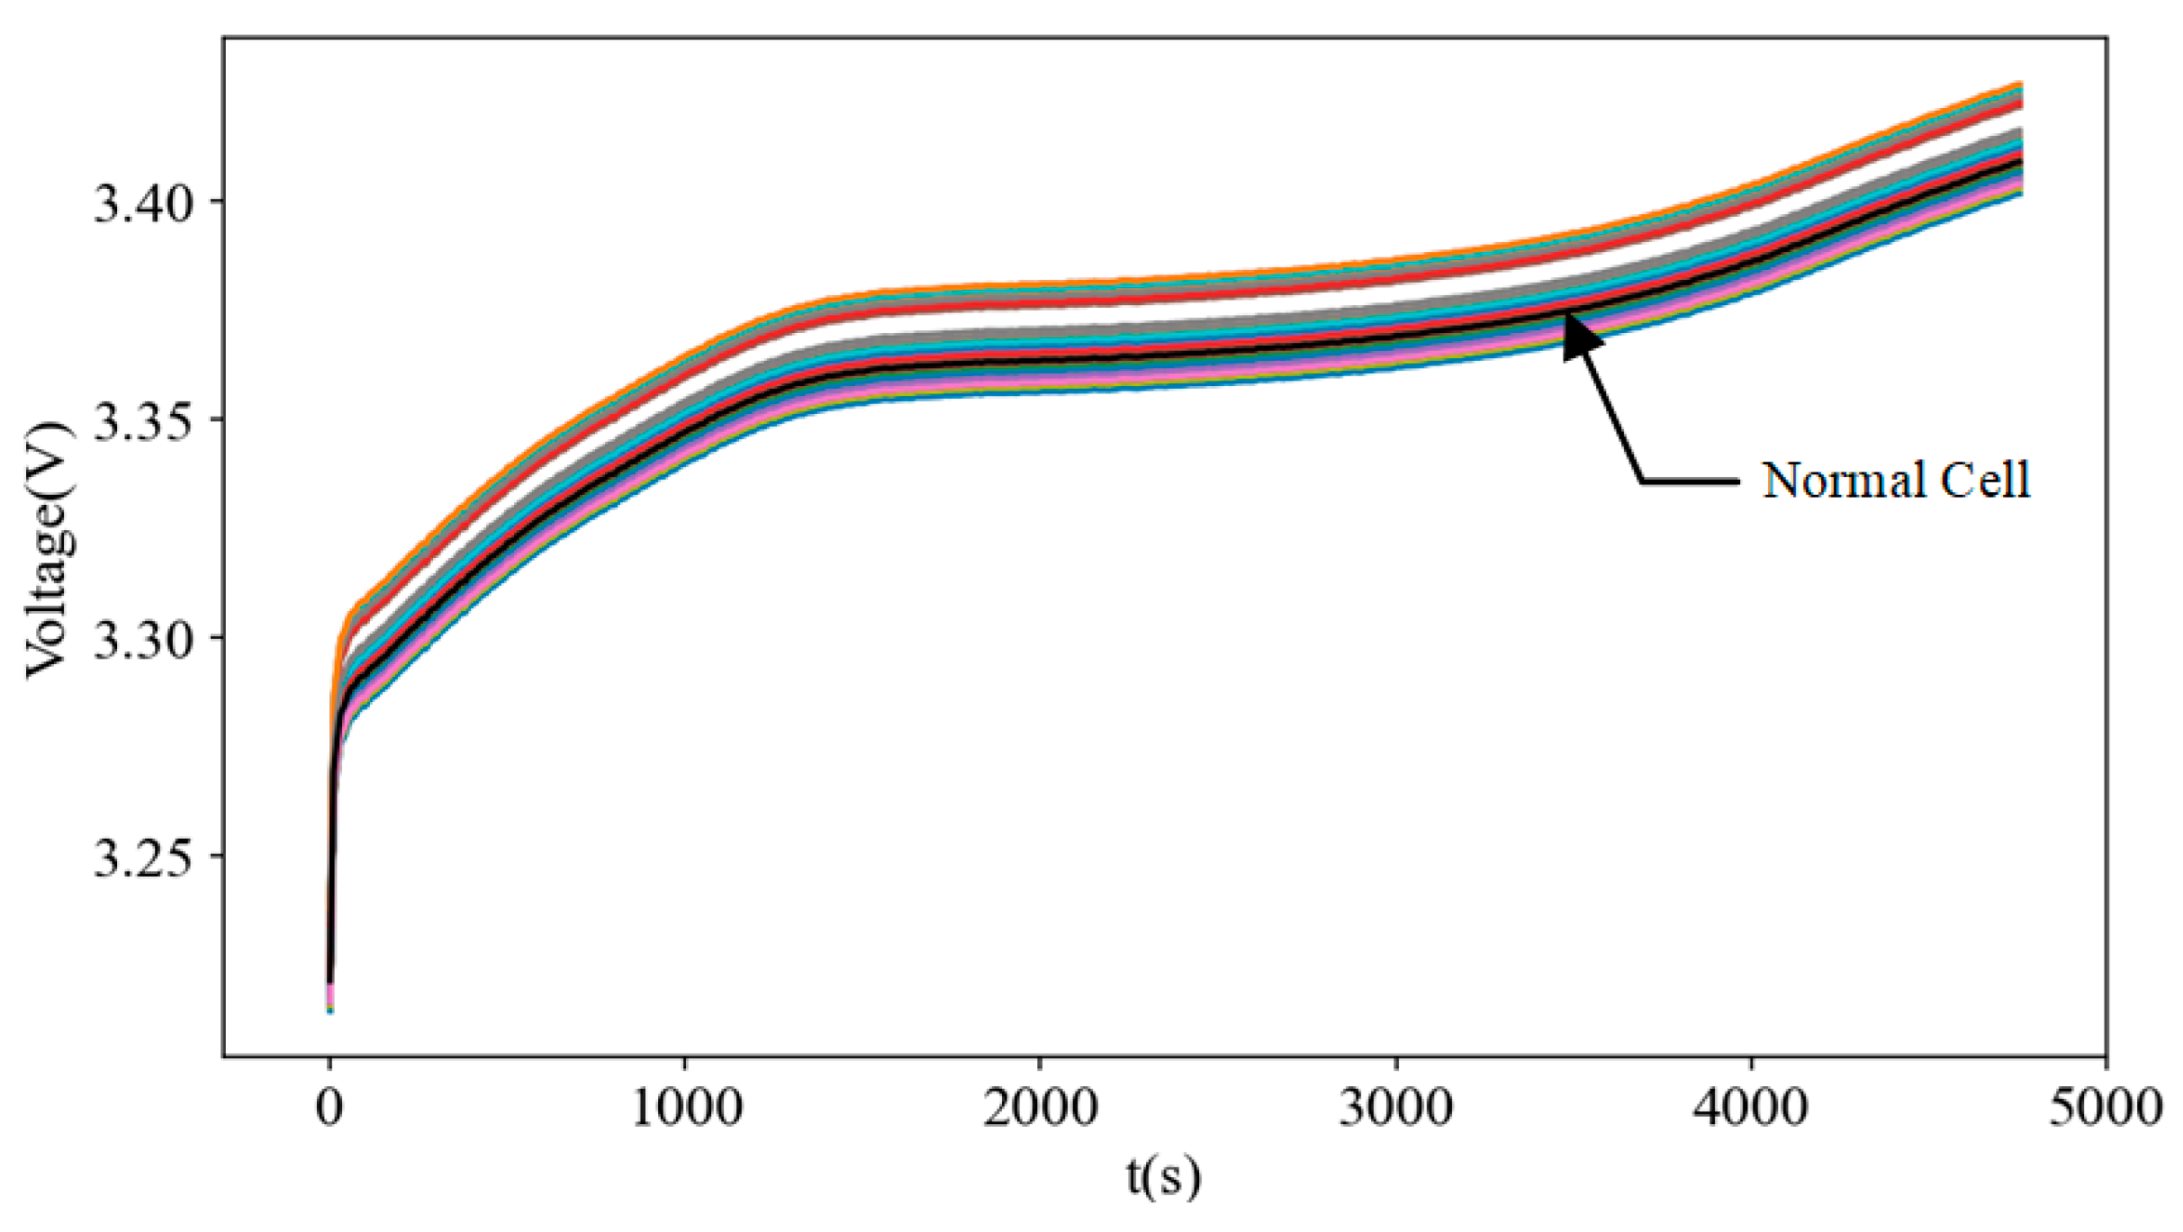
Step 1: RPCA is used to perform extreme denoising on the data, completely removing noise and outliers, as shown in Figure 6. The average curve (the black curves) is used as the consistency baseline for the normal battery cell charging state for a cell consistency assessment.
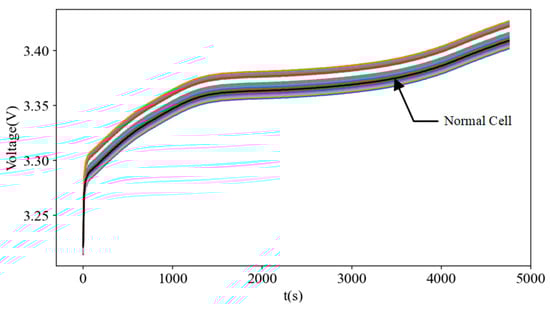
Figure 6.
Charging curves of battery cells after extreme denoising.
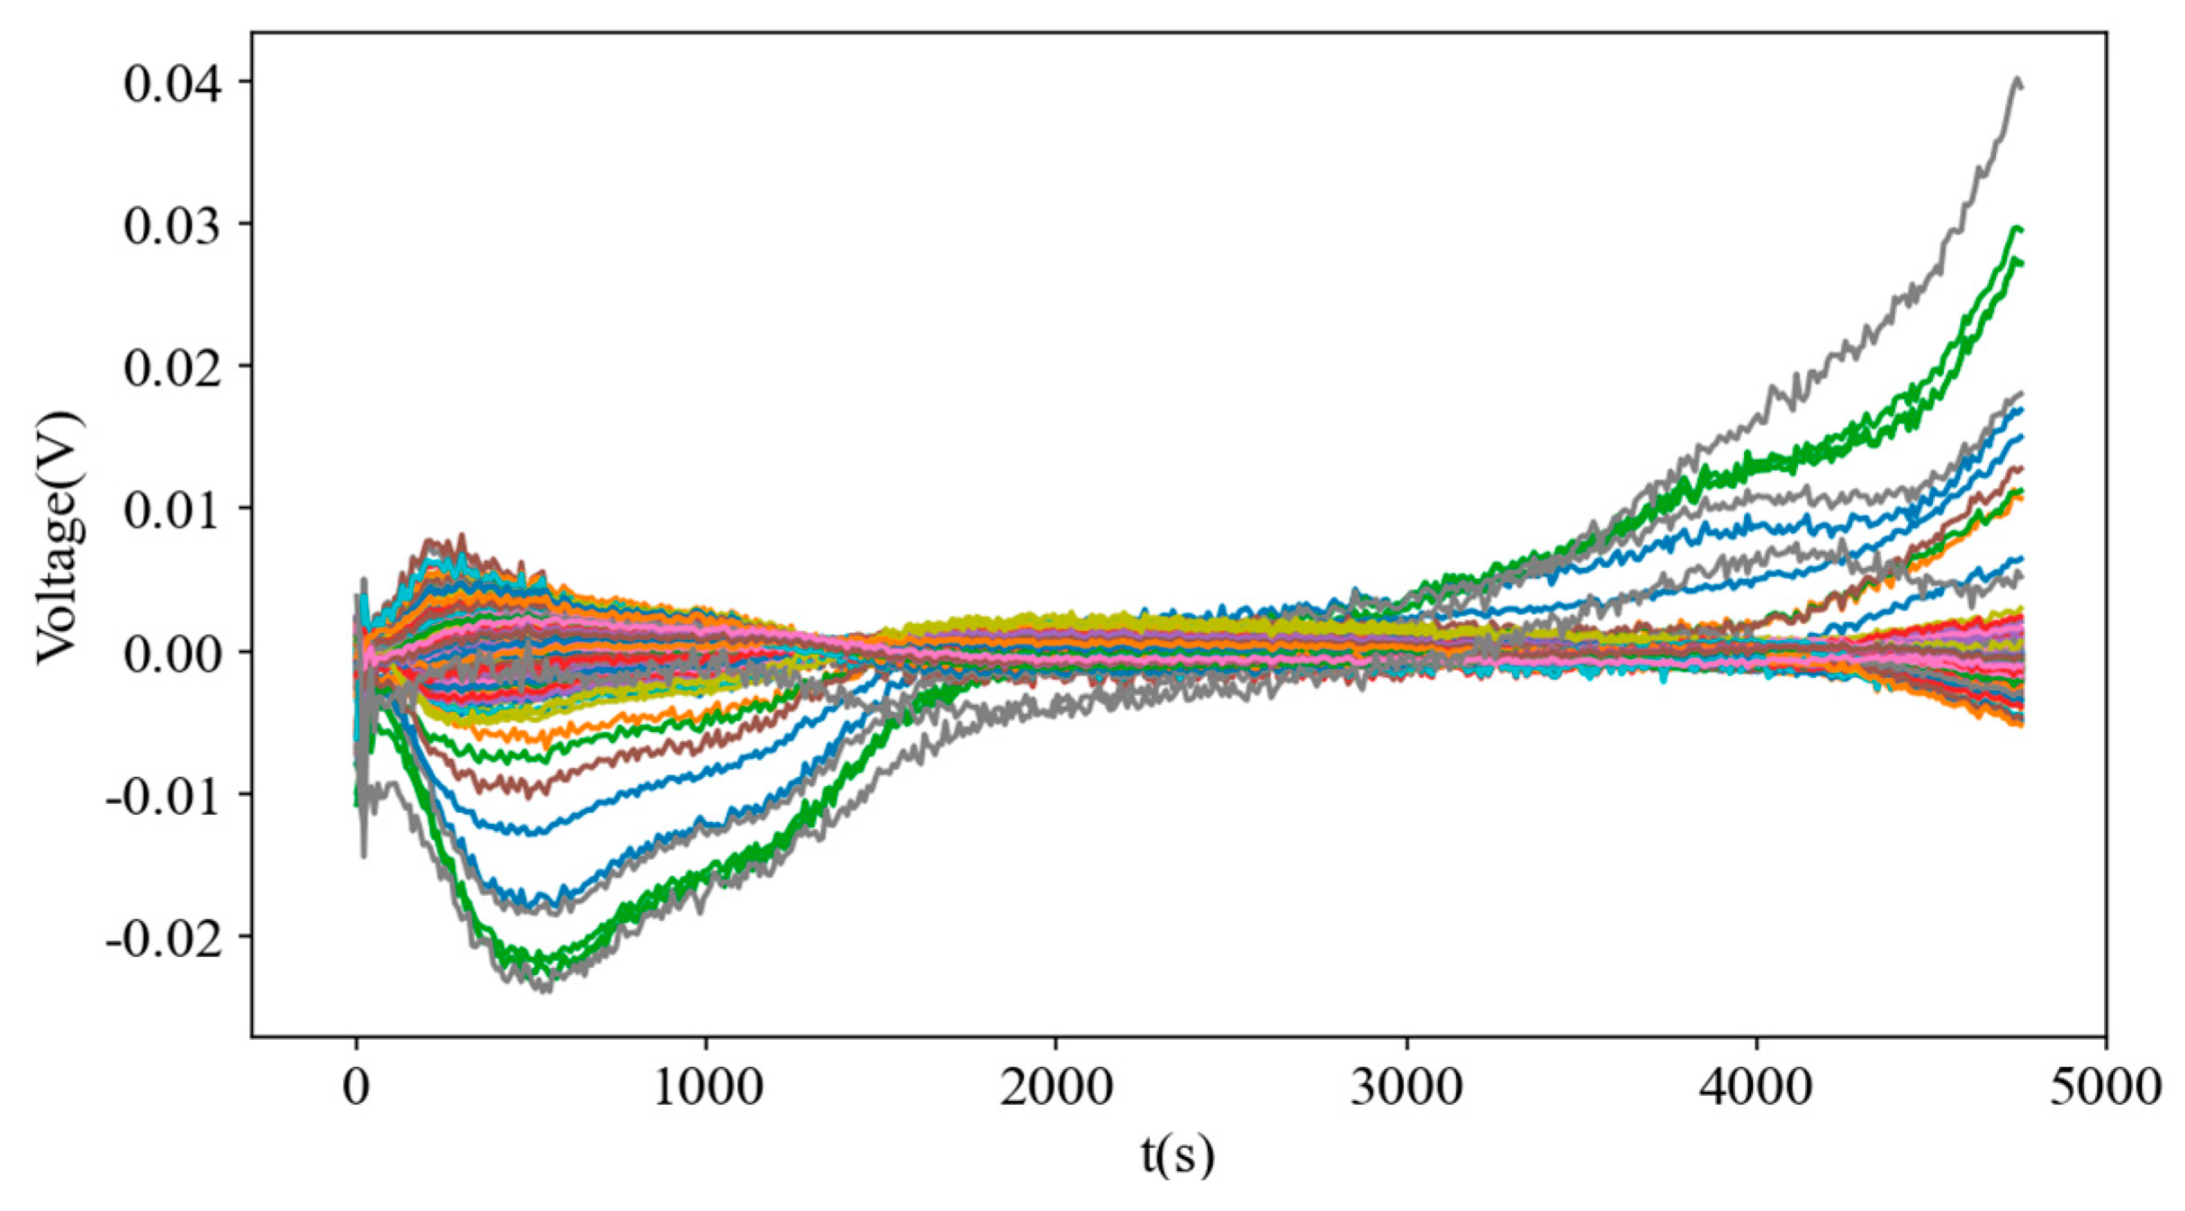
Step 2: The singular values are preserved in the singular value matrix Σ, other singular values are set to 0, and then the data curve is obtained, composed of an abnormal battery cell voltage and a small amount of noise components through RPCA decomposition, as shown in Figure 7.

Figure 7.
The charging curves of battery cells composed of outliers and a small amount of noise.
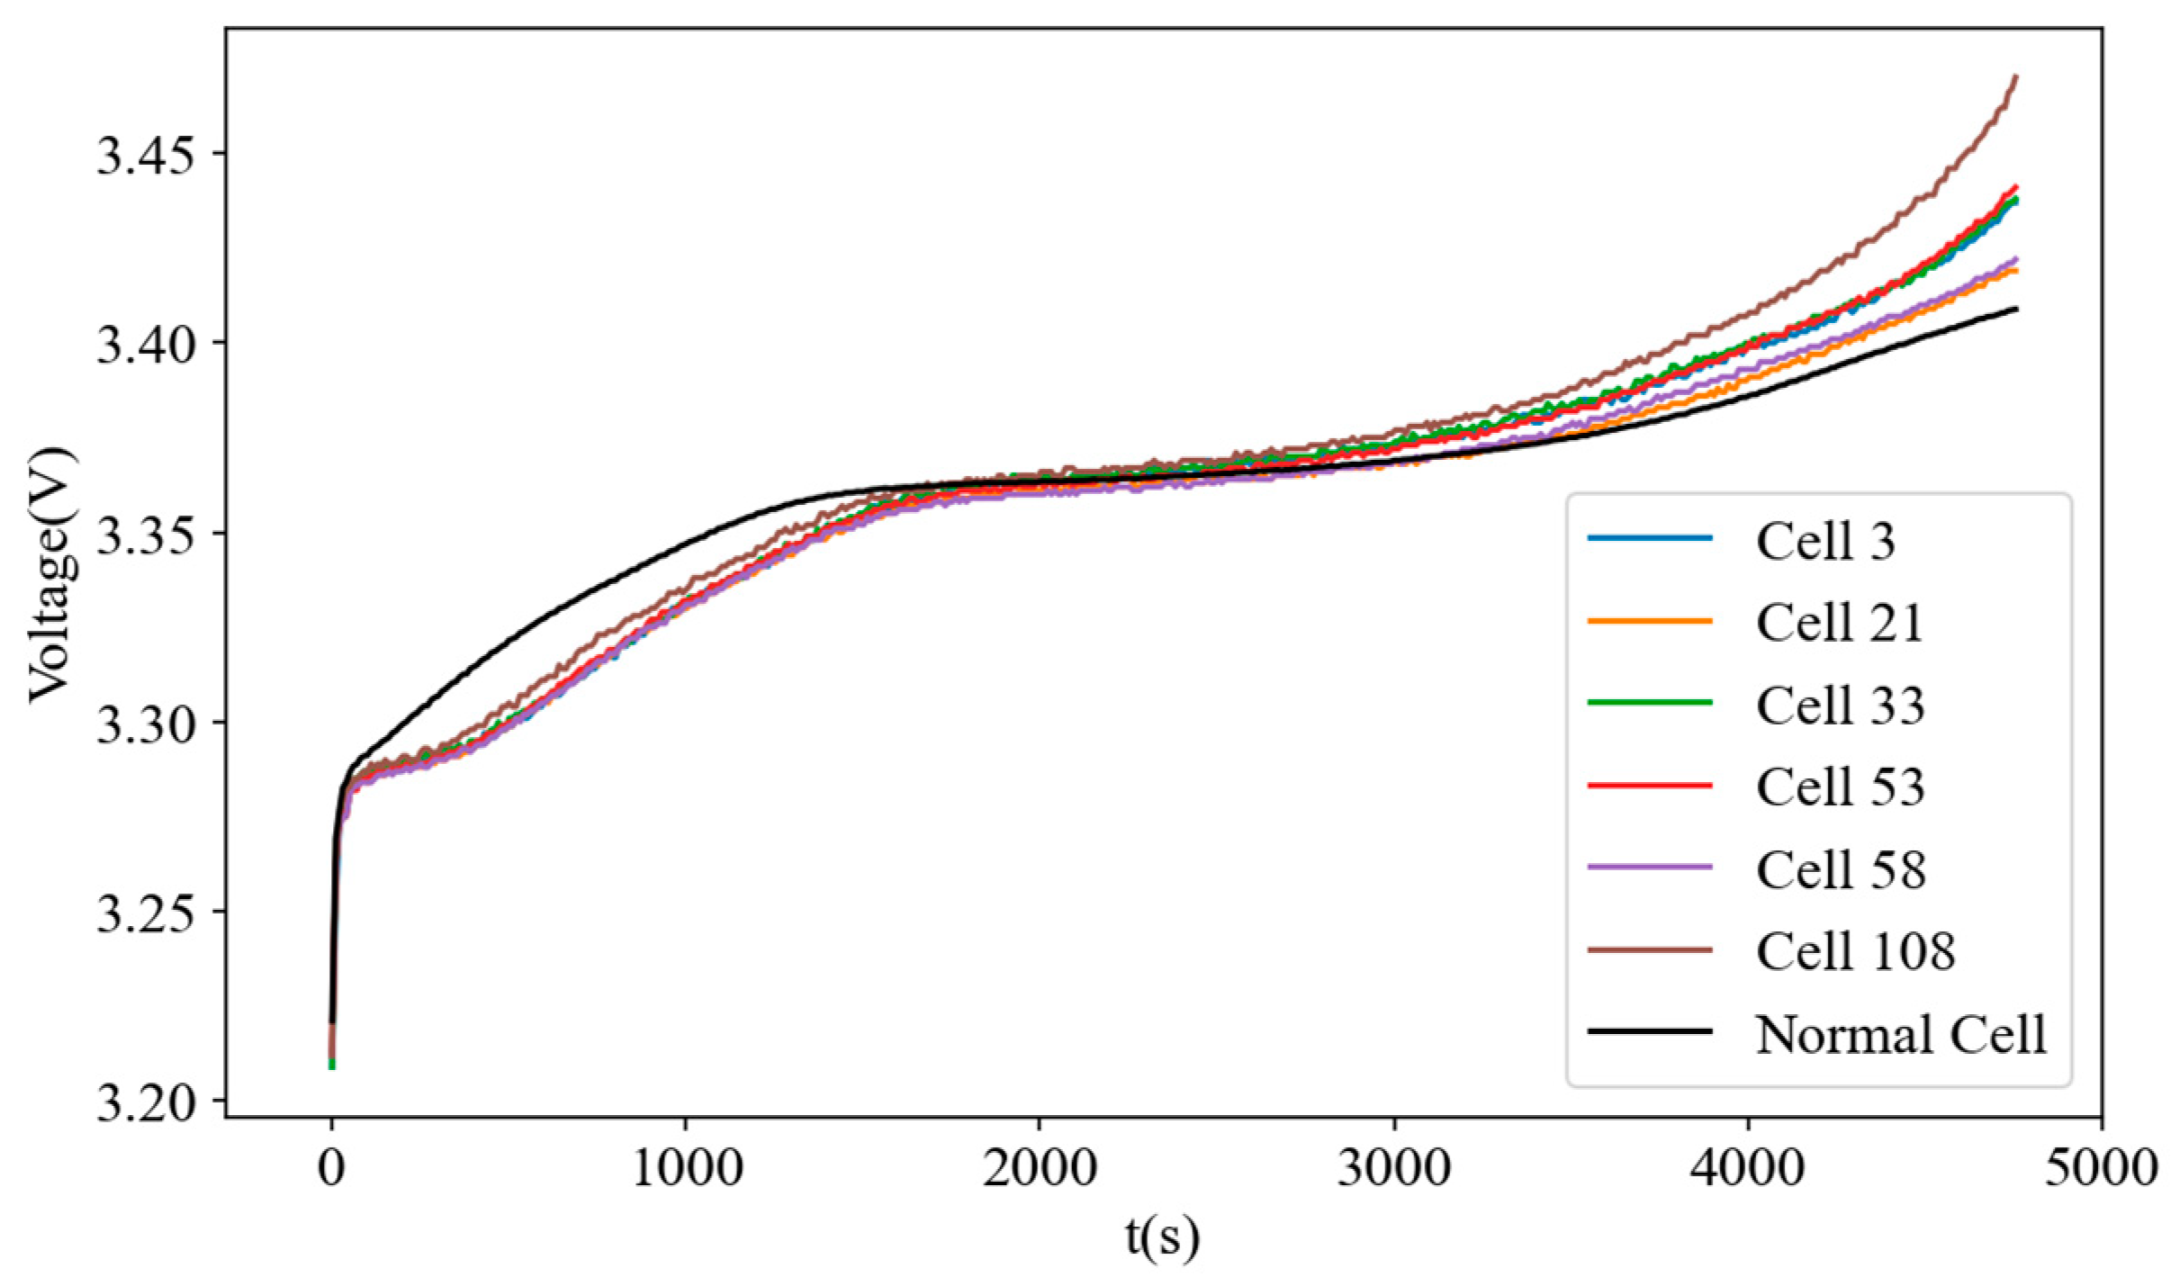
Step 3: The A.D.i values of the curves shown in Figure 7 are calculated using Equation (14) in Section 3. Subsequently, the A.D.i values of battery cells within the 3 anomaly threshold are conducted to screen, and the serial numbers of the anomaly battery cells are obtained, as shown in Figure 8.

Figure 8.
Anomaly detection results of battery cells.
As shown in Figure 8, during the charging process, the characteristics of battery cells numbered 3, 21, 33, 53, 58, and 108 exhibit inconsistently with the consistency baseline. The results indicate that they are obviously anomaly battery cells and that the anomaly detection method is reliable.
4.2. Comparison and Verification
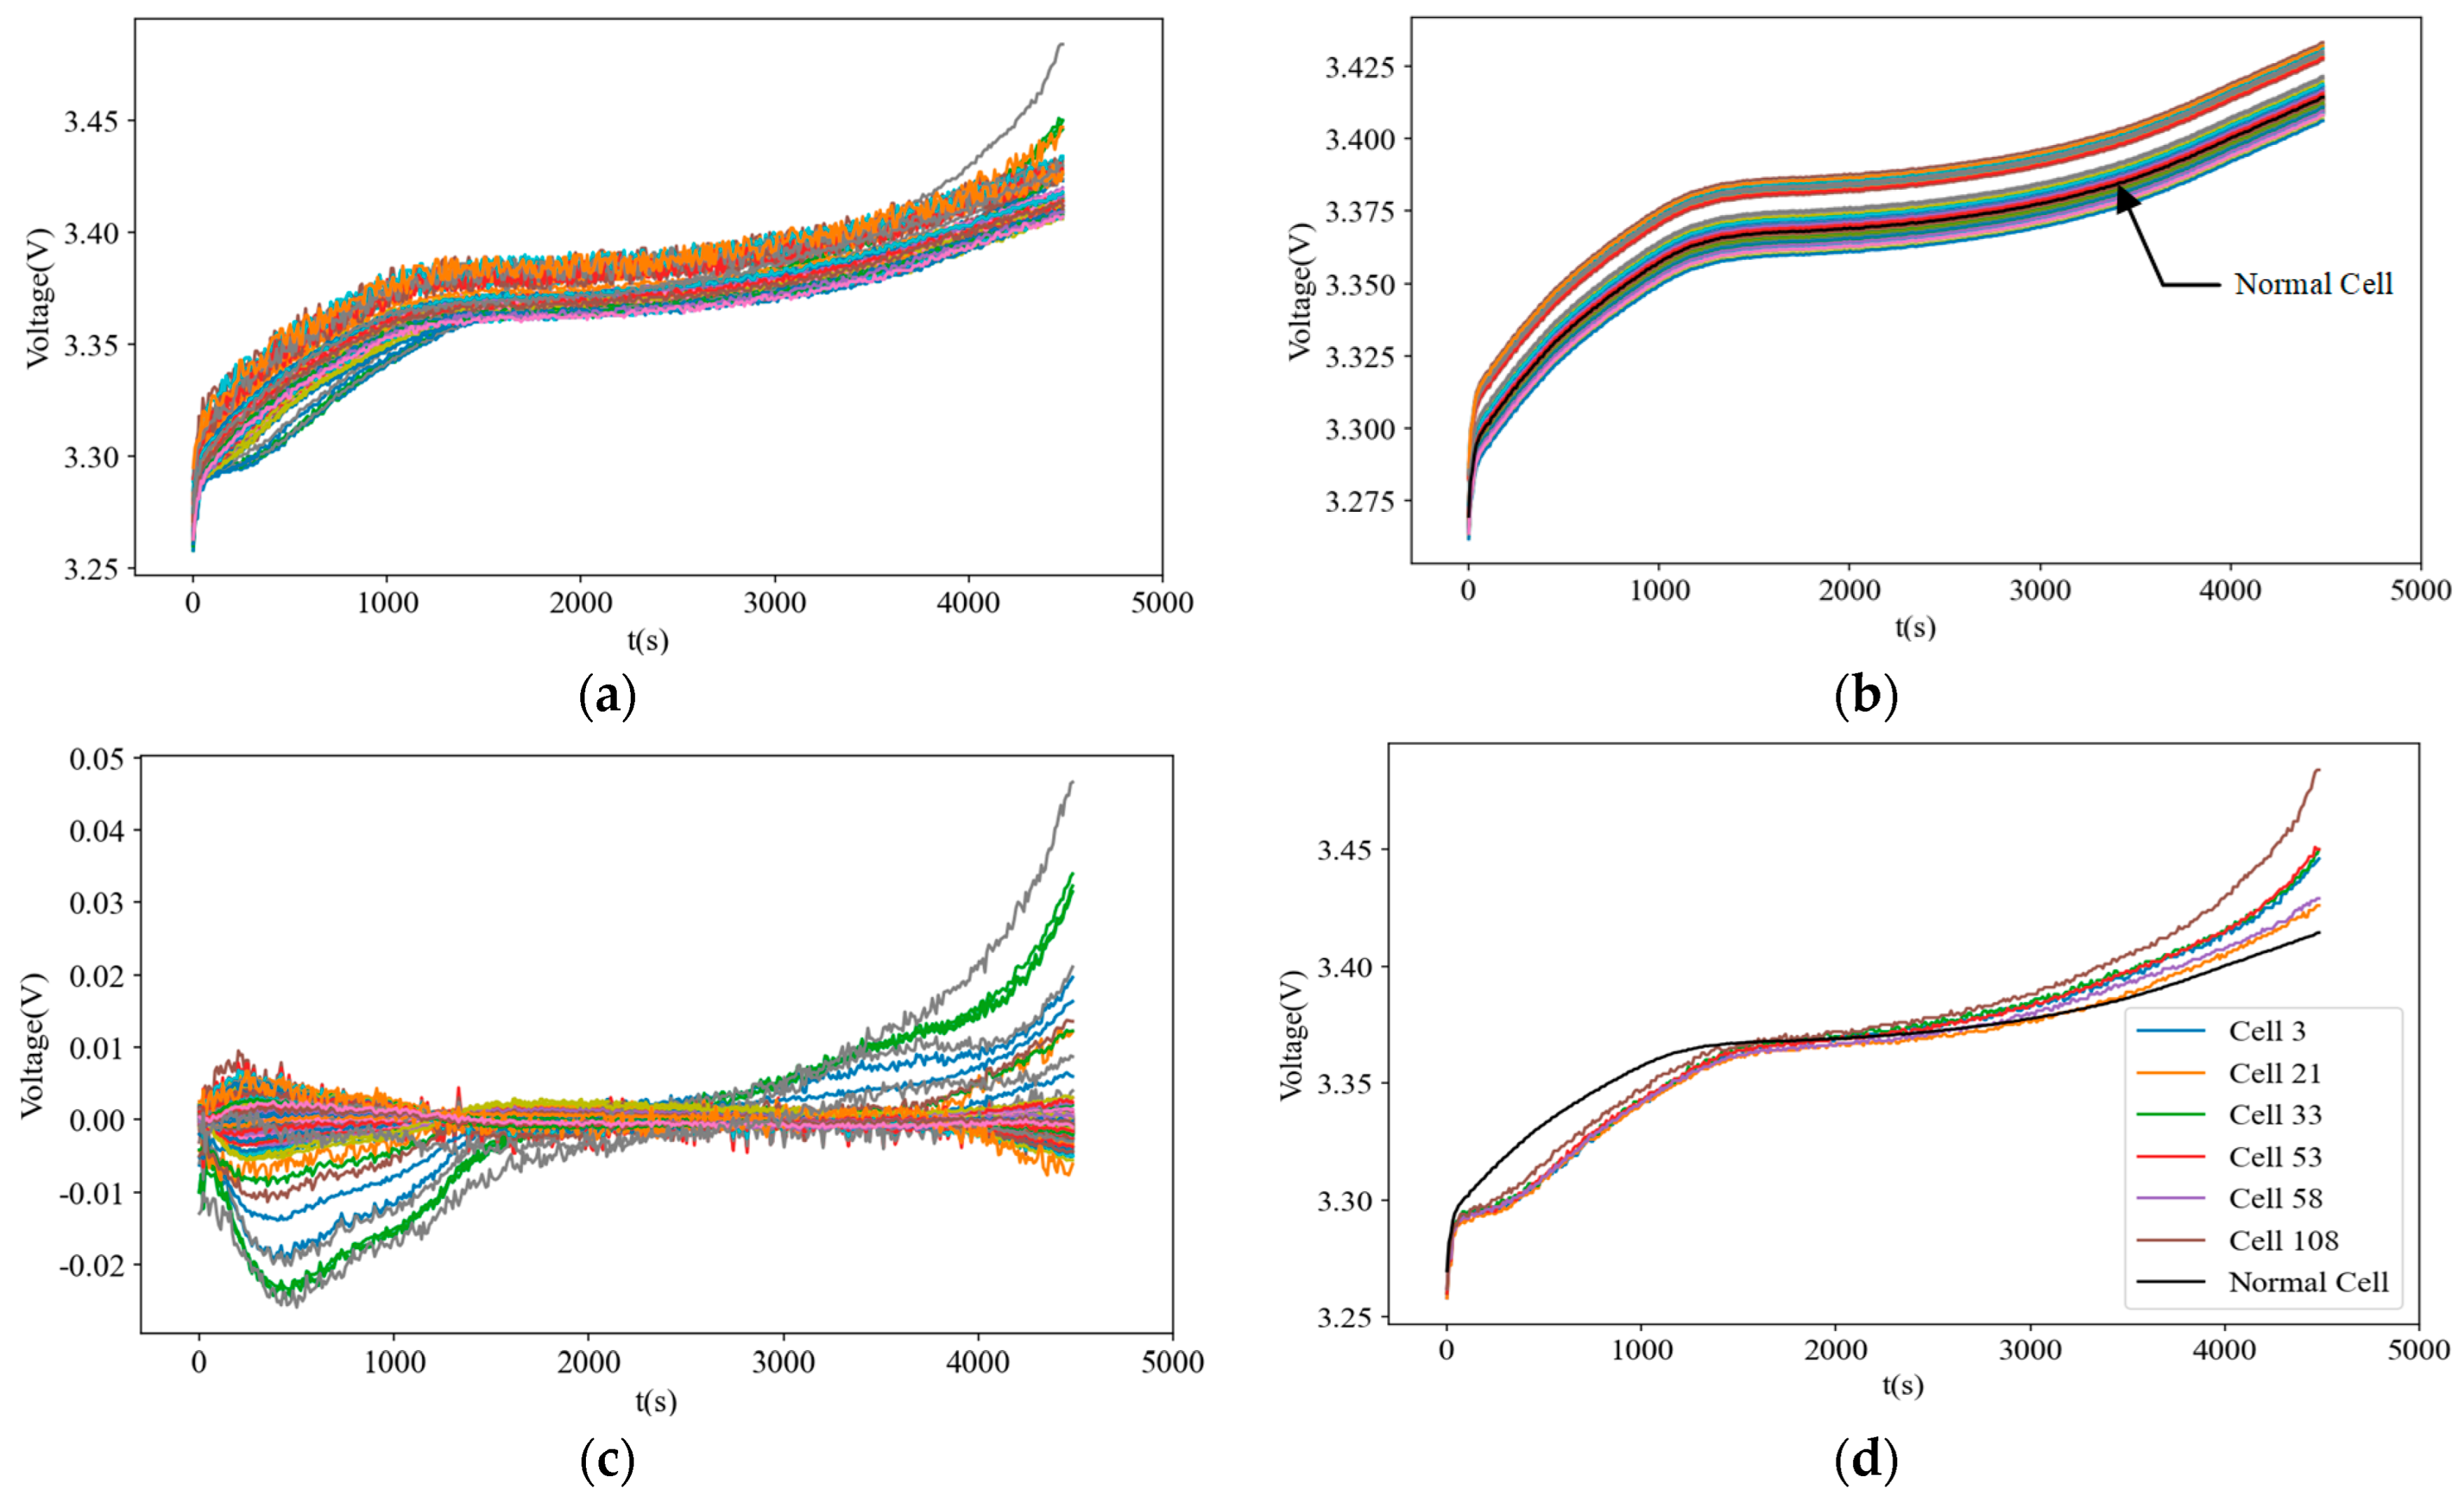
During the routine operation of an energy storage station, the abnormal change in the voltage of the battery cell may occur occasionally due to the change in the working environment. However, if a cell is identified as abnormal for several consecutive days, attention should be paid to this cell. Therefore, in order to verify that the results of abnormal battery cells in Section 4.1 are not occurring by chance, this section uses the voltage curves of the same charging period on July 1 for a comparison and analysis with the battery pack during operation. The process and results are shown in Figure 9.

Figure 9.
July 1. (a) The voltage of the battery cells. (b) Step 1. (c) Step 2. (d) Step 3.
As can be seen from the results in Figure 9d, battery cells numbered 3, 21, 33, 53, 58, and 108 are indeed abnormal cells. In addition, the same results are obtained on other dates.
To further verify the effectiveness of the anomaly detection method for battery cells proposed in this article, the same lithium battery pack charging data are compared and verified against four other methods, including the Variance-3 principle, Range-3 principle, Euclidean Distance-3 principle, and Signal Energy-3 principle for battery cell anomaly screening.
Variance can measure the dispersion of a set of data, describing the deviation of each data value from its mean.
The range is the difference between the maximum and minimum values in a data sample. The larger range is, the greater the fluctuation range of the curve is.
The Euclidean distance measures the “straight-line” distance between two points in a multi-dimensional space. The Euclidean distance of each point on the curve to the corresponding point on the average curve can describe the degree of deviation of the curve relative to the average curve.
The interval energy of a discrete signal reflects the intensity or activity of the signal during a specific period and can be used to compare the energy differences among different signals or different periods of the same signal. For a discrete signal x[n], the total energy within [n1, n2] is defined as follows:
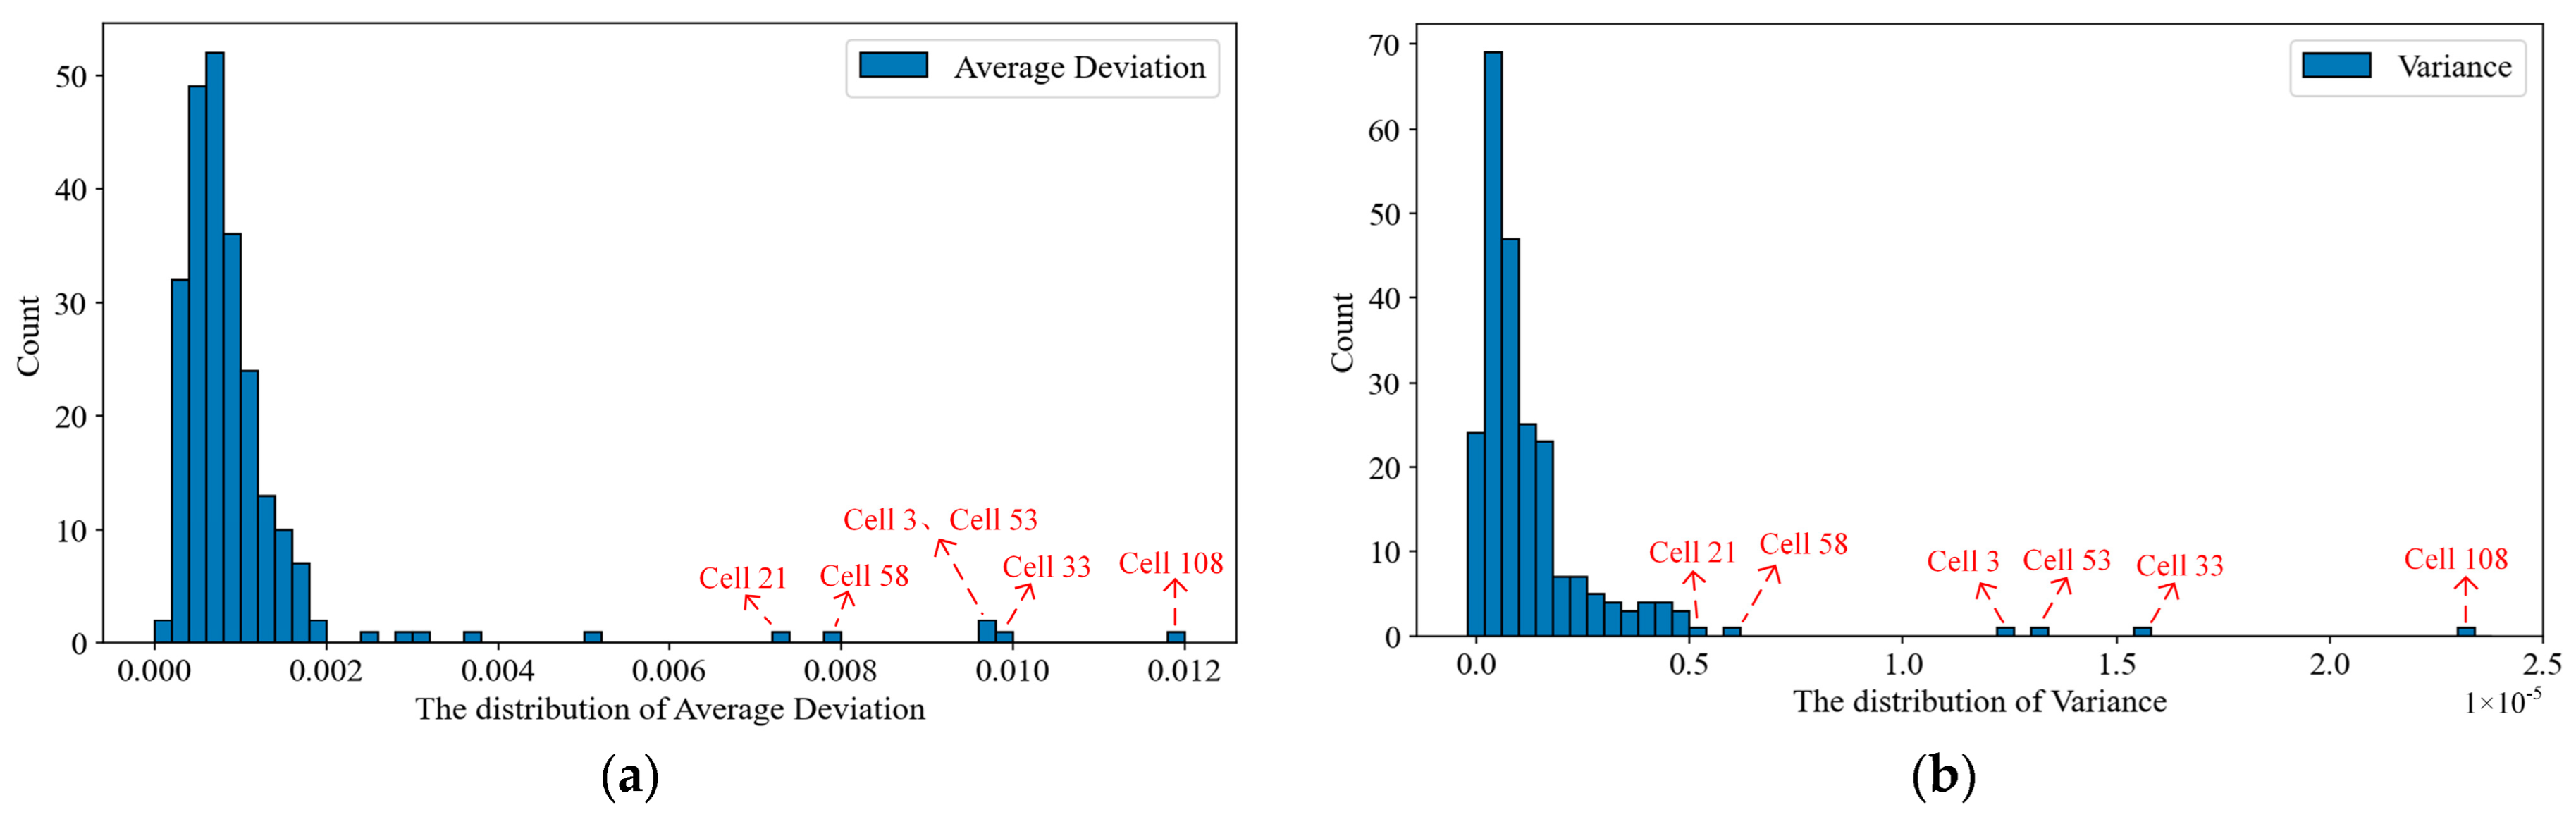
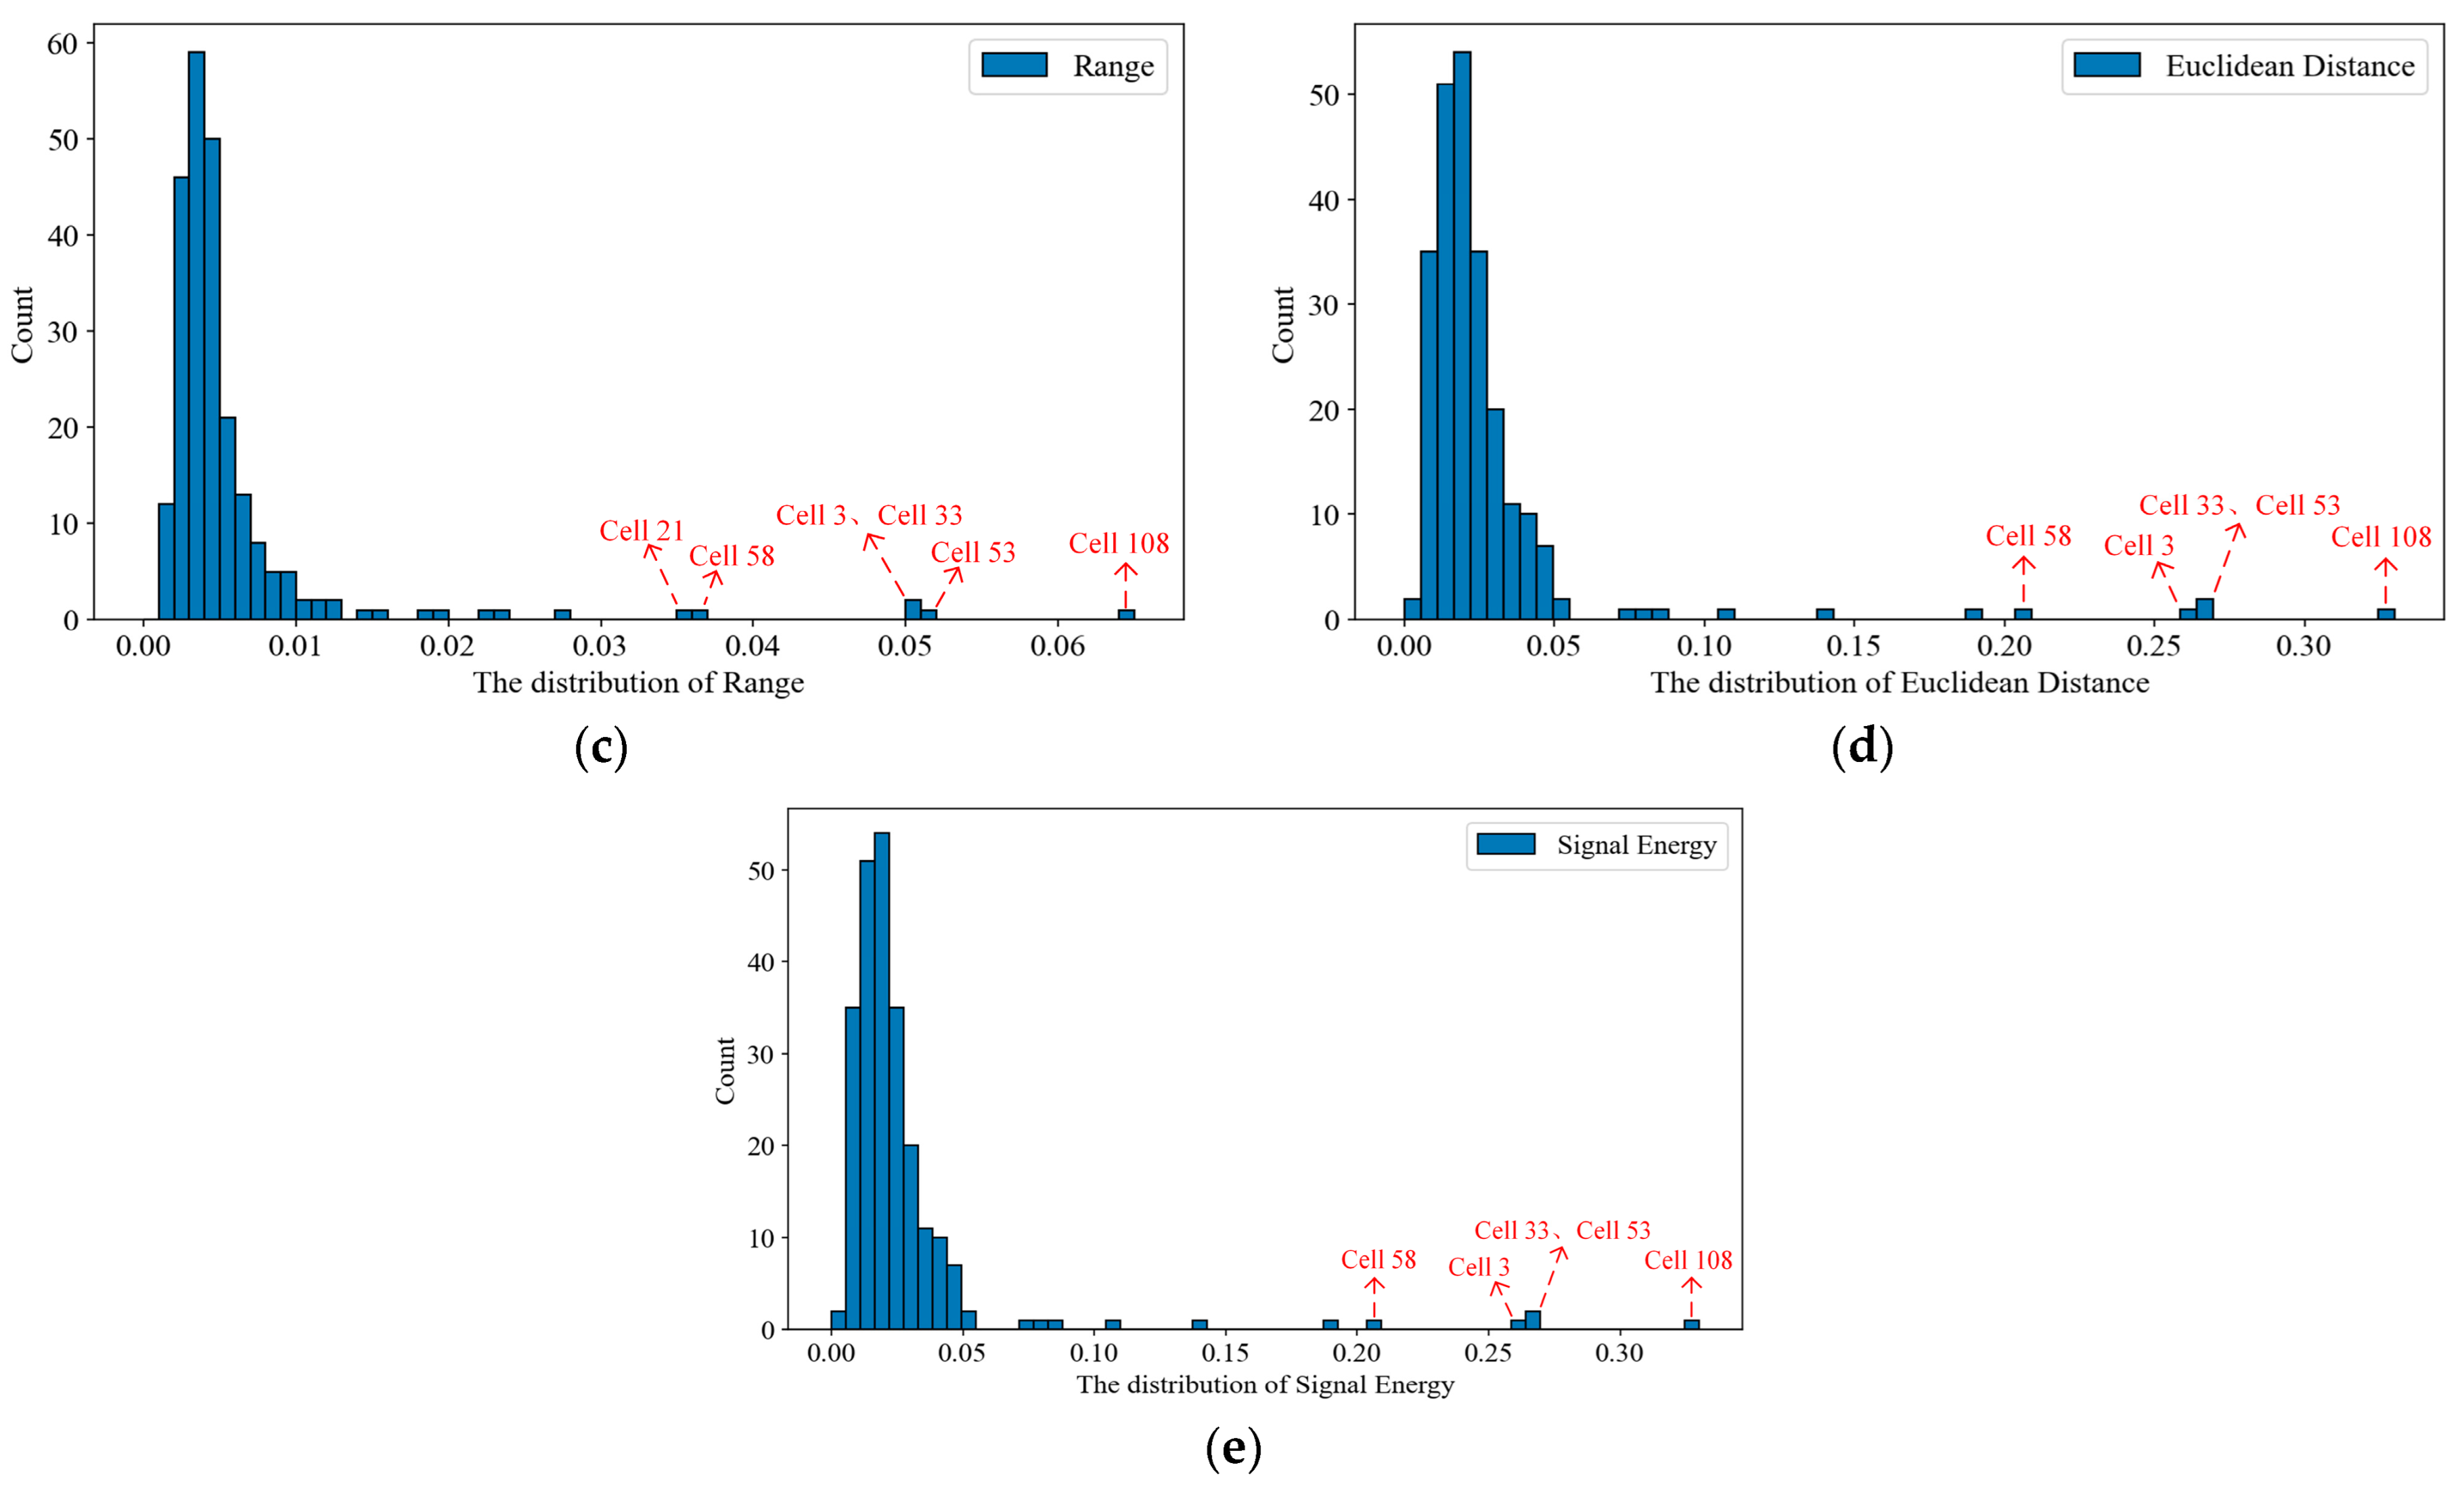
The ranges, variances, Euclidean distances, and signal energies of the curves shown in Figure 7 and Figure 9c are calculated using Equations (17)–(20) in Section 4. Subsequently, the ranges, variances, Euclidean distances, and signal energies of battery cells within the 3 anomaly threshold are conducted to screen, and the serial numbers of the anomaly battery cells are obtained. In order to display the differences in these methods, the frequency distribution histograms of the ranges, variances, Euclidean distances, and signal energies of the curves shown in Figure 7 are used, as shown in Figure 10. All results of the comparison and verification are shown in Table 2.
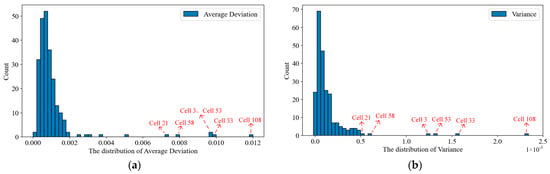
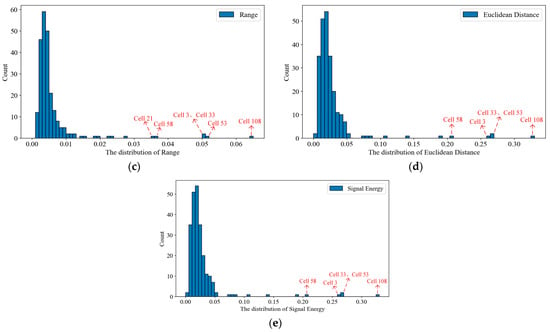
Figure 10.
June 30. (a) The distribution of average deviation. (b) The distribution of variance. (c) The distribution of range. (d) The distribution of Euclidean distance. (e) The distribution of signal energy.
Table 2.
The results of the comparison and verification.
The results in Table 2 indicate that the abnormal likelihood of battery cells numbered 3, 21, 33, 53, 58, and 108 is very high. This also indicates that the anomaly detection method for battery cells based on the Average Deviation-3σ principle is reliable.
4.3. Anomaly Reasons and Analysis
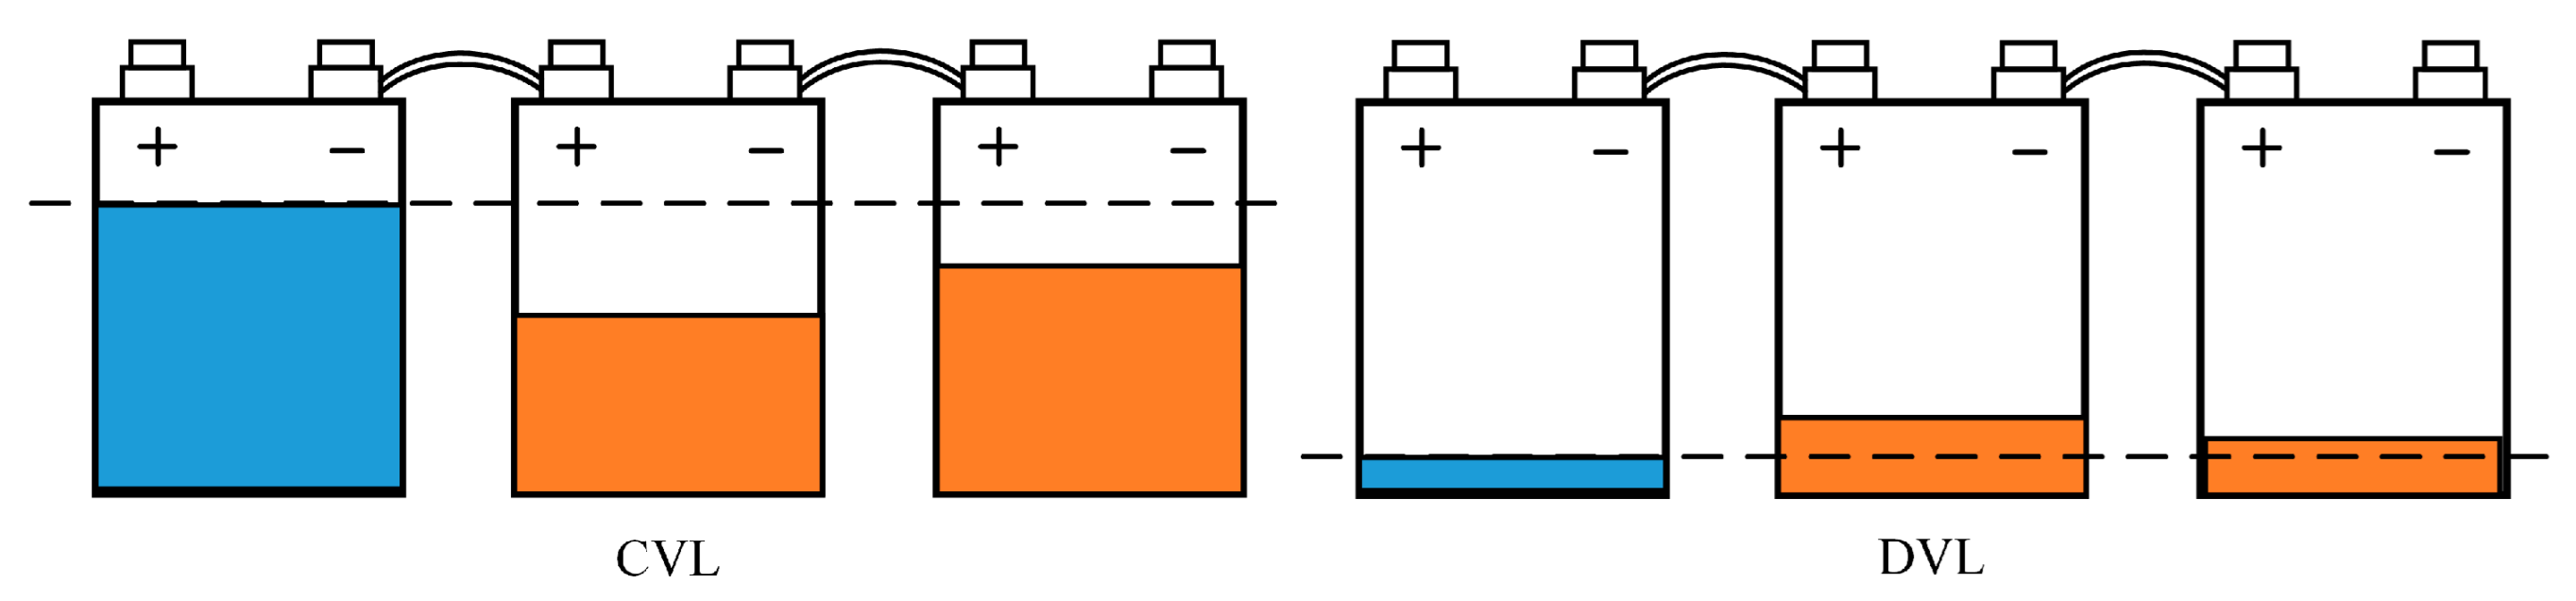
As seen in the results in Figure 8 and Figure 9d, the abnormal cells identified all reached the charging voltage limit (CVL) earlier than the normal cells. Given that the trends in these abnormal curves are similar and no single cell differs significantly from the others, it can be assumed that these cells are affected by the same cause, leading to the anomaly rather than necessarily being faulty.
For the inconsistencies among the battery cells caused by manufacturing, the State of Charge (SOC) among the battery cells is inconsistent. In the case of lithium-ion batteries that are connected in series to form a battery pack, the series connection ensures that the current passing through each cell is identical while the SOC among the cells varies, which causes certain cells to reach the CVL too early during the charging process or to reach the discharging voltage limit (DVL) too early during discharge. If any cell reaches the CVL during charging, the entire battery pack stops charging; conversely, if a cell reaches the DVL during discharge, the entire pack stops discharging. This phenomenon is akin to the “barrel effect,” as illustrated in Figure 11. The “barrel effect” significantly reduces the usable capacity of the battery pack. The inconsistency within a lithium-ion battery pack adversely affects its normal usage and the system operation. Therefore, after detecting abnormal cells using the method proposed in this article, it is feasible to employ the battery balancing techniques, which can enhance the consistency, capacity utilization, and lifespan of the series-connected lithium-ion battery pack.

Figure 11.
The “barrel effect” of series-connected lithium-ion battery packs.
The battery consistency deteriorates over prolonged periods of charging and discharging, and the maximum usable capacity of the battery gradually decreases with the increase in the number of charge and discharge cycles. When the maximum usable capacity of a battery degrades to 70% to 80%, it needs to be retired. Because over-charging or over-discharging behaviors of battery cells significantly increase the likelihood of dangerous incidents, such as explosions and fires, the charging or discharging of the battery pack should be halted immediately when any cell in the battery pack reaches the CVL or DVL. Therefore, the accurate detection of abnormal voltages of battery cells within battery packs is crucial during the routine operation of an energy storage station.
5. Conclusions
For a large lithium battery pack within an energy storage station, the RPCA-based anomaly detection method proposed in this article can effectively detect and identify abnormal battery cells within the battery pack. Using battery balancing techniques can reallocate energy among imbalanced battery cells, enhance the consistency of the series-connected battery pack, and extend the lifespan. The anomaly detection method for battery cells presented in this article has low calculation complexity and high execution efficiency and can achieve anomaly detection. However, it struggles to distinguish between abnormal voltages caused by fault cells and their specific reasons. Future research in this area will be conducted, exploring fault types of battery cells and their specific causes.
Author Contributions
Conceptualization, J.Y. and Y.G.; methodology, J.Y. and W.Z.; software, J.Y.; validation, J.Y. and W.Z.; formal analysis, Y.G.; investigation, J.Y.; resources, W.Z.; data curation, J.Y. and W.Z.; writing—original draft preparation, J.Y.; writing—review and editing, J.Y. and W.Z.; visualization, J.Y.; supervision, Y.G. and W.Z. All authors have read and agreed to the published version of the manuscript.
Funding
This research received no external funding.
Institutional Review Board Statement
Not applicable.
Informed Consent Statement
Not applicable.
Data Availability Statement
The original contributions presented in this study are included in this article; further inquiries can be directed to the corresponding author.
Conflicts of Interest
The authors declare no conflict of interest.
References
- Zubi, G.; Dufo-López, R.; Carvalho, M.; Pasaoglu, G. The lithium-ion battery: State of the art and future perspectives. Renew. Sustain. Energy Rev. 2018, 89, 292–308. [Google Scholar] [CrossRef]
- Tarascon, J.M.; Armand, M. Issues and challenges facing rechargeable lithium batteries. Nature 2001, 414, 359–367. [Google Scholar] [CrossRef] [PubMed]
- Xiong, R.; Sun, W.; Yu, Q.; Sun, F. Research progress, challenges and prospects of fault diagnosis on battery system of electric vehicles. Appl. Energy 2020, 279, 115855. [Google Scholar] [CrossRef]
- Ghaeminezhad, N.; Ouyang, Q.; Hu, X.; Xu, G.; Wang, Z. Active Cell Equalization Topologies Analysis for Battery Packs: A Systematic Review. IEEE Trans. Power Electron. 2021, 36, 9119–9135. [Google Scholar] [CrossRef]
- Hong, J.; Wang, Z.; Qu, C.; Zhou, Y.; Shan, T.; Zhang, J.; Hou, Y. Investigation on overcharge-caused thermal runaway of lithium-ion batteries in real-world electric vehicles. Appl. Energy 2022, 321, 119229. [Google Scholar] [CrossRef]
- Sun, Z.; Wang, Z.; Liu, P.; Zhang, Z.; Wang, S.; Dorrell, D.G. Relative Entropy based Lithium-ion Battery Pack Short Circuit Detection for Electric Vehicle. In Proceedings of the 2020 IEEE Energy Conversion Congress and Exposition (ECCE), Detroit, MI, USA, 11–15 October 2020; pp. 5061–5067. [Google Scholar]
- Jiang, J.; Cong, X.; Li, S.; Zhang, C.; Zhang, W.; Jiang, Y. A Hybrid Signal-Based Fault Diagnosis Method for Lithium-Ion Batteries in Electric Vehicles. IEEE Access 2021, 9, 19175–19186. [Google Scholar] [CrossRef]
- Yang, B.; Chen, Y.; Guo, Z.; Wang, J.; Zeng, C.; Li, D.; Shu, H.; Shan, J.; Fu, T.; Zhang, X. Levenberg-Marquardt backpropagation algorithm for parameter identification of solid oxide fuel cells. Int. J. Energy Res. 2021, 45, 17903–17923. [Google Scholar] [CrossRef]
- Li, Z.; Zeng, L. A Hybrid Vertex Outlier Detection Method Based on Distributed Representation and Local Outlier Factor. In Proceedings of the 2015 IEEE 12th Intl Conf on Ubiquitous Intelligence and Computing and 2015 IEEE 12th Intl Conf on Autonomic and Trusted Computing and 2015 IEEE 15th Intl Conf on Scalable Computing and Communications and Its Associated Workshops (UIC-ATC-ScalCom), Beijing, China, 10–14 August 2015; pp. 512–516. [Google Scholar]
- Hu, C.; Jain, G.; Zhang, P.; Schmidt, C.; Gomadam, P.; Gorka, T. Data-driven method based on particle swarm optimization and k-nearest neighbor regression for estimating capacity of lithium-ion battery. Appl. Energy 2014, 129, 49–55. [Google Scholar] [CrossRef]
- Song, L.; Zhang, K.; Liang, T.; Han, X.; Zhang, Y. Intelligent state of health estimation for lithium-ion battery pack based on big data analysis. J. Energy Storage 2020, 32, 101836. [Google Scholar] [CrossRef]
- Khaleghi, S.; Firouz, Y.; Van Mierlo, J.; Van den Bossche, P. Developing a real-time data-driven battery health diagnosis method, using time and frequency domain condition indicators. Appl. Energy 2019, 255, 113813. [Google Scholar] [CrossRef]
- Zeng, J.; Zhang, Y.; Zhang, Z.; Shan, F.; Shen, Z.; Liu, X. Identification of power battery voltage inconsistency faults in electric vehicles based on K-means++ clustering with dynamic k-values. Sci. Sin. Technol. 2023, 53, 28–40. [Google Scholar]
- Zhao, Y.; Liu, P.; Wang, Z.; Zhang, L.; Hong, J. Fault and defect diagnosis of battery for electric vehicles based on big data analysis methods. Appl. Energy 2017, 207, 354–362. [Google Scholar] [CrossRef]
- Li, F.; Min, Y.; Zhang, Y.; Wang, C. A Method for Abnormal Battery Charging Capacity Diagnosis Based on Electric Vehicles Operation Data. Batteries 2023, 9, 103. [Google Scholar] [CrossRef]
- Piao, C.; Huang, Z.; Su, L.; Lu, S. Research on Outlier Detection Algorithm for Evaluation of Battery System Safety. Adv. Mech. Eng. 2014, 6, 830402. [Google Scholar] [CrossRef]
- Li, X.; Wang, Z. A novel fault diagnosis method for lithium-Ion battery packs of electric vehicles. Measurement 2018, 116, 402–411. [Google Scholar] [CrossRef]
- Ma, M.; Wang, Y.; Duan, Q.; Wu, T.; Sun, J.; Wang, Q. Fault detection of the connection of lithium-ion power batteries in series for electric vehicles based on statistical analysis. Energy 2018, 164, 745–756. [Google Scholar] [CrossRef]
- Wang, Z.; Hong, J.; Zhang, L.; Liu, P. Voltage Fault Detection and Precaution of Batteries Based on Entropy and Standard Deviation for Electric Vehicles. Energy Procedia 2017, 105, 2163–2168. [Google Scholar] [CrossRef]
- Wang, Z.; Hong, J.; Liu, P.; Zhang, L. Voltage fault diagnosis and prognosis of battery systems based on entropy and Z-score for electric vehicles. Appl. Energy 2017, 196, 289–302. [Google Scholar] [CrossRef]
- Lin, M.; Xie, H.; Shan, M. A Hybrid Multiscale Permutation Entropy-Based Fault Diagnosis and Inconsistency Evaluation Approach for Lithium Battery of E-Vehicles. IEEE Access 2022, 10, 104757–104768. [Google Scholar] [CrossRef]
- Yang, D.; Yang, X.; Liao, G.; Zhu, S. Strong Clutter Suppression via RPCA in Multichannel SAR/GMTI System. IEEE Geosci. Remote Sens. Lett. 2015, 12, 2237–2241. [Google Scholar] [CrossRef]
- Lin, Z.; Chen, M.; Ma, Y. The Augmented Lagrange Multiplier Method for Exact Recovery of Corrupted Low-Rank Matrices. J. Struct. Biol. 2010, 181, 116–127. [Google Scholar]


Disclaimer/Publisher’s Note: The statements, opinions and data contained in all publications are solely those of the individual author(s) and contributor(s) and not of MDPI and/or the editor(s). MDPI and/or the editor(s) disclaim responsibility for any injury to people or property resulting from any ideas, methods, instructions or products referred to in the content. |
© 2024 by the authors. Licensee MDPI, Basel, Switzerland. This article is an open access article distributed under the terms and conditions of the Creative Commons Attribution (CC BY) license (https://creativecommons.org/licenses/by/4.0/).