Abstract
This research is focused on the water usage patterns in two student residences—one for male students (Residence I) and the other for female students (Residence II). Surveys and measurements of flushing cisterns, taps, and shower flows were conducted to understand water use behaviors. Scenario 1 proposed replacing washbasin and kitchen taps and installing flow reducers in showers, while Scenario 2 combined Scenario 1 with a rainwater harvesting system for recharging flush cisterns. Showers were found to be the most water-consuming devices, accounting for 46% and 61.41% of water consumption in Residences I and II, respectively, followed by kitchen taps (31.51% in Residence I and 11.52% in Residence II). The flushing cistern consumption was 7.02% in Residence I and 13.22% in Residence II. The implementation of Scenario 1 anticipates a 13% reduction in total water consumption in Residence I and a 10% reduction in Residence II. The reduction in hot water consumption would result in a decrease in annual electricity consumption by 27.8% and 23.06% in Residence I and II, respectively. With the implementation of Scenario 2, the total potential water savings for Residence I could increase to 19.98%, and for Residence II, it could rise to 23.17%. The proposed measures aim to enhance water sustainability in these buildings and can be replicated elsewhere.
1. Introduction
The rapid growth in urban populations, changes in lifestyles, and increasing water pollution have led to a continuous increase in water demand, posing a threat to freshwater ecosystems and available water resources [1,2]. Additionally, climate change is exacerbating this scenario, resulting in water scarcity and shortages as a global challenge [3]. In the European Union, water scarcity has worsened since 2010, with 29% of the territory experiencing water stress for at least one season in 2019 [4,5]. This issue is particularly noticeable in southern Europe and the Iberian Peninsula, where Portugal is located. Indeed, these regions are currently experiencing extremely hot summers, increasingly frequent and severe heat waves, and changes in the precipitation pattern, making them more vulnerable to the impact of climate change [6]. Portugal is already facing severe changes in its hydrological resources. In 2022, 60.4% of the Portuguese territory was in severe drought and 39.6% in extreme drought [7]. Nevertheless, the mean daily water consumption in Portugal is estimated at 175 L per inhabitant. [8]. Buildings are among the highest consumers of potable water globally [9], affecting the urban water cycle and contributing to climate change. Indeed, water treatment processes, water delivery to consumers, and wastewater treatment use significant energy, contributing to increasing CO2 emissions [10,11]. It has been reported that public buildings are the most significant water consumers in cities, often leading to high levels of water waste [12,13,14]. One of the leading causes of this phenomenon is that users are not directly paying for water bills and are not personally motivated to reduce them because they are frequently unaware of the necessity of water conservation [15,16,17]. Higher education institutions are known to be significant consumers of water and energy [13,17,18,19]. However, given their intellectual capital and influence, they have a unique opportunity to propose water management strategies and take the lead in implementing sustainable water use measures within their buildings, setting a powerful example for all sectors of society [17,20,21]. Nonetheless, there are various barriers to achieving sustainability, like those faced by other public buildings. These also include a lack of knowledge and interest within the academic community, limited time available for academics, resistance from staff towards new attitudes and procedures, and a lack of societal pressure [21]. Additionally, the diversity in water and energy end-uses makes analyzing water consumption and planning for water conservation challenging [17].
Despite the mentioned difficulties, research on water conservation in higher education institutions worldwide shows significant potential for water savings in various end-uses [10,12,13,16,17,19,21,22,23,24]. Inadequate management of water consumption can have significant socioeconomic and environmental impacts in the cities where these institutions are located, particularly in smaller towns [25]. Therefore, it is essential to implement sustainability measures to mitigate the negative impacts of higher education institutions on the surrounding environment. Several authors have proposed alternative solutions for sustainable water use, particularly to address extreme climate scenarios. These solutions include reducing water consumption through the adoption of more efficient devices (e.g., taps and flushes) and minimizing water waste [9,12,26], as well as seeking alternative water sources (e.g., rainwater or treated wastewater), thereby reducing reliance on natural water sources [3,9,27,28,29].
This research is the first at the Polytechnic University of Bragança (Portugal) to address water sustainability, focusing on two student residences: one for male and the other for female students. The decision to focus this research exclusively on student residences is due to the scarcity in the existing literature and the high water consumption reported in these buildings [30,31,32,33]. The selected residences were chosen because institutional managers highlighted that both buildings showed unexpectedly high water consumption (more information in Section 2.1). This study aimed to assess water demand in two university residences; propose measures for efficient water use, including associated costs; and evaluate the feasibility of integrating these measures with the installation of a rainwater harvesting system (RWHS) for recharging flushing cisterns.
2. Materials and Methods
2.1. Location and Characteristics of the Residences
The two residences under study are located in the city of Bragança (northeastern Portugal), which has 22,685 inhabitants [34] and experiences a continental climate with Mediterranean influences. The precipitation pattern is irregular, with most rainfall occurring between October and April, and an annual average of approximately 700 mm [35]. Water consumption in Bragança is high by Portuguese standards, averaging around 10,294 m3/day, with 80% used for domestic activities and the remaining 20% for industrial activities and local commerce. The per capita domestic consumption was estimated by ERSAR [8] at 260 L/inhabitant/day.
The university student residences, which opened in 2012, are located outside the campus in the city center. Each building consists of three floors. Residence I (male residence) features 12 bedrooms, including twin and triple rooms; 10 sanitary facilities; a kitchen with a dining hall; a laundry room; and a communal leisure area, accommodating up to 16 residents. Residence II (female residence) has ten bedrooms, including twin and triple rooms; 12 sanitary facilities; a kitchen with a dining hall; a laundry room; and a communal leisure area, and can accommodate up to 25 residents. The roof area of Residence I is 184.14 m2, while Residence II has a roof area of 278.71 m2, both covered with ceramic tile roofs. The number and types of water devices in both residences are detailed in Table 1. During the research period in 2023, each residence had 6 users. Despite having low occupancy rates, both buildings exhibited the highest average annual water consumption of around 300 m3 and electricity usage of 47,781 kWh in Residence I and 60,317 kWh in Residence II. Since they were single-gender residences, it was possible to compare the effect of gender on water demand. Water consumption and energy usage with showers and kitchen taps were also estimated for maximum residence occupancy.

Table 1.
Quantity and types of water devices in each residence.
2.2. Water Consumption Characterization
The flushing cisterns in Residence I are dual-flush (6 L/3 L), and the urinals have a flush volume of approximately 2 L. In Residence II, the flushing cisterns are dual-flush (4.5/3 L). The water consumption for these devices was calculated using the following equation:
- : each of the existing devices;
- : flushing volume (L);
- : daily frequence of use.
To measure the water consumption of timer taps, a 1 L calibrated beaker was used while the taps were on. The flow rates of washbasins and kitchen taps were determined by recording the time it took to fill a 1 L calibrated beaker. Shower flow rates were determined by recording the time it took to fill a 10 L capacity bucket to a certain volume, “X”, and then obtaining the final volume with a calibrated beaker. All measurements were repeated three times with the devices in the position of use.
The water consumption for these devices was calculated using the following equation:
- : each of the existing devices;
- : water flow (L);
- : daily frequence of use;
- t: duration of each use (minutes).
According to the manufacturer’s specifications, the washing machines in both residences were estimated to use an average of 45 L of water per wash. In both residences, the water heating systems utilize a heat pump with a coefficient of performance (COP) of 2.97.
Surveys (Appendix A) were conducted to discern water use behavior and patterns of both the users and the cleaning staff. Due to the small number of users (6 in each residence), all were surveyed in person in their respective residence. Additionally, to minimize biases, each resident was asked to simulate their usual water usage by using the flushing cisterns and opening taps and showers as they normally would. The data collected enabled to estimating the average daily frequency of use for all devices, as well as the average daily duration of each use for taps and showers. The cleaning staff were asked to fill the bucket as usual when cleaning the building. The volume of water was measured using a 1 L graduated beaker.
2.3. Water Use Efficiency Measure Impact
Considering the obtained results for water consumption, suggestions for more efficient devices were proposed to achieve higher water efficiency, according to the Portuguese Labeling System [36], which promotes water-saving technologies as a crucial aspect of national water management strategies. According to this system, water devices are classified from A to E, with “A” indicating the highest efficiency and “E” representing the lowest. The proposed measures were organized into scenarios (Table 2).
Table 2.
Proposed water-saving scenarios in both residences.
Energy consumption by showers and taps depends on the amount of hot water consumed by the users [26,31,37,38,39]. According to [37,38], the percentage of hot water consumed in relation to all the water used can be considered 100%, whereas for kitchen taps, it corresponds to 56% of all consumed water. Therefore, before and after the simulation of Scenario 1, the energy consumption associated with hot water consumption by showers and kitchen taps was calculated according to the following equation:
- : water density (ρ = 1000 kg/m3).
- : specific heat of water ( = 4187 J/kg × K).
- : consumption of hot water/resident (L).
- : Denotes the difference between the cold water inlet temperature and the hot water outlet temperature (°C). According to the long-term climate series [40], the average annual water temperature in Bragança was estimated at 12.3 °C. The water heating system raised the temperature to 60 °C, resulting in a temperature variation of 47.7 °C.
- : efficiency of the heating system, which in the present study is 2.97 for both residences.
In Scenario 2, the inclusion of a RWHS was simulated to recharge flush cisterns, as the water used in these devices can be sourced from non-potable supplies. Since this is a hypothetical scenario, an approximate sizing method was applied, as suggested by Sousa et al. [41], assuming uniform discharge over time and excluding considerations of heavy rainfall or prolonged droughts [42,43]. The design of the rainwater storage structure adhered to the criteria and procedures outlined in the Technical Specification ETA 0701 [42], with the volume of usable rainwater estimated using Equation (4).
- : volume of rainwater in the reference period (L);
- : runoff coefficient (dimensionless);
- : average precipitation accumulated at the site (mm);
- : catchment area (roof) (m2);
- : hydraulic filtering efficiency (dimensionless).
The C value was set at 0.9, which is typical for ceramic tile roofs, and the ηf value at 0.9, representing the maximum hydraulic filtration efficiency [42]. The average monthly precipitation was statistically estimated using records from 2013 to 2023 [35].
Concomitantly, the economic viability of each proposed water efficiency measure was assessed. This involved evaluating the initial investment required to implement the measures, the potential decrease in water bills due to improved water efficiency, and the timeframe for investment turnover. In the present study, the inflation rates were not considered. The cost of the associated works for the RWHS installation was not determined in the present approach, so in Scenario 2, the investment turnover was not estimated.
3. Results and Discussion
3.1. Characterization of Water Devices and Their Use Patterns
The survey data indicated that male users typically spend 5.5 days per week at the residence, while female users spend 6.4 days per week. Students were in residence all year except in August.
3.1.1. Showers
The current average flow rate was 9.1 L/min; each user takes an average of 8.5 min to shower, 7.5 times/week (Residence I). In Residence II, the average flow rate was 9.2 L/min, with each user taking an average of 10.40 min to shower, 7.75 times/week. These devices are classified as water category B in Residence I and C in Residence II.
3.1.2. Flushing Cisterns
The average discharge volume in Residence I is 6 L, and in Residence II, it is 4.5 L. Considering the surveys, it was estimated that the toilet bowl was used 1.5 times/day/user in Residence I, and there were 1.75 discharges per use. In Residence II, the toilet bowl was used 2.6 times/day/user, and at two discharges per use. The water category efficiency of flushing cisterns is A++.
3.1.3. Urinals
According to data obtained in surveys, the average user used these devices 2.25 times/day and discharged 1.25 times/user/day. The average discharge volume for these devices is 2 L (water category efficiency A).
3.1.4. Taps
- WC basin single-lever taps: These taps had an average flow of 13.29 L/min, and the estimated number of total uses was around three times/day/user; each use is on for approximately 0.18 min (Residence I). In Residence II, these taps presented an average flow of 14 L/min, and the estimated number of total uses was around 3.4 times/day/user; each use was on for approximately 0.23 min. The water category efficiency of these devices is E.
- Timed flow tap: The average flow is 3.63 L/min in both residences. Each use is on for approximately 7.45 s, and it is used 0.33 and 0.38 times/day/user in the male and female residences, respectively. Their water category efficiency is A.
- Kitchen tap: The average flow is 10.6 L/min, and it is used for 6.67 min/day/user (Residence I). In Residence II, the average flow is 9.9 L/min, and it is used for 2.20 min/day/user. Their water category efficiency is C.
3.1.5. Washing Machines
There is one washing machine in both residences. Each device uses 45 L for each cycle of washing. This device is used once per user/week.
3.1.6. Build Cleaning
According to the staff surveys, an average of 470 and 300 L/week is used to clean the Residence I and II, respectively.
3.2. Water Use Characterization
Based on the characterization of the water devices and users water use patterns, the estimated current average total annual water consumption in Residence I and II were 325.67 and 318.80 m3/year, respectively. These estimates were aligned with the annual water bills provided by the university managers. The research carried out in student residences and dormitories in Belgium, Malaysia, and the USA found that the daily per capita water demand ranged from 89.5 L [33] to over 300 L [30,32]. Residences I and II had a daily water consumption of 224 and 219 L per user, respectively, which are among the highest values reported in these international studies.
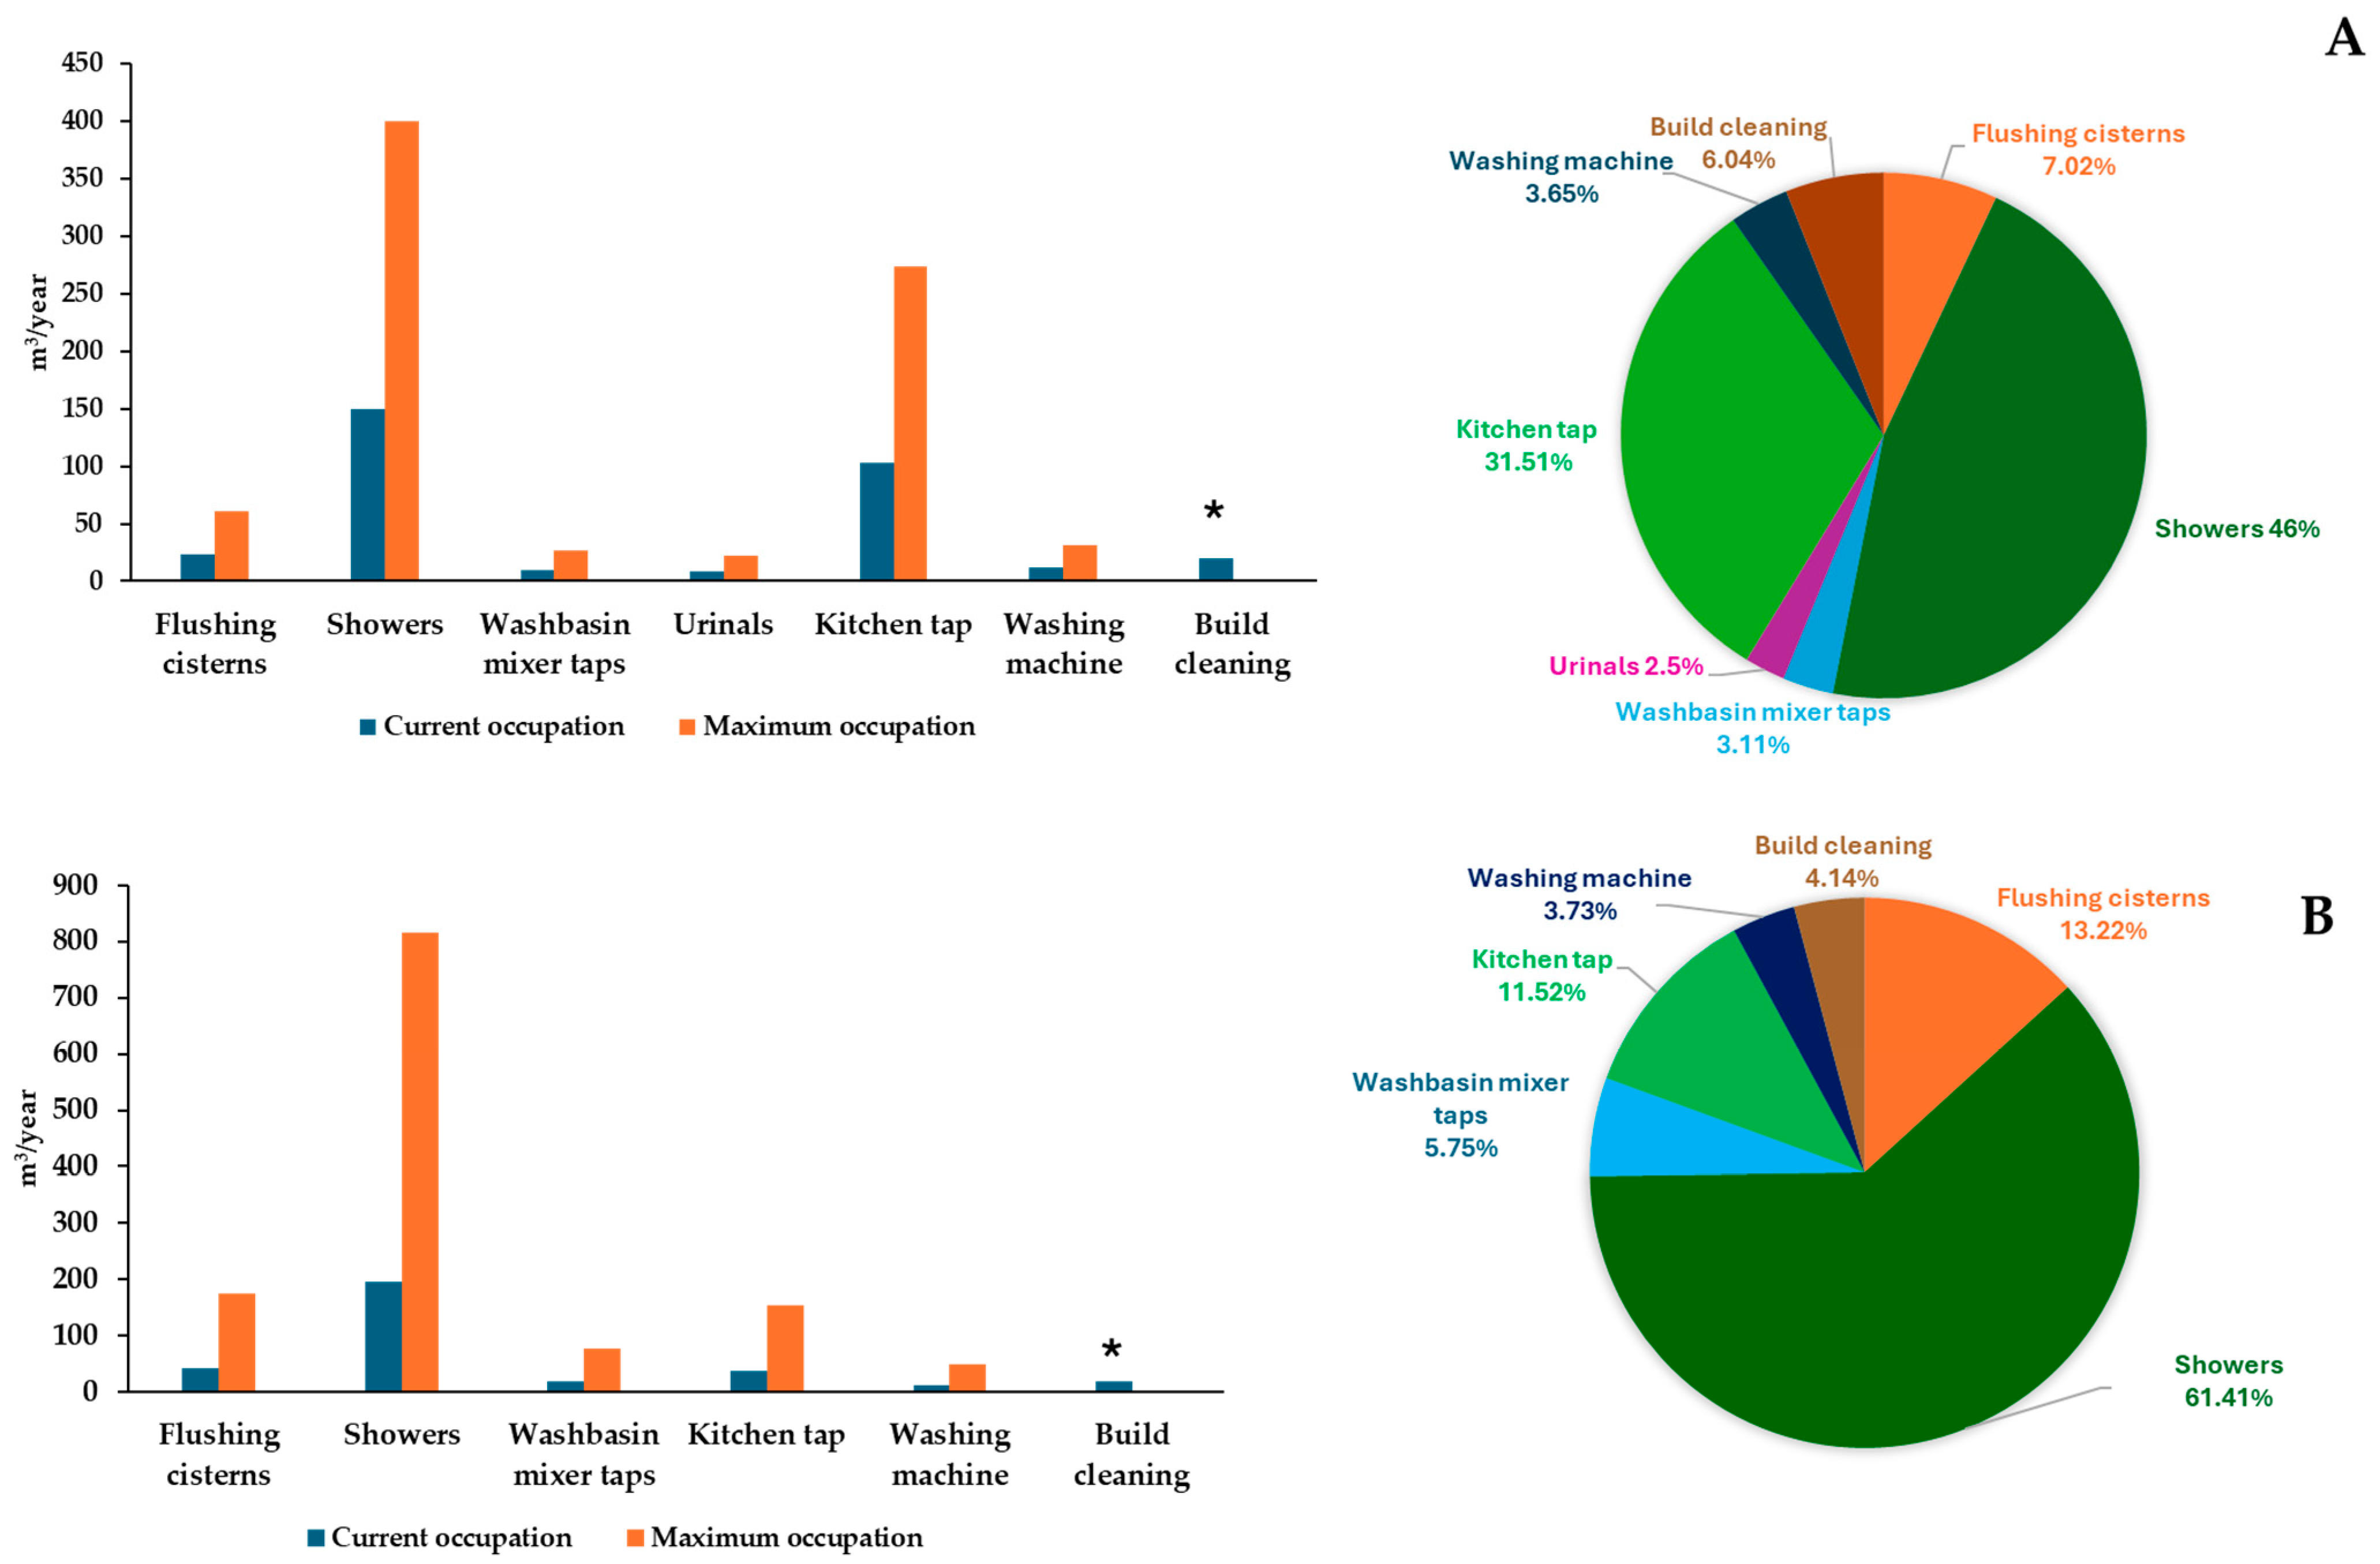
The most water-consuming devices were showers, accounting for 46% and 61.41% of water consumption in Residences I and II, respectively, followed by kitchen taps (31.51% in Residence I and 11.52% in Residence II). Although the flushing cisterns were water consumption-efficient, the consumption concerning these devices was still 7.02% in Residence I and 13.22% in Residence II (Figure 1). Estimates for washbasin timed flow taps were not visually represented in Figure 1 because they accounted for only 0.17% of the water consumed in Residence I and 0.23% in Residence II.
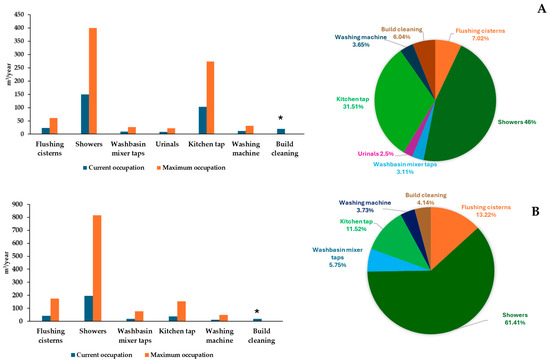
Figure 1.
Average monthly and annual water consumption by use category in Residence I (A) and II (B). * Not estimated for maximum occupancy.
The literature review conducted by [44] on the impact of gender on residential water demand found mixed results. It revealed that water consumption behavior is also influenced by various factors such as social, economic, cultural, and ideological elements [44,45]. Nevertheless, the present research is aligned with most existing studies, indicating that women generally consume more water than men [22,30,32,44]. The higher water consumption by women is attributed to longer showers [46] and differences in restroom fixtures (urinals use less water than toilets) [44]. It is not clear whether there were differences in water usage with regard to kitchen taps between genders, as kitchen taps have different water flows, and students have access to low-cost meals in university canteens. Surveys have indicated that students rarely cook at residences. When they do, they tend to use ready-to-eat food, which requires less residential water for preparation.
3.3. Implementation of Water-Saving Measures
Therefore, the data on water consumption indicated a potential to reduce water consumption in both residences. Scenario 1 (Table 2) proposed replacing all washbasin mixers and kitchen taps with more efficient devices (water efficiency category A). The proposal also included installing flow reductors for the showers. The washbasin mixer taps will be replaced with an average flow of 5 L/min, each priced at EUR 138 + VAT (2023 prices). This change is anticipated to decrease average water consumption from 10.13 to 3.81 m3/year in Residence I and 18.34 to 6.65 m3/year in Residence II. Kitchen taps, with an average flow of 8 L/min, can also be replaced for EUR 153 + VAT (2023 prices), resulting in a decrease in water consumption from 102.61 to 77.44 m3/year in Residence I and from 36.73 to 29.74 m3/year in Residence II. As for showers, it was recommended to install a shower flow regulator device in all showers to reduce the flow to 9 L/min at a cost of EUR 2.85 + VAT (2023 prices). A water consumption reduction is expected from 149.79 to 139.30 m3/year in Residence I and a decrease from 195.76 to 182.06 m3/year in Residence II.
In Scenario 2, a combination of Scenario 1 with the simulation of a RWHS implementation was proposed for recharging the flushing cisterns. After considering the monthly consumption and the available rainwater volume, it was found that the generated water was enough to recharge the flushing cisterns in both residences (Table 3 and Table 4).
Table 3.
RWHS cistern simulation in Residence I.
Table 4.
RWHS cistern simulation in Residence II.
For Residence I, a RWHS cistern with a volume of 1.5 m3 will enable the collection of 33.32 m3 (98.45%) of rainwater, with the need for public water supply only in August (0.52 m3). Similarly, for Residence II, a RWHS cistern with the same volume will allow for a total rainwater harvesting of 45.77 m3 (98.31%), requiring water from the public supply only in August (0.79 m3). Scenario 2 was also simulated considering the maximum occupancy of the residences, resulting in cistern volumes of 1.5 m3 for both residences. In Residence I, the RWHS can capture a maximum of 76.49 m3 (84.76%), requiring approximately 13.75 m3 of mains water between June and September (Table A1, Appendix B). In Residence II, 147.12 m3 (76.77%) can be captured, necessitating the use of 44.52 m3 of public network water between May and September (Table A2, Appendix B). The cisterns would be installed on the ground, with prefabricated high-density polyethylene models being the most suitable due to their ease of installation, operation, and maintenance. Additionally, these cisterns are easier to relocate and do not cause a visual impact on the urban space.
Estimates of annual water consumption, annual water savings, and equipment and energy costs, both with and without the implemented measures, along with the expected payback period for the investment in each scenario, are presented in Table 5 (for Residence I) and Table 6 (for Residence II). The cost of installing the RWHS network was not estimated due to the lack of relevant plans. The estimated cost for the required equipment includes the cistern, pumps, filters, valves, drainage pipes, and rainwater distribution network. Without detailed information on the water network, it is difficult to determine the necessary pumping system and the cost of the rainwater distribution network. Additionally, the impact of RWHS on energy consumption was not assessed because it depends on the required pumping system [47].
Table 5.
Water and energy consumption and cost without and with water-saving measures and investment turnover in Residence I.
Table 6.
Water and energy consumption and cost without and with water-saving measures and investment turnover in Residence II.
If Scenario 1 were implemented in the residences, there would be a 13% reduction in water consumption in Residence I and a 10% reduction in Residence II. The reduction in hot water consumption would lead to a decrease in annual electricity consumption of 27.8% and 23.06% in Residence I and II, respectively (Table 5 and Table 6). Currently, the annual energy consumption per person for showers and kitchen tap water heating is 2715.42 kWh and 2391.33 kWh in Residence I and Residence II, respectively. With the proposed efficiency measures for both devices, the annual energy consumption per person is expected to decrease to 1960.40 kWh and 1839.92 kWh in Residence I and Residence II, respectively. In Portugal, generating 1 MWh of electrical energy emits 0.151 tCO2 eq [48]. Therefore, 0.41 tCO2 eq/year/device/person and 0.36 tCO2 eq/year/device/person are produced in Residence I and Residence II, respectively. If the measures were implemented, emissions would decrease to 0.30 tCO2 eq and 0.28 tCO2 eq in Residence I and Residence II, respectively. Therefore, the present research demonstrates that investing in water efficiency, particularly in water-efficient devices, has the potential to be highly viable in both financial and environmental terms. The short payback period and low initial investment suggest that investing in water-efficient solutions is an attractive and achievable option.
Thus, water savings for Residence I could reach around 20.0%, while in Residence II, only Scenario 2 could increase savings by up to 23.2%. The combination of consumption reduction measures with the implementation of RWHS mitigates the effects of low rainfall during the summer period. The expected irregularity of precipitation in the region [35,49], which may be exacerbated during prolonged droughts or by intense, short-term rainfall, presents a challenge to the sustainability and resilience of these systems. However, it is believed that continued use will remain viable for saving potable water in applications where drinking water is not required. Although this study did not address the seasonal variation in water consumption, the analysis of the water bills provided by the university’s managers indicates that water consumption remains relatively constant throughout the year, with a sharp reduction during the summer vacation (August). This assumption is also corroborated by [10,30]. Ref. [10] demonstrated that the reliability of RWHS in Aveiro University buildings (Portugal) during the summer months is not significantly affected.
The water quality is another challenge to the RWHS’s viability. Even though flushing cisterns can be replenished with non-potable rainwater, the water used in these devices has quality requirements [50]. Roof runoff entering the RWHS can be contaminated with several pollutants accumulated on rooftops during dry periods, affecting the harvested water quality [51]. Therefore, it is necessary to dispose of at least the first rainwater after a long dry period (first flush), as recommended by [42], which can affect the amount of stored water. However, the main challenge associated with installing RWHS is the extended payback period. According to [41], this period can stretch up to 19 years. Coupled with the low water prices [52], university managers may perceive this investment as costly and unprofitable. Despite the RWHS’s potential limitations, when making decisions concerning its installation, it is essential to consider the trade-off between these limitations and the positive environmental impacts [27,28,29,47,53,54]. Additionally, there is a need for further research to understand the functionality of these systems, and the promotion of students, decision-makers, and citizen literacy regarding sustainable water use [55].
4. Conclusions
This research directly measured water usage in student residences, allowing for realistic measures to be proposed for improving water savings and reducing bills, whether implemented in conjunction with the RWHS or not. Therefore, the main strength lies in proposing measures for more efficient water devices. These measures have the potential to be financially and environmentally viable, making them suitable for immediate broad implementation. Furthermore, this approach can be easily replicated elsewhere. Another strength is that the data collected on students’ water usage behavior can be used to shape future educational programs. These programs can raise awareness among students about the importance of reducing water consumption and can be expanded to the entire institutional population and society. This type of research can also help establish partnerships and leverage the diverse skills of teachers, researchers, students, and staff. Importantly, it will lead to initiatives related to environmental activities at the university and in society, creating an institutional environment that supports and actively encourages the implementation of environmental management measures and projects aimed at sustainable water use. On the other hand, the main weakness of this research is the small size of the student sample, consisting of only six male and six female participants. This sample may not represent the entire student population, preventing the analysis of how factors such as nationality and cultural and educational background could influence water usage behavior. Another significant weakness was the inability to conduct a seasonal and interannual analysis of water consumption and weather variability, which are essential for evaluating the performance of the RWHS. Therefore, future research should focus on 1. conducting long-term studies with a larger and more diverse group of students to analyze water consumption patterns over multiple years and 2. evaluating the performance of the RWHS during dry and wet seasons/years to understand the impact of weather and climate changes on the system’s efficiency.
Author Contributions
Conceptualization, F.S. and A.M.A.-G.; methodology, F.S. and A.M.A.-G.; formal analysis, F.S., G.O. and A.M.A.-G.; investigation, G.O., M.J.A., F.S., A.A. and A.M.A.-G.; data curation, F.S., G.O. and A.M.A.-G.; writing—original draft preparation, F.S. and A.M.A.-G.; writing—review and editing, A.M.A.-G. and F.S.; visualization, A.M.A.-G. and F.S.; supervision, F.S. and A.M.A.-G.; project administration, F.S. and A.M.A.-G. All authors have read and agreed to the published version of the manuscript.
Funding
This research received no external funding.
Institutional Review Board Statement
The study was conducted in accordance with the Declaration of Helsinki, and approved by the Polytechnic Institute of Bragança Ethics Committee (protocol code 492662, approved on 1 June 2023).
Informed Consent Statement
Informed consent was obtained from all subjects involved in the study.
Data Availability Statement
The original contributions presented in the study are included in the article, further inquiries can be directed to the corresponding author.
Acknowledgments
The authors are grateful to the Foundation for Science and Technology (FCT, Portugal) for financial support by national funds FCT/MCTES (PIDDAC) to CIMO (UIDB/00690/2020 and UIDP/00690/2020), SusTEC (LA/P/0007/2020), FibEnTech (UIDB/00195/2020), and GeoBioTec (UIDB/04035/2020 and UIDP/04035/2020).
Conflicts of Interest
The authors declare no conflicts of interest.
Appendix A
Survey:
- This survey was conducted on all users of Residences I and II, with specific questions addressed to the cleaning staff.
- 1. Gender:
- ⎕ Male
- ⎕ Female
- 2. Age: _________
- 3. How many days a week do you stay at the Residence? ___________
- 4. How often do you wash your hands at the Residence?
- 4.1. How many times do you usually press the push button of the tap? (in the case of the timer taps) _______
- 4.2. How long does the tap remain open while you use the single lever taps? _______
- How often do you use the toilet at the Residence? _______
- 5.1. Indicate the number of flushes each time you use the toilet: _______
- 5.2. What “button” do you usually flush when you use the toilet?
- - The larger “button” (6 L) ⎕
- - The smaller “button” (3 L) ⎕
- - Both “buttons” at the same time ⎕
- - The single “button” (if there is only one “button”) ⎕
- 6. Please estimate the number of times you shower each week: _______________
- 6.1. Give an estimate, in minutes, of the time it takes to shower: _______________
- 7. Do you usually use the washing machine at the Residence?
- ⎕ Yes
- ⎕ No
- 7.1. If you answered “Yes”, please estimate the number of times you use the washing machine each week: _______________ and which washing programs you use ____________________________________________________________.
- 8. Do you usually use the kitchen tap at the Residence?
- ⎕ Yes
- ⎕ No
- 8.1. If you answered “Yes,” please estimate the amount of time, in minutes, that you use the tap each day: _______________
- 9. Do you cook your lunch and/or dinner while you are at the Residence?
- ⎕ Yes
- ⎕ No
- 9.1. If “Yes”, how often do you cook? _______________
- 9.2. If “Yes”, is the stove gas or electric? _____________
- 10. Have you ever detected a leak in the residence water networks?
- ⎕ Yes
- ⎕ No
- 10.1. If “Yes,” please describe what happened. ________________________________________
Questions addressed to the cleaning staff:
- 1. How many times a day is the floor washed? ___________
- 2. How is the residence floor washed?
- 2.1. With a mop? _______ How many times a day? _______
- 2.2. What is the capacity of the bucket? _______
- 2.3. How many times do you fill the bucket? _______
Appendix B
Table A1.
RWHS simulation in Residence I with maximum occupancy.
Table A1.
RWHS simulation in Residence I with maximum occupancy.
| Month | Monthly Precipitation (mm) | Roof Area (m2) | Available Rainwater Volume (m3) | Monthly Consumption (m3) | Available Consumption (m3) | Cistern Volume (m3) | Water at the End of the Month (m3) | Public Network Supply (m3) |
|---|---|---|---|---|---|---|---|---|
| October | 102.57 | 184 | 15.30 | 7.52 | 7.78 | 1.50 | 1.50 | 0.00 |
| November | 91.37 | 13.63 | 7.52 | 6.11 | 1.50 | 0.00 | ||
| December | 99.87 | 14.90 | 7.52 | 7.38 | 1.50 | 0.00 | ||
| January | 91.57 | 13.66 | 7.52 | 6.14 | 1.50 | 0.00 | ||
| February | 73.74 | 11.00 | 7.52 | 3.48 | 1.50 | 0.00 | ||
| March | 71.05 | 10.60 | 7.52 | 3.08 | 1.50 | 0.00 | ||
| April | 72.18 | 10.77 | 7.52 | 3.25 | 1.50 | 0.00 | ||
| May | 45.91 | 6.85 | 7.52 | −0.67 | 0.83 | 0.00 | ||
| June | 32.45 | 4.84 | 7.52 | −2.68 | 0.00 | 1.85 | ||
| July | 10.72 | 1.60 | 7.52 | −5.92 | 0.00 | 5.92 | ||
| August | 13.52 | 2.02 | 7.52 | −5.50 | 0.00 | 5.50 | ||
| September | 47.24 | 7.05 | 7.52 | −0.47 | 0.00 | 0.47 | ||
| Total | 752.19 | 112.19 | 90.240 | 13.75 |
Table A2.
RWHS simulation in Residence II with maximum occupancy.
Table A2.
RWHS simulation in Residence II with maximum occupancy.
| Month | Monthly Precipitation (mm) | Roof Area (m2) | Available Rainwater Volume (m3) | Monthly Consumption (m3) | Available Consumption (m3) | Cistern Volume (m3) | Water at the End of the Month (m3) | Public Network Supply (m3) |
|---|---|---|---|---|---|---|---|---|
| October | 102.57 | 279 | 23.16 | 15.97 | 7.19 | 1.50 | 1.50 | 0.00 |
| November | 91.37 | 20.63 | 15.97 | 4.66 | 1.50 | 0.00 | ||
| December | 99.87 | 22.55 | 15.97 | 6.58 | 1.50 | 0.00 | ||
| January | 91.57 | 20.67 | 15.97 | 4.70 | 1.50 | 0.00 | ||
| February | 73.74 | 16.65 | 15.97 | 0.68 | 1.50 | 0.00 | ||
| March | 71.05 | 16.04 | 15.97 | 0.07 | 1.50 | 0.00 | ||
| April | 72.18 | 16.30 | 15.97 | 0.33 | 1.50 | 0.00 | ||
| May | 45.91 | 10.36 | 15.97 | −5.61 | 0.00 | 4.11 | ||
| June | 32.45 | 7.33 | 15.97 | −8.64 | 0.00 | 8.64 | ||
| July | 10.72 | 2.42 | 15.97 | −13.55 | 0.00 | 13.55 | ||
| August | 13.52 | 3.05 | 15.97 | −12.92 | 0.00 | 12.92 | ||
| September | 47.24 | 10.66 | 15.97 | −5.31 | 0.00 | 5.31 | ||
| Total | 752.19 | 169.81 | 191.64 | 44.52 |
References
- Vörösmarty, C.J.; McIntyre, P.B.; Gessner, M.O.; Dudgeon, D.; Prusevich, A.; Green, P.; Glidden, S.; Bunn, S.E.; Sullivan, C.A.; Liermann, C.R.; et al. Global Threats to Human Water Security and River Biodiversity. Nature 2010, 467, 555–561. [Google Scholar] [CrossRef] [PubMed]
- Ma, T.; Sun, S.; Fu, G.; Hall, J.W.; Ni, Y.; He, L.; Yi, J.; Zhao, N.; Du, Y.; Pei, T.; et al. Pollution Exacerbates China’s Water Scarcity and Its Regional Inequality. Nat. Commun. 2020, 11, 650. [Google Scholar] [CrossRef]
- Kilinc, E.A.; Tanik, A.; Hanedar, A.; Gorgun, E. Climate Change Adaptation Exertions on the Use of Alternative Water Resources in Antalya, Türkiye. Front. Environ. Sci. 2023, 10, 1080092. [Google Scholar] [CrossRef]
- Water Scarcity Conditions in Europe (Water Exploitation Index Plus). Available online: https://www.eea.europa.eu/en/analysis/indicators/use-of-freshwater-resources-in-europe-1 (accessed on 19 June 2024).
- Spinoni, J.; Vogt, J.V.; Naumann, G.; Barbosa, P.; Dosio, A. Will Drought Events Become More Frequent and Severe in Europe? Int. J. Climatol. 2018, 38, 1718–1736. [Google Scholar] [CrossRef]
- Alvarez, I.; Pereira, H.; Lorenzo, M.N.; Picado, A.; Sousa, M.C.; Taboada, J.J.; Dias, J.M. Drought Projections for the NW Iberian Peninsula under Climate Change. In Climate Dynamics; Springer: Berlin/Heidelberg, Germany, 2024. [Google Scholar] [CrossRef]
- Veloso, S.; Tam, C.; Oliveira, T. Effects of Extreme Drought and Water Scarcity on Consumer Behaviour—The Impact of Water Consumption Awareness and Consumers’ Choices. J. Hydrol. 2024, 639, 131574. [Google Scholar] [CrossRef]
- ERSAR—Dados de Base. Available online: https://www.ersar.pt/pt/setor/factos-e-numeros/dados-de-base (accessed on 24 June 2024).
- Naserisafavi, N.; Yaghoubi, E.; Sharma, A.K. Alternative Water Supply Systems to Achieve the Net Zero Water Use Goal in High-Density Mixed-Use Buildings. Sustain. Cities Soc. 2022, 76, 103414. [Google Scholar] [CrossRef]
- Meireles, I.; Sousa, V. Assessing Water, Energy and Emissions Reduction from Water Conservation Measures in Buildings: A Methodological Approach. Environ. Sci. Pollut. Res. 2020, 27, 4612–4629. [Google Scholar] [CrossRef]
- Mannan, M.; Al-Ghamdi, S.G. Environmental Impact of Water-Use in Buildings: Latest Developments from a Life-Cycle Assessment Perspective. J. Environ. Manag. 2020, 261, 110198. [Google Scholar] [CrossRef]
- Rodrigues, F.; Silva-Afonso, A.; Pinto, A.; Macedo, J.; Santos, A.S.; Pimentel-Rodrigues, C. Increasing Water and Energy Efficiency in University Buildings: A Case Study. Environ. Sci. Pollut. Res. 2020, 27, 4571–4581. [Google Scholar] [CrossRef]
- Bonnet, J.-F.; Devel, C.; Faucher, P.; Roturier, J. Analysis of Electricity and Water End-Uses in University Campuses: Case-Study of the University of Bordeaux in the Framework of the Ecocampus European Collaboration. J. Clean. Prod. 2002, 10, 13–24. [Google Scholar] [CrossRef]
- Da Silva, S.F.; Britto, V.; Azevedo, C.; Kiperstok, A. Rational Consumption of Water in Administrative Public Buildings: The Experience of the Bahia Administrative Center, Brazil. Water 2014, 6, 2552–2574. [Google Scholar] [CrossRef]
- Morote, Á.-F.; Hernández, M.; Olcina, J.; Rico, A.-M. Water Consumption and Management in Schools in the City of Alicante (Southern Spain) (2000–2017): Free Water Helps Promote Saving Water? Water 2020, 12, 1052. [Google Scholar] [CrossRef]
- Oduro-Kwarteng, S.; Nyarko, K.B.; Odai, S.N.; Aboagye-Sarfo, P. Water Conservation Potential in Educational Institutions in Developing Countries: Case Study of a University Campus in Ghana. Urban Water J. 2009, 6, 449–455. [Google Scholar] [CrossRef]
- Soares, A.E.P.; Silva, J.K.D.; Nunes, L.G.C.F.; Rios Ribeiro, M.M.; Silva, S.R.D. Water Conservation Potential within Higher Education Institutions: Lessons from a Brazilian University. Urban Water J. 2023, 20, 1429–1437. [Google Scholar] [CrossRef]
- Alghamdi, A.; Haider, H.; Hewage, K.; Sadiq, R. Inter-University Sustainability Benchmarking for Canadian Higher Education Institutions: Water, Energy, and Carbon Flows for Technical-Level Decision-Making. Sustainability 2019, 11, 2599. [Google Scholar] [CrossRef]
- Almeida, A.P.; Sousa, V.; Silva, C.M. Methodology for Estimating Energy and Water Consumption Patterns in University Buildings: Case Study, Federal University of Roraima (UFRR). Heliyon 2021, 7, e08642. [Google Scholar] [CrossRef] [PubMed]
- Ruiz-Garzón, F.; del Carmen Olmos-Gómez, M.; Estrada-Vidal, L.I. Perceptions of Teachers in Training on Water Issues and Their Relationship to the SDGs. Sustainability 2021, 13, 5043. [Google Scholar] [CrossRef]
- Marinho, M.; do Socorro Gonçalves, M.; Kiperstok, A. Water Conservation as a Tool to Support Sustainable Practices in a Brazilian Public University. J. Clean. Prod. 2014, 62, 98–106. [Google Scholar] [CrossRef]
- Silva-Afonso, A.; Pimentel-Rodrigues, C.; Meireles, I.; Sousa, V. Feasibility Study of Water Saving Measures in Higher Education Buildings: A Case Study of the University of Aveiro. BJECC 2016, 6, 116–127. [Google Scholar] [CrossRef]
- da Silva, L.C.C.; Filho, D.O.; Silva, I.R.; e Pinto, A.C.V.; Vaz, P.N. Water Sustainability Potential in a University Building—Case Study. Sustain. Cities Soc. 2019, 47, 101489. [Google Scholar] [CrossRef]
- Nunes, L.G.C.F.; Soares, A.E.P.; de Albuquerque Soares, W.; da Silva, S.R. Water Consumption in Public Schools: A Case Study. J. Water Sanit. Hyg. Dev. 2019, 9, 119–128. [Google Scholar] [CrossRef]
- Ragazzi, M.; Ghidini, F. Environmental Sustainability of Universities: Critical Analysis of a Green Ranking. Energy Procedia 2017, 119, 111–120. [Google Scholar] [CrossRef]
- Fidar, A.; Memon, F.A.; Butler, D. Environmental Implications of Water Efficient Microcomponents in Residential Buildings. Sci. Total Environ. 2010, 408, 5828–5835. [Google Scholar] [CrossRef]
- Sharma, A.K. Rainwater Tank Systems for Urban Water Supply: Design, Yield, Energy, Health Risks, Economics and Social Perceptions; IWA Publishing: London, UK, 2015; Volume 14. [Google Scholar] [CrossRef]
- Teston, A.; Piccinini Scolaro, T.; Kuntz Maykot, J.; Ghisi, E. Comprehensive Environmental Assessment of Rainwater Harvesting Systems: A Literature Review. Water 2022, 14, 2716. [Google Scholar] [CrossRef]
- Pimentel-Rodrigues, C.; Silva-Afonso, A. Rainwater Harvesting for Irrigation of Tennis Courts: A Case Study. Water 2022, 14, 752. [Google Scholar] [CrossRef]
- Alborzfard, N.; Berardi, U. (Un) Sustainable Water Practices in Dormitories. SB13 Dubai Paper-066. 8 December 2013. Available online: https://www.researchgate.net/profile/Nakisa-Alborz/publication/337438894_Un_Sustainable_Water_Practices_in_Dormitories/links/5dd75bb392851c1feda58494/Un-Sustainable-Water-Practices-in-Dormitories.pdf (accessed on 24 June 2024).
- Bongungu, J.L.; Francisco, P.W.; Gloss, S.L.; Stillwell, A.S. Estimating Residential Hot Water Consumption from Smart Electricity Meter Data. Environ. Res. Infrastruct. Sustain. 2022, 2, 045003. [Google Scholar] [CrossRef]
- Daud, F.M.; Abdullah, S. Water Consumption Trend among Students in a University’s Residential Hall. Malays. J. Soc. Sci. Humanit. (MJSSH) 2020, 5, 56–62. [Google Scholar] [CrossRef]
- De Jonge, L.; De Backer, L.; Van Kenhove, E. Water Use in Collective Student Housing. In Proceedings of the WDSA CCWI 2022: 2nd International Joint Conference on Water Distribution Systems Analysis & Computing and Control in the Water Industry, Proceedings, Valencia, Spain, 18–22 July 2022. [Google Scholar]
- Censos 2021-População Residente em Bragança. Available online: https://censos.ine.pt/xportal/xmain?xpgid=censos21_populacao&xpid=CENSOS21 (accessed on 24 June 2024).
- IPMA-Séries Longas. Available online: https://www.ipma.pt/pt/oclima/series.longas/?loc=Bragan%C3%A7a&type=raw (accessed on 24 June 2024).
- Silva-Afonso, A.; Pimentel-Rodrigues, C. The Portuguese System of Certifying and Labeling Water-Efficiency Products. J. Am. Water Work. Assoc. 2010, 102, 52–56. [Google Scholar] [CrossRef]
- Faia, V. Metodologia de cálculo de Consumos para Classificação de Eficiência Hídrica nos Edifícios Residenciais. Master’s Thesis, Universidade de Lisboa-Instituto Superior Técnico, Lisboa, Portugal, 2021. (In Portuguese). [Google Scholar]
- Faia, V.; Poças, A.; Silva, C.; Newton, F.; Malta Dias, P. Eficiência hídrica e nexus água-energia: Modelo Quantitativo de impacto de medidas de melhoria nos edifícios residenciais. In Proceedings of the XX SILUBESA-Simpósio Luso-Brasileiro de Engenharia Sanitária e Ambiental, Aveiro, Portugal, 29 June–1 July 2022. [Google Scholar]
- Vermeulen, H.J.; Fast, S. Electrical Energy Consumption Analysis for Sanitary Water Heating in Student Residences. In Proceedings of the 2016 International Conference on the Domestic Use of Energy (DUE), Cape Town, South Africa, 29–31 March 2016; pp. 1–6. [Google Scholar]
- IPMA-Clima Normais. Available online: https://www.ipma.pt/pt/oclima/normais.clima/ (accessed on 19 June 2024).
- Sousa, V.; Silva, C.M.; Meireles, I.C. Technical-Financial Evaluation of Rainwater Harvesting Systems in Commercial Buildings–Case Ase Studies from Sonae Sierra in Portugal and Brazil. Environ. Sci. Pollut. Res. 2018, 25, 19283–19297. [Google Scholar] [CrossRef]
- Technical Commitee 0701. Available online: https://www.anqip.com/storage/2024/04/03/34/e3045579.pdf (accessed on 19 June 2024).
- Santos, C.; Taveira-Pinto, F. Analysis of Different Criteria to Size Rainwater Storage Tanks Using Detailed Methods. Resour. Conserv. Recycl. 2013, 71, 1–6. [Google Scholar] [CrossRef]
- Balado-Naves, R.; Suárez-Fernández, S. Exploring Gender Differences in Residential Water Demand. Water Resour. Econ. 2024, 46, 100243. [Google Scholar] [CrossRef]
- Granda, L.; Moya-Fernández, P.J.; Soriano-Miras, R.M.; González-Gómez, F. Pro-Environmental Behaviour in Household Water Use. A Gender Perspective. Sustain. Water Resour. Manag. 2024, 10, 49. [Google Scholar] [CrossRef]
- Ibáñez-Rueda, N.; Guardiola, J.; López-Ruiz, S.; González-Gómez, F. Towards a Sustainable Use of Shower Water: Habits and Explanatory Factors in Southern Spain. Sustain. Water Resour. Manag. 2023, 9, 121. [Google Scholar] [CrossRef]
- de Sá Silva, A.C.R.; Bimbato, A.M.; Balestieri, J.A.P.; Vilanova, M.R.N. Exploring Environmental, Economic and Social Aspects of Rainwater Harvesting Systems: A Review. Sustain. Cities Soc. 2022, 76, 103475. [Google Scholar] [CrossRef]
- Fator de Emissão da Eletricidade-2023 Agência Portuguesa do Ambiente. Available online: https://www.apambiente.pt/sites/default/files/_Clima/Inventarios/20230427/FE_GEE_Eletricidade2023rev3.pdf (accessed on 19 June 2024).
- Pereira, S.C.; Marta-Almeida, M.; Carvalho, A.C.; Rocha, A. Extreme precipitation events under climate change in the Iberian Peninsula. Int. J. Climatol. 2020, 40, 1255–1278. [Google Scholar] [CrossRef]
- Água Para Reutilização (ApR)|Agência Portuguesa Do Ambiente. Available online: https://apambiente.pt/agua/agua-para-reutilizacao-apr (accessed on 13 August 2024).
- Antão-Geraldes, A.M.; Pinto, M.; Afonso, M.J.; Albuquerque, A.; Calheiros, C.S.C.; Silva, F. Promoting Water Efficiency in a Municipal Market Building: A Case Study. Hydrology 2023, 10, 69. [Google Scholar] [CrossRef]
- Grafton, R.Q.; Manero, A.; Chu, L.; Wyrwoll, P. The Price and Value of Water: An Economic Review. Camb. Prism. Water 2023, 1, e3. [Google Scholar] [CrossRef]
- Morales-Pinzón, T.; Lurueña, R.; Rieradevall, J.; Gasol, C.M.; Gabarrell, X. Financial Feasibility and Environmental Analysis of Potential Rainwater Harvesting Systems: A Case Study in Spain. Resour. Conserv. Recycl. 2012, 69, 130–140. [Google Scholar] [CrossRef]
- Morales-Pinzón, T.; Rieradevall, J.; Gasol, C.M.; Gabarrell, X. Modelling for Economic Cost and Environmental Analysis of Rainwater Harvesting Systems. J. Clean. Prod. 2015, 87, 613–626. [Google Scholar] [CrossRef]
- Silva, F.; Barros, J.; Afonso, M.J.A.P.S.; de Oliveira, G.G.L.; Fachada, I.; Antão-Geraldes, A.M. Promoting Water Efficiency in a Student Residence as a Contribution to Sustainability: hydroSAAP Innovation Project. In Proceedings of the INTED2024 Proceedings—18th International Technology, Education and Development Conference, Valencia, Spain, 4–6 March 2024; pp. 2153–2162. [Google Scholar] [CrossRef]
Disclaimer/Publisher’s Note: The statements, opinions and data contained in all publications are solely those of the individual author(s) and contributor(s) and not of MDPI and/or the editor(s). MDPI and/or the editor(s) disclaim responsibility for any injury to people or property resulting from any ideas, methods, instructions or products referred to in the content. |
© 2024 by the authors. Licensee MDPI, Basel, Switzerland. This article is an open access article distributed under the terms and conditions of the Creative Commons Attribution (CC BY) license (https://creativecommons.org/licenses/by/4.0/).