Review

EEG-Based Methods for Diagnosing Color Vision Deficiency: A Comprehensive Review

by
Ghada N. AlEssa
and
Saleh I. Alzahrani
*
Biomedical Engineering Department, College of Engineering, Imam Abdulrahman Bin Faisal University, Dammam 31451, Saudi Arabia
*
Author to whom correspondence should be addressed.
Appl. Sci. 2024, 14(17), 7579; https://doi.org/10.3390/app14177579
Submission received: 10 July 2024 / Revised: 24 August 2024 / Accepted: 25 August 2024 / Published: 27 August 2024

Abstract

:
Color vision deficiency (CVD) is one of the most common disorders related to visual impairment. Individuals with this condition are unable to differentiate between colors due to the absence or impairment of one or more color photoreceptors in their retinas. This disorder can be diagnosed through multiple approaches. This review paper provides a comprehensive summary of studies on applying Brain–Computer Interface (BCI) technology for diagnosing CVD. The main purpose of this review is to help researchers understand how BCI can be further developed and utilized for diagnosing CVD in the future.

1. Introduction

Color vision deficiency (CVD) is one of the most common vision disorders. It is the inability to differentiate between colors and shades under typical lighting conditions [1]. Globally, CVD affects approximately 1 in 200 women and 1 in 12 men [2]. This disparity arises because CVD can be inherited through the X chromosome. Men possess one X chromosome, while women possess two. For women to have CVD, both X chromosomes (inherited from the mother and father) must carry the CVD genes, which is rare. Conversely, men inherit one X chromosome inherited from their mother, making it more common for them to have the CVD gene [3,4,5]. Prevalence rates vary among populations. Reports indicate prevalence rates of 3.28% in Saudi Arabia, 8.4% in European populations, 7.3% in Turkey, 8.7% in India and Jordan, and 4% to 6.5% in China [6,7,8,9,10]. These variations are influenced by genetic factors, as studies have shown that gene frequencies differ between populations [10]. Other contributing factors include environmental influences, such as medication reactions and exposure to chemicals [11]. Moreover, consanguineous marriages, which are more common in Muslim populations, may increase the prevalence of genetic disorders, including CVD [12].
Although CVD impacts individuals across various ethnic and geographic demographics, a significant proportion of cases remain undetected or unacknowledged during the early stages of life [1]. This may occur due to a lack of appropriate and precise diagnostic techniques targeting this disorder. CVD usually affects people in their daily lives. Research has shown that individuals with CVD may lack awareness, and students’ academic performance can be negatively affected by it [13,14]. However, early diagnosis of CVD can help individuals manage the condition and plan their future career paths.
Early detection of CVD is crucial, as it allows for timely intervention and support for affected individuals, particularly in educational and occupational settings. Early detection enables individuals to address potential academic challenges and optimize their learning experiences. Certain occupational environments require the ability to discriminate colors, such as aviation, electrical engineering, and graphic design. Therefore, early detection of CVD ensures that individuals can make informed career choices and avoid limitations [2], [15]. Furthermore, recognizing CVD early may also allow for the identification of other vision diseases that may be linked to it, such as amblyopia and refractive errors [9]. Overall, the early detection of CVD improves the well-being and quality of life of those affected.
Currently, none of the available tests can fully and accurately evaluate color vision [16,17]. The most commonly used methods to assess color vision include the widely used Ishihara test, the Farnsworth–Munsell (FM) 100 Test, and the Anomaloscope [16,17,18]. Although these methods can assess color vision, they have limitations that may affect their effectiveness. One such limitation is that these tests require a behavioral response, making it impossible for individuals with locked-in syndrome to use these tests due to their physical and communication limitations. Locked-in syndrome is defined as quadriplegia resulting from damage to the brainstem, rendering individuals unable to move except for their eye movements [19,20,21]. Additionally, another issue is that these tests are subjective and cannot accurately gauge how the user perceives variations in hue. Furthermore, considerable training is required before taking the test, which is not feasible for many people with neurological impairments. Finally, because some users can memorize the answers to the questions, the outcomes of these examinations may be manipulated.
These limitations highlight the importance of finding alternative ways to diagnose CVD efficiently. In recent years, the utilization of Brain–Computer Interfaces (BCIs) has proven effective in various medical applications. A brain–computer interface (BCI) is a technology that permits connections from one’s brain to external devices. It translates brain signals, such as electroencephalography (EEG), into instructions for controlling an external device. Since BCI provides an alternative method of communication with the external world, it is primarily targeted to individuals who are unable to use conventional control and communication methods due to various disorders, such as spinal cord injury and amyotrophic lateral sclerosis [22]. As it can offer reliable information about the underlying brain processes, BCI technology can also be employed for diagnostic purposes. The diagnosis of CVD is one example of how a BCI system could be used.
This review paper aims to provide a comprehensive overview of existing studies that have demonstrated the diagnosis of CVD using EEG, discussing the techniques and analyses employed. While the field of EEG-based methods for diagnosing CVD has been explored in various studies, there is currently no review paper summarizing the advancements in this area from multiple perspectives and including the most recent studies, as presented in this review. This review offers a distinct advantage over existing reviews in this field in two key aspects: firstly, it delves into a wider array of perspectives, and secondly, it encompasses a greater number of studies, particularly recent ones, setting it apart from previous reviews in the domain. Providing such a review can aid in the development of more reliable procedures in the future, as researchers can gain a comprehensive understanding of the topic from multiple perspectives, including the techniques utilized, along with their advantages and disadvantages, the features employed, the electrodes used, and ultimately, the results obtained. This comprehensive review will encapsulate the work conducted in this field.
This review paper begins by introducing the key principles of color perception in the human retina to provide insight into the occurrence of CVD. Subsequently, it offers a general explanation of EEG utilization as a diagnostic tool and discusses how CVD can impact EEG readings. The review then explores previous techniques and studies used in this domain, highlighting their advantages and limitations. Following this, a brief overview of analysis techniques employed in previous studies is presented to outline the available pre-processing options in the field. Finaly, the paper concludes with a discussion on future directions and research perspectives, summarizing key gaps that can be addressed and improved upon in the future.

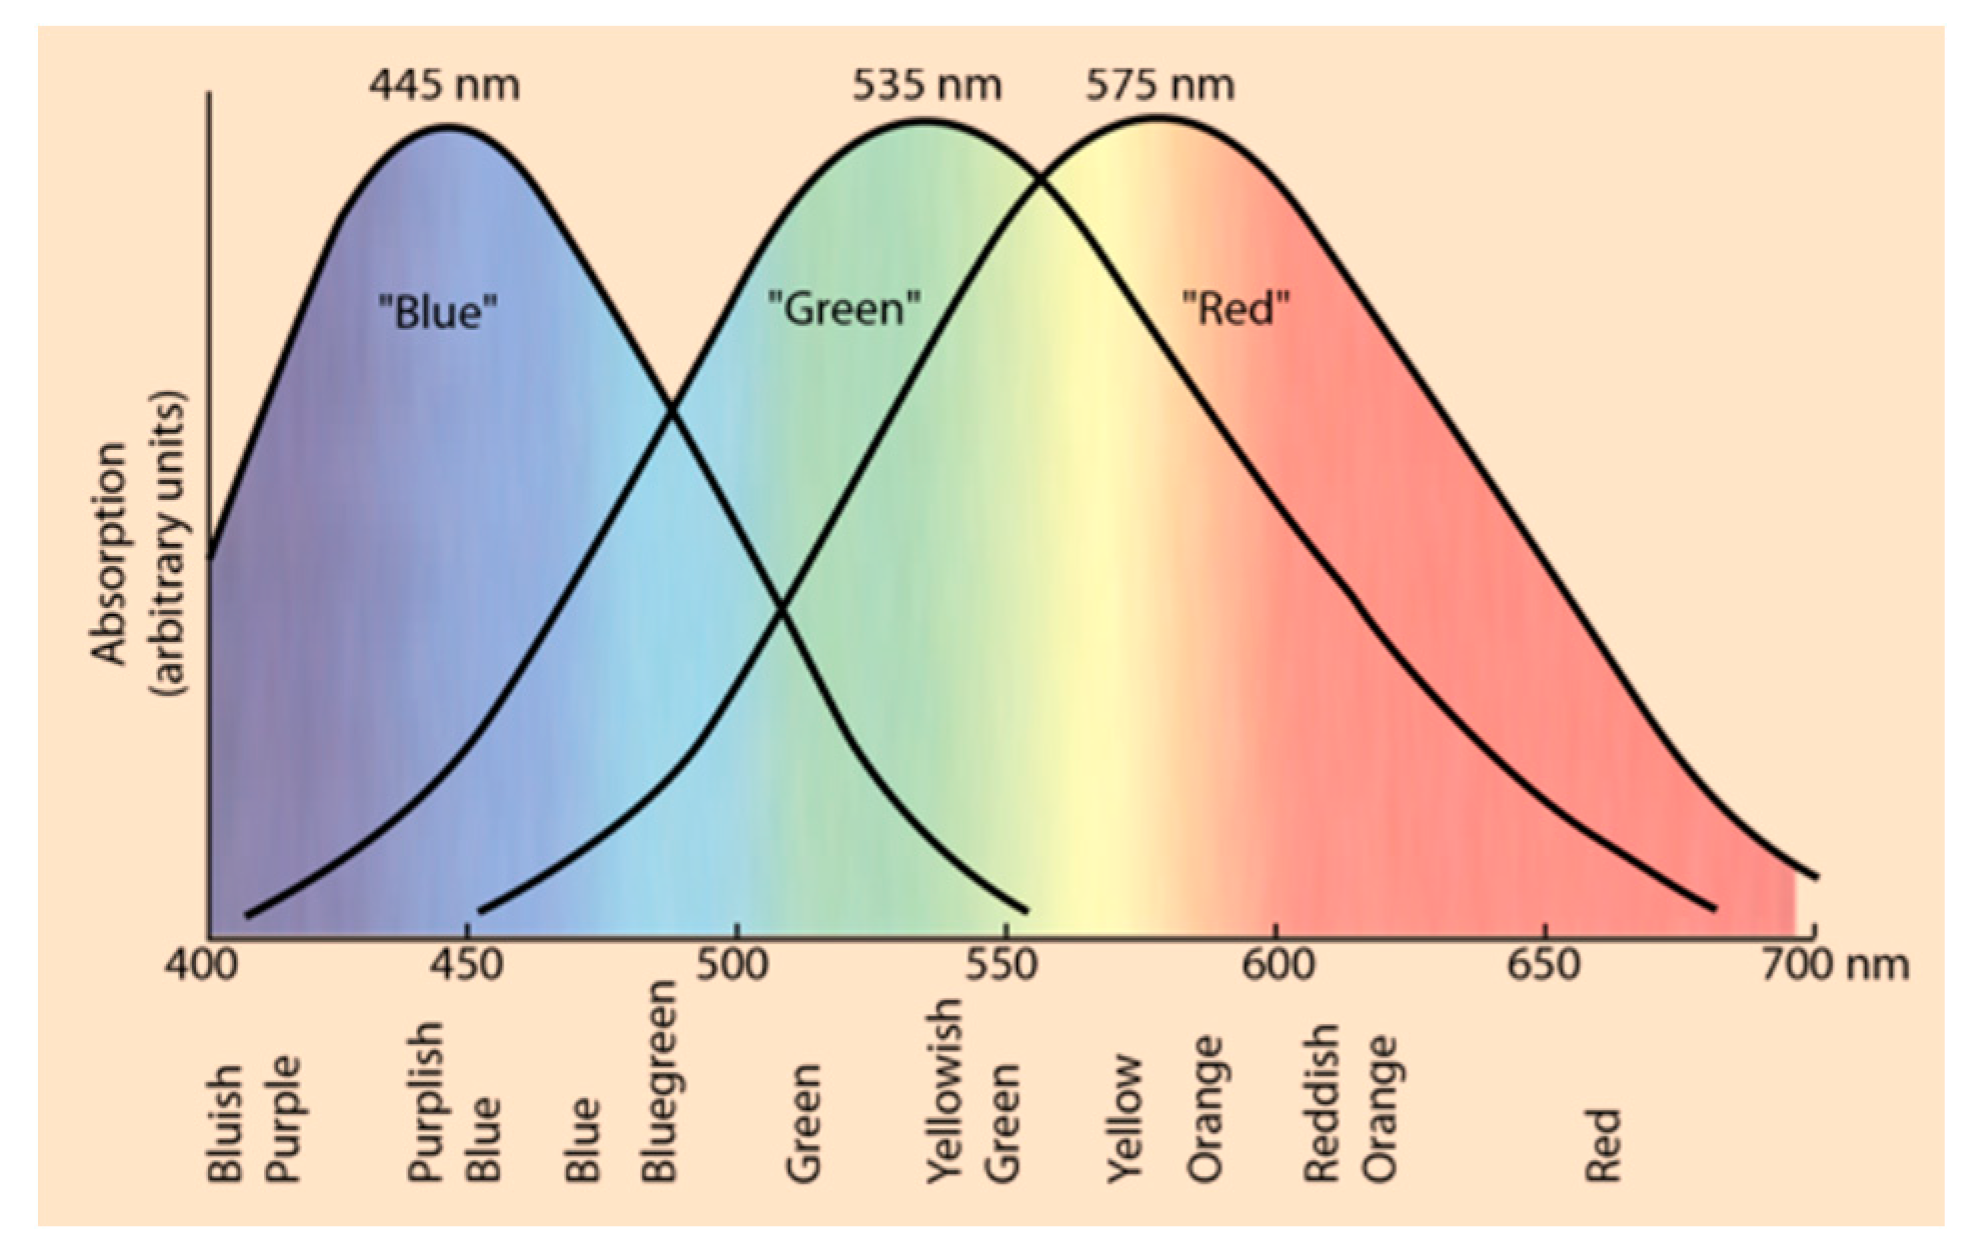
2. Neurophysiological Basis of Color Vision

As Newton said, “the rays are not colored” [23]. This leads to the understanding that the perception of colors occurs due to complex neurons that undergo computations. The human eye’s retina comprises specialized cells referred to as cone photoreceptors, as shown in Figure 1 [24]. These cells are responsible for color vision. The cone photoreceptors perceive different colors by detecting light wavelengths. While there are many colors, the human retina cannot accommodate a specific photoreceptor for each one. Essentially, there are three types of cones, each sensitive to a specific part of the visible spectrum, as shown in Figure 2. The first type is the S-cone, which is sensitive to short wavelengths; the second type is the M-cone, which is sensitive to middle wavelengths; and the third type is the L-cone, which is sensitive to long wavelengths [25]. The three cones have overlapping sensitivity ranges, necessitating different cortical and retinal computations to perceive a specific color by considering not only the wavelength but also the intensity [26]. Another important factor in cortical computations includes the spatial characteristics of color [27]. All these computations result in the accurate processing of color information. This can help explain why measuring brain signals can provide meaningful insights related to color perception. The mechanism of color vision begins when the cones absorb the light that enters the eye. The brain processes the signals transmitted by the optic nerve and subsequently decodes this information, enabling us to see various hues [25]. Moreover, brain decoding involves, for example, a comparison of two overlapping photoreceptors, depending on the perceived color, to enable the perception of specific colors [26].
Individuals with CVD struggle to perceive red, green, and blue hues due to the lack or abnormalities of the cone cells in the eye [13]. Consequently, this results in the retina’s incapacity to adequately respond to various light wavelengths [2], leading to a failure to properly transmit the signals to the brain, which results in an incorrect perception of the visual information. The causes of CVD can be genetic or acquired. Genetic etiologies are linked to the transmission of the X-linked chromosome, whereas acquired etiologies are correlated with chronic illnesses such as diabetes, sickle cell anemia [28], or ocular diseases like cataracts and glaucoma [29,30,31]. Other conditions such as Parkinson’s disease or Alzheimer’s disease could also lead to CVD [32,33]. Some studies have revealed that even psychological conditions like schizophrenia could affect color vision [34]. Additionally, environmental factors unrelated to health conditions, such as exposure to chemical toxins, can also cause CVD [35,36,37].
There are different types of CVD, each depending on the affected cone cell in the eye, as illustrated in Table 1. If one cone is abnormal, anomalous trichromacy occurs. Three types of anomalous trichromacies are distinguished by the affected cone cell. Protanomaly occurs when the L-cone is abnormal, deuteranomaly occurs when the M-cone is abnormal, and tritanomaly occurs when the S-cone is abnormal [13,38]. Moreover, if a person lacks one cone, meaning they have only two cones, dichromacy occurs, resulting in a total absence of a specific color. There are three types of dichromacy: protanopia, deuteranopia, and tritanopia. Each type is related to the absent cone, which is the L-cone, M-cone, and S-cone, respectively [13,39]. The most common and widespread type of CVD is red–green CVD. This type encompasses protanomaly, deuteranomaly, protanopia, and deuteranopia [40,41].
Table 1. Color vision deficiency types.
CVD TypeCause
Anomalous trichromacyProtanomalyAbnormal L-cone
DeuteranomalyAbnormal M-cone
TritanomalyAbnormal S-cone
DichromacyProtanopiaMissing L-cone
DeuteranopiaMissing M-cone
TritanopiaMissing S-cone
Figure 1. Photoreceptor cells in the human retina. Note that the rod cell is responsible for light sensitivity, enabling better vision in low-light conditions [42,43,44].
Applsci 14 07579 g001
Figure 2. A representation of visible light colors with their corresponding wavelengths, overlaid with the normalized responsivities of the three distinct cone cells in the human eye’s retina [45]. The figure illustrates the sensitivity of S-cones to short wavelengths, depicted in blue; M-cones to middle wavelengths, depicted in green; and L-cones to long wavelengths, depicted in red, highlighting the overlapping ranges of these cone cells in color perception.
Applsci 14 07579 g002

3. EEG as a Diagnostic Tool

The EEG, an electrophysiological technique for recording the brain’s electrical activity, was pioneered in 1924 [46]. The primary source of the EEG is the cortical pyramidal neurons in the cerebral cortex that are aligned with the brain’s surface [47]. It is believed that the neural activity observed through the EEG results from the combined impact of both excitatory and inhibitory postsynaptic potentials generated by groups of neurons firing in a synchronized manner [48].
It has been proven that EEG is a significant diagnostic method for non-invasive studies on neurological disorders [49,50]. It is an efficient method for identifying neurological disorder biomarkers, leading to valuable insights into the disorder. For example, the slowing of EEG rhythms can indicate an abnormality in brain function, suggesting an abnormal condition in the individual [51].
To use EEG as a diagnostic tool, it is crucial to analyze the signals and relate the changes to the specific condition [52]. However, there are some limitations associated with using EEG as a diagnostic tool. One limitation is that EEG measures the brain’s activity on the scalp and not directly from the brain, which in turn affects the spatial resolution [53,54]. This makes it challenging to identify a specific brain region involved in a specific disorder. Also, EEG data involve complex analysis, making it important for the data to be analyzed by an expert [55]. Other limitations include factors affecting the EEG recording, such as eye movements and muscle activity, which introduce noise into the signal and affect the accuracy [56,57,58].
Since CVD contributes to altering the EEG signals, these changes could be used to detect biomarkers to diagnose CVD. Studies have shown that EEG is highly affected by color perception, indicating that it could be used to detect CVD [59]. For example, in [60], it was found that the oscillation of EEG signals has varying latencies when exposed to different colors. Specifically, the oscillation of green occurs earlier than that of red or blue. Understanding this could suggest that when a person with CVD perceives the color green, no oscillation might be expected, as seen in individuals with normal vision.
The neurological pathway of color vision is depicted in Figure 3, where the eye absorbs the wavelength of a specific color (e.g., in this figure, green). The specific photoreceptors send this information to the optic nerve, which carries it to the visual cortex in the brain for further processing and interpretation of the color. This process causes specific alterations in EEG signals, enabling the investigation of color perception using EEG signals and BCI techniques.

4. Comparing Conventional and EEG-Based Methods for Diagnosing CVD

The value of EEG-based methods in diagnosing CVD can be seen when comparing them to conventional assessments. Firstly, conventional assessments require a behavioral response, limiting the pool of individuals who can undergo the assessment. For example, in the Ishihara test, individuals must verbally respond to or point out a specific direction containing the intended number, or in the anomaloscope test, active participation and movements are necessary. Secondly, because conventional tests rely on behavioral responses, they are subjective. When individuals being tested must verbally participate, their responses may be influenced by various factors related to individual perception, situation, and experience, making the assessments subjective and somewhat inaccurate. Thirdly, extensive training is required for some conventional tests, such as the anomaloscope. Individuals need clear steps to follow and precise instructions to perform the test accurately. This can pose challenges, especially when dealing with individuals who may find it difficult to comprehend complex instructions, such as children. Fourthly, conventional assessments can be manipulated. For instance, individuals might memorize the arrangements of the Ishihara plates before the test, compromising the credibility of the results [62]. However, the most notable advantage of conventional methods is their speed, as they can be completed in a few minutes.
In contrast, EEG-based methods rely on brain responses and do not necessitate behavioral interactions, making them a suitable option for individuals with disabilities or communication challenges, including those with neurological disorders, speech impairments, and hearing impairments. Additionally, EEG-based methods are objective as they depend on EEG signals rather than subjective interpretations of individual responses. Analyzing EEG signals can objectively determine how the brain reacts to different colors. Moreover, unlike conventional methods that may require training, EEG-based methods are easier to use, involving only sensor fixation to measure the required signals along with simple instructions like “focus here”, making them easily understandable for all individuals, including children. Furthermore, unlike conventional assessments, EEG-based methods cannot be manipulated, as individuals cannot control their EEG signals. However, these methods are not as fast and require more time to conduct compared to conventional tests. Despite the time requirement, the numerous advantages of EEG-based methods give them an edge over conventional methods. Table 2 summarizes the key differences between conventional CVD diagnostic tests and EEG-based methods.

5. EEG-Based Approaches for Diagnosing CVD

The selection of an EEG-based BCI design generally depends on the chosen paradigm. Currently, popular approaches in the field include Motor Imagery (MI), Event-Related Potential (ERP), and Steady-State Visually Evoked Potential (SSVEP) [63]. Although SSVEP belongs to ERP, it is often treated as a distinct category due to its unique characteristics and applications in most studies [63,64,65,66,67]. In the field of CVD, SSVEP has been utilized in several studies. SSVEP is considered a constant, regular response to a repeated visual stimulus [68]. This technology enables users to select from multiple commands by focusing on visual stimuli, displaying a steady response that occurs when individuals are exposed to repetitive visual stimuli [68]. Other reasons that make SSVEP a good choice in such studies include its high signal-to-noise ratio (SNR) and low artifacts [69]. Although many studies have discussed using SSVEP in the BCI field, most have focused on signal processing techniques to improve BCI performance without considering that parameters such as shape and color significantly affect SSVEP [70]. This highlights the importance of considering the properties of the stimulus in future studies. Before 2020, there had been no significant advancements in using SSVEP to diagnose CVD. This is a new development that deserves researchers’ attention to improve the healthcare field. Table 3 provides a detailed summary of the existing studies that have utilized EEG signals for diagnosing CVD.

5.1. ERP Approaches for Diagnosing CVD

Despite SSVEP being considered a viable option for diagnosing CVD by various studies, other approaches, such as ERP, have also been employed in this field. However, ERP has rarely been utilized for diagnostic purposes in this domain; rather, it typically explores the relationship between brain activity and color perception.
An example of a study conducted for diagnostic purposes is the study by Bieber et al. [71], where they used silent substitution to measure visually evoked potentials (VEPs) in infants to detect CVD. ERP, which includes VEPs, is defined as a transient response to specific stimuli [72]. Silent substitution is a technique that stimulates a specific cone cell in the retina by using metamers, which are pairs of lights, while minimizing the response from other types of cones. It depends on adjusting the intensities of different wavelengths of light to stimulate the desired cone type [73]. They analyzed the effects of the stimuli on the EEG signal using a vector voltmeter, where the results showed response differences between healthy and color-deficient infants. This was the only study that utilized silent substitution for diagnosis; however, only infants participated as subjects, with adults included for comparison purposes. The studies then demonstrated that human retina photoreceptors continue to change with age [74,75], indicating that adult retinas cannot be directly compared with those of infants.
Moreover, Thomas et al. [76] developed a portable embedded device using Python and BeagleBoard to analyze the effects of CVD on EEG signals. Like the previously mentioned studies, they used color stimuli with the three basic colors (red, green, and blue) while recording the EEG. They then calculated the deviation in the energy, observing more deviation in the particular color associated with CVD in the person. Their results are based on only two subjects, suggesting that further testing may be necessary to ensure more reliable results.
Regarding the relationship between color perception and brain activity by analyzing EEG signals while using color stimuli, Thomas and Umamaheswari [77], along with other studies [78,79], investigated this by different methods. In [77], the subjects were asked to identify the matching colors of the test color from a set of shades of the basic colors (red, green, and blue) while their EEG signals were being recorded. They then calculated the energy of each EEG signal. In [78], the subjects were shown a few colors of the VIBGYOR spectrum, with a neutral grey background separating each color, and their EEG signals were recorded from several locations in the brain. The researchers then analyzed the spectral width of each EEG signal. Meanwhile, in [79], the subjects were shown a stimulus set consisting of different shapes with different colors (red, green, and blue) on the computer screen, and their EEGs were recorded. Then, the conventional band power values were obtained. Although these methods of stimulation and analysis have demonstrated differences in EEG responses to different colors, none of the three studies conducted the experiment on subjects with CVD, leaving it uncertain whether the results could be generalized to both individuals with normal vision and those with CVD. Additionally, in [77], only three subjects were involved in the study, which is considered insufficient to draw a conclusion. Another issue is that the age range in [77,79] is too restricted, potentially introducing biases in the results.
Another study [80] estimated the power spectral density (PSD) of EEG signals recorded while presenting stimuli of different colors to the subjects, including red, green, yellow, and blue. The study found that the PSD differed for each color, with the classification rate being highest for red and lowest for yellow. This finding could have a significant impact on diagnosing CVD using ERP. However, the study did not attempt to apply this finding for diagnostic purposes, suggesting that additional improvements may be necessary to effectively diagnose CVD.
Furthermore, some studies have utilized Ishihara plates as stimulation procedures instead of the color stimuli employed in the studies discussed previously. For example, Wicaksono et al. [81] used ERPs extracted from EEG signals acquired during Ishihara visual stimulus. They analyzed the signals using various methods, including Global Field Power (GFP), ERP Component Analysis, and Brain Topography Analysis. They found that the amplitude of the wave associated with the number that the individual cannot detect did not appear clearly, as if no visual process had occurred. Similar to some previously discussed studies, their participants were within a limited age range. Similarly, Ekhlasi et al. [82] used 38 plates of the Ishihara test to evaluate the EEG and determine which Ishihara plates yielded the best results in detecting CVD. They analyzed the signals using false discovery rate (FDR) correction and classified them using the K-nearest neighbor (KNN) classifier. They found that the best electrodes showing differences between CVD and healthy individuals were observed in P4, T6, and O2 in certain frequency bands. It is worth noting that only men participated in this study; therefore, the results might not be representative of both genders, potentially introducing biases. The similarity between the studies using Ishihara plates remains in the fact that both have found significant differences in ERP components in the occipital and parietal regions between subjects with normal vision and those with CVD.

5.2. SSVEP Approaches for Diagnosing CVD

In the field of using SSVEP to diagnose CVD, as mentioned earlier, there were no published studies regarding this before 2020, although it has been known for many years that SSVEP is affected by different colors. Xavier et al. studied the effects of some colors, including red, green, blue, white, and gray, on SSVEPs at three different frequencies (5, 12, 30 Hz) [83]. They investigated the frequency amplitudes using canonical correlation analysis (CCA). They concluded that each color generates a different amplitude and phase. The white and red colors produce the largest amplitude. They also found that the best SNR is achieved by using mid-range frequencies, such as 12 Hz. Their study was not intended for diagnostic purposes; however, their findings could be extremely helpful in designing methodologies for diagnosing CVD. Another study also concluded that the red color has the most accurate discrimination among other colors; this finding could be very useful in diagnosing CVD [84]. However, the studies stated that using white is preferable to using red to mitigate the risk associated with the red color, such as inducing epileptic seizures [83]. Also, it was concluded in [70] that colors with high wavelengths, such as red, generate higher SSVEP amplitudes compared to colors with lower wavelengths, such as blue. Generally, many researchers have studied color effects on SSVEPs but have rarely used this finding to diagnose CVD.
For the studies that have employed SSVEP for diagnostic purposes, Zheng et al. used a method that relies on sweep SSVEP to diagnose CVD [85]. They utilized a stimulus paradigm consisting of a red–green reversal checkerboard with different luminance ratios to elicit the SSVEPs. They then analyzed the signals using CCA and established a method to determine the type and severity of CVD using an equiluminance turning curve. They considered the equiluminance point to occur when the two colors appear to have the same luminance. Since their study used sweep SSVEP, which covers a broad frequency range for stimulation, this added some complexity and time-consuming aspects to their method as they needed to sweep through multiple frequencies [86]. Overall, the broader frequency range may introduce more variability and potential confounding effects in the neural responses.
Nonetheless, Norton et al. investigated CVD detection using SSVEP, rather than sweep SSVEP, based on a novel method for identifying metamers called “metalD” [87]. This method involves adjusting two light sources that have the same color appearance but differ in spectral distributions to be the same. They hypothesized that the metamer is identified by minimizing the SSVEP caused by the two flickering light sources and found that people with normal color vision have an SSVEP that is close to zero, while people with CVD do not. As they mentioned, EEG measurements are often noisy, and the excessive use of filters can potentially impact the data, leading to decreased accuracy. Thus, Habibzadeh et al. [88] tried to improve on what was done in [87] by using Gaussian process regression to reduce the noise of the measurements, enhancing the performance of the method. Nevertheless, EEG measurements are easily affected by external factors, leaving room for continuous improvement in measurement accuracy and noise reduction.
In SSVEP approaches, the stimulation frequency varies in each study. For example, in [83], the stimulation frequencies were 5, 12, and 30 Hz, while in [85], the stimulation frequency was 15 Hz, and in [87], the stimulation frequency was 10 Hz. However, the effects of the stimulation frequency were investigated by E. Atkins et al. [89]. They considered the frequency range of 2–38 Hz and observed that hue stimulation led to eliciting larger SSVEPs at lower frequencies, while illuminance stimulation led to eliciting smaller SSVEPs at lower frequencies. They also found that the best frequency for CVD assessment is 16 Hz. Their results indicate that CVD assessment based on SSVEPs could be improved by optimizing the stimulation frequency.
Table 3. Summary of existing studies utilizing EEG signals for diagnosing CVD.
ReferenceYearMethod/AnalysisChannelsExtracted FeaturesFindings
[71]-Silent substitution, vector voltmeterOz, O1, O2AmplitudeDifferences in EEG were observed between color-deficient and healthy infants.
[77]2016Color stimulus, principal component analysis (PCA)Cz, O1, Oz, O2
(10–20 international system)
EnergyHigher EEG energy for correct color choices compared with incorrect choices.
[78]2021Color stimulus, multifractal detrended fluctuation analysis (MFDFA) and multi-fractal detrended cross-correlation analysis (MFDXA)F3, F4, F7, F8, Fz, P3, P4, O1, O2Spectral widthThe complexity of the EEG varies across different perceived colors.
[79]2021Color stimulus, Fourier transform, Quadratic
discriminant analysis, SVM, and KNN classifiers
63 different channelsConventional band power, inverse solution of EEG wavesDifferent electrodes showed a significant impact of different colors.
[80]2016Color stimulus, interval-Type II fuzzy classifierF3, F4, Fz, P3, Pz, P4, O1, O2, T7, T8PSDDifferent PSD for each color with the highest classification rate observed for red and the lowest for yellow.
[76]2017Color stimulus, Python, BeagleBoardCz, O1, Oz, O2Energy, entropyThere is more deviation in the energy of color-deficient people compared to healthy people.
[81]2020Ishihara plates stimulus, GPF, Brain
Topography and
ERP Analysis
Fp1, Fp2, F3, Fz, F4, C3, Cz, C4, P7, P3, Pz, P4, P8, O1, Oz, O2
(10–20 international system)
Amplitude, latencyVariations in latency and amplitudes between healthy and color-deficient people.
[82]2021Ishihara plates stimulus, FDR correction, KNN classifierFp1, Fp2, F3, F4, C3, C4, P3, P4, O1, O2, F7, F8, T3, T4, T5, T6, Fz, Cz, Pz
(10–20 international system)
FrequencyPeople with CVD have different values for the frequency bands compared to individuals with normal color vision, and the best results showing differences were observed for the electrodes P4, T6, and O2.
[85]2021Sweep SSVEP, CCA, color vision severity index (ICVD)PO3, PO4, POz, O1,
O2, and Oz
(10–20 international system)
Amplitude, frequencyThe type and severity of CVD can be determined by ICVD.
[87]2021SSVEP, Metamer Identification Algorithm (metalD), CCAF3, Fz, F4, T7, C3, CZ, C4, T8, CP3, CP4, P3, Pz, P4, PO7, PO8, Oz
(10–10 international system)
FrequencyPeople with normal color vision have an SSVEP that is close to zero, while people with CVD do not.
[88]2022SSVEP, Gaussian process regression
(metalD+)
O1, Oz, O2, PO7, PO3, POz,
PO4, PO8, P5, P3, P1, Pz, P2, P4, P6, CPz
FrequencyThis method can improve the measurement and reduce noise compared to the metalD method.
[89]2023SSVEP, CCAO1, Oz, O2, PO7, PO3,
POz, PO4, PO8, P5, P3, P1, Pz, P2, P4, P6, CPz
AmplitudeCVD assessment efficiency depends on the visual stimulation frequency.
Generally, based on the studies reviewed earlier, no study had a sufficient sample size, as most did not exceed ten subjects, even though a substantial amount of EEG data is preferred for efficient training of machine learning models. This highlights that the sample sizes in most previous studies were not adequate to draw definitive conclusions. Additionally, potential biases in some previous studies could impact certain conclusions, such as studies that only included male subjects or did not test the method on individuals with CVD. Furthermore, many studies had limited variability in the target age groups, raising questions about whether their methods would yield consistent results across different age ranges.
In summary, the field of using EEG signals to diagnose CVD is relatively new, with many areas of ambiguity that need further study and discussion, including limitations related to sample sizes, potential biases, and methodological constraints.

5.3. Pros and Cons of Both Techniques

Each technique employed in diagnosing CVD using EEG signals, including ERP and SSVEP, has distinct advantages and limitations. The pros and cons of both ERP and SSVEP techniques are summarized in Table 4. Understanding these factors is crucial in selecting the most appropriate approach to achieve the desired goals. The primary disparity between the two techniques lies in their operational principles: ERPs are considered responses to individual stimuli, whereas SSVEPs are viewed as cumulative responses to flickering stimulation over an entire period of stimulation [64].
Regarding the pros and cons of each technique, ERPs excel in measuring scalp EEG, with reported accuracies ranging from 85% to 95% [90]. Additionally, subjects may find the recording process more comfortable due to the absence of flickering stimulation, which can sometimes be bothersome during EEG recordings.
Conversely, SSVEPs offer reliable performance in measuring scalp EEG, with reported accuracies between 80% and 95% [90], slightly inferior to ERP techniques. Moreover, SSVEPs typically exhibit a higher SNR compared to ERPs. This superiority in SNR can be attributed to SSVEPs being less susceptible to ocular artifacts and other noise, such as electromyographic interference. Other advantages of SSVEP include rapid recording capabilities, precise quantification of specific responses, and unbiased identification [64]. Despite its advantages in SNR and noise resilience, SSVEP may induce discomfort in some subjects due to the flickering stimulation used. Furthermore, the flickering stimulation may impose limitations on certain individuals, such as those with epilepsy, who should avoid exposure to such stimuli during recordings [83].

6. Data Analysis and Interpretation

Previous studies have revealed that EEG features undergo changes based on different colors, such as alterations in frequency band values or signal complexity. These changes can serve as significant biomarkers for detecting CVD. The main steps utilized to classify EEG signals for CVD diagnosis comprise data collection, data pre-processing, feature extraction, feature selection, and classification, as shown in Figure 4 [91].
The first step, data collection, involves recording the EEG data of multiple subjects under different circumstances. The second step, data pre-processing, involves isolating the noise that usually accompanies EEG data, such as eye movements. The third step, feature extraction, involves extracting specific features, such as the frequency domain, from the EEG signal. The fourth step, feature selection, involves selecting relevant features to minimize dimensionality. The final step, classification, involves training on the chosen features to classify the EEG signals into the normal and CVD classes.
Although the details of the steps may vary and are not always unified in published studies, the typical approach includes spatial and spectral filtering of the data. Besides using filters such as the band-pass filter (BPF), low-pass filter (LPF), and high-pass filter (HPF) to eliminate environmental noise, and the notch filter to eliminate power line interference, other techniques have been employed to remove artifacts, such as eye blinking. These techniques include signal space projection (SSP), used in [81], and principal component analysis (PCA), used in [77,81]. The filtering parameters vary in every study, as illustrated in Table 5. Note that the filtering parameters all depend on the procedures used in the study.
Various analysis techniques are used in diagnosing CVD using EEG signals. These techniques include CCA and PCA, which have been widely utilized in previous research. The CCA technique has been extensively employed in the examination of SSVEPs in previous studies [85,86,87,88,89]. It is commonly used to describe the correlations among SSVEP signals from multiple channels and to measure the size of SSVEP in each trial, enabling the extraction of its features [92]. While CCA is used to identify correlated patterns between two sets, PCA focuses on capturing the overall variance within a single set [77,81]. When dimensionality reduction is required, PCA is typically preferred over CCA [93]. However, both techniques can be employed for feature extraction. Moreover, to differentiate between healthy and color-deficient individuals, frequency features are usually used. After recording the EEG signal, frequency analysis, such as Fourier transform or fast Fourier transform (FFT), is applied to identify the presence of frequency components corresponding to the stimuli [77].
Using machine learning algorithms makes it possible to automatically extract meaningful patterns and features from EEG signals, aiding in the classification process as they can handle the complex nature of EEG data [94]. For example, the SVM algorithm has been used in [79] as it aims to find a hyperplane that separates data points of different classes with the largest margin [95]. It is capable of capturing complex relationships and making accurate predictions. Another classifier, such as the KNN classifier, has been employed in some studies [79,82] as it is simple, does not require explicit model training, and can handle both numerical and categorical features [96]. Overall, most studies, such as [77,80,87], have used MATLAB for analysis and classification purposes.

7. Clinical Applications and Challenges

Although some papers have studied CVD detection using EEG signals, there has not been much improvement in this area. There are many challenges and areas for improvement that need to be considered in the future work in this field. Firstly, there is the data challenge. A significant amount of data is required for training to construct a good model. The unavailability of public datasets makes it important to have a large number of subjects in studies to construct a new dataset and obtain reliable results. Also, there is the emotions challenge, as EEG signals can be affected by emotions. Therefore, it is important to consider the individuals’ emotional states when gathering data. Moreover, there is the demographic challenge. Demographic factors such as age, gender, and race may affect the EEG signals, so it is important to incorporate these factors in the analysis, which will require a lot of time and effort. Another challenge is the ethical challenge, which includes obtaining permission from specific authorities and ensuring the willingness of the subjects involved in the study [91]. Finally, there is the standardization challenge [97]. Many factors could affect EEG signal acquisition and analysis, such as electrode placement, signal processing techniques, and analysis methodologies. All of these factors make it difficult to standardize the procedures across different studies and research groups, while it is crucial for ensuring the consistency and comparability of results.
Despite these challenges, using EEG signals to detect CVD can overcome many limitations of the conventional diagnostic approaches. The behavioral response, which is considered a limitation as it relies on communication and excludes individuals with communication disabilities, can be overcome with the new method that relies on the brain’s response, eliminating the need for direct communication with the individual. Additionally, the subjective characteristics associated with conventional methods, which can be influenced by individual factors, can be overcome with the new objective method. The objective nature of the new method ensures that it remains unaffected by the individual’s situation as it is based on observable data. Another advantage is that the new method does not require training, especially when compared to the anomaloscope, making it easier to use. Finally, while the conventional methods can be easily manipulated, it is impossible to control one’s brain signals. This inability to manipulate brain signals enhances the accuracy and reliability of CVD diagnostic methods. Overall, the advantages and problems that can be eliminated by the new method outweigh the disadvantages or challenges that may be encountered.

8. Future Directions and Research Perspectives

In addition to the challenges mentioned earlier, the field of using EEG signals to diagnose CVD is relatively new and lacks established procedures. This highlights the importance and necessity of further research and improvements. Certain issues were not covered in earlier studies in this field; thus, future studies must address these issues. According to [98,99], EEG data are highly affected by factors such as emotions and age; thus, it is important to consider this while recording EEG data in upcoming studies. Another factor that may affect the EEG data, which has not been mentioned in the reviewed studies, is the screen brightness during data recording. This factor can influence EEG signals, as evidenced in [100], where an increase in screen brightness resulted in amplified responses, particularly in the areas most affected by visual stimulation, which are the parietal and occipital regions [101,102,103].
Moreover, several aspects could be improved, including those discussed earlier concerning sample sizes, potential biases, and methodological constraints. It is well recognized that in EEG experiments, large datasets of EEG data should be utilized to achieve the best results; however, it is challenging to recruit a large number of suitable subjects due to the discomfort some volunteers may experience during certain procedures. This underscores the importance of simplifying EEG recording procedures in a manner that maintains the integrity of the study’s objectives. This approach would enable researchers to address two limitations: the issue of the small sample sizes encountered in the previous studies and the methodological constraints. Moreover, while many studies have identified various ways to distinguish EEG responses to different colors, most have not utilized these methods for diagnostic purposes. Future studies could leverage and refine these methods to develop precise CVD diagnostic techniques, aiding individuals unable to undergo conventional tests and enhancing the reliability of diagnostic methods even for those who can undergo traditional testing.

9. Conclusions

In conclusion, the available color vision assessments exhibit significant limitations, necessitating the exploration of alternative methods. Recent studies have demonstrated the potential of EEG signals in diagnosing CVD by observing their response to different colors. This finding holds significant implications for utilizing EEG signals and employing machine learning algorithms to classify and diagnose CVD non-invasively. The non-invasive use of EEG in the diagnosis of CVD opens up new avenues for research and clinical implementation. By leveraging the distinctive changes in SSVEP responses to different colors, EEG-based approaches offer promising prospects in accurately identifying and classifying color vision deficiencies. Nonetheless, it is crucial to acknowledge that there are challenges in this field that need to be addressed in future research. These challenges include refining methodologies and protocols for capturing and analyzing EEG signals, enhancing the accuracy and reliability of diagnostic algorithms, and overcoming the limitations associated with user interfaces and usability. More research is also needed to develop standard operating protocols, confirm the reliability of EEG-based CVD diagnosis in various populations, and investigate possible clinical applications.
Future research efforts should concentrate on overcoming the identified problems and knowledge gaps in light of these findings and their implications. The development of EEG-based CVD diagnosis depends critically on cooperation between researchers, physicians, biomedical engineers, and technology creators. By doing this, we can work to increase diagnostic precision, broaden access to valid evaluations, and eventually raise the standard of care for individuals with color vision problems.

Author Contributions

Conceptualization, G.N.A. and S.I.A.; methodology, G.N.A. and S.I.A.; software, G.N.A.; validation, G.N.A. and S.I.A.; formal analysis, G.N.A.; investigation, G.N.A.; resources, G.N.A. and S.I.A.; data curation, G.N.A.; writing—original draft preparation, G.N.A.; writing—review and editing, G.N.A. and S.I.A.; visualization, G.N.A.; supervision, S.I.A.; project administration, S.I.A. All authors have read and agreed to the published version of the manuscript.

Funding

This research received no external funding.

Data Availability Statement

Not applicable.

Conflicts of Interest

The authors declare no conflicts of interest.

References

  1. Woldeamanuel, G.G.; Geta, T.G. Prevalence of Color Vision Deficiency Among School Children in Wolkite, Southern Ethiopia. BMC Res. Notes 2018, 11, 838. [Google Scholar] [CrossRef] [PubMed]
  2. Alamoudi, N.B.; AlShammari, R.Z.; AlOmar, R.S.; AlShamlan, N.A.; Alqahtani, A.A.; AlAmer, N.A. Prevalence of Color Vision Deficiency in Medical Students at a Saudi University. J. Fam. Community Med. 2021, 28, 196–201. [Google Scholar] [CrossRef]
  3. Manda, A. Color Blindness Prevalence. Available online: https://www.news-medical.net/health/Color-Blindness-Prevalence.aspx (accessed on 10 August 2024).
  4. National Eye Institute. Causes of Color Vision Deficiency. Available online: https://www.nei.nih.gov/learn-about-eye-health/eye-conditions-and-diseases/color-blindness/causes-color-vision-deficiency (accessed on 23 June 2024).
  5. Birch, J. Worldwide Prevalence of Red-Green Color Deficiency. J. Opt. Soc. Am. A 2012, 29, 313–320. [Google Scholar] [CrossRef]
  6. Male, S.R.; Shamanna, B.R.; Gandhi, R.; Theagarayan, B. Global Prevalence of Color Vision Deficiency: A Systematic Review and Meta-Analysis. J. Vis. Impair. Blind. 2023, 64, 1508. [Google Scholar]
  7. Osuobeni, E.P. Prevalence of Congenital Red-Green Color Vision Defects in Arab Boys from Riyadh, Saudi Arabia. Ophthalmic Epidemiol. 1996, 3, 167–170. [Google Scholar] [CrossRef]
  8. Alabdelmoneam, M. Prevalence of Congenital Color Vision Defects in Saudi Females of Arab Origin. Optom. Vis. Sci. 2011, 88, 543–548. [Google Scholar] [CrossRef] [PubMed]
  9. Rajavi, Z.; Sabbaghi, H.; Baghini, A.S.; Yaseri, M.; Sheibani, K.; Norouzi, G. Prevalence of Color Vision Deficiency and Its Correlation with Amblyopia and Refractive Errors among Primary School Children. J. Ophthalmic Vis. Res. 2015, 10, 130–138. [Google Scholar] [CrossRef]
  10. Fareed, M.; Anwar, M.A.; Afzal, M. Prevalence and Gene Frequency of Color Vision Impairments among Children of Six Populations from North Indian Region. Genes Dis. 2015, 2, 211–218. [Google Scholar] [CrossRef]
  11. Fakorede, S.T.; Akpan, L.G.; Adekoya, K.O.; Oboh, B. Prevalence and Population Genetic Data of Colour Vision Deficiency among Students from Selected Tertiary Institutions in Lagos State, Nigeria. Egypt. J. Med. Hum. Genet. 2022, 23, 73. [Google Scholar] [CrossRef]
  12. Shah, A.; Hussain, R.; Fareed, M.; Afzal, M. Prevalence of Red-Green Color Vision Defects among Muslim Males and Females of Manipur, India. Iran. J. Public Health 2013, 42, 16–24. [Google Scholar]
  13. Chan, X.B.V.; Goh, S.M.S.; Tan, N.C. Subjects with Colour Vision Deficiency in the Community: What Do Primary Care Physicians Need to Know? Asia Pac. Fam. Med. 2014, 13, 10. [Google Scholar] [CrossRef]
  14. Osman, S.; Khalaf, S.; Mohammed, H.; El-Sebaity, D.; Osman, D. Prevalence and Predictors of Colour Vision Defects among Egyptian University Students. East. Mediterr. Health J. 2021, 27, 399–406. [Google Scholar] [CrossRef] [PubMed]
  15. Gordon, N. Colour Blindness. Public Health 1998, 112, 81–84. [Google Scholar] [CrossRef] [PubMed]
  16. Fanlo Zarazaga, A.; Gutiérrez Vásquez, J.; Pueyo Royo, V. Review of the Main Colour Vision Clinical Assessment Tests. Arch. Soc. Esp. Oftalmol. 2019, 94, 25–32. [Google Scholar] [CrossRef] [PubMed]
  17. Salvia, J.; Ysseldyke, J. An Analysis of the Reliability and Validity of the Ishihara Color Plates with Mentally Retarded Males. Percept. Mot. Ski. 1971, 33, 243–246. [Google Scholar] [CrossRef]
  18. Pandey, N.; Chandrakar, A.K.; Garg, M.L. Tests for Color Vision Deficiency: Is It Time to Revise the Standards? Indian J. Ophthalmol. 2015, 63, 752–753. [Google Scholar] [CrossRef]
  19. Das, J.M.; Anosike, K.; Asuncion, R.M.D. Locked-in Syndrome. In StatPearls; StatPearls Publishing: Treasure Island, FL, USA, 2024. Available online: http://www.ncbi.nlm.nih.gov/books/NBK559026/ (accessed on 10 August 2024).
  20. National Institute of Neurological Disorders and Stroke. Locked-in Syndrome. Available online: https://www.ninds.nih.gov/health-information/disorders/locked-syndrome (accessed on 11 August 2024).
  21. National Organization for Rare Disorders (NORD). Locked-in Syndrome—Symptoms, Causes, Treatment. Available online: https://rarediseases.org/rare-diseases/locked-in-syndrome/ (accessed on 9 August 2024).
  22. Nicolas-Alonso, L.F.; Gomez-Gil, J. Brain Computer Interfaces, a Review. Sensors 2012, 12, 1211–1279. [Google Scholar] [CrossRef]
  23. Newton, I.; Hemming, G.W. Opticks: Or, A Treatise of the Reflections, Refractions, Inflexions and Colours of Light; Also Two Treatises of the Species and Magnitude of Curvilinear Figures; Printed for Sam; Smith, S., Walford, B., Eds.; Burndy Library: London, UK, 1704; Available online: http://archive.org/details/optickstreatise00newta (accessed on 9 July 2024).
  24. Celesia, G.G. Chapter 13 Color Vision Deficiencies. In Handbook of Clinical Neurophysiology; Celesia, G.G., Ed.; Elsevier: Amsterdam, The Netherlands, 2005; Volume 5, pp. 251–269. [Google Scholar] [CrossRef]
  25. Thoreson, W.B.; Dacey, D.M. Diverse Cell Types, Circuits, and Mechanisms for Color Vision in the Vertebrate Retina. Physiol. Rev. 2019, 99, 1527–1573. [Google Scholar] [CrossRef]
  26. Conway, B.R. Color Vision, Cones, and Color-Coding in the Cortex. Neuroscientist 2009, 15, 274–290. [Google Scholar] [CrossRef]
  27. Werner, A. Spatial and Temporal Aspects of Chromatic Adaptation and Their Functional Significance for Colour Constancy. Vis. Res. 2014, 104, 80–89. [Google Scholar] [CrossRef]
  28. Balasundaram, R.; Reddy, S.C. Prevalence of Colour Vision Deficiency among Medical Students and Health Personnel. Malays. Fam. Physician 2006, 1, 52–53. [Google Scholar] [PubMed]
  29. Kagami, S.; Bradshaw, S.E.; Fukumoto, M.; Tsukui, I. Cataracts in Airline Pilots: Prevalence and Aeromedical Considerations in Japan. Aviat. Space Environ. Med. 2009, 80, 811–814. [Google Scholar] [CrossRef] [PubMed]
  30. Papaconstantinou, D.; Georgalas, I.; Kalantzis, G.; Karmiris, E.; Koutsandrea, C.; Diagourtas, A.; Ladas, I.; Georgopoulos, G. Acquired Color Vision and Visual Field Defects in Patients with Ocular Hypertension and Early Glaucoma. Clin. Ophthalmol. 2009, 3, 251–257. [Google Scholar]
  31. Jafarzadehpur, E.; Hashemi, H.; Emamian, M.H.; Khabazkhoob, M.; Mehravaran, S.; Shariati, M.; Fotouhi, A. Color Vision Deficiency in a Middle-Aged Population: The Shahroud Eye Study. Int. Ophthalmol. 2014, 34, 1067–1074. [Google Scholar] [CrossRef]
  32. Weil, R.S.; Schrag, A.E.; Warren, J.D.; Crutch, S.J.; Lees, A.J.; Morris, H.R. Visual Dysfunction in Parkinson’s Disease. Brain 2016, 139, 2827–2843. [Google Scholar] [CrossRef]
  33. Wang, R.; Wang, J.; Yu, H.; Wei, X.; Yang, C.; Deng, B. Power Spectral Density and Coherence Analysis of Alzheimer’s EEG. Cogn. Neurodyn. 2015, 9, 291–304. [Google Scholar] [CrossRef] [PubMed]
  34. Gupta, A.; Tran, J.; Fabiano, N.; Dhir, V.; Larose, K.; Lasker, I.; Wong, S.; Mohammad, I.Y.Z.; Le, S.; Shorr, R.; et al. Colour Vision Defects in Schizophrenia Spectrum Disorders: A Systematic Review. Neurosci. Appl. 2024, 3, 104046. [Google Scholar] [CrossRef]
  35. Ascaso, F.J.; Cruz, N.; Del Buey, M.A.; Cristóbal, J.A. An Unusual Case of Cocaine-Induced Maculopathy. Eur. J. Ophthalmol. 2009, 19, 880–882. [Google Scholar] [CrossRef]
  36. Salomão, S.R.; Watanabe, S.E.S.; Berezovsky, A.; Motono, M. Multifocal Electroretinography, Color Discrimination and Ocular Toxicity in Tamoxifen Use. Curr. Eye Res. 2007, 32, 345–352. [Google Scholar] [CrossRef]
  37. Gobba, F.; Cavalleri, A. Color Vision Impairment in Workers Exposed to Neurotoxic Chemicals. Neurotoxicology 2003, 24, 693–702. [Google Scholar] [CrossRef]
  38. Simunovic, M.P. Colour Vision Deficiency. Eye 2010, 24, 747–755. [Google Scholar] [CrossRef] [PubMed]
  39. Dohvoma, V.A.; Mvogo, S.R.E.; Kagmeni, G.; Emini, N.R.; Epee, E.; Mvogo, C.E. Color Vision Deficiency among Biomedical Students: A Cross-Sectional Study. Clin. Ophthalmol. 2018, 12, 1121–1124. [Google Scholar] [CrossRef] [PubMed]
  40. National Eye Institute. Types of Color Vision Deficiency. Available online: https://www.nei.nih.gov/learn-about-eye-health/eye-conditions-and-diseases/color-blindness/types-color-vision-deficiency (accessed on 17 July 2024).
  41. Klinke, T.; Hannak, W.; Böning, K.; Jakstat, H. A Comparative Study of the Sensitivity and Specificity of the Ishihara Test with Various Displays. Int. Dent. J. 2024, 74, 892–896. [Google Scholar] [CrossRef]
  42. Brain Stuff. How Is Color Vision Deficiency Different from Colorblindness? Available online: https://brainstuff.org/blog/how-is-color-vision-deficiency-different-from-colorblindness (accessed on 8 August 2024).
  43. American Academy of Ophthalmology. Rods. Available online: https://www.aao.org/eye-health/anatomy/rods (accessed on 12 August 2024).
  44. Neitz, M.; Neitz, J. Molecular Genetics of Color Vision and Color Vision Defects. Arch. Ophthalmol. 2000, 118, 691–700. [Google Scholar] [CrossRef]
  45. HyperPhysics. The Color-Sensitive Cones. Available online: http://hyperphysics.phy-astr.gsu.edu/hbase/vision/colcon.html (accessed on 3 July 2024).
  46. Tudor, M.; Tudor, L.; Tudor, K.I. Hans Berger (1873–1941)—The History of Electroencephalography. Acta Med. Croat. 2005, 59, 307–313. [Google Scholar]
  47. Kirschstein, T.; Köhling, R. What is the Source of the EEG? Clin. EEG Neurosci. 2009, 40, 146–149. [Google Scholar] [CrossRef]
  48. Britton, J.W.; Frey, L.C.; Hopp, J.L.; Korb, P.; Koubeissi, M.Z.; Lievens, W.E.; Pestana-Knight, E.M.; St Louis, E.K. Introduction. In Electroencephalography (EEG): An Introductory Text and Atlas of Normal and Abnormal Findings in Adults, Children, and Infants; American Epilepsy Society: Chicago, IL, USA, 2016. Available online: https://www.ncbi.nlm.nih.gov/books/NBK390346/ (accessed on 8 August 2024).
  49. Jadhav, C.; Kamble, P.; Mundewadi, S.; Jaiswal, N.; Mali, S.; Ranga, S.; Suvvari, T.K.; Rukadikar, A. Clinical Applications of EEG as an Excellent Tool for Event-Related Potentials in Psychiatric and Neurotic Disorders. Int. J. Physiol. Pathophysiol. Pharmacol. 2022, 14, 73–83. [Google Scholar]
  50. Gururangan, K.; Razavi, B.; Parvizi, J. Diagnostic Utility of Eight-Channel EEG for Detecting Generalized or Hemispheric Seizures and Rhythmic Periodic Patterns. Clin. Neurophysiol. Pract. 2018, 3, 65–73. [Google Scholar] [CrossRef]
  51. Britton, J.W.; Frey, L.C.; Hopp, J.L.; Korb, P.; Koubeissi, M.Z.; Lievens, W.E.; Pestana-Knight, E.M.; St Louis, E.K. The Abnormal EEG. In Electroencephalography (EEG): An Introductory Text and Atlas of Normal and Abnormal Findings in Adults, Children, and Infants; American Epilepsy Society: Chicago, IL, USA, 2016. Available online: https://www.ncbi.nlm.nih.gov/books/NBK390357/ (accessed on 4 May 2024).
  52. Hsiao, C.-L.; Chen, P.-Y.; Chen, I.-A.; Lin, S.-K. The Role of Routine Electroencephalography in the Diagnosis of Seizures in Medical Intensive Care Units. Diagnostics 2024, 14, 1111. [Google Scholar] [CrossRef]
  53. Ryynänen, O.; Hyttinen, J.; Malmivuo, J. Effect of Measurement Noise and Electrode Density on the Spatial Resolution of Cortical Potential Distribution with Different Resistivity Values for the Skull. Trans. Biomed. Eng. 2006, 53, 1851–1858. [Google Scholar] [CrossRef]
  54. Liu, X.; Makeyev, O.; Besio, W. Improved Spatial Resolution of Electroencephalogram Using Tripolar Concentric Ring Electrode Sensors. Electr. Comput. Biomed. Eng. Fac. Publ. 2020, 2020, 6269394. [Google Scholar] [CrossRef]
  55. Zhang, H.; Zhou, Q.-Q.; Chen, H.; Hu, X.-Q.; Li, W.-G.; Bai, Y.; Han, J.-X.; Wang, Y.; Liang, Z.-H.; Chen, D.; et al. The Applied Principles of EEG Analysis Methods in Neuroscience and Clinical Neurology. Mil. Med. Res. 2023, 10, 67. [Google Scholar] [CrossRef] [PubMed]
  56. Rosenow, F.; Klein, K.M.; Hamer, H.M. Non-Invasive EEG Evaluation in Epilepsy Diagnosis. Expert Rev. Neurother. 2015, 15, 425–444. [Google Scholar] [CrossRef]
  57. Lenartowicz, A.; Loo, S.K. Use of EEG to Diagnose ADHD. Curr. Psychiatry Rep. 2014, 16, 498. [Google Scholar] [CrossRef]
  58. de Aguiar Neto, F.S.; Rosa, J.L.G. Depression Biomarkers Using Non-Invasive EEG: A Review. Neurosci. Biobehav. Rev. 2019, 105, 83–93. [Google Scholar] [CrossRef]
  59. Teixeira, A.R.; Gomes, A. Analysis of Visual Patterns Through the EEG Signal: Color Study. In Proceedings of the Augmented Cognition: 17th International Conference, AC 2023, Held as Part of the 25th HCI International Conference, HCII 2023, Copenhagen, Denmark, 23–28 July 2023; pp. 46–53. [Google Scholar] [CrossRef]
  60. Khadir, A.; Maghareh, M.; Ghamsari, S.S.; Beigzadeh, B. Brain Activity Characteristics of RGB Stimulus: An EEG Study. Sci. Rep. 2023, 13, 18988. [Google Scholar] [CrossRef] [PubMed]
  61. Perkins School for the Blind. The Visual Pathway from the Eye to the Brain. Available online: https://www.perkins.org/the-visual-pathway-from-the-eye-to-the-brain/ (accessed on 10 May 2024).
  62. Plutino, A.; Armellin, L.; Mazzoni, A.; Marcucci, R.; Rizzi, A. Aging Variations in Ishihara Test Plates. Color Res. Appl. 2023, 48, 721–734. [Google Scholar] [CrossRef]
  63. Lee, M.-H.; Kwon, O.-Y.; Kim, Y.-J.; Kim, H.-K.; Lee, Y.-E.; Williamson, J.; Fazli, S.; Lee, S.-W. EEG Dataset and OpenBMI Toolbox for Three BCI Paradigms: An Investigation into BCI Illiteracy. GigaScience 2019, 8, giz002. [Google Scholar] [CrossRef]
  64. Kotlewska, I.; Wójcik, M.J.; Nowicka, M.M.; Marczak, K.; Nowicka, A. Present and Past Selves: A Steady-State Visual Evoked Potentials Approach to Self-Face Processing. Sci. Rep. 2017, 7, 16438. [Google Scholar] [CrossRef]
  65. Mun, S.; Park, M.-C.; Park, S.; Whang, M. SSVEP and ERP Measurement of Cognitive Fatigue Caused by Stereoscopic 3D. Neurosci. Lett. 2012, 525, 89–94. [Google Scholar] [CrossRef]
  66. Boylan, M.R.; Figueria, J.S.; Elhamiasl, M.; da Silva Andrade, I.; Barry-Anwar, R.; Keil, A.; Scott, L.S. Assessing the Reliability of ERP, SSVEP, and Oscillatory Data Methodology for Visual Paradigms in Infant EEG. J. Vis. 2023, 23, 4914. [Google Scholar] [CrossRef]
  67. Tai, P.; Ding, P.; Wang, F.; Gong, A.; Li, T.; Zhao, L.; Su, L.; Fu, Y. Brain-Computer Interface Paradigms and Neural Coding. Front. Neurosci. 2024, 17, 1345961. [Google Scholar] [CrossRef]
  68. Cao, T.; Wan, F.; Mak, P.U.; Mak, P.-I.; Vai, M.I.; Hu, Y. Flashing Color on the Performance of SSVEP-Based Brain-Computer Interfaces. In Proceedings of the 2012 Annual International Conference of the IEEE Engineering in Medicine and Biology Society, San Diego, CA, USA, 28 August 2012; pp. 1819–1822. [Google Scholar] [CrossRef]
  69. Albahri, A.S.; Al-Qaysi, Z.T.; Alzubaidi, L.; Alnoor, A.; Albahri, O.S.; Alamoodi, A.H.; Bakar, A.A. A Systematic Review of Using Deep Learning Technology in the Steady-State Visually Evoked Potential-Based Brain-Computer Interface Applications: Current Trends and Future Trust Methodology. Int. J. Telemed. Appl. 2023, 2023, 7741735. [Google Scholar] [CrossRef] [PubMed]
  70. Chu, L.; Fernandez-Vargas, J.; Kita, K.; Yu, W. Influence of Stimulus Color on Steady State Visual Evoked Potentials. Adv. Intell. Syst. Comput. 2017, 531, 499–509. [Google Scholar] [CrossRef]
  71. Bieber, M.L.; Knoblauch, K.; Werner, J.S. Detecting Colour Vision Deficiency in 4- and 8-Week-Old Human Infants. In The Colour Vision Deficiencies XIII, Proceedings of the Thirteenth Symposium of the International Research Group on Colour Vision Deficiencies, Held in Pau, France, 27–30 July 1995; Cavonius, C.R., Ed.; Springer: Dordrecht, The Netherlands, 1997; pp. 277–282. [Google Scholar] [CrossRef]
  72. Yan, W.; Xu, G.; Li, M.; Xie, J.; Han, C.; Zhang, S.; Luo, A.; Chen, C. Steady-State Motion Visual Evoked Potential (SSMVEP) Based on Equal Luminance Colored Enhancement. PLoS ONE 2017, 12, e0169642. [Google Scholar] [CrossRef]
  73. Spitschan, M.; Woelders, T. The Method of Silent Substitution for Examining Melanopsin Contributions to Pupil Control. Front. Neurol. 2018, 9, 941. [Google Scholar] [CrossRef]
  74. Hendrickson, A.; Bumsted-O’Brien, K.; Natoli, R.; Ramamurthy, V.; Possin, D.; Provis, J. Rod Photoreceptor Differentiation in Fetal and Infant Human Retina. Exp. Eye Res. 2008, 87, 415–426. [Google Scholar] [CrossRef] [PubMed]
  75. Vinekar, A.; Mangalesh, S.; Jayadev, C.; Maldonado, R.S.; Bauer, N.; Toth, C.A. Retinal Imaging of Infants on Spectral Domain Optical Coherence Tomography. BioMed. Res. Int. 2015, 2015, 782420. [Google Scholar] [CrossRef] [PubMed]
  76. Thomas, B.; Rajendran, R.; Koganti, Y.; Maheswari, V.U. Portable Embedded Device to Analyse the Effect of Color Blindness on EEG. In Proceedings of the 2017 International Conference on Nextgen Electronic Technologies: Silicon to Software (ICNETS2), Chennai, India, 23–25 March 2017; pp. 270–274. [Google Scholar] [CrossRef]
  77. Thomas, B.; Umamaheswari, V. EEG Based Color Impairment Detection. Int. J. Recent Innov. Trends Comput. Commun. 2016, 4, 540–542. [Google Scholar] [CrossRef]
  78. Roy, S.; Banerjee, A.; Roy, C.; Nag, S.; Sanyal, S.; Sengupta, R.; Ghosh, D. Brain Response to Color Stimuli: An EEG Study with Nonlinear Approach. Cogn. Neurodyn. 2021, 15, 1023–1053. [Google Scholar] [CrossRef]
  79. Göksel Duru, D.; Alobaidi, M. Classification of Brain Electrophysiological Changes in Response to Colour Stimuli. Phys. Eng. Sci. Med. 2021, 44, 727–743. [Google Scholar] [CrossRef] [PubMed]
  80. Rakshit, A.; Lahiri, R. Discriminating Different Color from EEG Signals Using Interval-Type 2 Fuzzy Space Classifier (A Neuro-Marketing Study on the Effect of Color to Cognitive State). In Proceedings of the 2016 IEEE 1st International Conference on Power Electronics, Intelligent Control and Energy Systems (ICPEICES), Delhi, India, 4–6 July 2016; pp. 1–6. [Google Scholar] [CrossRef]
  81. Wicaksono, A.; Mengko, T.; Iramina, K. Investigation of EEG Signal Response Using Event-Related Potential (ERP) Towards Ishihara Pseudo-Isochromatic Visual Stimulus. In Proceedings of the 2020 IEEE Signal, Processing in Medicine and Biology Symposium (SPMB), Philadelphia, PA, USA, 5 December 2020; pp. 1–5. [Google Scholar] [CrossRef]
  82. Ekhlasi, A.; Ahmadi, H.; Molavi, A.; Nia, M.; Nasrabadi, A.M. EEG Signal Analysis During Ishihara’s Test in Subjects with Normal Vision and Color Vision Deficiency. Biomed. Phys. Eng. Express 2021, 7, 025021. [Google Scholar] [CrossRef] [PubMed]
  83. Duart, X.; Quiles, E.; Suay, F.; Chio, N.; García, E.; Morant, F. Evaluating the Effect of Stimuli Color and Frequency on SSVEP. Sensors 2020, 21, 117. [Google Scholar] [CrossRef] [PubMed]
  84. Tello, R.J.M.G.; Müller, S.M.T.; Ferreira, A.; Bastos, T.F. Comparison of the Influence of Stimuli Color on Steady-State Visual Evoked Potentials. Res. Biomed. Eng. 2015, 31, 218–231. [Google Scholar] [CrossRef]
  85. Zheng, X.; Xu, G.; Wang, Y.; Du, C.; Liang, R.; Zhang, K.; Jia, Y.; Du, Y. Quantitative and Objective Diagnosis of Color Vision Deficiencies Based on Steady-State Visual Evoked Potentials. Int. Ophthalmol. 2021, 41, 587–598. [Google Scholar] [CrossRef] [PubMed]
  86. Ridder, W.; McCulloch, D.; Herbert, A. Stimulus Duration, Neural Adaptation, and Sweep Visual Evoked Potential Acuity Estimates. Invest. Ophthalmol. Vis. Sci. 1999, 39, 2759–2768. [Google Scholar]
  87. Norton, J.J.S.; DiRisio, G.F.; Carp, J.S.; Norton, A.E.; Kochan, N.S.; Wolpaw, J.R. Brain-Computer Interface-Based Assessment of Color Vision. J. Neural Eng. 2021, 18, 066015. [Google Scholar] [CrossRef] [PubMed]
  88. Habibzadeh, H.; Long, K.J.; Atkins, A.E.; Zois, D.-S.; Norton, J.J.S. Improving BCI-Based Color Vision Assessment Using Gaussian Process Regression. In Proceedings of the ICASSP 2022 IEEE International Conference on Acoustics, Speech and Signal Process (ICASSP), Singapore, 23–27 May 2022; pp. 1306–1310. [Google Scholar] [CrossRef]
  89. Atkins, A.E.; Habibzadeh, H.; Vaughan, T.M.; Norton, J.J.S. Optimizing Stimulation Frequency for BCI-Based Color Vision Assessment: Preliminary Results. In Proceedings of the 2023 11th International IEEE/EMBS Conference on Neural Engineering (NER), Baltimore, MD, USA, 24–27 April 2023; pp. 1–4. [Google Scholar] [CrossRef]
  90. Lee, Y.-E.; Shin, G.-H.; Lee, M.; Lee, S.-W. Mobile BCI Dataset of Scalp- and Ear-EEGs with ERP and SSVEP Paradigms While Standing, Walking, and Running. Sci. Data 2021, 8, 315. [Google Scholar] [CrossRef] [PubMed]
  91. Hamid, M.; Singh, J. EEG Signal Processing for Detection of Colour Vision Deficiencies. ECS Trans. 2022, 107, 10053–10060. [Google Scholar] [CrossRef]
  92. Fontanella, L.; Ippoliti, L. Karhunen–Loéve Expansion of Temporal and Spatio-Temporal Processes. In Handbook of Statistics; Elsevier: Amsterdam, The Netherlands, 2012; Volume 30, pp. 497–520. [Google Scholar]
  93. Jia, W.; Sun, M.; Lian, J.; Hou, S. Feature Dimensionality Reduction: A Review. Complex Intell. Syst. 2022, 8, 2663–2693. [Google Scholar] [CrossRef]
  94. Hosseini, M.-P.; Hosseini, A.; Ahi, K. A Review on Machine Learning for EEG Signal Processing in Bioengineering. Rev. Biomed. Eng. 2021, 14, 204–218. [Google Scholar] [CrossRef] [PubMed]
  95. Huang, S.; Cai, N.; Pacheco, P.P.; Narandes, S.; Wang, Y.; Xu, W. Applications of Support Vector Machine (SVM) Learning in Cancer Genomics. Cancer Genom. Proteom. 2017, 15, 41–51. [Google Scholar] [CrossRef]
  96. Uddin, S.; Haque, I.; Lu, H.; Moni, M.A.; Gide, E. Comparative Performance Analysis of K-Nearest Neighbour (KNN) Algorithm and Its Different Variants for Disease Prediction. Sci. Rep. 2022, 12, 6256. [Google Scholar] [CrossRef] [PubMed]
  97. Zhang, Z.; Fort, J.M.; Giménez Mateu, L. Mini Review: Challenges in EEG Emotion Recognition. Front. Psychol. 2024, 14, 1289816. [Google Scholar] [CrossRef]
  98. Jiang, L.; Siriaraya, P.; Choi, D.; Zeng, F.; Kuwahara, N. Electroencephalogram Signals Emotion Recognition Based on Convolutional Neural Network-Recurrent Neural Network Framework with Channel-Temporal Attention Mechanism for Older Adults. Front. Aging Neurosci. 2022, 14, 945024. [Google Scholar] [CrossRef]
  99. Höller, Y.; Jónsdóttir, S.T.; Hannesdóttir, A.H.; Ólafsson, R.P. EEG-Responses to Mood Induction Interact with Seasonality and Age. Front. Psychiatry 2022, 13, 950328. [Google Scholar] [CrossRef]
  100. Eroğlu, K.; Kayıkçıoğlu, T.; Osman, O. Effect of Brightness of Visual Stimuli on EEG Signals. Behav. Brain Res. 2020, 382, 112486. [Google Scholar] [CrossRef] [PubMed]
  101. Hubel, D.H.; Wiesel, T.N. Brain Mechanisms of Vision. Sci. Am. 1979, 241, 150–163. [Google Scholar] [CrossRef]
  102. Rehman, A.; Al Khalili, Y. Neuroanatomy, Occipital Lobe. In StatPearls; StatPearls Publishing: Treasure Island, FL, USA, 2019; Available online: https://europepmc.org/article/nbk/nbk544320 (accessed on 11 August 2024).
  103. Warren, D.J.; Normann, R.A.; Finn, W.E.; LoPresti, P.G. Visual Neuroprostheses. In Neuroprosthetics: Theory and Practice; Finn, W.E., LoPresti, P.G., Normann, R.A., Eds.; CRC Press: Boca Raton, FL, USA, 2003; pp. 261–306. [Google Scholar]
Figure 3. Illustration of the color vision pathway, showing how the eye processes specific colors, influencing EEG signals [61].
Applsci 14 07579 g003
Figure 4. Methodology for detecting color vision deficiency using EEG signals.
Applsci 14 07579 g004
Table 2. Comparison of conventional CVD diagnostic tests and EEG-based methods.
AspectConventional CVD TestsEEG-Based Methods
Behavioral RequirementYes, requires active participation (e.g., verbal response)No, relies on brain responses without behavioral input
SubjectivityHigh, results can be influenced by individual perception and experienceLow, results are based on objective EEG data
Training RequiredYes, some tests require extensive training (e.g., anomaloscope)Minimal, simple instructions and sensor placement
Susceptibility to ManipulationYes, possible through memorization (e.g., Ishihara plates)No, EEG signals cannot be consciously controlled
SpeedFast, typically completed within minutesSlower, requires more time for setup and signal analysis
Suitability for Disabled IndividualsLimited, requires active participationHigh, suitable for individuals with disabilities or communication challenges
Use CaseQuick screening, large population testingResearch, cases where traditional methods are not viable or require more detailed analysis
Table 4. Pros and cons of ERP and SSVEP techniques.
ERP TechniqueSSVEP Technique
ProsHigher accuracy in measuring scalp EEG allows for more precise measurements of brain activity.Greater SNR and less susceptibility to external environmental factors.
Comfortable stimulation process from the subjects’ point of view.Rapid recording capabilities enable efficient data collection and analysis for tasks requiring quick responses.
No limitations for individuals who can perform the recording.Precise quantification of specific responses, as it enables accurate measurement of responses to visual stimuli at particular frequencies, aiding in identifying and analyzing brain activity patterns with high specificity.
Numerous studies have utilized it, making its methods and analysis techniques clearer to other researchers.Unbiased identification, as it relies on neural responses to visual stimuli without subjective interpretation.
ConsEasily affected by noise, eye movements, and body movements, which can impact the signal’s reliability.Some subjects find it annoying due to the flickering stimulation.
May involve subjective judgment in identifying neural responses, potentially introducing biases or variations in the analysis process.Limited usability for individuals with certain neurological disorders, such as epilepsy, who should avoid flickering stimuli.
Table 5. Filter parameters in existing studies.
ReferenceFilterFc
[77]BPF0.3–40 Hz
[81]BPF0.5–20 Hz
[85]Online BPF2–100 Hz
Offline notch filter48–52 Hz
[82]LPF40 Hz
HPF1.5 Hz
[87]BPF: 4th order3–45 Hz
Notch filter60 Hz
[88]BPF: 12th order5–55 Hz
[89]BPF: 12th order4–85 Hz
Disclaimer/Publisher’s Note: The statements, opinions and data contained in all publications are solely those of the individual author(s) and contributor(s) and not of MDPI and/or the editor(s). MDPI and/or the editor(s) disclaim responsibility for any injury to people or property resulting from any ideas, methods, instructions or products referred to in the content.

