
Cracks in Arch Dams: An Overview of Documented Instances


Abstract
:1. Introduction
1.1. Effect of Cracking on Arch Dams
- Structural failure within the dam body;
- Sliding along the dam–foundation interface;
- Movement of the abutment rock wedges formed by rock discontinuities.
- Thermal effects: external temperature variations, freeze–thaw effects, hydration heat during concrete curing, etc. Due to its size and massive cross-section, significant thermal or moisture gradients may occur where parts of the structure are subjected to water, while other parts are in contact with the ambient air. These effects can introduce significant stresses into the structure. Most horizontal cracks in the arch dam are due to summer temperatures when the dam is empty and develop downstream. These cracks, although still required to be studied, are generally not hazardous because they will close once the reservoir is filled. More detailed information can be found in [7,8];
- Chemical effects: expansive chemical reactions, shrinkage, alkali–aggregate reactions (alkali–silica reaction, alkali–carbonate reaction and sulfate attack), etc. More detailed information on chemical reactions in dams can be found in [9];
- External events: these include microseismic, earthquakes, deformation of the foundation, seepage, overtopping flooding, etc.;
- Inadequate design or execution of construction and maintenance: the profile of the arch dam is directly related to the stress distribution in the body of the dam, which can be affected by weak foundations, weak joints, not suitable concrete materials (high-strength concrete has high hydration heat), wrong design affecting its rigidity, gallery weaknesses, etc.
1.2. Detection and Treatment of Cracks
1.3. Study of Cracked Arch Dams
1.3.1. Previous to 2010
1.3.2. Between 2011 and 2015
1.3.3. Between 2016 and 2021
2. Observational Data/Material: Summary of Case Studies
- Type: Double curvature (curve both in layout and vertical section), single curvature thin (curved only in layout), single-curvature gravity arch (a single-curvature arch dam thicker than usual but thinner than a gravity dam), or multiple arches;
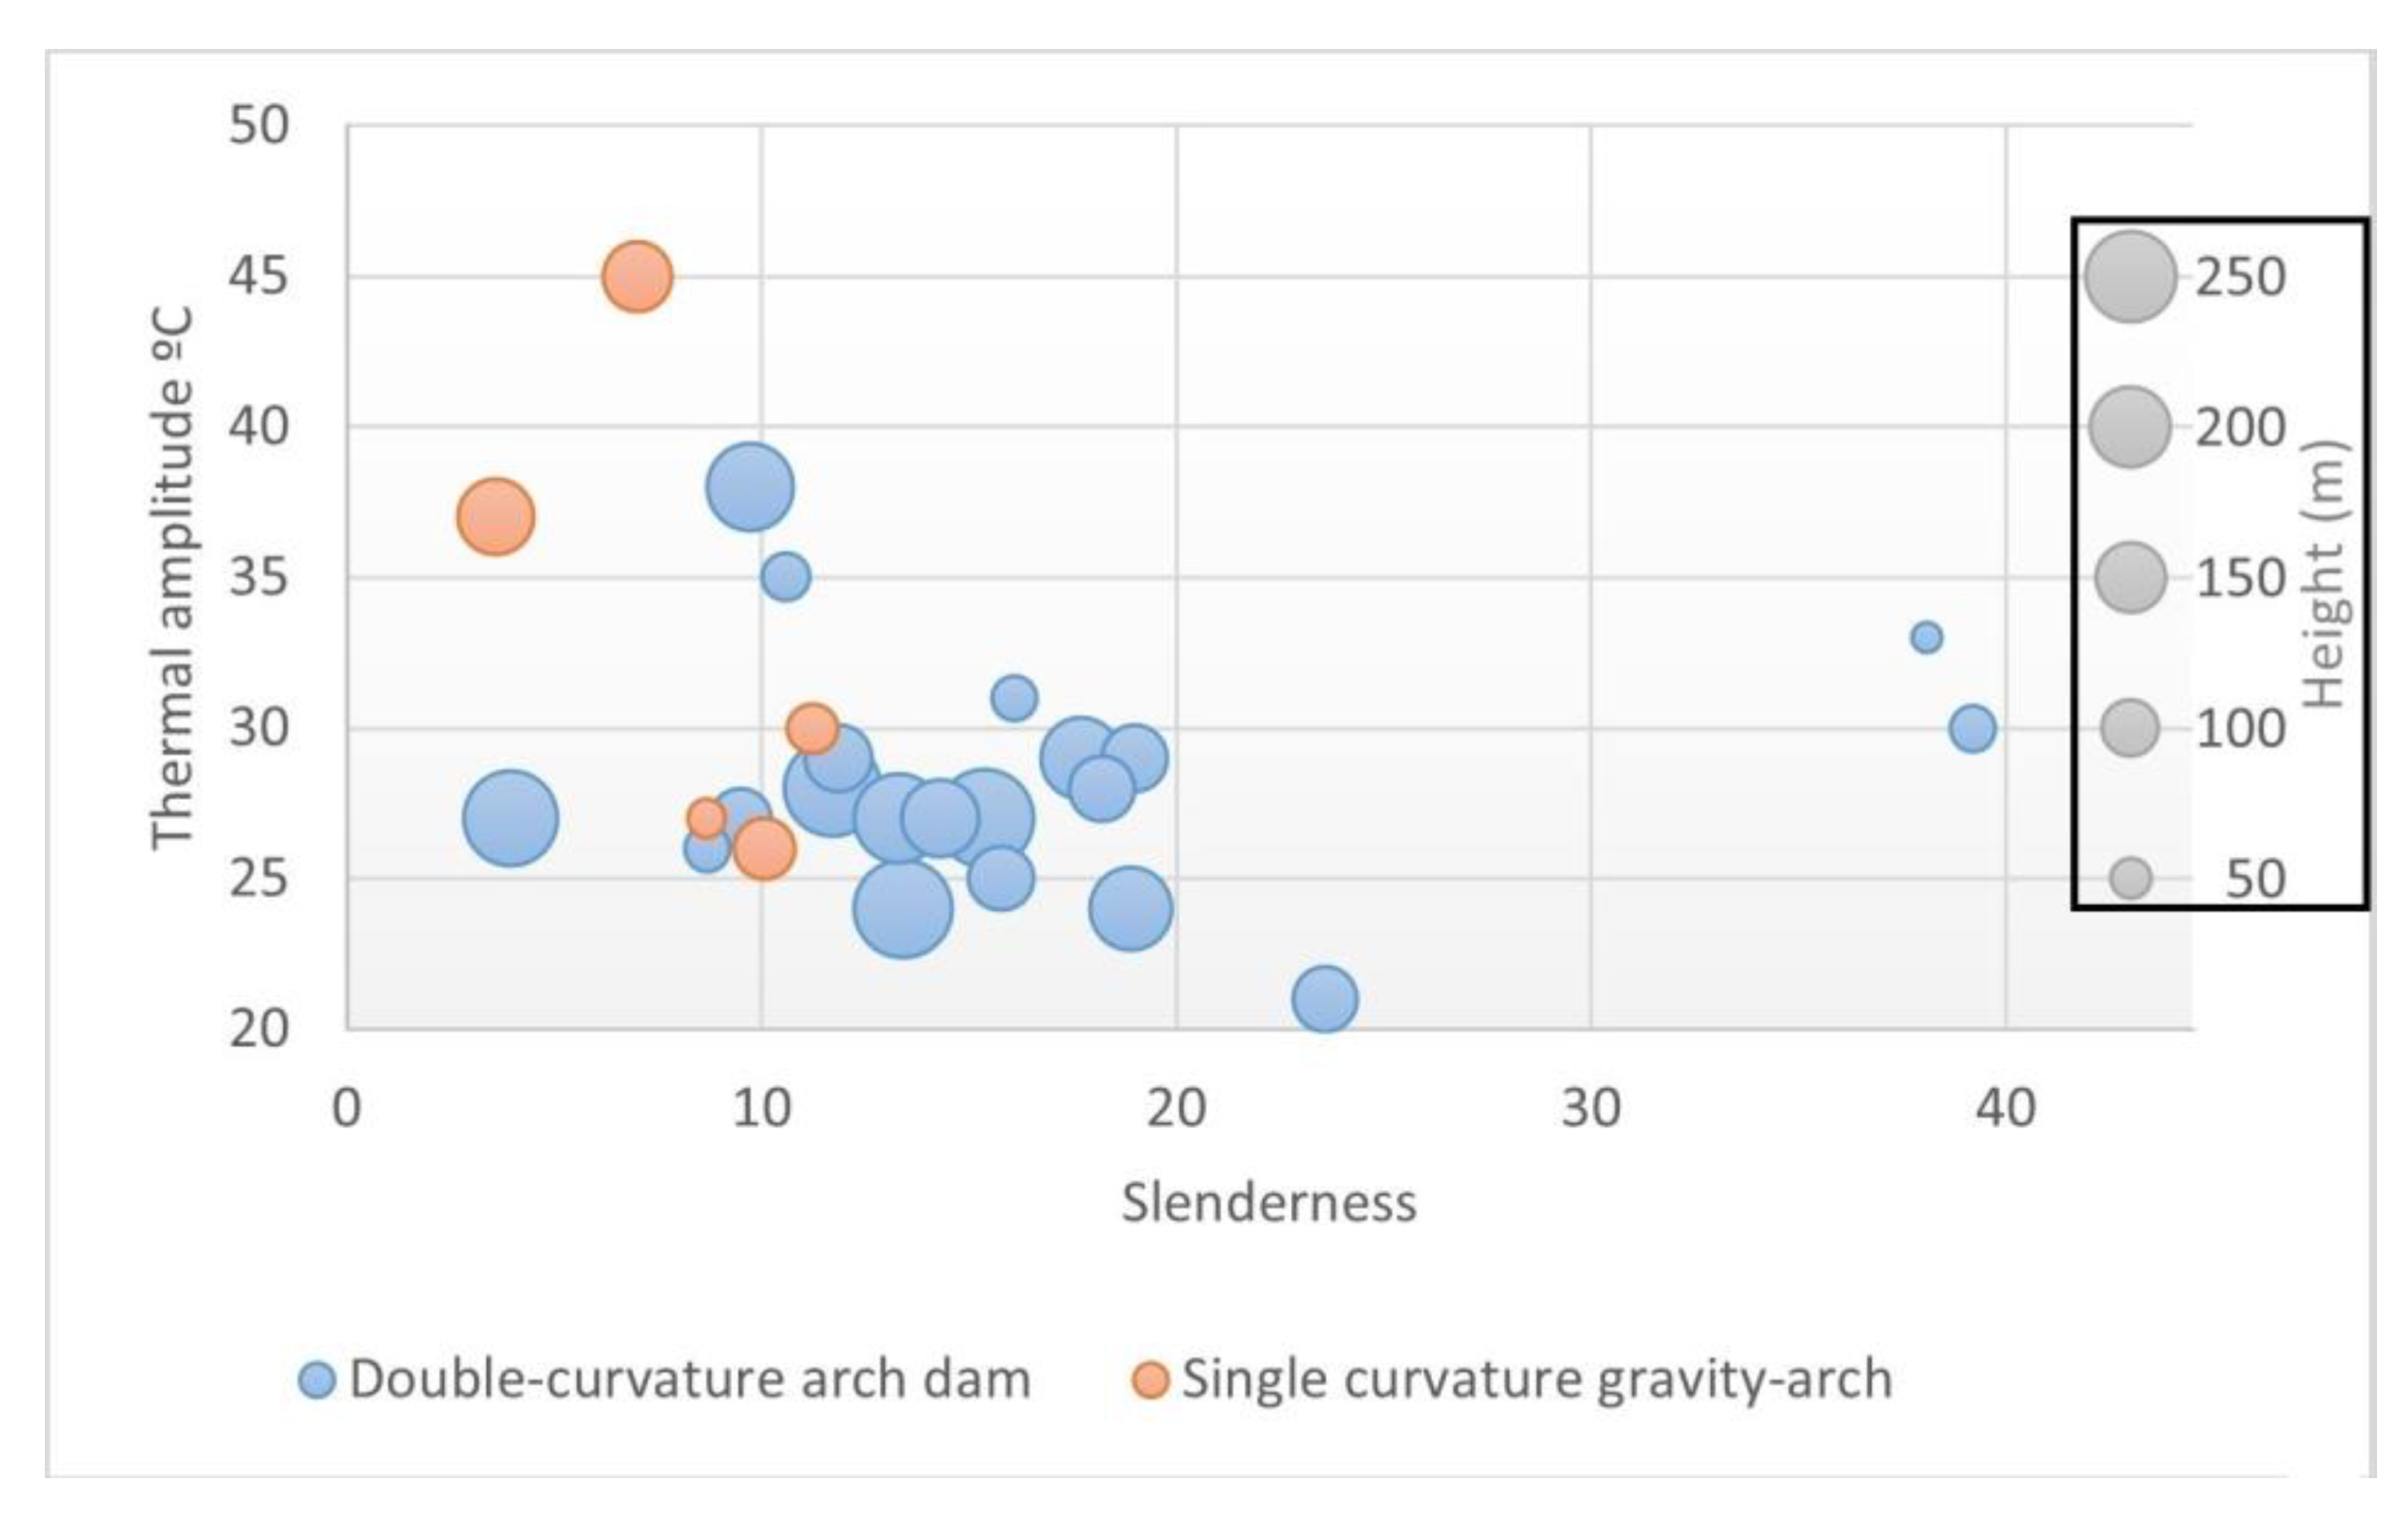
- Lombardi coefficient: Slenderness maximum value according to Lombardi’s formula. More accurate parameters (such as those discussed in [20]) were not used because there was not enough information available to determine their value for most of the dams;
- Nearby city: Closest city where temperature records are available;
- Thermal amplitude: Difference between the average temperatures of the warmest and coldest month in the nearby city.
2.1. Double Curvature Dams
2.2. Single-Curvature Thin Dams
2.3. Single-Curvature Gravity-Arch Dams
2.4. Multiple-Arches Dams
3. Results and Discussion: Comparative Analyses of Cracking
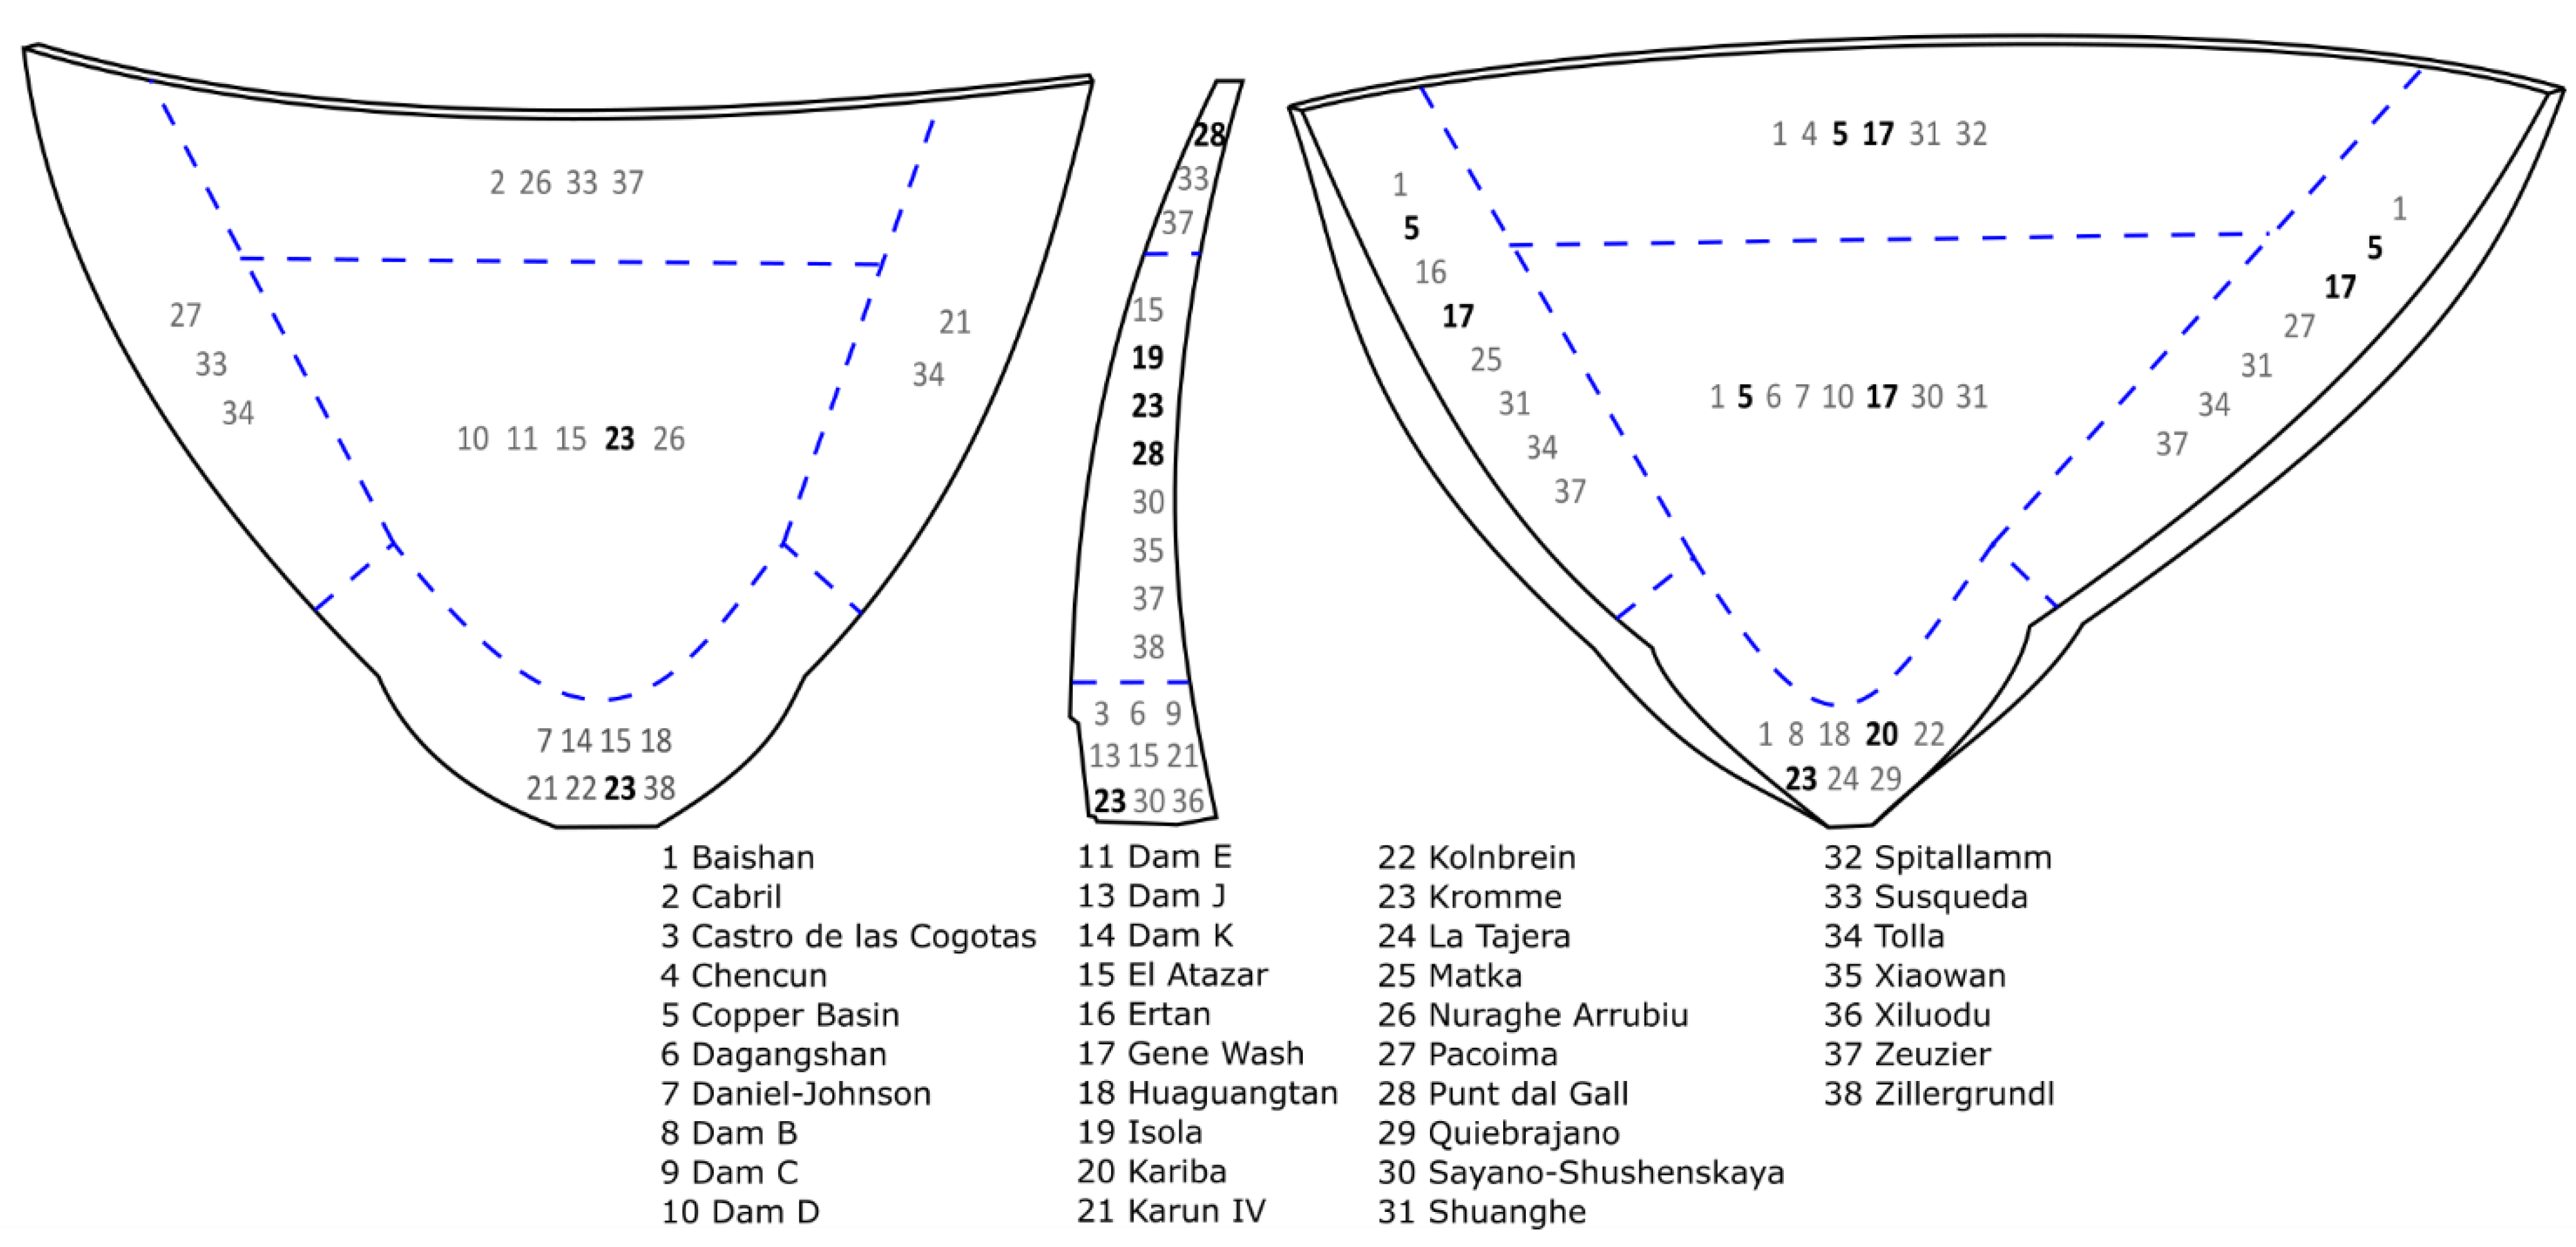
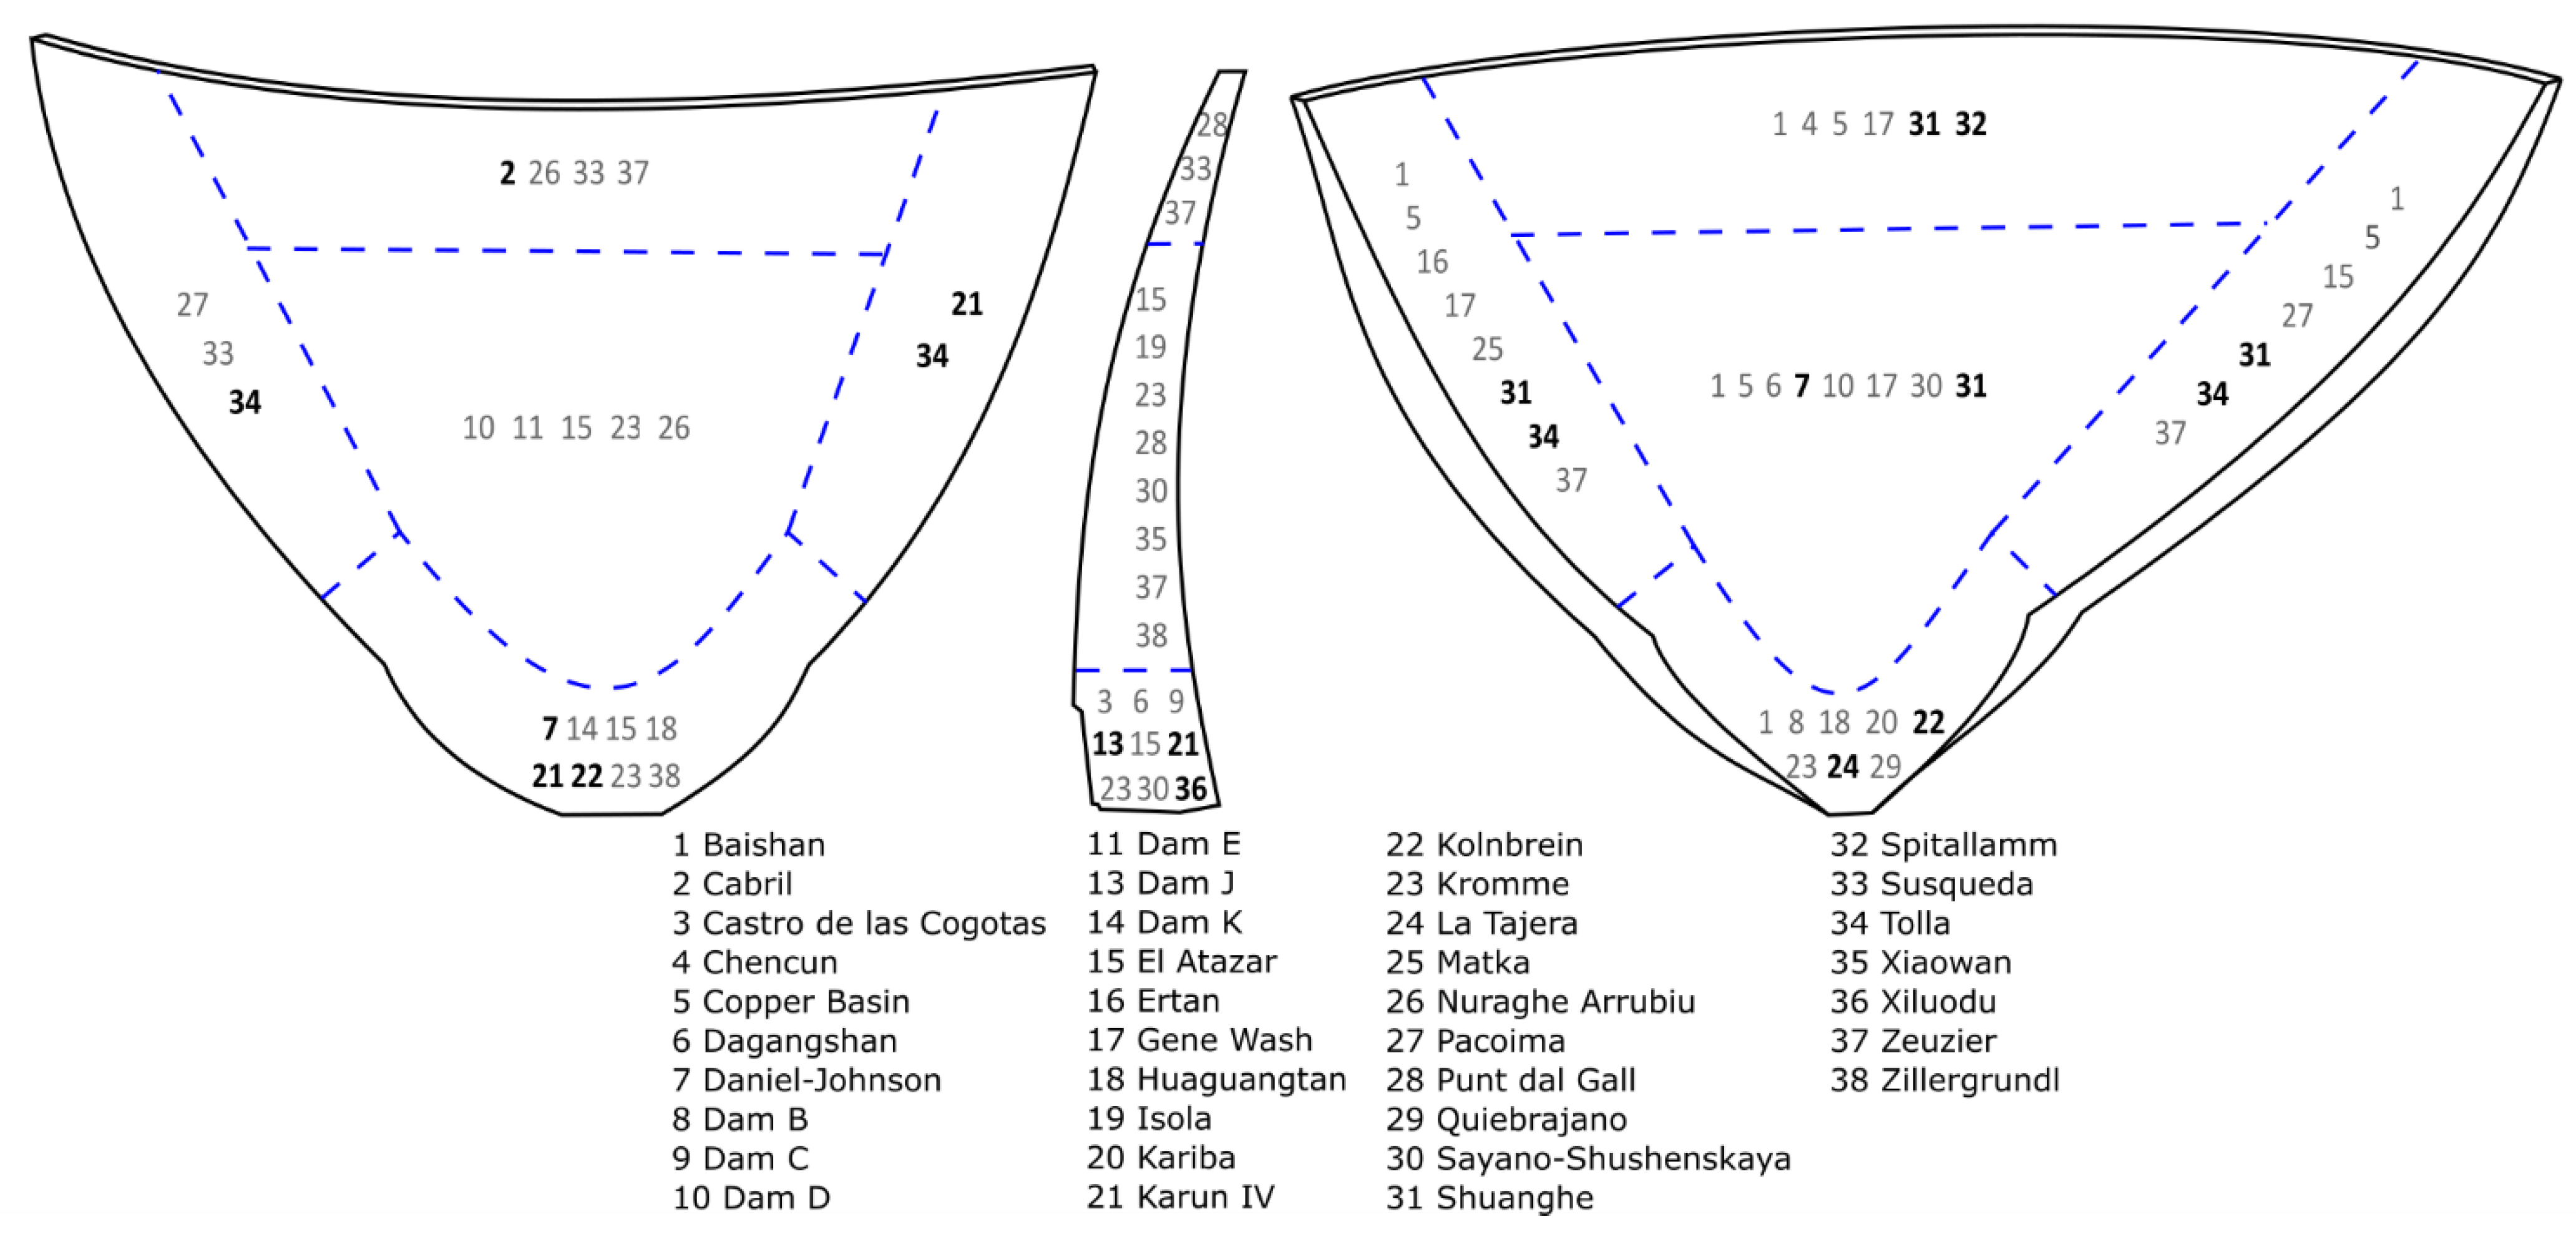
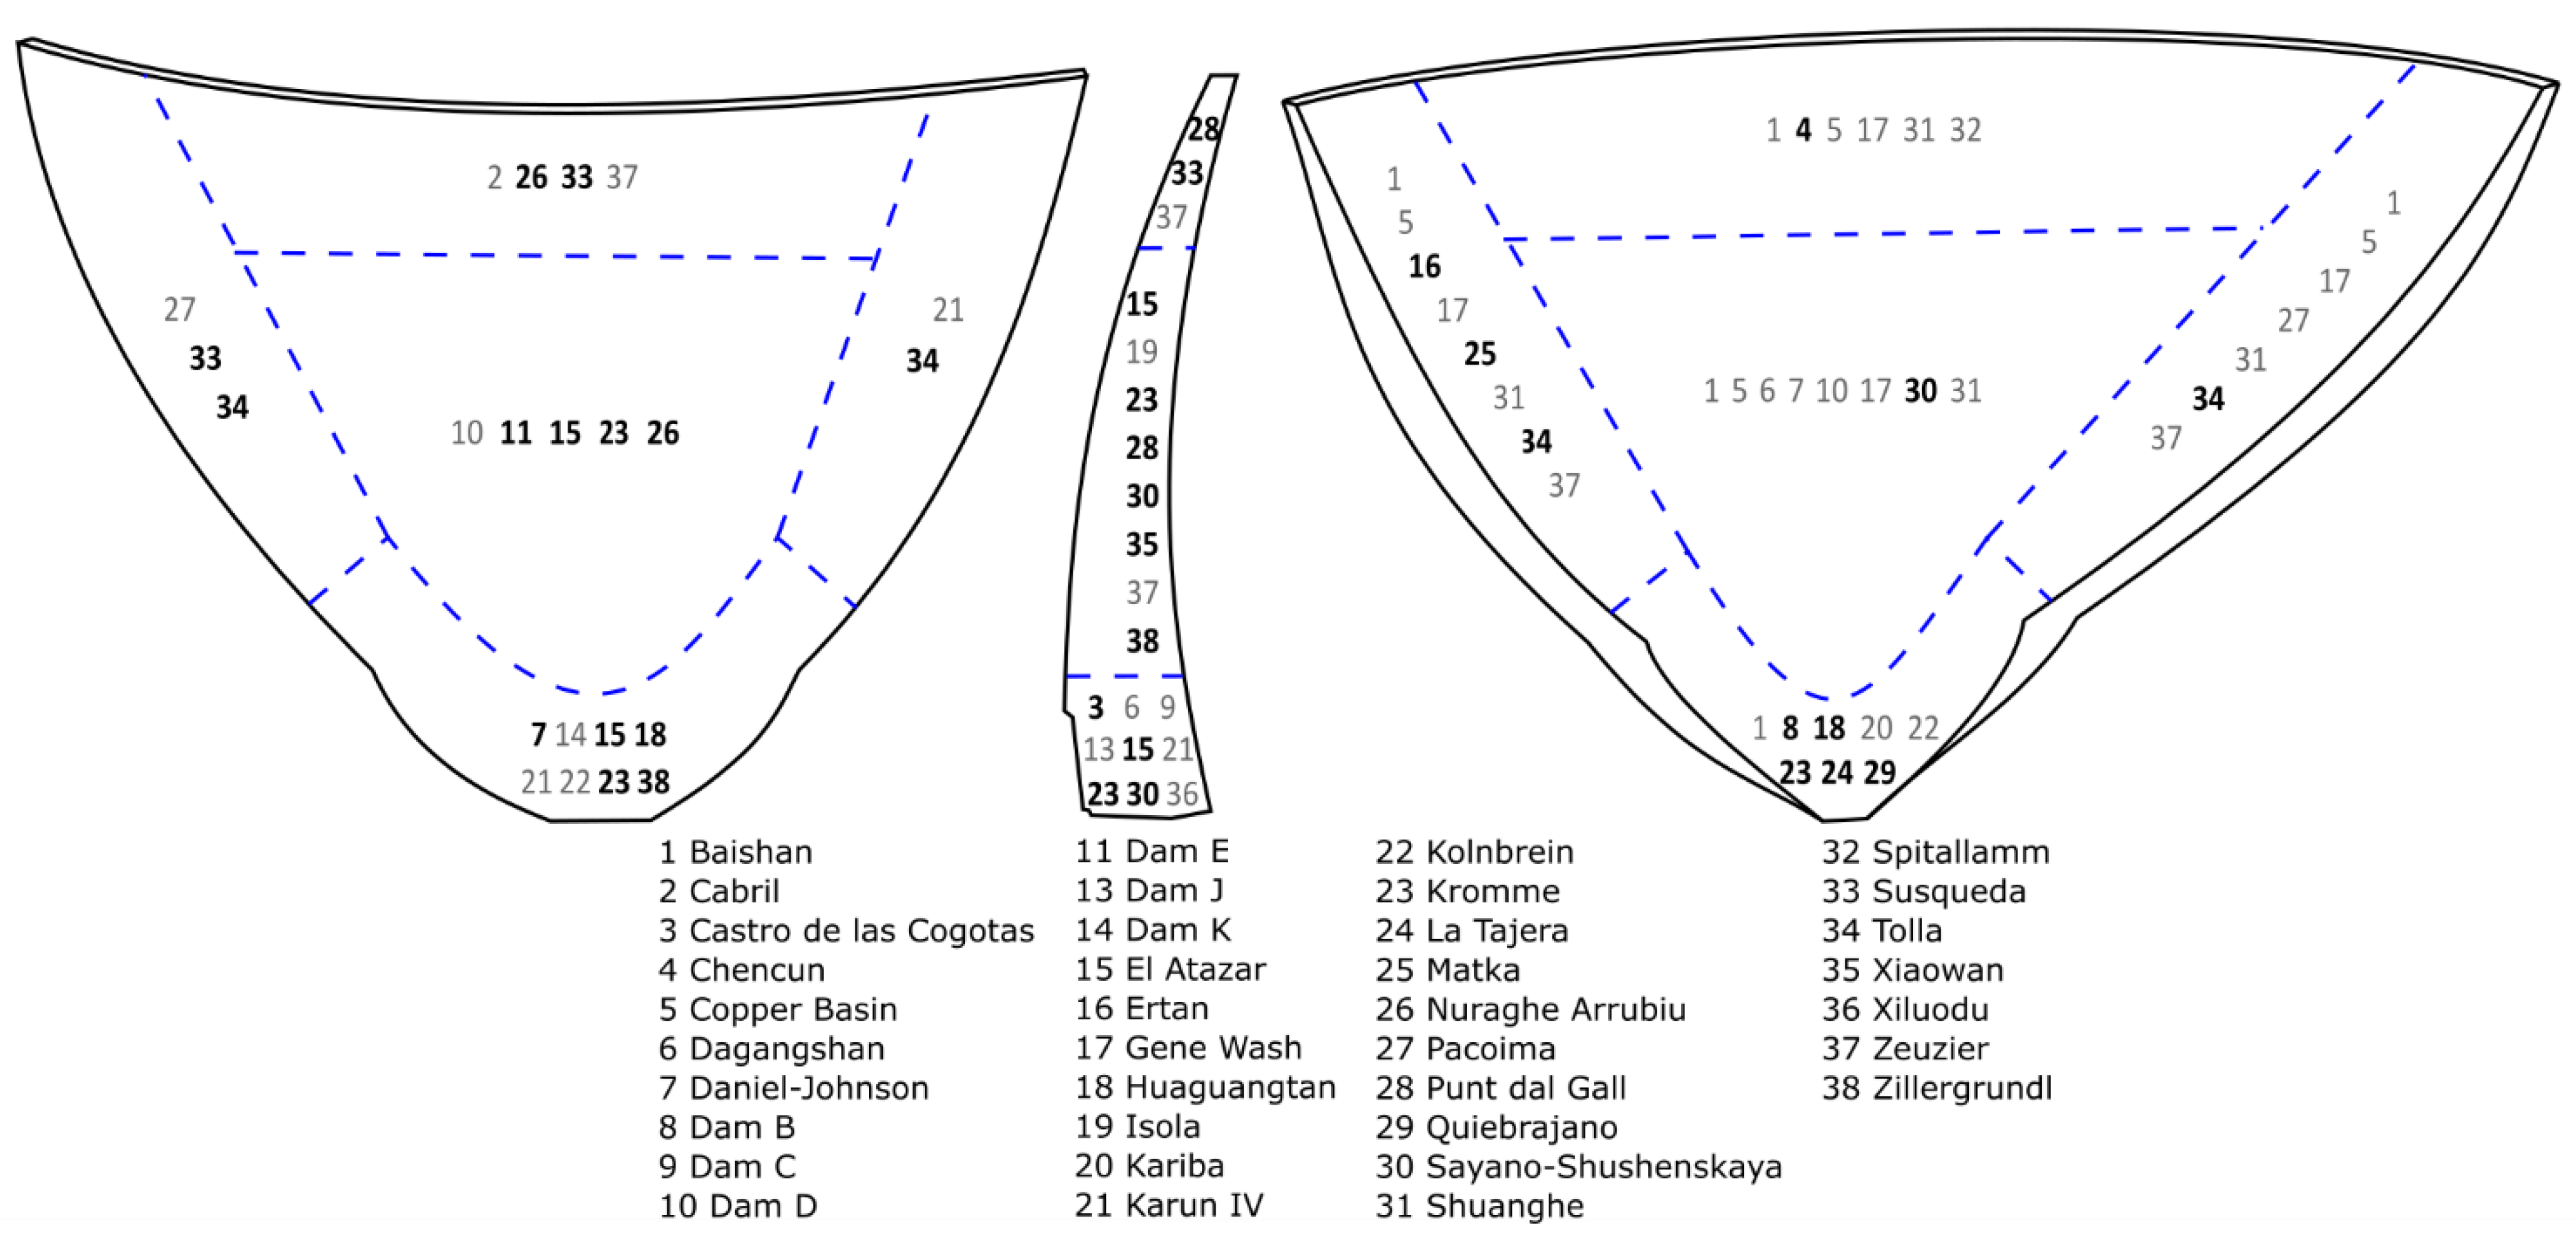
3.1. Location of the Cracks
- Cracking happens more often in the downstream face than in the upstream face, and internal cracks are not unusual;
- Internal cracks can be found all along the height of the dam section;
- There is no specific area wherein the cracking concentrates on the downstream face, although it is more common in the abutment zones;
- However, cracking occurs more often at the toe and central areas and rarely in the abutments and crest area in the upstream face;
- Double-curvature dams tend to crack upstream in the crest zone and heel, while downstream on the sides and near the toe;
- Single-curvature thin dams do not usually have internal cracks or external cracks near the base of the dam. Cracking is mainly on the abutments, central and crest zones of the downstream face. When cracking occurs upstream, the cracks are located on the abutments;
- Gravity-arch dams tend to crack in the central zone of the dam upstream and in the central or crest zone of the downstream face.
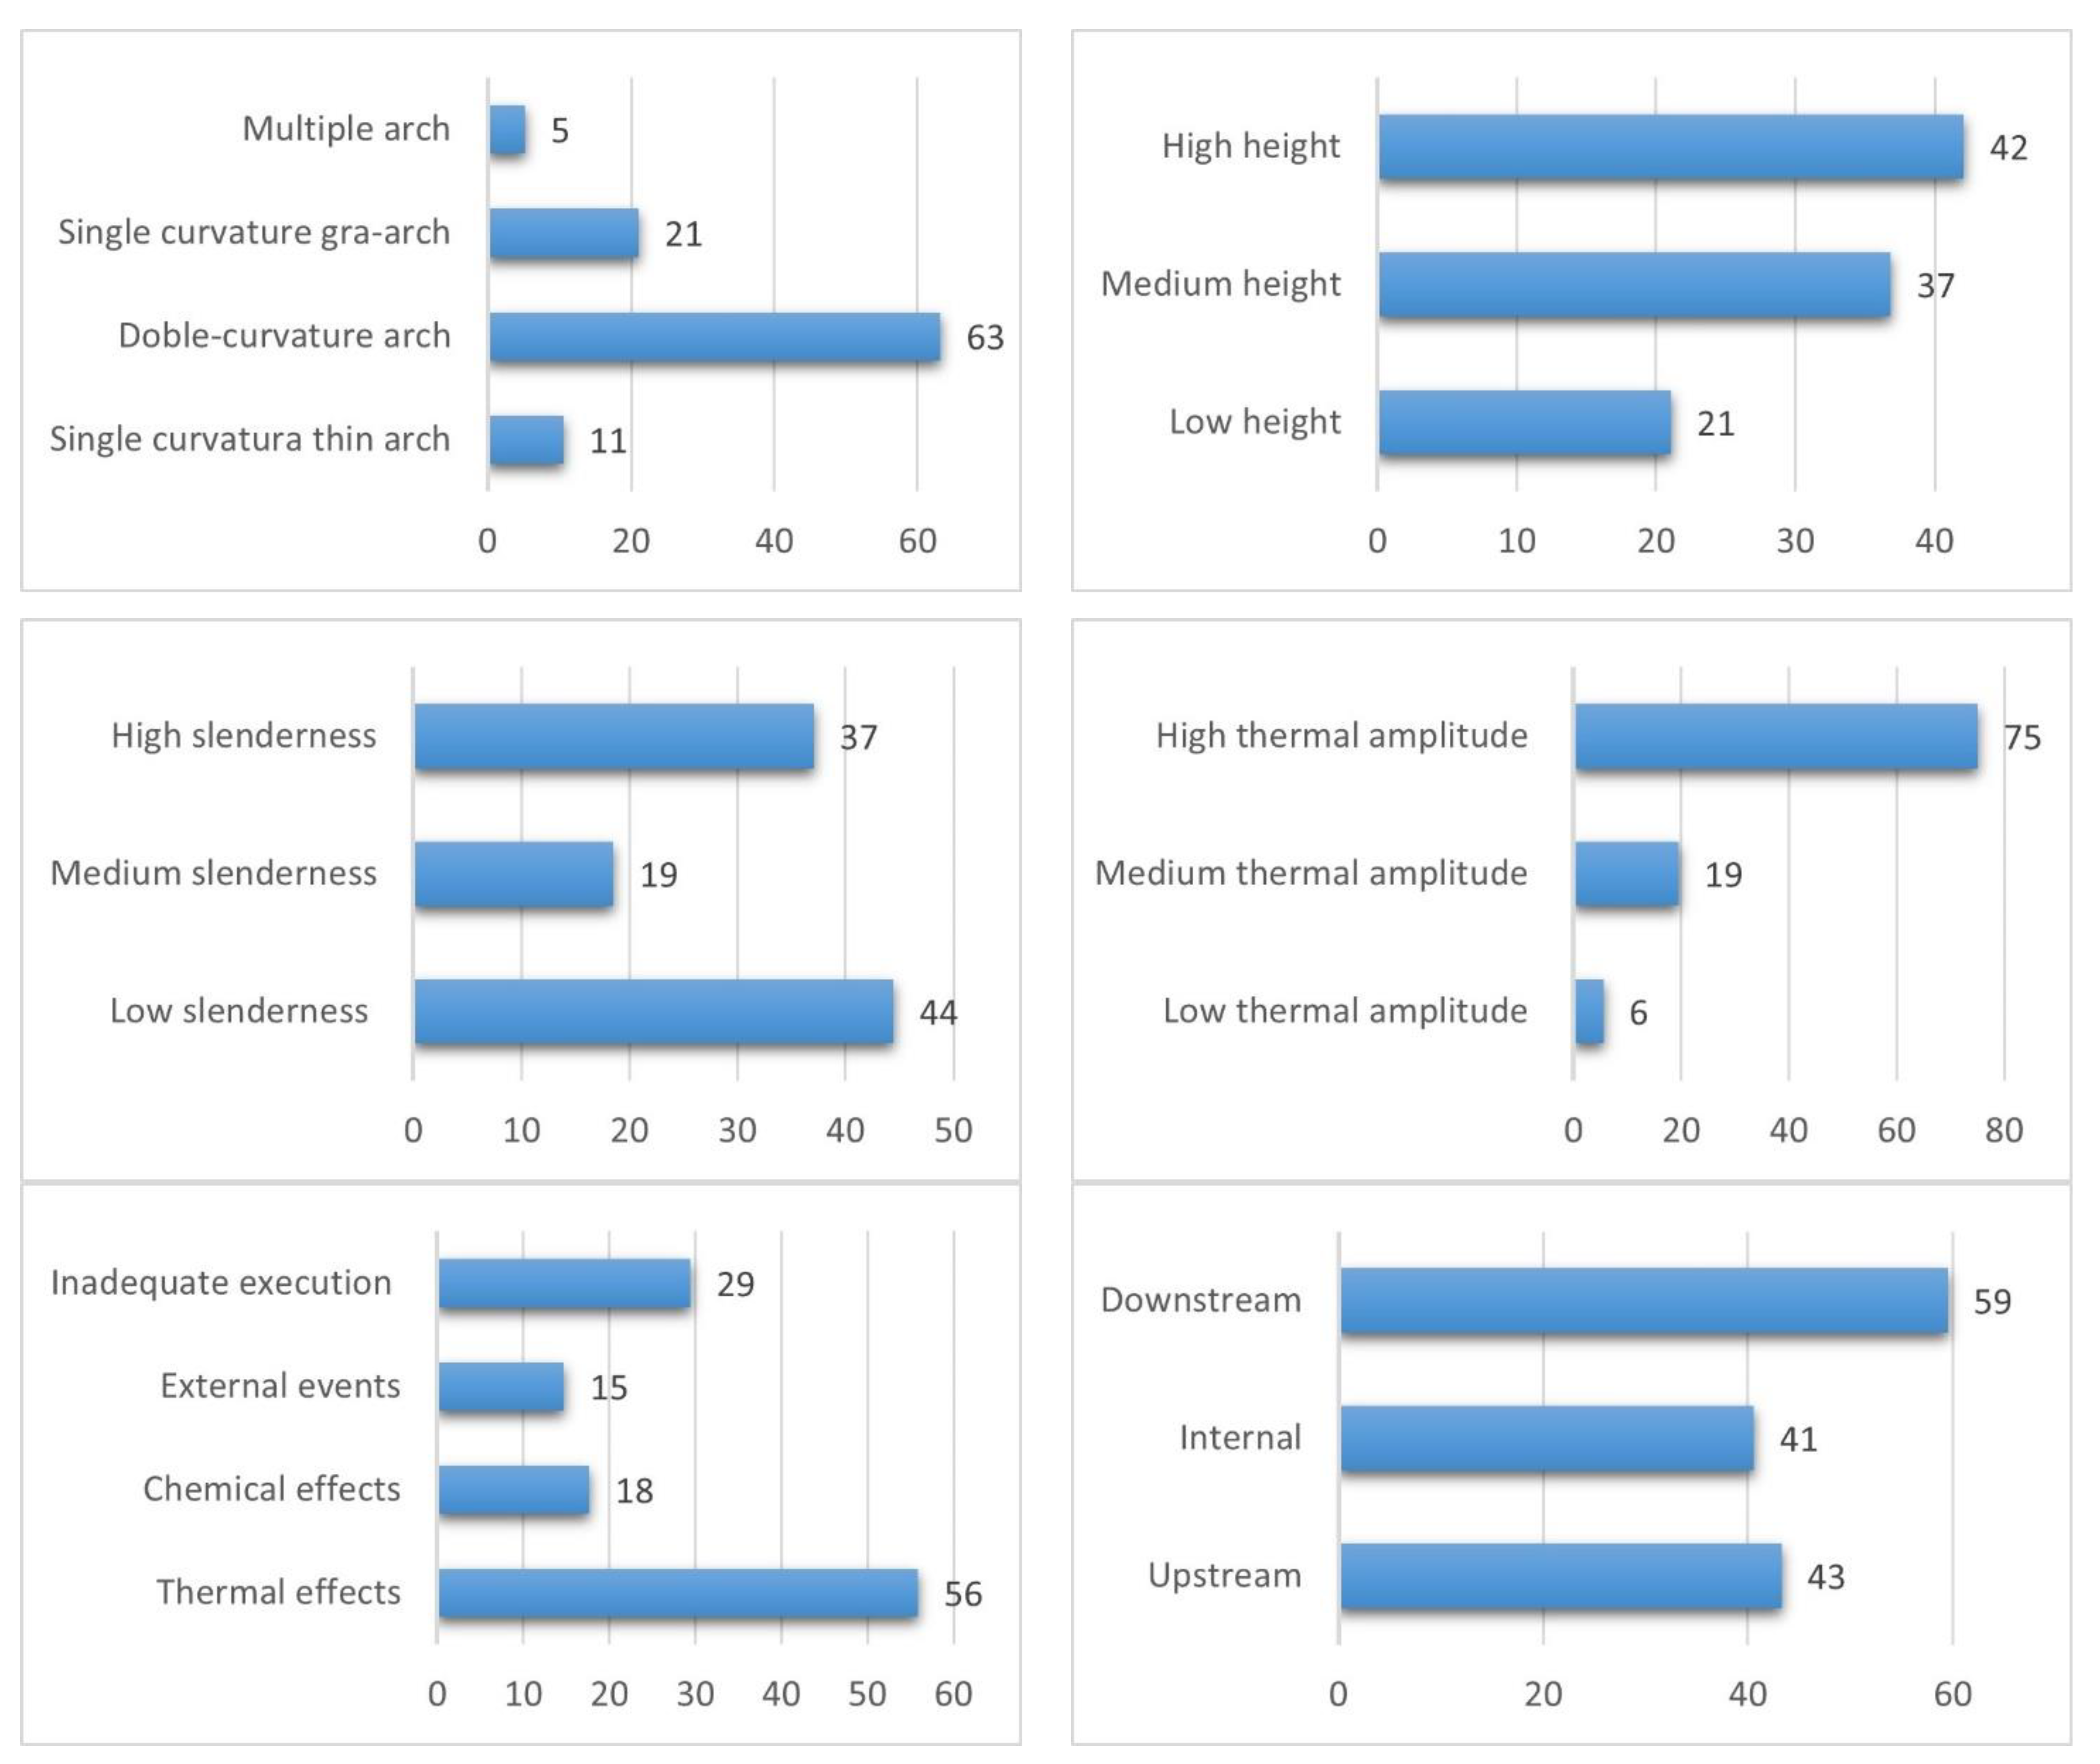
3.2. Factors Related to Arch Dam Cracking
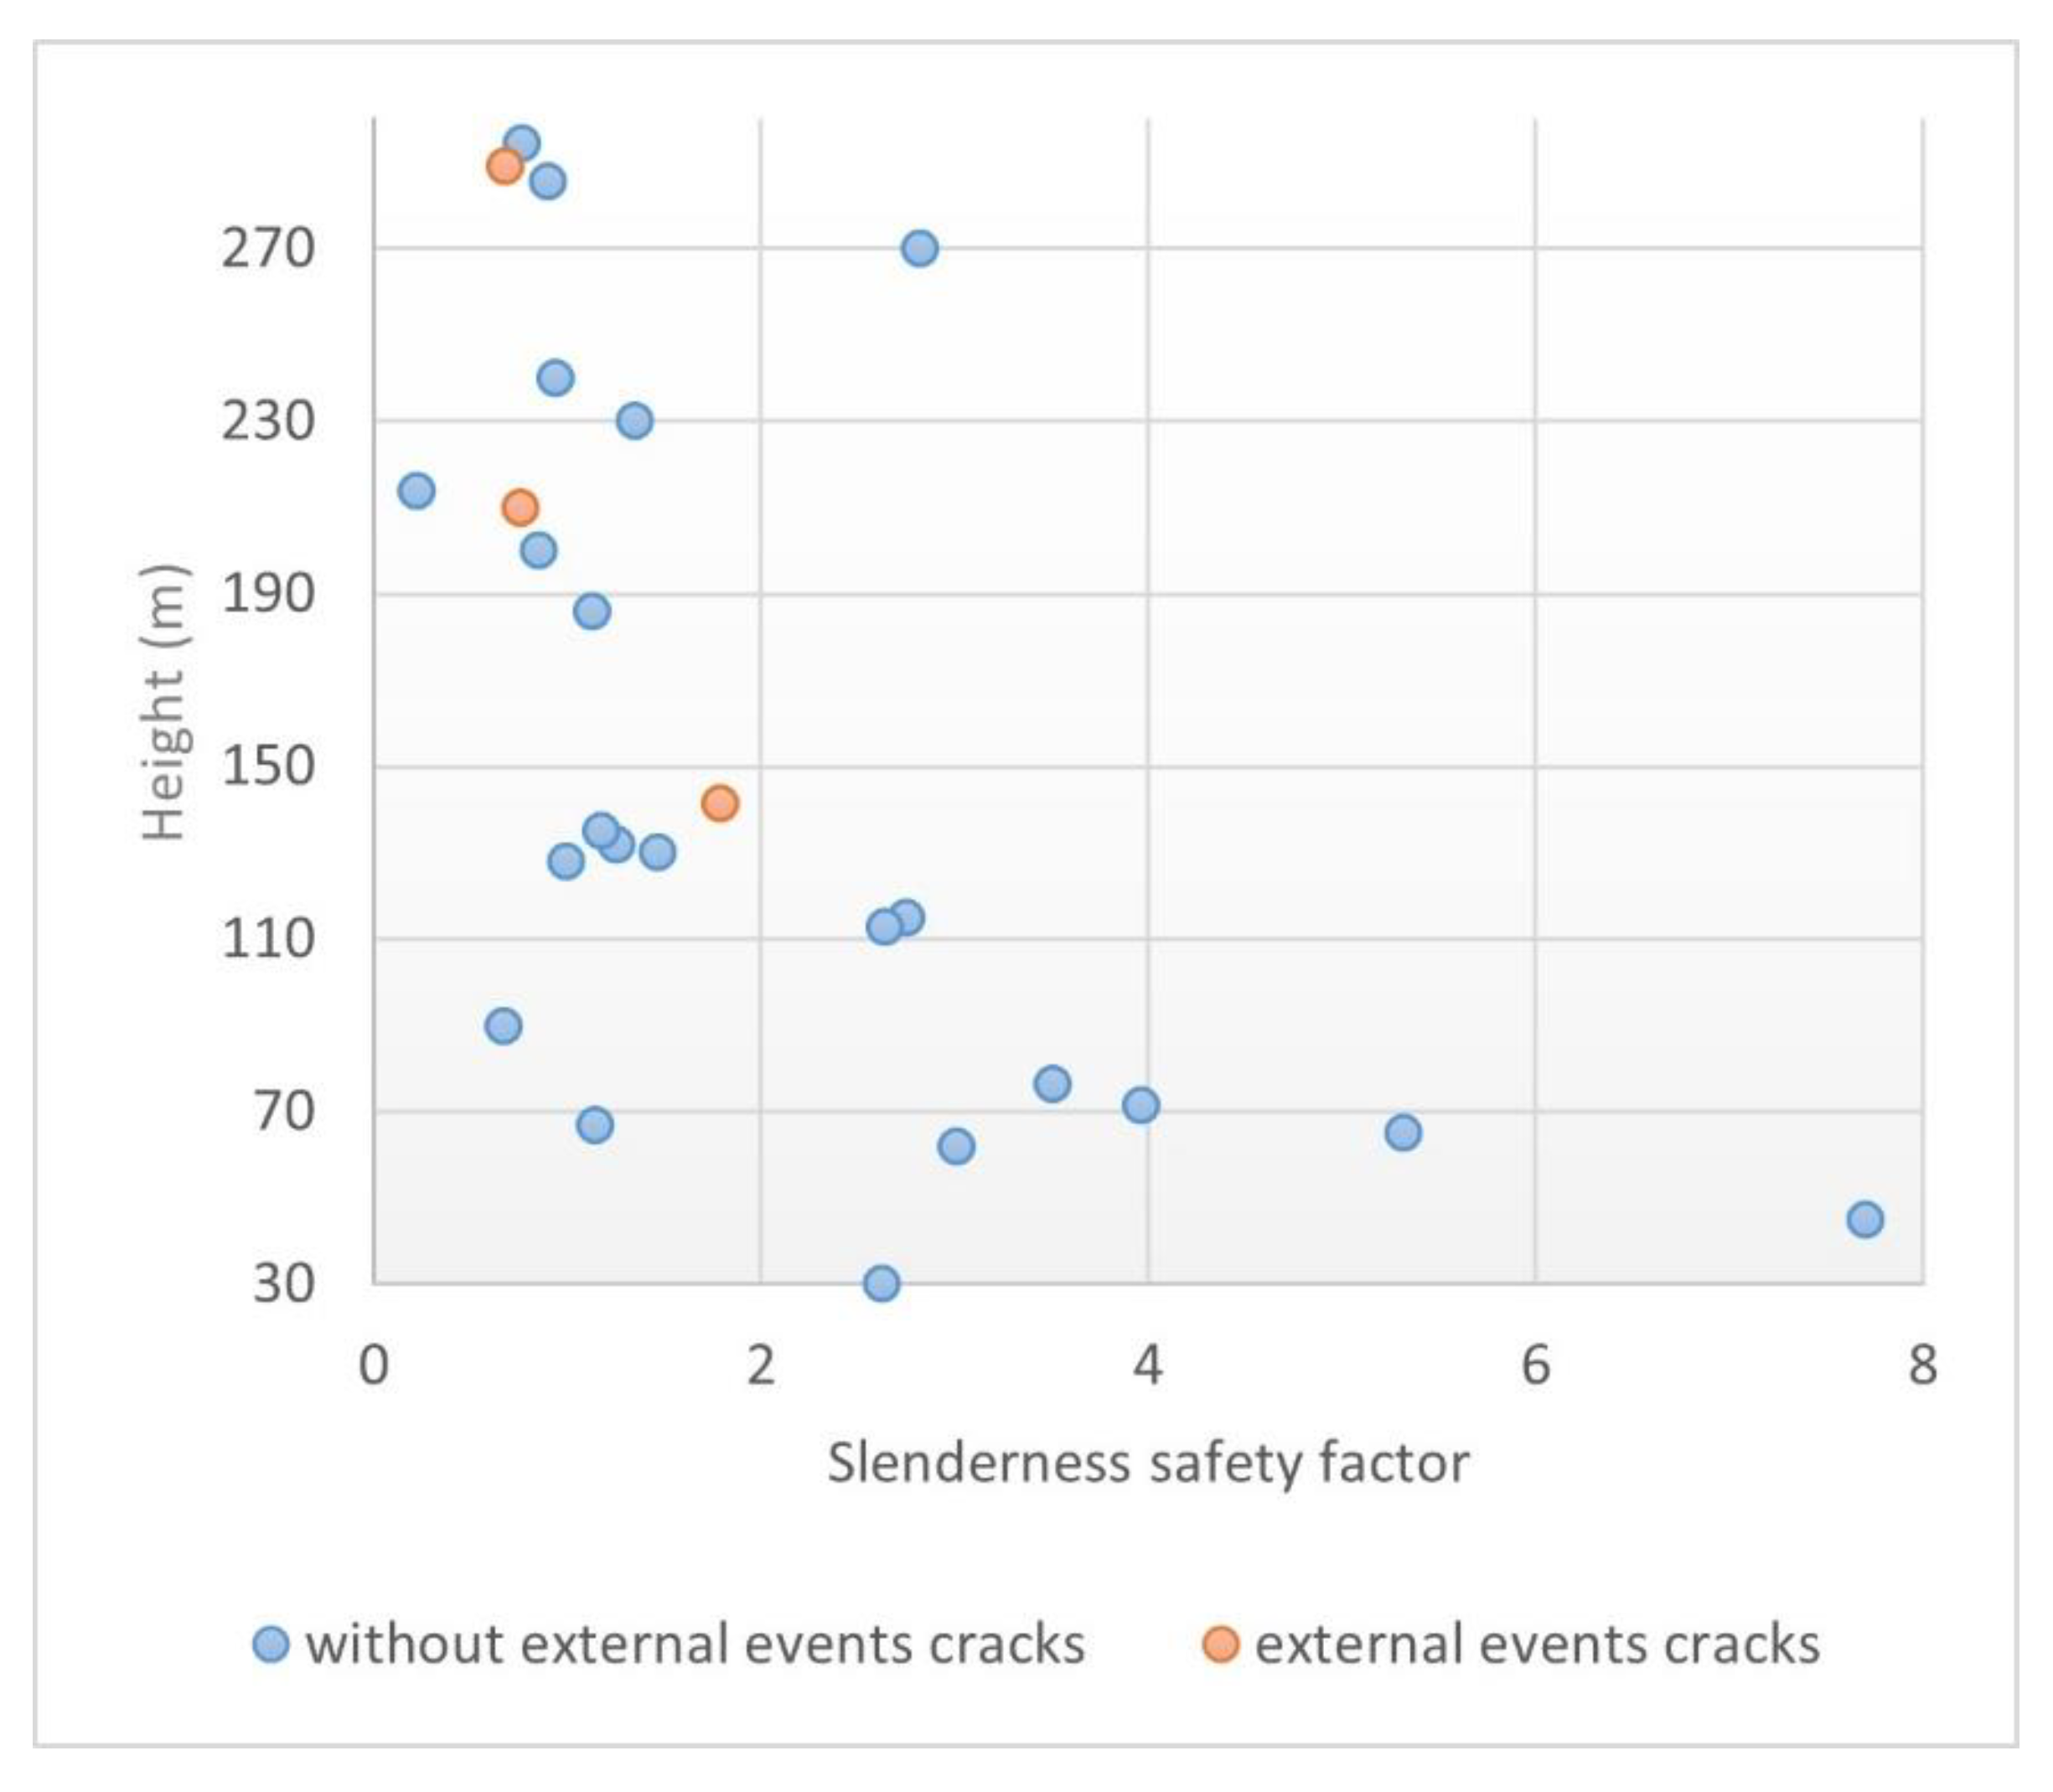
- Regarding the cracked gravity-arch dams, none of them experienced cracks due to external events. Of course, all of them have low slenderness and comply with the Lombardi slenderness limit;
- All the low-height cracked dams comply with the Lombardi slenderness limit;
- Most of the dams (80%) cracked due to external events suffered internal cracks;
- None of the single-curvature thin dams developed internal cracks, and all of them developed cracks on the downstream face. All of them are of low-to-medium height.
4. Conclusions
- Most of the cracked dams have a thermal amplitude higher than 23°;
- Cracks due to chemical reactions generally occur at the downstream face or inside the dam body;
- Single-curvature thin dams do not usually have internal cracks;
- Gravity-arch dams tend to crack in the central zone of the dam upstream and in the central or crest zone of the downstream face.
Author Contributions
Funding
Data Availability Statement
Acknowledgments
Conflicts of Interest
References
- ICOLD World Register of Dams. General Synthesis. Number of Dams by Country Members. Available online: https://www.icold-cigb.org/article/GB/world_register/general_synthesis/number-of-dams-by-country (accessed on 1 August 2024).
- ASCE Report Card for America’s Infrastructure; ASCE: Reston, VA, USA, 2021.
- Hariri-Ardebili, M.A.; Saouma, V.E. Seismic Fragility Analysis of Concrete Dams: A State-of-the-Art Review. Eng. Struct. 2016, 128, 374–399. [Google Scholar] [CrossRef]
- Hariri-Ardebili, M.A. MCS-Based Response Surface Metamodels and Optimal Design of Experiments for Gravity Dams. Struct. Infrastruct. Eng. 2018, 14, 1641–1663. [Google Scholar] [CrossRef]
- Wei, P.; Lin, P.; Peng, H.; Yang, Z.; Qiao, Y. Analysis of Cracking Mechanism of Concrete Galleries in a Super High Arch Dam. Eng. Struct. 2021, 248, 113227. [Google Scholar] [CrossRef]
- Jonker, M.; Espandar, R. Evaluation of Existing Arch Dam Design Criteria in Lieu of ANCOLD Guidelines. In Proceedings of the ANCOLD 2008 Conference, Gold Coast, Australia, 12–16 November 2008. [Google Scholar]
- Santillán, D. Mejora de Los Modelos Térmicos de Las Presas Bóveda En Explotación. Aplicación al Análisis Del Efecto Del Cambio Climático. Ph.D. Theis, Universidad Politécnica de Madrid, Madrid, Spain, 2014. [Google Scholar]
- Salazar, F.; Vicente, D.J.; Irazábal, J.; de-Pouplana, I.; San Mauro, J. A Review on Thermo-Mechanical Modelling of Arch Dams During Construction and Operation: Effect of the Reference Temperature on the Stress Field. Arch. Comput. Methods Eng. 2020, 27, 1681–1707. [Google Scholar] [CrossRef]
- Segarra, J. Envejecimiento de Presas Por Reacciones Expansivas En El Hormigón. Bachelor’s Thesis, Universidad Politécnica de Cataluña, Barcelona, Spain, 2005. [Google Scholar]
- Sharma, R.P.; PerezSaiz, M.A.; Pujol, A.; Melbinger, R.; Lampa, J.; Moore, D.; Poupart, M.; Bonaldi, P.; Shibata, I.; Mori, Y.; et al. Automated Dam Monitoring Systems: Guidelines and Case Histories; ICOLD: Paris, France, 2000. [Google Scholar]
- Tarbox, G.S.; Charlwood, R.; Hayes, C. Investigating the Structural Safety of Cracked Concrete Dams; In Proceedings of the 37th Annual USSD Conference, Anaheim, USA, 3 - 7 April 2017.
- Lin, P.; Zhou, W.; Liu, H. Experimental Study on Cracking, Reinforcement, and Overall Stability of the Xiaowan Super-High Arch Dam. Rock. Mech. Rock. Eng. 2015, 48, 819–841. [Google Scholar] [CrossRef]
- Salazar, F.; Morán, R.; Toledo, M.Á.; Oñate, E. Data-Based Models for the Prediction of Dam Behaviour: A Review and Some Methodological Considerations. Arch. Comput. Methods Eng. 2017, 24, 1–21. [Google Scholar] [CrossRef]
- Jansen, R.B. Advanced Dam Engineering for Design, Construction, and Rehabilitation; VAN NOSTRAND REINHOLD: New York, NY, USA, 1988. [Google Scholar]
- Sarkaria, G.S. Lessons from Serious Incidents at Seven Arch Dams. In Proceedings of the Annual Conference of the Association of State Dam Safety Officials, Pittsburgh, PA, USA, 9 January 1997. [Google Scholar]
- FERC Arch Dams. In Engineering Guidelines for the Evaluation of Hydropower Projects; Federal Energy Regulatory Commission Division of Dam Safety and Inspections: Washington, DC, USA, 1999.
- Bisús, I.; Baena, C.M. Análisis Del Coeficiente de Esbeltez En Presas Bóveda Con La Fórmula de Lombardi; SPANCOLD: Madrid, Spain, 2014. [Google Scholar]
- Hariri-Ardebili, M.A.; Seyed-Kolbadi, S.M. Seismic Cracking and Instability of Concrete Dams: Smeared Crack Approach. Eng. Fail. Anal. 2015, 52, 45–60. [Google Scholar] [CrossRef]
- Alonso, M.E.; Baena, C.M. Análisis de La Fisuración En Presas Bóveda. Ejemplos de Rehabilitación. Master’s Thesis, SPANCOLD, Madrid, Spain, 2017. [Google Scholar]
- Baena, C.M. Propuesta de Actualización de Los Límites Del Coeficiente de Esbeltez En Presas Bóvedas. In Proceedings of the 11 Jornadas de Presas; SPANCOLD: León, France, 2018. [Google Scholar]
- Lin, P.; Wei, P.; Wang, W.; Huang, H. Cracking Risk and Overall Stability Analysis of Xulong High Arch Dam: A Case Study. Appl. Sci. 2018, 8, 2555. [Google Scholar] [CrossRef]
- Chen, B.; Huang, Z.; Liu, C.; Wu, Z. Spatio-temporal Data Mining Method for Joint Cracks in Concrete Dam Based on Association Rules. Struct. Control Health Monit. 2022, 29, e2848. [Google Scholar] [CrossRef]
- Henriques, M.J.; Lima, J.N.; Oliveira, S.B. Measurement of Inclinations in Cabril Dam: Results of a Test Using an Optoelectronic Sensor. In Proceedings of the 6th International Conference on Dam Engineering, Lisbon, Portugal, 15–17 February 2011. [Google Scholar]
- Faria, R.; Oliveira, S.; Silvestre, A.L. A Fluid-Structure Interaction Model for Dam-Water Systems: Analytical Study and Application to Seismic Behavior. Adv. Math. Phys. 2019, 2019, 8083906. [Google Scholar] [CrossRef]
- Oliveira, S.; Alegre, A. Seismic and Structural Health Monitoring of Cabril Dam. Software Development for Informed Management. J. Civ. Struct. Health Monit. 2020, 10, 913–925. [Google Scholar] [CrossRef]
- Oliveira, S.; Alegre, A.; Carvalho, E.; Mendes, P.; Proença, J. Seismic and Structural Health Monitoring Systems for Large Dams: Theoretical, Computational and Practical Innovations. Bull. Earthq. Eng. 2022, 20, 4483–4512. [Google Scholar] [CrossRef]
- Alegre, A.; Oliveira, S.; Mendes, P.; Proença, J.; Ramos, R.; Carvalho, E. Seismic Safety Assessment of Arch Dams Using an ETA-Based Method with Control of Tensile and Compressive Damage. Water 2022, 14, 3835. [Google Scholar] [CrossRef]
- Cabaço, G.; Oliveira, S.; Alegre, A.; Marcelino, J.; Manso, J.; Marques, N. Analysis of Dam Natural Frequencies Using a Convolutional Neural Network. In Proceedings of the 22nd EPIA Conference on Artificial Intelligence, Faial Island, Portugal, 5–8 September 2023; pp. 227–238. [Google Scholar]
- Oliveira, S.; Alegre, A. Seismic and Structural Health Monitoring of Dams in Portugal. In Seismic Structural Health Monitoring; Springer: Cham, Switzerland, 2019; pp. 87–113. [Google Scholar] [CrossRef]
- Alonso, M.E.; Baena, C.M. Fisuraciones En Presas Bóveda. Causas y Ejemplos de Reparación. In Proceedings of the 12 Congreso de Spancold; Comité Nacional Español De Grandes Presas: Gran Canaria, Spain, 2021. [Google Scholar]
- SACYR Estado de Las Bóvedas y Fisuras Detectadas. Presas Del Pontón Alto y Castro de Las Cogotas; SACYR Conservación: Madird, Spain, 2022. [Google Scholar]
- Bao, T.; Yu, H. Detection of Subcritical Crack Propagation for Concrete Dams. Sci. China Ser. E Technol. Sci. 2009, 52, 3654–3660. [Google Scholar] [CrossRef]
- Chen, B.; Wu, Z.; Liang, J.; Dou, Y. Time-Varying Identification Model for Crack Monitoring Data from Concrete Dams Based on Support Vector Regression and the Bayesian Framework. Math. Probl. Eng. 2017, 2017, 5450297. [Google Scholar] [CrossRef]
- Hu, J.; Wu, S. Statistical Modeling for Deformation Analysis of Concrete Arch Dams with Influential Horizontal Cracks. Struct. Health Monit. 2019, 18, 546–562. [Google Scholar] [CrossRef]
- Li, Y.; Bao, T.; Shu, X.; Gao, Z.; Gong, J.; Zhang, K. Data-Driven Crack Behavior Anomaly Identification Method for Concrete Dams in Long-Term Service Using Offline and Online Change Point Detection. J. Civ. Struct. Health Monit. 2021, 11, 1449–1460. [Google Scholar] [CrossRef]
- Hill, C.J. Gene Wash and Copper Basin Dams Are Surviving Alkali-Aggregate Reaction. In Proceedings of the 2nd International Conference on Alkali—Aggregate Reactions in Hydroelectric Plants and Dams, Chattanooga, TN, USA, 22–27 December 1995; pp. 275–288. [Google Scholar]
- Zhuang, D.; Ma, K.; Tang, C.; Cui, X.; Yang, G. Study on Crack Formation and Propagation in the Galleries of the Dagangshan High Arch Dam in Southwest China Based on Microseismic Monitoring and Numerical Simulation. Int. J. Rock Mech. Min. Sci. 2019, 115, 157–172. [Google Scholar] [CrossRef]
- Ait-Ssi, L.; Villeneuve, J.-P.; Rouleau, A. Utilisation d’un Modèle Stochastique de Réseaux de Fractures Pour Étudier Les Propriétés Hydrauliques d’un Massif Fissuré. Can. Geotech. J. 1989, 26, 313–323. [Google Scholar] [CrossRef]
- Roberge, M. Utilisation Des Élements Distincts Pour Évaluer La Réponse Hydromi~aniqued Es Barrages En Beton et Simuler l’injection Des Fissures. Master’s thesis, École Polytechnique De Montréal, Montreal, QC, Canada, 1998. [Google Scholar]
- Zhao, W.D. Statistical Analysis of Monitoring Data for Daniel Johnson Dam. Master’s Thesis, McGill University: Montreal, QC, Canada, 2003. [Google Scholar]
- Quirion, M. Daniel–Johnson Multiple Arch Dam, Québec, Canada—Rock Foundation Safety Assessment. In Proceedings of the International Symposium on Rock, Mechanics, Montreal, QC, Canada, 10–13 May 2015. [Google Scholar]
- Gauron, O.; Boivin, Y.; Ambroise, S.; Saidou Sanda, A.; Bernier, C.; Paultre, P.; Proulx, J.; Roberge, M.; Roth, S.-N. Forced-Vibration Tests and Numerical Modeling of the Daniel-Johnson Multiple-Arch Dam. J. Perform. Constr. Facil. 2018, 32, 04017137. [Google Scholar] [CrossRef]
- Li, Z.; Wang, J.; Bao, T.; Hou, H. Improved Safety Monitoring Model of Crack in Concrete Dams. In Proceedings of the Earth and Space 2010: 12 ASCE Aerospace Division International Conference on Engineering, Science, Construction, and Operations in Challenging Environments; American Society of Civil Engineers: Reston, VA, USA, 2010. [Google Scholar]
- Gu, C.; Li, Z.; Xu, B. Abnormality Diagnosis of Cracks in the Concrete Dam Based on Dynamical Structure Mutation. Sci. China Technol. Sci. 2011, 54, 1930–1939. [Google Scholar] [CrossRef]
- Bao, T.; Qin, D.; Zhou, X.; Wu, G. Abnormality Monitoring Model of Cracks in Concrete Dams. Sci. China Technol. Sci. 2011, 54, 1914–1922. [Google Scholar] [CrossRef]
- Gu, C.; Qin, D.; Li, Z.; Zheng, X. Study on Semi-Parametric Statistical Model of Safety Monitoring of Cracks in Concrete Dams. Math. Probl. Eng. 2013, 2013, 874629. [Google Scholar] [CrossRef]
- Li, Z.; Gu, C.; Wu, Z. Nonparametric Change Point Diagnosis Method of Concrete Dam Crack Behavior Abnormality. Math. Probl. Eng. 2013, 2013, 969021. [Google Scholar] [CrossRef]
- Li, Z.; Gu, C.; Wang, Z.; Wu, Z. On-Line Diagnosis Method of Crack Behavior Abnormality in Concrete Dams Based on Fluctuation of Sequential Parameter Estimates. Sci. China Technol. Sci. 2015, 58, 415–424. [Google Scholar] [CrossRef]
- Zhang, J.; Gu, C. Crack-Considered Elastic Net Monitoring Model of Concrete Dam Displacement. Math. Probl. Eng. 2021, 2021, 6950538. [Google Scholar] [CrossRef]
- Enzell, J.; Tollsten, M. Thermal Cracking of a Concrete Arch Dam Due to Seasonal Temperature Variations. Master’s Thesis, Master of Science Degree Project, Royal Institute of Technology (KTH), Stockholm, Sweden, 2017. [Google Scholar]
- Hjalmarsson, F.; Pettersson, F. Finite Element Analysis of Cracking of Concrete Arch Dams Due to Seasonal Temperature Variation. Master’s Thesis, Lund University, Lund, Sweden, 2017. [Google Scholar]
- Malm, R.; Hellgren, R.; Ekström, T.; Fu, C. Description and Synthesis of Theme A. In Proceedings of the 14th ICOLD International Benchmark Workshop on Numerical Analysis of Dams; Malm, R., Hassanzadeh, M., Hellgren, R., Eds.; KTH Civil and Architectural Engineering: Stockholm, Sweden, 2018. [Google Scholar]
- Malm, R.; Hellgren, R.; Enzell, J. Lessons Learned Regarding Cracking of a Concrete Arch Dam Due to Seasonal Temperature Variations. Infrastructures 2020, 5, 19. [Google Scholar] [CrossRef]
- Enzell, J.; Malm, R.; Nordstrom, E. Methods for Assessing the Failure Process of Concrete Dams Founded on Rock; Energiforsk AB: Stockholm, Sweden, 2021. [Google Scholar]
- Enzell, J.; Malm, R.; Tollsten, M. Predicting the Influence of Seasonal Thermally Induced Cracking on a Reinforced Concrete Arch Dam. KSCE J. Civ. Eng. 2022, 26, 2707–2721. [Google Scholar] [CrossRef]
- Lin, P.; Ning, Z.; Shi, J.; Liu, C.; Chen, W.; Tan, Y. Study on the Gallery Structure Cracking Mechanisms and Cracking Control in Dam Construction Site. Eng. Fail. Anal. 2021, 121, 105135. [Google Scholar] [CrossRef]
- Zheng, D.; Huo, Z.; Li, B. Arch-Dam Crack Deformation Monitoring Hybrid Model Based on XFEM. Sci. China Technol. Sci. 2011, 54, 2611–2617. [Google Scholar] [CrossRef]
- Ding, J.; Yang, Q. Simulation and Crack Analysis of the Whole Process of a Roller Compacted Concrete Dam during Construction and Operation. IOP Conf. Ser. Earth Environ. Sci. 2021, 643, 012018. [Google Scholar] [CrossRef]
- Xu, B.; Li, Z.; Zhao, J. Unit Root Analysis Method of Actual Crack Behavior of the Concrete Dam Based on Residuals of the Monitoring Model. Adv. Civ. Eng. 2020, 2020, 8149658. [Google Scholar] [CrossRef]
- Jin, F.; Chen, Z.; Wang, J.; Yang, J. Practical Procedure for Predicting Non-Uniform Temperature on the Exposed Face of Arch Dams. Appl. Therm. Eng. 2010, 30, 2146–2156. [Google Scholar] [CrossRef]
- Malla, S.; Wieland, M. Analysis of an Arch–Gravity Dam with a Horizontal Crack. Comput. Struct. 1999, 72, 267–278. [Google Scholar] [CrossRef]
- Wu, B.; Wu, Z.; Chen, B.; Su, H.; Bao, T.; Wang, S. Crack Status Analysis for Concrete Dams Based on Measured Entropy. Sci. China Technol. Sci. 2016, 59, 777–782. [Google Scholar] [CrossRef]
- ICOLD Theme A. Behaviour Prediction of a Concrete Arch Dam. In Proceedings of the 16th International Benchmark Workshop on Numerical Analysis of Dams, Ljubljana, Slovenia, 5 April 2022. [Google Scholar]
- Sánchez, F.J. Aportación al Análisis y Control de Deformaciones Como Elementos de Prevención de Patologías de Origen Geotécnico. Ph.D. Thesis, Universidad Politécnica de Madrid, Madrid, Spain, 2007. [Google Scholar]
- Li, Y.; Bao, T.; Gao, Z.; Shu, X.; Zhang, K.; Xie, L.; Zhang, Z. A New Dam Structural Response Estimation Paradigm Powered by Deep Learning and Transfer Learning Techniques. Struct. Health Monit. 2022, 21, 770–787. [Google Scholar] [CrossRef]
- Fu, C.; Yao, X.; Li, T.; Shen, H.; Wang, Z.; Jiang, J. Investigation and Evaluation of Increasing Uplift Pressure in an Arch Dam: A Case Study of the Huaguangtan Dam. KSCE J. Civ. Eng. 2014, 18, 1858–1867. [Google Scholar] [CrossRef]
- Lombardi, G.; Bremen, R.; Amberg, F. Long Term Behaviour of Three Arch Dams. In Proceedings of the Sixth Benchmark Workshop on Numerical Analysis of Dams; ICOLD: Salzburg, Austria, 2001. [Google Scholar]
- Pan, J.; Feng, Y.T.; Jin, F.; Zhang, C. Numerical Prediction of Swelling in Concrete Arch Dams Affected by Alkali-Aggregate Reaction. Eur. J. Environ. Civ. Eng. 2013, 17, 231–247. [Google Scholar] [CrossRef]
- Zambezi River Authority Kariba Dam Rehabilitation Project. Environmental and Social Impact Assessment; Zambezi River Authority: Kariba, Zimbabue, 2020. [Google Scholar]
- Amberg, F.; Etaati, H.; Basereh, G. Assessment of Karun IV Abnormal Behavior and Estimated Role of Impervious Clayey Bed within the Foundation. In Proceedings of the 26 Congres des Grands Barrages, Vienne, Austria, 4–6 July 2018. [Google Scholar]
- Lombardi, G. Cracks in Arch Dams and Repair Works. In Proceedings of the Application of Fracture Mechanics to Dam Engineering, Locarno, Switzerland, 17–18 September 1990; pp. 17–18. [Google Scholar]
- Lombardi, G. Kolnbrein Dam A Special Solution for a Special Problem. In Proceedings of the Water Power—ICOLD Issue Vienna; ICOLD: Vienna, Austria, 1991. [Google Scholar]
- Obernhuber, P.; Stering, P.; Zenz, G. Numerical Analysis for the Remedial Works of Kölnbrein Dam. Dam Eng. 1991, 2, 235–251. [Google Scholar]
- Feng, L.M.; Pekau, O.A.; Zhang, C.H. Cracking Analysis of Arch Dams by 3D Boundary Element Method. J. Struct. Eng. 1996, 122, 691–699. [Google Scholar] [CrossRef]
- ICOLD Concrete Dams: Control and Treatment of Cracks; ICOLD: Vienna, Austria, 1997.
- Lombardi, G. Case Histories of Concrete Dams (Structural Cracks). In Proceedings of the International Centre for Mechanical Sciences, Udine, Italy, 14 December 2004. [Google Scholar]
- Jia, J.-S.; Li, X.-Y. Dam Heel Cracking Problem in High Arch Dams and New Measure for Solution. Shuili Xuebao/J. Hydraul. Eng. 2008, 39, 1183–1188. [Google Scholar]
- Bureau of Reclamation. Double-Curvature Arch Dams Planning, Appraisal, Feasibility Level; Bureau of Reclamation: Denver, CO, USA, 2013. [Google Scholar]
- Castañeda, D. Reobservación de La Red Geodésica de Control de La Presa de La Tajera. Bachelor’s Thesis, Universidad Politécnica de Madrid, Madrid, Spain, 2011. [Google Scholar]
- INTECSA. Agua y Medio Ambiente Presas; INTECSA: Madrid, Spain, 2015. [Google Scholar]
- SERS Informe 2a Revisión y Análisis General de La Seguridad de Las Presas y Embalses de Alcorlo, Beleña Pálmaces, El Atance, La Tajera, Entrepeñas y Buendía (Guadalajara y Cuenca); SERS: Zaragoza, Spain, 2016.
- Tanchev, L.; Shulevski, J.; Mitoski, S. Cracks at Matka Arch Dam—A Case Study. In Proceedings of the 26 Congres des Grands Barrages, Vienne, Austria, 4–6 July 2018. [Google Scholar]
- Silvano, R.; Frongia, F.; Mondada, A.; Piazza, A. Repair Works at Flumendosa Arch Dam. In Proceedings of the 19 Congres des Grands Barrages; Commission Internationale des grandes Barrages: Florence, Italy,, 1997. [Google Scholar]
- Silvano, R.; Frongia, F.; Lombardi, G.; Foti, M.; Ciciotti, F.; Gallavresi, F. Rehabilitation of the Flumendosa Arch Dam by Epoxy Grouting. Int. J. Hydropower Dams 1997, 4, 63–67. [Google Scholar]
- Ru, N. Historical Review of the Cracking in Arch Dams. Shuili Xuebao/J. Hydraul. Eng. 1990. [Google Scholar]
- Ghanaat, Y. Failure Modes Approach to Safety Evaluation of Dams. In Proceedings of the 13th World Conference on Earthquake Engineering, Vancouver, BC, Canada, 1–6 August 2004; Canadian Association for Earthquake Engineering: Vancouver, BC, Canada, 2004. [Google Scholar]
- Wang, J.-T.; Lv, D.-D.; Jin, F.; Zhang, C.-H. Earthquake Damage Analysis of Arch Dams Considering Dam–Water–Foundation Interaction. Soil Dyn. Earthq. Eng. 2013, 49, 64–74. [Google Scholar] [CrossRef]
- Wieland, M.; Kirchen, G.F. Long-Term Dam Safety Monitoring of Punt Dal Gall Arch Dam in Switzerland. Front. Struct. Civ. Eng. 2012, 6, 76–83. [Google Scholar] [CrossRef]
- Aleksandrovskaya, E.K. State of the Sayano-Shushenskoe Dam during Fourfold Rise of the Upper Pool Level to the Elevation of the Normal Pool Level. Hydrotech. Constr. 1994, 28, 630–634. [Google Scholar] [CrossRef]
- Ren, H.; Li, T.; Chen, H.; Zhao, L. Nonlinear Simulation of Arch Dam Cracking with Mixed Finite Element Method. Water Sci. Eng. 2008, 1, 88–101. [Google Scholar]
- Li, T.-C.; Chen, H.-F.; Zhang, H.-H.; Niu, Z.-W. Study on Formation Cause of Cracks for Shuanghe Arch Dam. In Proceedings of the 4th International Conference on Dam Engineering—New Developments in Dam Engineering, Nanjing, China, 18 October 2004; Taylor and Francis Group: Abingdon, UK, 2004. [Google Scholar]
- Lin, P.; Guan, J.F.; Li, Q. bin A Real-Time ZigBee-Based Location System in Xiluodu Arch Dam. Appl. Mech. Mater. 2013, 438–439, 1329–1333. [Google Scholar] [CrossRef]
- Cekerevac, C.; Wohnlich, A. Foundation Stability Analysis of Arch Dams. In Proceedings of the Rock Mechanics in Civil and Environmental Engineering; Taylor & Francis Group: London, UK,, 2010. [Google Scholar]
- Mellal, A.; Koliji, A.; Balissat, M. Numerical Modelling Investigation of an Existing Crack within an Arch-Gravity Dam. In Dams and Reservoirs under Changing Challenges; CRC Press: Boca Raton, FL, USA, 2011; pp. 99–106. [Google Scholar]
- Rebollo, A. El Comportamiento de La Presa Bóveda de Susqueda Durante Su Segundo Decenio: 1981–1990. Rev. Obras Públicas 1992, 3315, 15–39. [Google Scholar]
- Río, F.; Fernández, R. Presa de Susqueda. Reinyección de Juntas. In Proceedings of the Dam Maintenance and Rehabilitation II; García, R., Ed.; Taylor and Francis Group: London, UK, 2011. [Google Scholar]
- Fu, S.; He, T.; Wang, G.; Zhang, S.; Zou, L.; Chen, S. Evaluation of Cracking Potential for Concrete Arch Dam Based on Simulation Feedback Analysis. Sci. China Technol. Sci. 2011, 54, 565–572. [Google Scholar] [CrossRef]
- Wang, W.; Ding, J.; Wang, G.; Zou, L.; Chen, S. Stability Analysis of the Temperature Cracks in Xiaowan Arch Dam. Sci. China Technol. Sci. 2011, 54, 547–555. [Google Scholar] [CrossRef]
- Zhuan-Yun, Y. Shaking Table Model Test on Xiluodu Arch Dam. Electron. J. Geotech. Eng. 2014, 19 K, 2607–2621. [Google Scholar]
- Fan, Q.; Zhou, S.; Yang, N. Optimization Design of Foundation Excavation for Xiluodu Super-High Arch Dam in China. J. Rock Mech. Geotech. Eng. 2015, 7, 120–135. [Google Scholar] [CrossRef]
- Shi, J.; Lin, P.; Zhou, Y.; Wei, P.; Wang, R. Reinforcement Analysis of Toe Blocks and Anchor Cables at the Xiluodu Super-High Arch Dam. Rock. Mech. Rock. Eng. 2018, 51, 2533–2554. [Google Scholar] [CrossRef]
- Yin, T.; Li, Q.; Hu, Y.; Yu, S.; Liang, G. Coupled Thermo-Hydro-Mechanical Analysis of Valley Narrowing Deformation of High Arch Dam: A Case Study of the Xiluodu Project in China. Appl. Sci. 2020, 10, 524. [Google Scholar] [CrossRef]
- Ma, T.; Feng, Z.; Tang, C.; Lin, P.; Yadav, K.P. Overall Stability Analysis of Xiluodu High Arch Dam Based on Fine Three-Dimension Numerical Modeling. Adv. Civ. Eng. 2021, 2021, 6641974. [Google Scholar] [CrossRef]
- Roulin-moloney, A.C.; Berchten, A.R. The Repair of Concrete Structures by Injection with Epoxide Resin. J. Adhes. 1987, 22, 125–138. [Google Scholar] [CrossRef]
- Lin, P.; Guan, J.; Peng, H.; Shi, J. Horizontal Cracking and Crack Repair Analysis of a Super High Arch Dam Based on Fracture Toughness. Eng. Fail. Anal. 2019, 97, 72–90. [Google Scholar] [CrossRef]
- Perner, F.; Obernhuber, P. Analysis of Arch Dam Deformations. Front. Archit. Civ. Eng. China 2010, 4, 102–108. [Google Scholar] [CrossRef]
- Berkeley Earth. Graphics: Physical Effects of Warming. Available online: http://berkeleyearth.org/archive/graphics/physical-effects-of-warming (accessed on 9 September 2020).


| Problem | Possible Causes | Treatment |
|---|---|---|
| Structural distress | Thermal effects. Chemical effects. External events. Inadequate construction or maintenance. | Structural distress may require reducing the reservoir water level, thus reducing the stresses in the dam. Update risk assessment covering all structural design parameters. Post-stressed tendons. |
| Foundation and abutment behavior | External events. Inadequate construction or maintenance. | Grouting, drainage, post-stressed tendons, shear keys, shotcrete, dental concrete, re-shaping (benching, flattening slopes), toe blocks, berms. |
| Shrinkage | Chemical effects. Thermal effects. | Sealing, epoxy grouting. |
| Thermal distress | Thermal effects. | Cooling, heating, insulation. |
| Freeze–thaw effects | Thermal effects. | Sealing: upstream membrane, shotcrete, restore original lines and grades via build back, epoxy grouting. |
| Expansive chemical reactions | Chemical effects. | Slot cuts: post-stressed tendons, water proofing, membranes, grouting, drainage. |
| Earthquake distress | External events. | Site-specific seismic hazard assessment, pre-stressed tendons, grouting. |
| Corrosion of rebar and embedded parts | Chemical effects. | Chip, saw-cut surrounding concrete to grit blast steel or remove damaged metal and replace steel (epoxy coated rebar) or embedded part and reconcrete. Corrosion inhibitors can also be included in the concrete mix, such as calcium nitrite. |
| Dam | Type | Height (m) | Slenderness | Lombardi Coefficient | Nearby City | Base Elevation (m) | Thermal Amplitude (°C) | Publications | |
|---|---|---|---|---|---|---|---|---|---|
| 1 | Baishan | Single-curvature gravity-arch dam | 149.5 | 7.0 | 20.1 | Baishan Town, Jilin, China | 274.0 | 45 | [22] |
| 2 | Cabril | Double-curvature arch dam | 132 | 18.2 | 22.7 | Pedrógao Grande, Portugal | 165.0 | 28 | [23,24,25,26,27,28,29] |
| 3 | Castro de las Cogotas | Double-curvature arch dam | 67.0 | 39.2 | 44.8 | Mingorría, Avila, Castille and León, Spain | 987.5 | 30 | [17,20,30,31] |
| 4 | Chencun | Single-curvature gravity-arch dam | 76.3 | 11.2 | 39.3 | Pinghu, Anhui, China | 50.0 | 30 | [32,33,34,35] |
| 5 | Copper Basin | Single-curvature thin dam | 57.0 | - | 52.6 | Cienega Springs, Arizona, USA | 257.0 | 36 | [9,16,36] |
| 6 | Dagangshan | Double-curvature arch dam | 210.0 | 18.9 | 14.3 | Shirong, Yaan, Sichuan, China | 925.0 | 24 | [5,12,37] |
| 7 | Daniel-Johnson | Multiple-arch buttress dam | 214.0 | 63.2 | 14.0 | Port-Cartier Côte-Nord, Quebec, Canada | 130.0 | 38 | [21,38,39,40,41,42] |
| - | Dam A | Single-curvature gravity-arch dam | 76.3 | - | 39.3 | - | 50.0 | - | [43,44,45,46,47,48,49] |
| 8 | Dam B | Single-curvature, single-radius thin dam | 40.0 | - | 75.0 | Northern Sweden | - | - | [50,51,52,53,54,55] |
| 9 | Dam C | Double-curvature arch dam | 289.0 | 15.4 | 10.4 | Pisha, Sichuan, China | 545.0 | 27 | [56] |
| 10 | Dam D | Single-curvature gravity-arch dam | 178.0 | 3.6 | 16.9 | Longyangxia, Qinghai, China | 2432.0 | 37 | [57] |
| 11 | Dam E | Single-curvature gravity-arch dam | 100.5 | - | 29.9 | Muang Kasi, Vientiane, Laos | 1002.5 | 18 | [58] |
| 12 | Dam F | Single-curvature gravity-arch dam | 110.0 | - | 27.3 | Bama, Guangxi, China | 123.0 | 25 | [59] |
| - | Dam G | Parabolic double-curvature arch dam | 240.0 | - | 12.5 | - | 965.0 | - | [60] |
| - | Dam H | Single-curvature gravity-arch dam | 45.0 | 8.7 | 66.7 | - | - | - | [5,61] |
| - | Dam I | - | 294.5 | - | 10.2 | - | - | - | [62] |
| 13 | Dam J | Double-curvature compound-arch dam | 270.0 | 3.9 | 11.1 | Laojiezi, Malutangxiang, Yunnan, China | 718.0 | 27 | [5] |
| 14 | Dam K | Double-curvature arch dam | 45.0 | - | 66.7 | South of France | 2000.0 | - | [63] |
| 15 | El Atazar | Double-curvature arch dam | 141.4 | 11.9 | 21.2 | Cervera de Buitrago, Madrid, Spain | 720.0 | 29 | [7,14,17,19,20,30,64] |
| 16 | Ertan | Parabolic double-curvature arch dam | 240.0 | 13.3 | 12.5 | Panlian, Sichuan, China | 965.0 | 27 | [17,21,65] |
| 17 | Gene Wash | Single-curvature thin dam | 40.0 | - | 75.0 | Cienega Springs, Arizona, USA | 185.0 | 36 | [9,16,30,36] |
| 18 | Huaguangtan | Double-curvature arch dam | 103.9 | - | 28.9 | Yutiao, Zhejiang, China | 345.0 | 31 | [66] |
| 19 | Isola | Single-curvature gravity-arch dam | 45.0 | 8.7 | 66.7 | Braggio, Switzerland | 1550.0 | 27 | [67] |
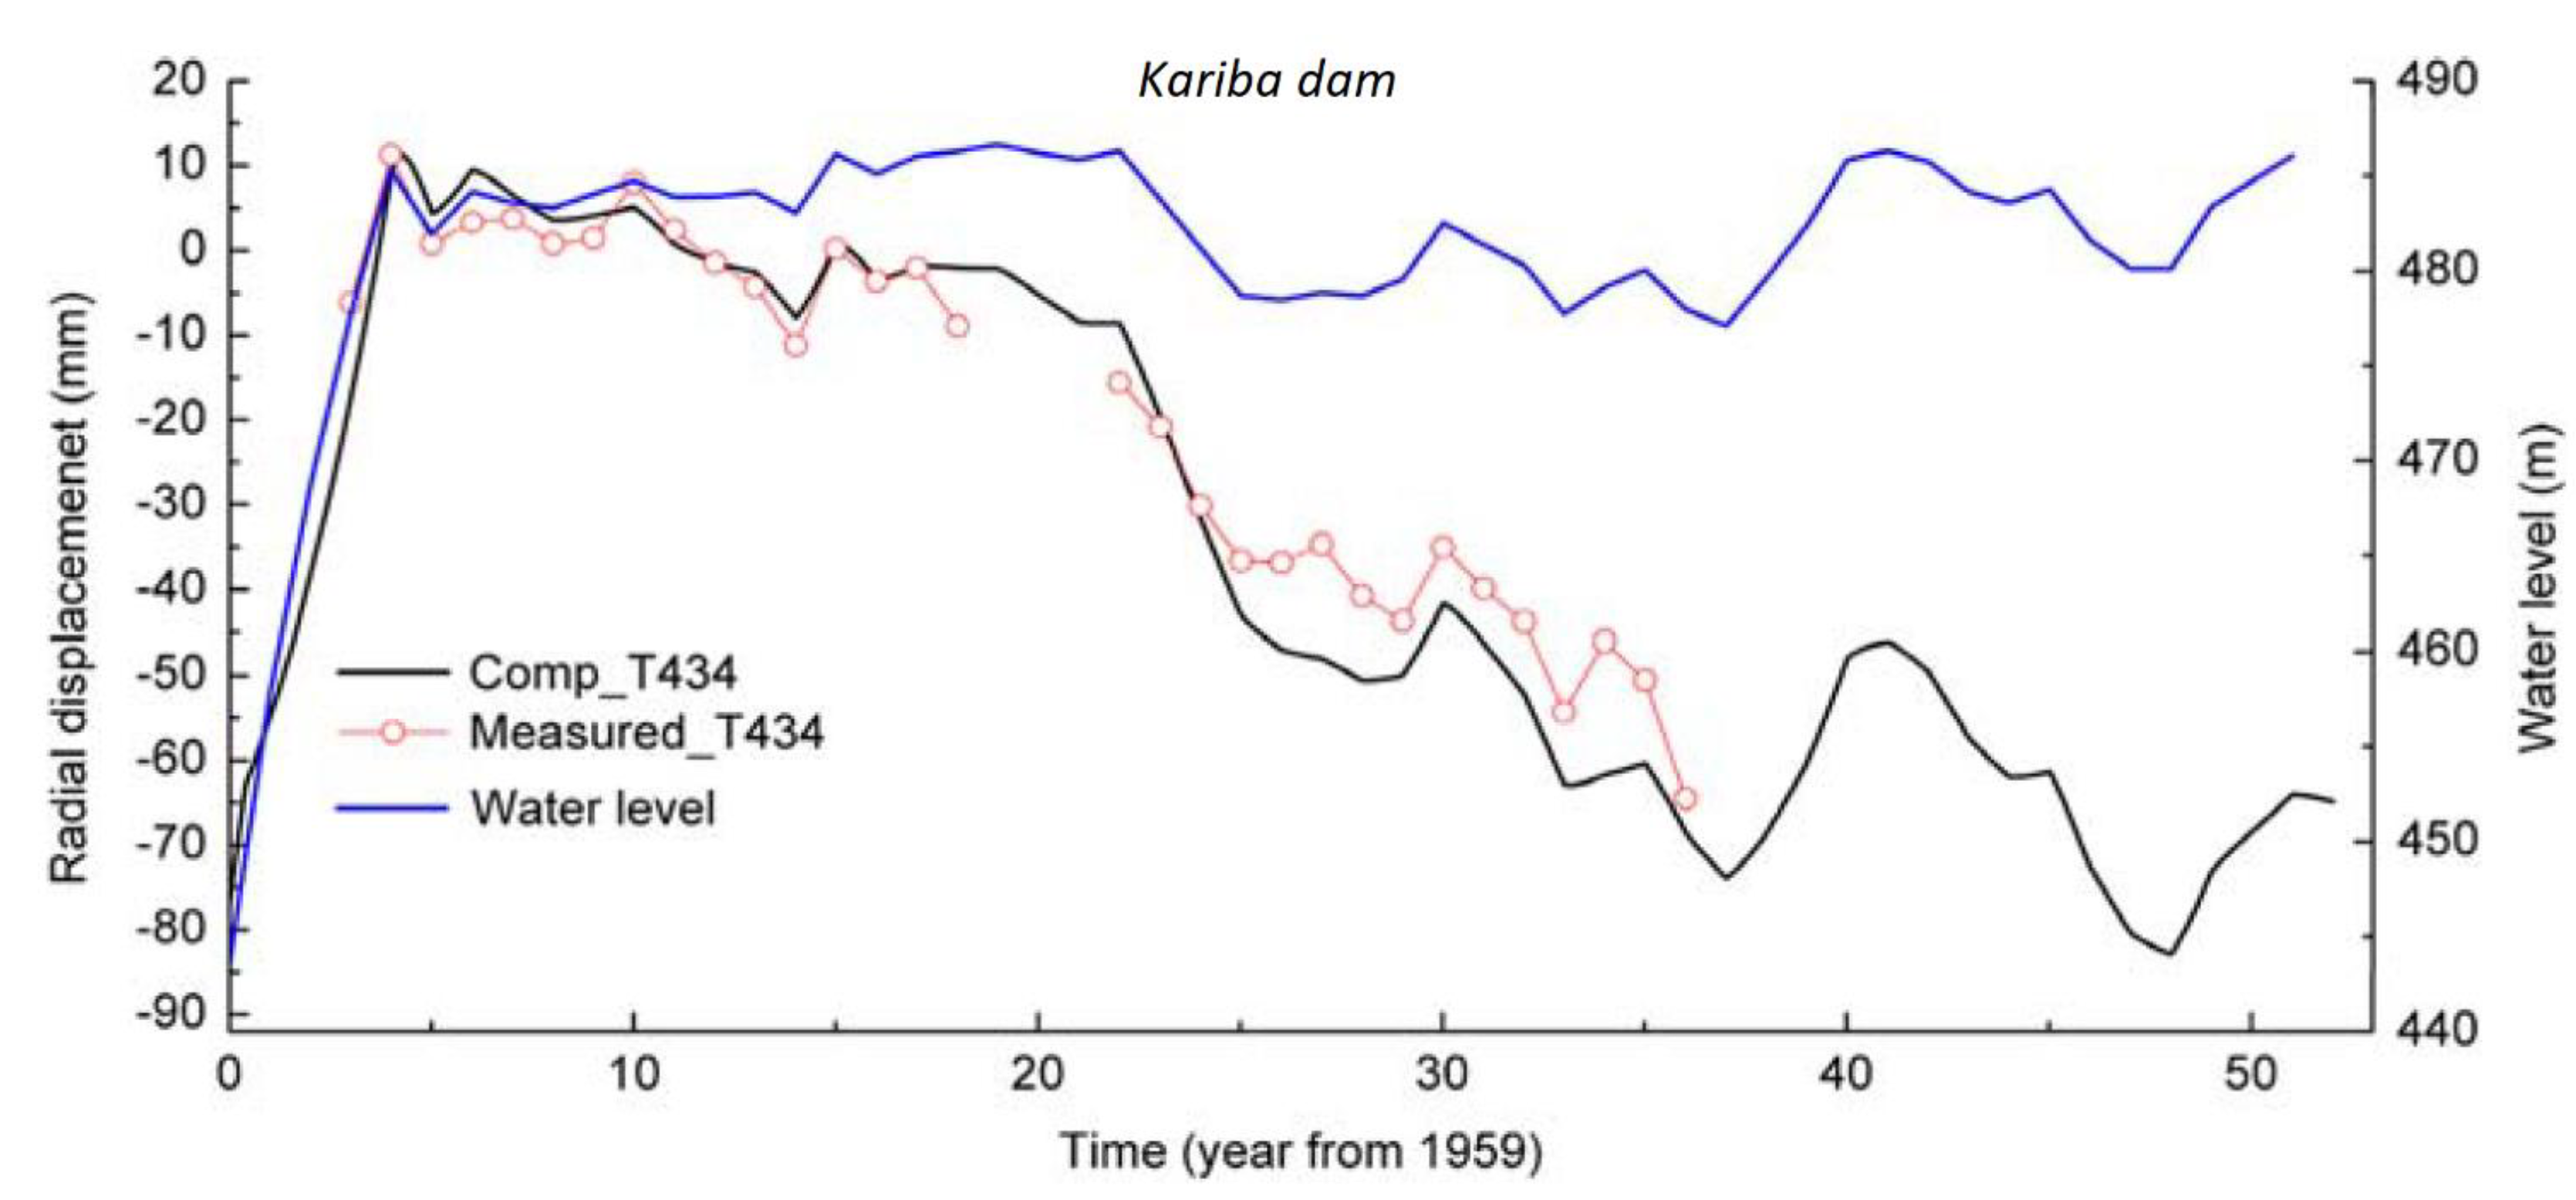
| 20 | Kariba | Double-curvature arch dam | 128.0 | 23.6 | 23.4 | Kariba, Mashonaland West, Zimbabue | 593.0 | 21 | [14,19,68,69] |
| 21 | Karun IV | Double-curvature arch dam | 230.0 | 9.7 | 13.0 | Lordegān, Chaharmahal and Bakhtiari, Iran | 680.0 | 38 | [20,70] |
| 22 | Kolnbrein | Double-curvature arch dam | 200.0 | 17.7 | 15.0 | Mauterndorf, Austria | 1702.0 | 29 | [6,14,15,17,19,21,30,71,72,73,74,75,76,77,78] |
| 23 | Kromme-Churchill | Multiple-arch dam | 39.5 | - | 75.9 | Kareedouw, Sudáfrica | 120.0 | 18 | [9] |
| 24 | La Tajera | Double-curvature arch dam | 62.0 | 16.1 | 48.4 | Masegoso de Tajuña, Guadalajara, Spain | 920.0 | 31 | [17,19,30,79,80,81] |
| 25 | Matka | Double-curvature arch dam | 30.0 | 38.1 | 100.0 | Bukovikj, Macedonia | 289.4 | 33 | [82] |
| 26 | Nuraghe Arrubiu-Flumendosa | Double-curvature arch dam | 115.0 | 9.5 | 26.1 | Escalaplano, Provincia di Cagliari, Italy | 155.0 | 27 | [19,30,71,76,83,84] |
| 27 | Pacoima | Double-curvature arch dam | 112.0 | - | 26.8 | San Fernando, Los Ángeles, California, USA | 1990.0 | 25 | [3,6,15,16,19,30,85,86,87] |
| 28 | Punt dal Gall | Double-curvature arch dam | 130.0 | 15.8 | 23.1 | Aprica, Provincia di Sondrio, Italy | 1675.6 | 25 | [5,88] |
| 29 | Quiebrajano | Double-curvature arch dam | 71.5 | 10.6 | 42.0 | La Guardia de Jaén, Spain | 720.0 | 35 | [7,17,19,30] |
| 30 | Sayano-Shushenskaya | Single-curvature gravity-arch dam | 242.0 | - | 12.4 | Mayna, Jakasia, Rusia | 270.0 | 45 | [21,77,89] |
| 31 | Shuanghe | Hyperbolic double-curvature dam | 65.0 | 8.7 | 46.2 | Laitan, Chongqing, China | 487.3 | 26 | [21,90,91,92] |
| 32 | Spitallamm | Single-curvature gravity-arch dam | 113.0 | 10.1 | 26.5 | Sarnen, Obwalden, Suiza | 1800.0 | 26 | [93,94] |
| 33 | Susqueda | Double-curvature arch dam | 135.0 | 19.0 | 22.2 | La Cellera de Ter, Girona, Catalonia, Spain | 222.0 | 29 | [17,19,30,95,96] |
| 34 | Tolla | Single-curvature thin-arch dam | 90.0 | 50.0 | 33.3 | Peri, Corsica, France | 490.0 | 24 | [6,14,15,19,30,85] |
| 35 | Xiaowan | Double-curvature arch dam | 294.5 | 13.4 | 10.2 | Fengshan Village, Yunnan, China | 950.5 | 24 | [5,12,17,21,97,98] |
| 36 | Xiluodu | Double-curvature arch dam | 285.5 | 11.7 | 10.5 | Xiluodu, Zhaotong, Yunnan, China | 324.5 | 28 | [5,12,17,92,99,100,101,102,103] |
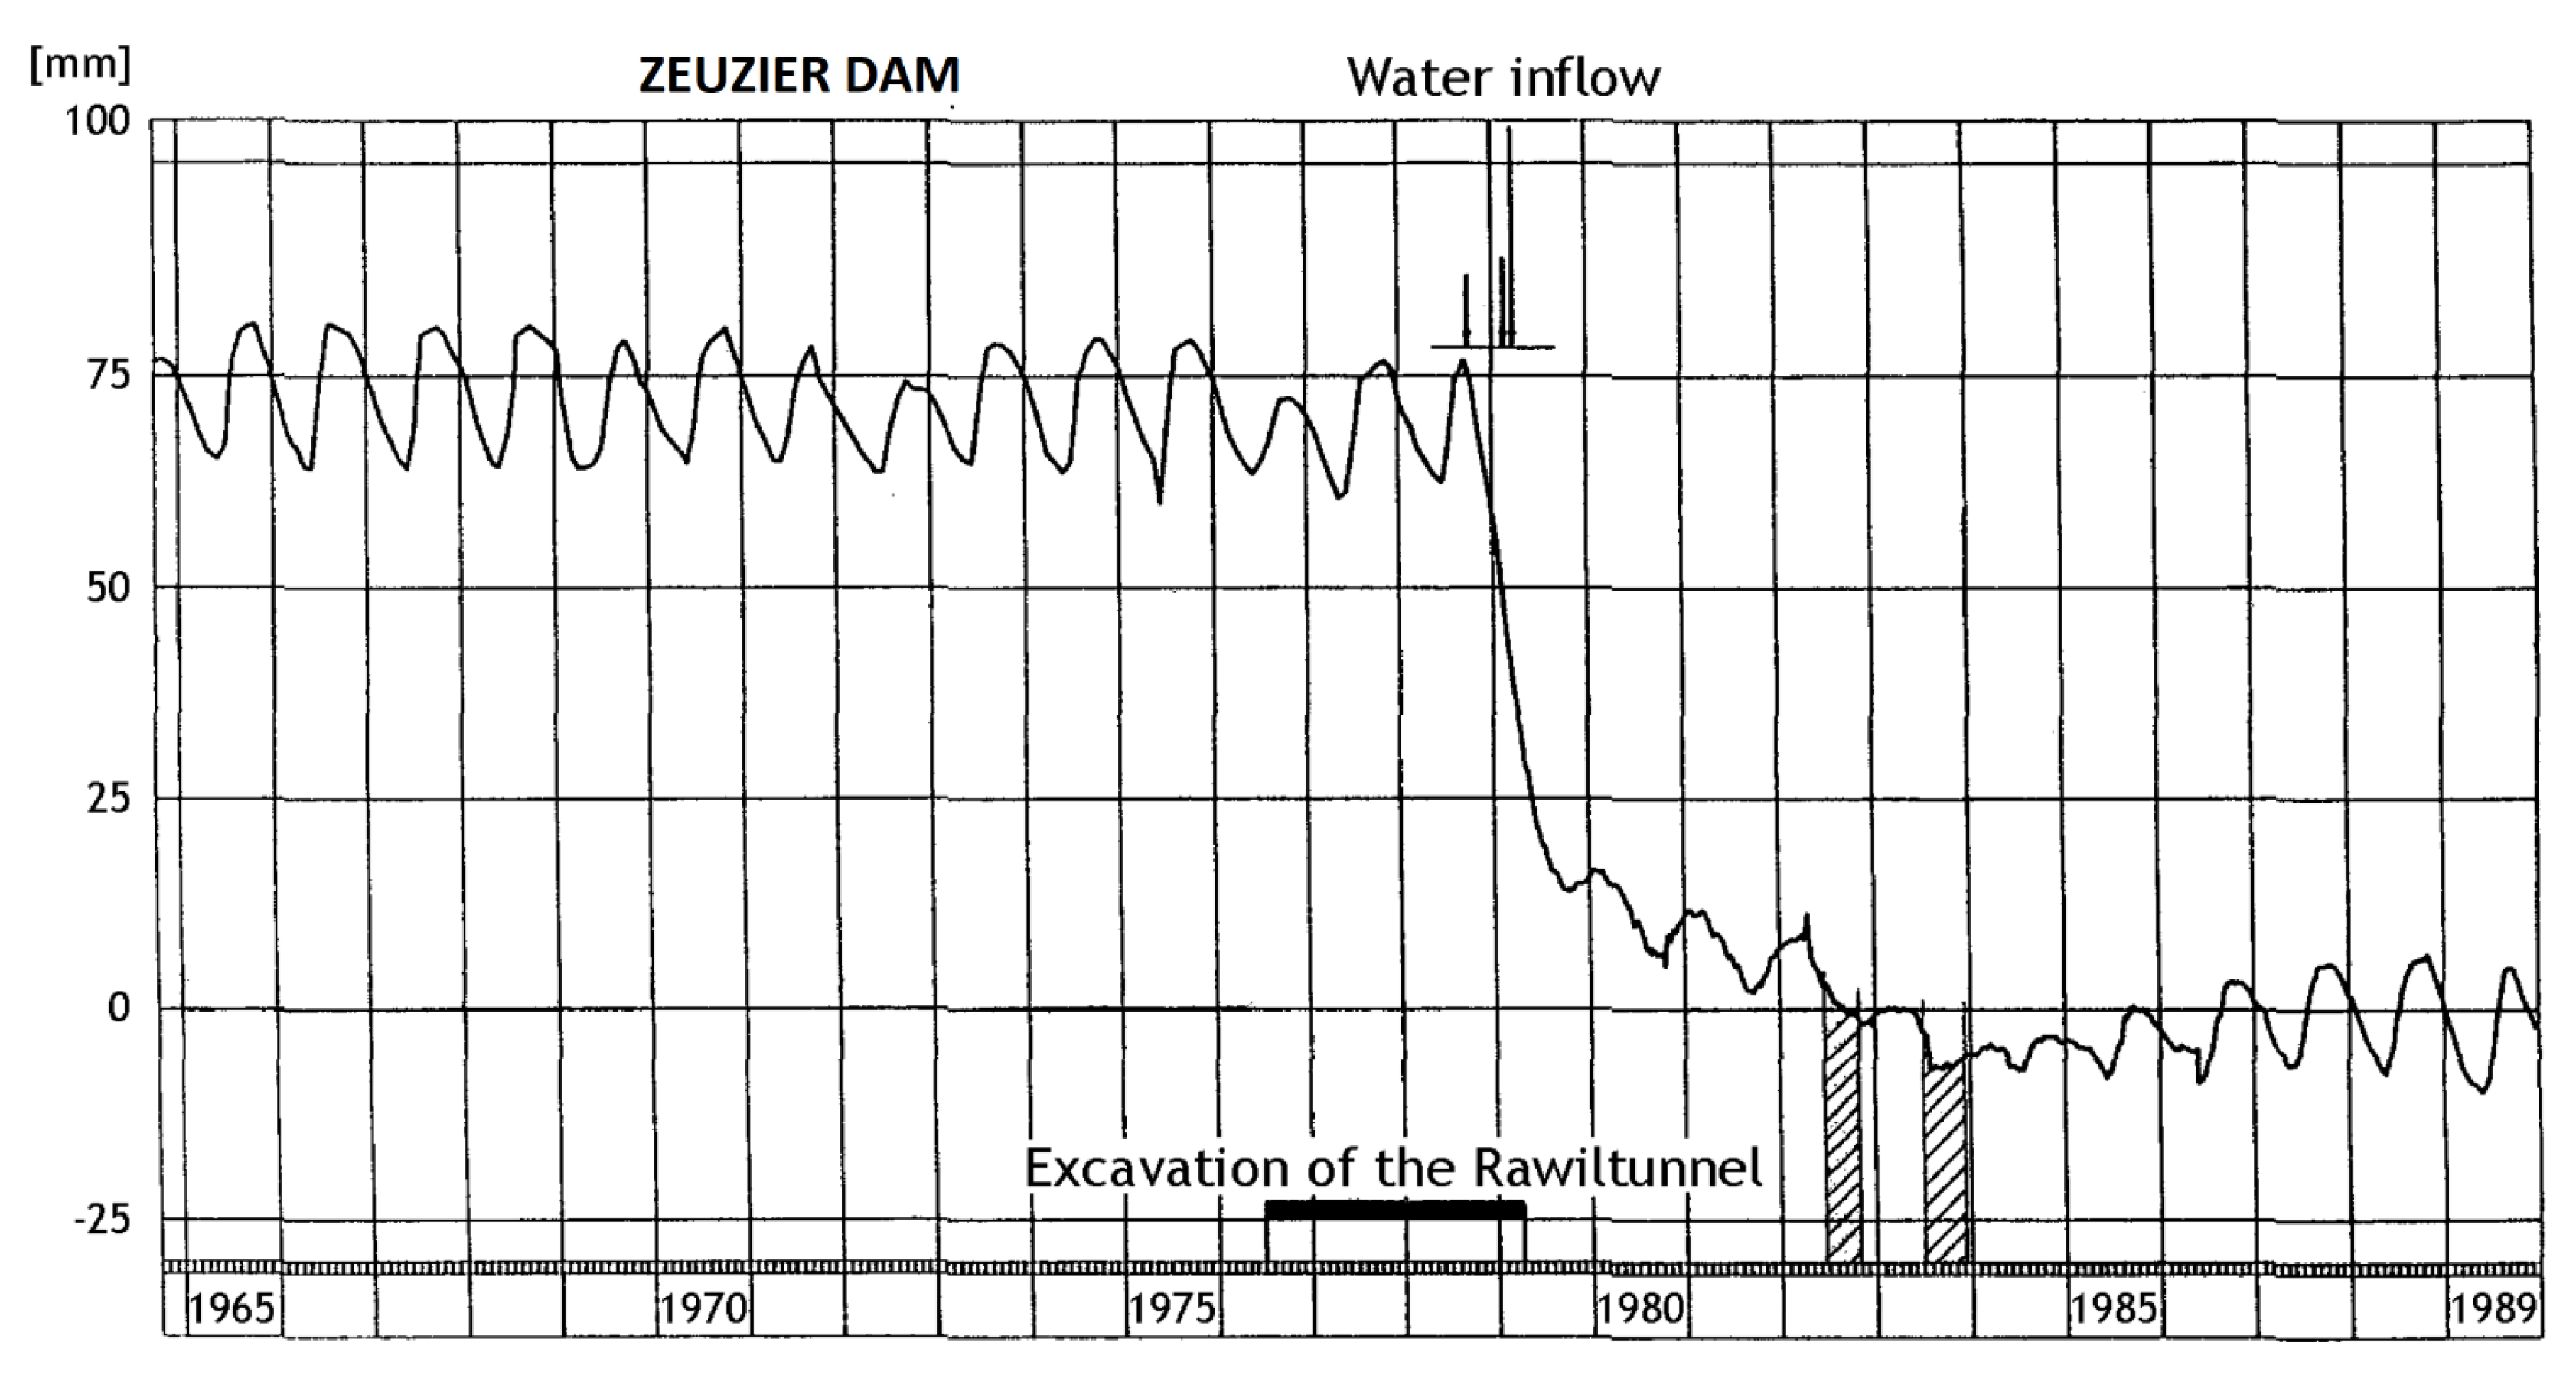
| 37 | Zeuzier | Double-curvature arch dam | 156.0 | - | 19.2 | Montana, Sierre District, Valais, Switzerland | 1623.0 | 26 | [5,14,15,19,20,30,67,71,76,85,104,105] |
| 38 | Zillergrundl | Double-curvature arch dam | 186.0 | 14.3 | 16.1 | Rohrberg, Politischer Bezirk Schwaz, Tyrol, Austria | 1650.0 | 27 | [17,19,21,30,71,77,78,106] |
| Dam | Main Causes of Cracking | Cracked Zone | Location of Cracks | Crack Dimensions | Published Records | |
|---|---|---|---|---|---|---|
| 1 | Baishan | - | Downstream surface | Along the entire surface. | Max. width: 3.5 mm. | Evolution of crack opening of 24 cracks. |
| 2 | Cabril | Inadequate design or execution of the construction. The change in the project during the construction phase lead to a more rigid crest. | Upstream surface. | Horizontal at the top. At 112–122 m above the dam base. | - | Precise placement of the cracks. Displacements on the central cantilever. |
| 3 | Castro de las Cogotas | Thermal effects. Shrinkage coupled with thermal gradients. | Internal. | Between the downstream face and the perimeter gallery. | Max. width: 1.3 mm. | Crack opening evolution. |
| 4 | Chencun | Thermal effects. Combination of high air temperature and low reservoir level. Short pouring interval, so the shrinkage deformation of the second phase concrete is under strong constraint. | Downstream surface. | Horizontal at the top. | Max. width: 4 mm. Max. length: 300 m. Max. depth: 5 m. | Evolution of crack opening. Precise placement of the cracks. Radial displacements (in the dam blocks and foundations). |
| 5 | Copper Basin | Chemical effects. Wetting–drying cycles connected with the expansion of the dam mass. Reaction: Alkali–silica. | Downstream surface. | Horizontal and oblique. Center and abutments. | - | Precise placement of the cracks. |
| 6 | Dagangshan | Seismic events. Microseismic. Dam weight and overhang. | Internal. | At 15 m and 45 m above the dam base. | Max. length: 5 m. Max. width: 0.15 mm. Max. depth: 3.7 m. | Crack opening evolution. |
| 7 | Daniel- Johnson | Thermal effects. Inadequate design or execution of the construction. Seasonal temperature. Geometric discontinuities. | Downstream and upstream surfaces. | Upstream at the heel. Downstream at the center. | - | Displacements (measured by pendulum). |
| - | Dam A | The pouring interval is short, so the shrinkage deformation of the second phase concrete is under a strong constraint. | Downstream surface. | Horizontal at the top. | Max. width: 4 mm. Max. length: 300 m. Max. depth: 5 m. | Evolution of crack opening. Radial displacements (in the dam blocks and foundations). |
| 8 | Dam B | Thermal effects. Seasonal temperature variations. | Downstream surface. | Oblique. Lower and central area. | - | Precise placement of the cracks. Displacements (on the crest and in the center of the dam). |
| 9 | Dam C | Soil displacements. Grouting or uneven deformation of the foundation. | Internal. | Bottom gallery. | Max. width: 0.19 mm. Max. depth: 0.08 m. | Crack opening evolution. Precise placement of the cracks. Displacements. |
| 10 | Dam D | - | Downstream and upstream surfaces. | At 78–138 m above the dam base. | - | Evolution of crack opening. |
| 11 | Dam E | Thermal effects. The temperature of the dam dropped during the flood period. | Upstream surface. | Seven cracks at the center 41,9 m above the dam base. | Max. width: 2.5 mm. Max. depth: 15 m. | Radial displacements. |
| 12 | Dam F | - | - | - | Max. width: 0.7 mm. | Crack opening evolution. |
| - | Dam G | Thermal stress. | Downstream surface. | - | - | Radial displacements. |
| - | Dam H | Chemical effects. Alkali–aggregate reaction. | Internal. | Gallery. | Max. length: 246 m. Max. width: 2.4 mm. | Evolution of crack opening. Radial displacement (dam crest). |
| - | Dam I | - | Internal. | Gallery. | - | - |
| 13 | Dam J | Inadequate design or execution of the construction. Grout splitting of the interlaminar bonding surfaces, which caused the grouting uplift. | Internal. | Gallery at 15 m above the dam base. | Max. length: 23 m. Max. depth: 0.51 m. Max. width: 0.3 mm. | Crack opening evolution. Precise placement of the cracks. |
| 14 | Dam K | - | Upstream surface. | Rock–concrete interface. | Max. width: 2.5 mm. | Measurements of pendulums in the central block. Crack opening displacements. |
| 15 | El Atazar | Thermal effects. Soil displacements. The deformational asymmetry of the foundation leads to tensile stresses on weak joints. | Downstream, upstream and internal. | Horizontal. Principal internal at 25 m above the dam base. Downstream at the base. Others between 55 and 100 m. | Max. length: 160 m. Max. depth: 19 m. | Displacements (measured by 8 pendulums). Precise placement of the cracks. |
| 16 | Ertan | Thermal effects. Non-uniform temperature distribution on the downstream surface. | Downstream surface. | Upper-right side. | - | Radial displacements (in 4 central points). |
| 17 | Gene Wash | Chemical effects. Wetting–drying cycles connected with the expansion of the dam mass. Reaction: Alkali–silica. | Downstream surface. | Horizontal and oblique. Abutments. | - | Precise placement of the cracks. |
| 18 | Huaguangtan | Thermal effects. Low temperature and high water level. | Downstream and upstream surfaces. | Dam–foundation interface. | Max. width: 20 mm. | Horizontal displacements (central cantilever). Vertical displacements (monoliths). Displacement (abutment). |
| 19 | Isola | Chemical effects. Alkali–aggregate reaction. | Internal. | Horizontal. Gallery at 31 m above the dam base. | Max. length: 246 m. Max. width: 2.4 mm. | Evolution of crack opening. Precise placement of the cracks. Radial displacement (dam crest). Displacements (measured with a pendulum in the central part of the dam). |
| 20 | Kariba | Chemical effects. Alkali–aggregate reaction. | Downstream surface. | Horizontal. On the heel of the dam and the dam–foundation interface. | - | Vertical displacements. Radial displacements (on the crest). |
| 21 | Karun IV | Inadequate design or execution of the construction. The absence of a drainage system together with the presence of an impervious clayey layer in the foundation and incomplete vertical joints grouting of the upper half of the dam body. | Upstream and internal. | Horizontal and vertical. Dam heel and mid-arches close to the left abutment. | Max. width: 6 mm. | Precise placement of the cracks. |
| 22 | Kolnbrein | Inadequate design or execution of the construction. Weak foundations, inadequate injection of joints, and slenderness of the dam. | Downstream and upstream surfaces. | On the base of the dam. Upstream up to the inner gallery. | Max. width: 3 mm. | Precise placement of the cracks. Radial displacements (crest and base). |
| 23 | Kromme-Churchill | Thermal effects. Chemical effects. Alkali–acid reaction. Volume changes due to shrinkage and thermal effects. | Downstream, upstream and internal. | Horizontal and oblique. On the base. Upstream and internal in the center. | Max. width: 10 mm. Max. length: 0.45 m. Max. depth: 0.25 m. | Precise placement of the cracks. |
| 24 | La Tajera | Thermal effects. Inadequate design or execution of the construction. Reservoir empty at high temperatures, galleries without the necessary concrete overlay. | Downstream surface. | Oblique. Along the transition between vault and base. | Max. width: 0.5 mm. | Horizontal and vertical displacements (crest and cantilevers). Precise placement of the cracks. |
| 25 | Matka | Thermal effects. High temperature stresses. | Downstream surface. | Oblique. In the immediate vicinity of the right abutment. | Max. width: 2 mm. Max. length: 3 m. | Precise placement of the cracks. Displacements (at 24 points before and after cracking). |
| 26 | Nuraghe Arrubiu-Flumendosa | Thermal effects. Cooling of the concrete. | Upstream surface. | Horizontal. From 65 m above the dam base until the crest. | Max. length: 4.7 m. | Precise placement of the cracks. |
| 27 | Pacoima | Seismic events. Earthquakes. | Downstream and upstream surfaces. | Vertical. Between the arch dam and the thrust block on the left abutment. | Max. width: 50.8 mm. Max. length: 18 m. | Precise placement of the cracks. |
| 28 | Punt dal Gall | Thermal effects. Chemical effects. Efflorescence. | Internal. | Gallery at 68.4 and 122.4 m above the dam base. | Max. width: 2 mm. | Crack opening evolution. Uplift pressure measurements. Displacements (measured by inverted pendulums). |
| 29 | Quiebrajano | Thermal effects. | Downstream surface. | Horizontal and oblique cracks at the intersection with the basement of both abutments (first on the right side and then on the left side). | - | Precise placement of the cracks. |
| 30 | Sayano-Shushenskaya | Thermal effects. Concrete hydration heat and temperature. Changes in the stress state in the dam foundation. | Downstream and internal. | Internal at elevation 24.5 and 129 m above the dam base. Joints opening downstream at elevations 114 and 192 m. | Max. depth: 3 m. Max. width: 3.8 mm. | Displacements (crest). |
| 31 | Shuanghe | Inadequate design or execution of the construction. Self-weight and weak foundation. | Downstream surface. | Vertical. Along the entire surface. | Max. length: 3 m. Max. width: 8 mm. | Precise placement of the cracks. |
| 32 | Spitallamm | Inadequate design or execution of the construction. Pressure grouting. | Downstream surface. | Horizontal. At elevation 103 m above the dam base. | Max. length: 50 m. | Evolution of crack opening. Precise placement of the cracks. Displacements (measured by the pendulum on the crest). Upstream–downstream displacements (crest below crack level and near dam crest). |
| 33 | Susqueda | Thermal effects. | Upstream and internal. | Horizontal. Upper and left areas. | Max. width: 0.92 mm. | Crack opening evolution. Precise placement of the cracks. Displacements (crest). |
| 34 | Tolla | Thermal effects. Inadequate design or execution of the construction. High rigid foundations, high ambient temperature and the dam was too thin. | Downstream and upstream surfaces. | Oblique. In the immediate vicinity of both abutments. | - | Precise placement of the cracks. |
| 35 | Xiaowan | Thermal effects. Tensile stress caused by the temperature drop during the second stage post-cooling process before joint grouting. | Internal. | Vertical. Gallery at 40 and 107 m above the dam base. | Max. length: 3.5 m. Max. width: 1 mm. | Evolution of crack opening. Precise placement of the cracks. Displacements. Evolution of stresses. |
| 36 | Xiluodu | Inadequate design or execution of the construction. Dam weight, overhang and foundation constraint. | Internal. | Gallery at 15 m above the dam base. | Max. length: 3.5 m. | Crack opening evolution. Longitudinal and tangential displacements. |
| 37 | Zeuzier | Soil displacements. Abutment movement and settlement of the foundations. Change in ground phreatic conditions. | Downstream, upstream and internal. | Oblique. Galleries from 69 to 156 m above the dam base. Vertical joints open at central part on the upstream face. Peripheral joints on the downstream face parallel to both abutments. | Max. width: 15 mm. Max. length: 2 m. | Precise placement of the cracks. Radial displacements. |
| 38 | Zillergrundl | Thermal effects. Concrete hydration heat. Water infiltration in joints. | Upstream and internal. | Horizontal cracks in the heel. Vertical cracks in the elevator shaft. | Max. width: 1.9 mm. | Displacements. Precise placement of the cracks. |
Disclaimer/Publisher’s Note: The statements, opinions and data contained in all publications are solely those of the individual author(s) and contributor(s) and not of MDPI and/or the editor(s). MDPI and/or the editor(s) disclaim responsibility for any injury to people or property resulting from any ideas, methods, instructions or products referred to in the content. |
© 2024 by the authors. Licensee MDPI, Basel, Switzerland. This article is an open access article distributed under the terms and conditions of the Creative Commons Attribution (CC BY) license (https://creativecommons.org/licenses/by/4.0/).
Share and Cite
Conde, A.; Toledo, M.Á.; Salete, E. Cracks in Arch Dams: An Overview of Documented Instances. Appl. Sci. 2024, 14, 7580. https://doi.org/10.3390/app14177580
Conde A, Toledo MÁ, Salete E. Cracks in Arch Dams: An Overview of Documented Instances. Applied Sciences. 2024; 14(17):7580. https://doi.org/10.3390/app14177580
Chicago/Turabian StyleConde, André, Miguel Á. Toledo, and Eduardo Salete. 2024. "Cracks in Arch Dams: An Overview of Documented Instances" Applied Sciences 14, no. 17: 7580. https://doi.org/10.3390/app14177580