Abstract
In the field of visual graphic design, complexity plays a crucial role in visual information processing, and it is assumed to be an absolute quantity based on the number of the presenting features and components. However, it remains unclear whether the visual order of the constituent elements in graphical symbol complexity affects cognitive processing, especially memory processing. Our research innovatively generated four groups of novel, meaningless graphical symbols (complex and ordered, complex and disordered, simple and ordered, and simple and disordered) and experimentally manipulated the level of complexity and order in these stimuli. Before the formal experiment, a five-point scale was used to further rule out differences between objective and subjective definitions of these graphical symbols on ratings of complexity, order, concreteness, and familiarity. Then, we used a cue-recall task to compare subjects’ memory performance of those four graphical symbol groups. The analytical results showed a significant interaction between visual order and graphical symbol complexity, with the complexity effect appearing only when the stimuli were in disordered condition and disappearing once the stimuli were ordered. In addition, this study conducted a practical application validation to confirm that increasing the level of visual order is an effective way to improve user experience while maintaining the same level of complexity. The findings can serve as a reference for graphical symbol design, graphic design, and visual communication design.
1. Introduction
Graphical symbol design is very common in brand communication, cultural communication, visual communication, and graphic design, and its key role is to convey core information in an abstract form that is easy to recognize and understand. In practice, in addition to graphic aesthetics, semantic clarity, illustrative style, and color palette, designers are increasingly concerned with graphical symbol complexity when creating graphical symbols. Visual complexity plays a crucial role in visual information processing, and it is assumed to be a cognitive load that affects variables such as users’ cognitive behavior [1,2], memorability [3,4], visual perception [5,6], recognition thresholds [7,8], and the attractiveness of visual aesthetics [9,10]. Despite the fact that researchers have long attempted to define complexity to either control or assess its effects [11,12], most would agree that visual complexity is an absolute quantity based on counting or classifying the presenting features and components [13,14]. For example, Berlyne et al. [15] defined complexity as the number of distinguishable elements and the dissimilarity between those elements, while Snodgrass and Vanderwart [16] defined complexity as the amount of detail or intricacy of lines in a picture. In particular, most researchers agreed that the key to controlling the impact of objective complexity is to reduce the amount of presenting features and components since high-complex stimuli typically consume more working memory resources to process and manipulate the extra information [16,17]. These effects of visual complexity are especially evident in recognition, aesthetic evaluation, and algorithmic measurement of graphical visual information objects (e.g., graphics [18,19], images [20,21], icons [22,23], and symbols [24,25]). As a result, most designers choose to follow the “less is more” design principle to simplify and clarify graphical symbols by reducing the number of elements in a design. For example, Kitterman [26] noted that graphic design must be concise to help viewers understand a subject at a glance because “it is like an elevator pitch, where it must convince Melinda French Gates to contribute money to research in less than a minute”.
Although these results do not seem controversial, some current studies suggest that the objective complexity is also affected by other factors, e.g., familiarization [27], self-similarity [28], anisotropy [29], and stimulus type [30]. For example, our prior study [31] demonstrated that familiarity acts as a reduction in objective complexity, as one’s prior knowledge with the stimuli modulates the effects of complexity. Marin and Leder [30] found that complexity varies with the type of stimuli, which were characterized by different spatial frequencies. Wagemans [32] proposed that the degree to which the elements are grouped together influences complexity. These results suggested that complexity appears to be a multidimensional concept affected by its encoding difficulty rather than a one-dimensional property. Thus, controlling the effects of objective complexity requires both reducing the number of constituent elements and enhancing the ease of encoding. At the same time, we have found in practical applications that different forms of organization in graphical symbols also bring different visual feelings. For example, the four graphical symbols in Figure 1 are the logos of well-known companies, among which Figure 1a,b are simple symbols, while Figure 1c,d are relatively complex symbols. However, Figure 1b,d have more regular combinations of internal elements and are much more attractive and identifiable than the less regular Figure 1a,c. In addition, although Figure 1d (consisting of 20 line segments) is more complex than Figure 1c (consisting of 18 line segments), it appears to be easier to recognize and remember.
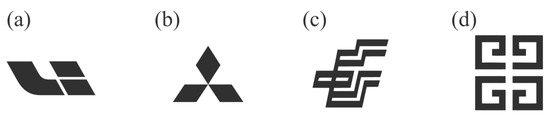
Figure 1.
Graphic symbols of four well-known companies. (a) Leadingidea, (b) Mitsubishi, (c) China Post, (d) Givenchy.
Given that our previous studies have validated the moderating effect of familiarity on complexity [31], another factor that may affect the encoding difficulty is the visual order of how these constituent elements are combined, which refers to the rationality of structure and organization in graphical visual information, e.g., symmetry, balance, regularity, repetition, and similarity. Previous studies in other related areas have shown that the psychologically relevant organization (i.e., the structural variables [33], perceptual [34], grouping [35], symmetry [36], organization [37,38]) do have effects on the encoding performance, e.g., visual search [39], diagnosis performance [40], and mental workload [41], and subjects showed better preference for well-ordered stimuli [36,41]. For example, Goldberg [40] found that well-organized functional groupings of computer interfaces resulted in shorter scan paths covering smaller areas compared to randomly organized groups. Katkov et al. [42] suggested that the regularities of order in statistical physics can be more appealing to the sensitive human visual system. Especially in the field of aesthetic assessment, the relationship between order and complexity was regarded as one of the fundamental principles of aesthetics [43] and the notion that both order and complexity could positively contribute to aesthetic preference has been known for over half a century [44,45].
While the notion that visual order acts as a reduction in complexity seems intuitive, and some studies have explored the influence of mirror symmetry on complexity perception [46], no prior studies have experimentally manipulated the visual order of stimuli and directly examined the effects of visual order on complexity in memory behavior. Although some studies mentioned that there was a balance between order and complexity influencing aesthetic appreciation [47,48], it is not clear whether the different levels of visual order would cause different effects of complexity on memory performance. These studies also did not exclude confounding factors in graphic design, such as semantics, concreteness, and familiarity, etc. Furthermore, those studies either tended to define complexity and order as two irrelevant properties in shape judgment [49], image identification [50], and graphic aesthetics evaluation [49], or categorize order as an antonym of complexity [11,51]. The potential moderating role of visual constituent elements within objective complexity on cognition, particularly in encoding, has been neglected.
Consequently, the experiment in this article is intended to test the hypothesis that in graphical symbol design, the effects of complexity are modulated not only by the number of constituent elements but also by the visual order of these elements. We find those assumptions plausible because it is easier to hold information in working memory when it can be “chunked” into organized units [52,53], and this chunking ability has been demonstrated to depend on the number of information chunks and the chunks’ strength [54]. The idea of whether the visual order of the constituent elements would affect the chunks’ strength and the relationship among the visual order, complexity, chunking ability, and working memory has not been experimentally tested before. Here, we propose that visual order affects the ability to encode objective complexity, especially in terms of user identification and user experience. When the constituent elements of a graphical symbol are well-ordered, it enhances the memorability and user experience, making it easier for the user to encode and process the stimuli, thus attracting more attention and enhancing the appeal.
2. Materials and Methods
The procedure in this study was approved by the IEC of the College of Furniture and Industrial Design, Nanjing Forestry University. Subjects read and signed a consent form before participating in the experiment.
2.1. Subjects
This experiment involved 42 students (22 males and 20 females, ages ranging from 20 to 25, Mean = 22.8) from Nanjing Forestry University. Subjects had never taken part in similar trials previously. Participants received payments ranging from ¥20 to ¥30 based on their task performance (accuracy).
Two subjects were excluded from the experiment because their performances were three standard deviations below the mean of the remaining subjects. This remained 40 subjects (20 males and 20 females, ages ranging from 20 to 25, Mean = 22.1).
2.2. Materials and Design
This experiment used a 2 (complexity level) × 2 (stimuli type) design such that all subjects were exposed to four stimuli groups: complex and ordered, complex and disordered, simple and ordered, and simple and disordered. The definition of visual order was similar to those adopted in previous studies, i.e., the degree of symmetry, balance, and regularity in the organizational form of the components [44,47], while the definition of complexity in stimuli was the amount of the components [16]. To exclude the potential influence of other factors affecting graphical symbol complexity (e.g., familiarity, illustration style and color palette), the stimuli were novel, meaningless graphical symbols with simple geometric components. Three types of lines (straight, curved, and angular) and three types of shapes (circles, rectangles, and triangles) were selected and randomly combined into a single graphical symbol via Adobe Illustrator 2019. Two hundred and forty unique graphical symbols were randomly produced under the following constraints: (1) simple graphical symbol consisted of two lines and one shape; (2) complex graphical symbol consisted of two lines and five shapes; (3) ordered graphical symbol had a symmetrical, balanced, and regular organizational form; (4) disordered graphical symbol had an asymmetrical, unbalanced, and irregular organizational form (see Figure 2). Therefore, a simple and ordered graphical symbol consisted of two lines and one shape, and its organizational form was symmetrical, balanced, and regular, while a complex and ordered graphical symbol consisted of two lines and five shapes, and its combination form was asymmetrical, unbalanced, and irregular.
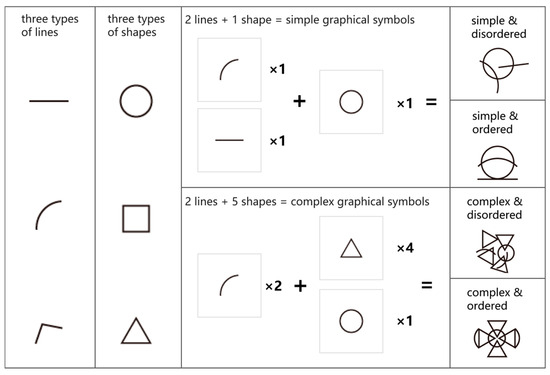
Figure 2.
Complexity and order constraints in the design of graphical symbols in experiments.
To further reduce the disparity between the objective and subjective descriptions of these images, 50 volunteers were chosen to rate the four factors on a five-point Likert scale (familiarity, concreteness, complexity, and order) of all the graphical symbols before the formal experiments. Instructions were the same as in previous studies [16,43,45,52,55]. For complexity ratings, symbols should be considered as complex if they contained a large amount of elements (1 = definitely simple, 5 = definitely complex); for order ratings, symbols should be considered as ordered if the elements in them are well organized or structured (1 = definitely disordered, 5 = definitely ordered); for concreteness ratings, graphical symbols should be considered as concrete if they depict real-like items (1 = definitely abstract, 5 = definitely concrete); for familiarity ratings, symbols should be considered as familiar if they look like an object that frequently appears in daily life (1 = definitely unfamiliar, 5 = definitely familiar). Based on the rating results, 80 graphical symbols from four groups were selected for the formal experiment (20 complex and ordered symbols, 20 complex and disordered symbols, 20 simple and ordered symbols, and 20 simple and disordered symbols), see Figure 3. Subsequently, we analyzed the rating results of each group via ANOVAs analyze, followed by Newman–Keuls comparisons. The results indicated that there were significant differences between the complexity ratings of the complex group and the simple group, F (1, 78) = 437.0, p < 0.001, and between the ordered group and disordered group, F (1, 78) = 349.07, p < 0.001. However, there was no significant difference among the familiarity ratings of the 80 graphical symbols, F (3, 76) = 0.034, p = 0.854, and there was also no significant difference among the concreteness ratings of the 80 graphical symbols, F (3, 76) = 0.565, p = 0.64. Table 1 shows the ratings results for complexity, concreteness, order, and familiarity in each group. Subsequently, two symbols from each of the four stimulus groups randomly formed a bi-symbol pair. Since each complex graphical symbols consisted of two lines and five shapes, each complex bi-symbol pair was twice as complex.
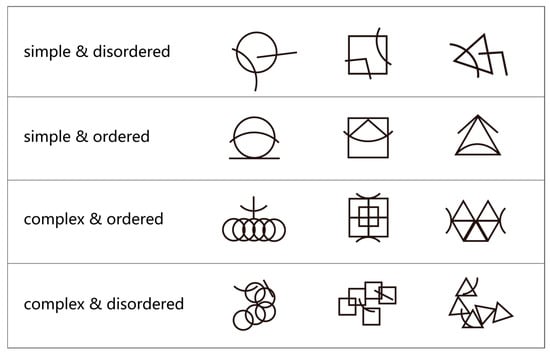
Figure 3.
Examples of simple and disordered, simple and ordered, complex and ordered, and complex and disordered graphical symbols.

Table 1.
Mean scores and standard deviations of attributes for the four groups of graphical symbols.
The design contains a total of 64 bi-symbol pairs, involving 16 simple and disordered bi-symbol pairs, 16 simple and ordered bi-symbol pairs, 16 complex and disordered bi-symbol pairs, and 16 complex and ordered bi-symbol pairs. To avoid the fact that all subjects had the same experimental material, the stimuli for each subject were randomly selected from each of the four groups (i.e., 16 of the 20 graphical symbols from each group were selected to randomly generate 16 bi-symbol pairs). Each list comprised only one of the four bi-symbol pair types and contained exactly 16 bi-symbol pairs associated with a unique English word. Subjects were forced to memorize an entire combination containing one bi-symbol pair (not just the left or right symbol of a bi-symbol pair) and one associated English word, that is, a bi-symbol pair. Given that each symbol on a list was repeated exactly twice in two different bi-symbol pairs, each symbol in a bi-symbol pair should contribute equally to the learning of the association.
We chose a total of sixty-four English words from the MRC Psycholinguistic Database (http://websites.psychology.uwa.edu.au/school/MRCDatabase/uwa_mrc.htm, accessed on 25 July 2024) with familiarity scores of 600 or higher. The word lengths ranging from three to six letters. The resolution of the screen was 1280 × 800 pixels, and each character/radical measured 148 × 148 pixels. The distance for viewing was approximately 55 cm.
2.3. Procedure
The same cued-recall task described in Zhang et al. [31] was used in our experiment, with a few modifications that will be noted below. To test their learning capacity, subjects repeated the identical 64 pair combinations across six rounds. The four lists were in the same order for each round, but the 16 pair combinations in each study list and test list were assigned at random to each subject. The example round with study and test phases for each of the four stimulus types is shown in Figure 4. Every bi-symbol pair and its corresponding English word were displayed for three seconds throughout the study trials, after which the following pair combination presented automatically. Test trials for the items on the list started intermediately after studying all the 16 pair combinations in the list. Subjects completed a cued-recall task that required them to try to recall the English word studied using the present probe stimuli. They were given one of the memorized bi-symbol pairs and asked to enter the corresponding English word. The possible English words for the list were arranged uniformly on the left and right sides of the screen and were shown in a random order throughout each round. Subjects received visual feedback after submitting their answer, indicating whether it was correct, and the responses were not limited by time. This continued until all 16 of the studied pair combinations for that list were tested. For each of the four types of stimulus lists, there were six rounds in total, with a one-minute intermission in between. The experiment took around an hour to complete in its entirety.
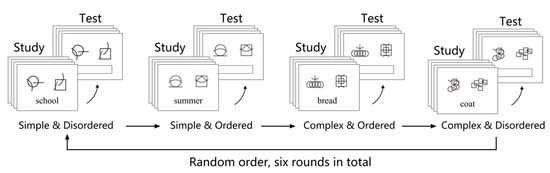
Figure 4.
Example round consisting of a study and test phase for each of the four stimulus types. There were six rounds total of the four types of stimulus lists.
2.4. Results
The ‘pwr package’ in R was used for a power analysis to make sure that the sample size obtained sufficient power [56,57]. Given that every participant underwent six rounds of testing and study, we assumed a large effect size (i.e., ηp2 = 0.14 [58]). The achieved power was 0.992, with α = 0.05.
With subjects and items acting as random intercept effects, we used logistic mixed effects regressions to analyze accuracy data and linear mixed effects regressions to analyze reaction times [59,60]. For the RT analysis, we only took into consideration trials that had accurate responses, excluding cases with RTs more than three median absolute deviations above or below the median RT calculated individually for each subject condition (7.5%). The results are shown in Table 2 and Table 3.
Table 2.
Results of logistic mixed-effects regression analysis on accuracy.
Table 3.
Results of linear mixed-effects regression analysis on reaction times.
Figure 5 shows the performance on the cued-recall tests as a function of four stimulus types of cues for each round. Regardless of stimulus types, subjects performed better in later rounds, becoming more accurate, ΔAIC = −36.4, LLR χ2 (1) = 38.404, p < 0.001; and faster, ΔAIC = −225.2, LLR χ2 (1) = 265.19, p < 0.001. Because we are not interested in the role of practice of the pairs (round), further analyses did not include the round factor and focused on the interaction between complexity and order. There was a significant interaction between complexity and order on accuracy, ΔAIC = −12.7, LLR χ2 (1) = 14.671, p < 0.001; and response time, ΔAIC = −106.9, LLR χ2 (1) = 108.89, p < 0.001. Consistent with prior studies’ results, subjects showed worse performance in the complex condition than in the simple condition; subjects became less accurate, ΔAIC = −7.6, LLR χ2 (1) = 9.624, p = 0.002; and slower, ΔAIC = −1463.4, LLR χ2(1) = 1465.34, p < 0.001. Specially, that performance for subjects differed significantly on the type of bi-symbol pair combinations, with subjects recalling the words to complex and disordered bi-symbol pairs (type) less accurately, ΔAIC = 162.4, LLR χ2 (1) = 168.379, p < 0.001; and more slowly, ΔAIC = −1580.8, LLR χ2 (1) = 1584.76, p < 0.001. Importantly, subjects performed more accurately in the ordered condition than in the disordered condition in all cases, ΔAIC = −11, LLR χ2 (1) = 13.027, p < 0.001; and faster, ΔAIC = −248.1, LLR χ2 (1) = 250.11, p < 0.001, such that visual order did affect subjects’ memory processing.
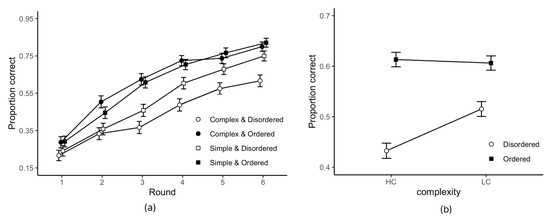
Figure 5.
(a) Mean accuracy performance of subjects over six rounds; error bars indicate ±1 standard errors. (b) Mean reaction time of subjects over six rounds; error bars indicate ±1 standard errors.
Figure 6 shows the cued-recall performance as a function of complexity (x-axis) and order (separate lines for the two levels). In the disordered situation, it is clear that performance improved significantly from the complex condition to the simple condition on accuracy, ΔAIC = −3.1, LLR χ2 (1) = 5.137, p < 0.05; and response time, ΔAIC = −1233, LLR χ2 (1) = 1236.93, p < 0.001, such that simple and disordered bi-symbols were more easily processed and recognized than complex and disordered bi-symbols, which is consistent with prior studies’ results. The result in ordered situations was the opposite, subjects performed basically the same between complex and simple bi-symbols on recall accuracy, ΔAIC = 2, LLR χ2 (1) = 0.0073, p = 0.932; and reaction time, ΔAIC = −778.4, LLR χ2 (1) = 780.4, p = 0.44. These results are consistent with our hypothesis that the effects of complexity on user’s perception were mitigated when the stimuli were highly ordered.
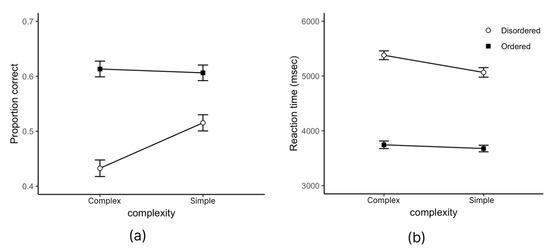
Figure 6.
(a) Mean accuracy of order as a function of the type of cues paired with words on a given list for the subjects; error bars indicate ±1 standard errors. (b) Mean reaction time of order as a function of the type of cues paired with words on a given list for the subjects; error bars indicate ±1 standard errors.
2.5. Practical Application Validation: A Case Study on User Experience Evaluation
Based on the experimental findings that graphical complexity is modulated by the visual order of internal constituent elements, complexity interference seems to disappear particularly in the process of memory recognition of ordered symbol. To further validate the consistency of the experimental results with user experience in real-world applications, we conducted a design optimization based on a company brand logo (Nanjing Kaihe Zaowu Technology Co., Nanjing, China) The original logo was composed of two intersecting circles and a square, communicating a traditional Chinese business culture of “TianYuanDiFang, HeQiShengCai”, which means “a round sky and a square earth, where harmony fosters wealth”. Since the Chinese pronunciation of the circle is “Yuan”, the two circles in the graphical symbol, respectively, symbolize “completeness” (Chinese pronunciation: “YuanMan”) and “prosperity” (Chinese pronunciation: “YuanBao”). We optimized the order of the inner elements in the way they are grouped without changing the basic elements (one rectangle and two circles) and the complexity level. Our optimized design was mainly based on our order construction proposed in the experiment, and we have reconstructed the graphical symbol in terms of symmetry, balance, and regularity, which effectively enhances the visual order of the new symbol (as shown in Figure 7). The optimized design retained the symbolism of the original logo while incorporating the infinity symbol, which is more in line with the brand’s core values.

Figure 7.
A design optimization based on a company brand logo.
Subsequently, to verify that an ordered graphic design can indeed enhance the visual communication effect and user experience, we conducted a multi-dimensional user experience rating on the original and optimized design based on the User Experience Questionnaire (UEQ) scale. The UEQ is usually used as part of a classic usability test to collect quantitative data about subjects’ experiences with a designed object, which is also a standardized questionnaire with 26 questions on a 7-point Likert scale [61]. The questions in the UEQ are organized into 6 subscales to assess attractiveness, dependability, efficiency, novelty, perspicuity, and stimulation in the user experience. In addition, we added an additional three-factor scale: brand attraction, user empathy and subjective complexity on a 5-point Likert scale. Twenty college students, 11 men and 9 women (ages ranging from 22 to 29 years) from Nanjing Forestry University participated in this user experience evaluation. The results are shown in Figure 8 and Figure 9.
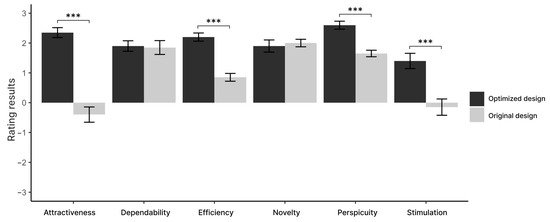
Figure 8.
Results of User Experience Questionnaire (UEQ) scale for original and optimized designs. *** means there is a significant interaction effect.
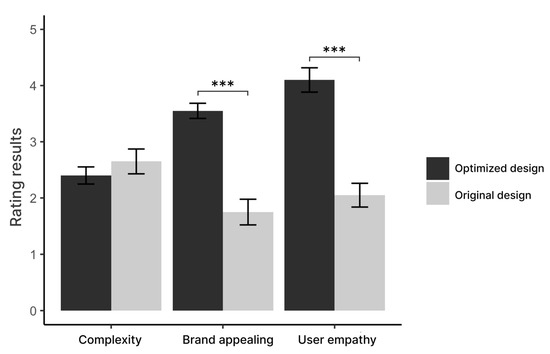
Figure 9.
Results of brand attraction, user empathy and subjective complexity for original and optimized designs. *** means there is a significant interaction effect.
The results of the UEQ scales and the other three scales indicated that there was no significant difference in the complexity scores between the original and optimized symbols, but the optimized ordered graphical symbols had significantly higher-scale results for attractiveness, efficiency, perspicuity, and stimulation, as well as brand attraction and user empathy.
3. Discussion with Conclusions
Graphical symbol design is an important part of brand communication, cultural communication, visual communication, graphic design, and other fields; its design form affects the user’s recognizability, memorability, encoding difficulty, and the commercial value. It is commonly believed that stimuli of higher complexity were harder to process, remember, and reproduce in visual cognition and memory behavior than stimuli of lower complexity [2,62]. Despite some differences in definitions of complexity, most would agree that complexity is an absolute quantity [63,64], and the greater the number of physically elements contained in an object, the more attention resources need to be allocated, and the more visual working memory (VWM) capacity is occupied [65,66]. This study demonstrated that objective complexity was a multidimensional concept rather than a one-dimensional property. It is influenced both by the number of constituent elements and by the organization and regularity of these elements. Here, our results provide cases in which the effects of objective complexity (defined as the number of geometric shapes in the graphical symbol) is modulated by the visual order of these constituents. Specifically, the effects of complexity exist only when the stimuli are in disordered conditions, and once the stimuli are ordered for subjects, the effects of complexity disappear. It is no surprise that subjects’ performance is affected by complexity in the disordered condition since the stimuli contain more elements and more information to process. Nevertheless, it is useful to demonstrate that subjects are not affected by complexity in ordered conditions. In the ordered condition, there was no significant difference between simple pair combinations and complex pair combinations on the memory perception of the subjects.
The extant studies on the relationship between order-related factors and complexity have mostly involved quasi-experimental designs that relied on preexisting differences in order of the stimuli [2,40]; no prior studies have directly experimentally modulated the level of order of the stimuli. In these cases, it would be difficult to rule out potentially confounding inequalities in the stimuli (e.g., familiarity, concreteness, or meaning). In our experiment, we generated a set of novel, meaningless graphical symbols and filtered them based on the rating results of a 5-point Likert scale to exclude the differences between objective and subjective definitions that could affect complexity before a formal experiment. This manipulation allows us to be more confident about the validity of our measures and the results that the moderate effects on complexity are due to visual order rather than to other confounding factors. The formal cued-recall test provided a demonstration that the effects of complexity on learning were eliminated when the bi-symbol pairs were visually ordered, but not for those disordered bi-symbol pairs. The results of the subjective multi-dimensional UEQ scales in our case study further confirm the importance of visual order in enhancing the user experience of the graphical symbols of the same level of complexity.
One explanation for the opposite results of complexity comes from the advantage of perceptual grouping in Gestalt psychology [67]. Gestalt theory suggests that the organizational relationship between the parts of an object usually plays an important role in visual perception, and the visual processing would automatically organize the parts in the simplest and most encompassing way [68]. In addition, visual recognition typically groups elements more quickly if the constituent elements are symmetrical [33]. From this point of view, the ease of being grouped corresponds to the difficulty of encoding. It seems reasonable to assume that the processing, storing, and recalling of a stimulus object is limited by the degree to which the internal elements are organized in a rational form. In our experiments, order was defined as the reasonable degree of symmetry, balance, and regularity of the components. That means that when the organizational relationships in each graphical symbol are more ordered, the grouping processing of auto-perception is easier. Therefore, disordered bi-symbol pairs were less efficient to process than those ordered bi-symbol pairs of equal complexity, since asymmetrical and unbalanced graphical symbols were difficult to be grouped quickly. Similarly, in the ordered condition, although complex bi-symbol pairs contained more geometries than simple bi-symbol pairs, the ease of grouping of the two types of stimuli was the same, and thus the performance was unaffected by complexity.
Another plausible explanation comes from the chunking theory of Miller [52], Simon [53], and Reder et al. [27]. The chunking theory posits that when information can be encoded or chunked into higher level units, it is easier to process and consumes less WM resources [69,70]. Recent works by Reder et al. [27] have extended chunking theory and shown that WM capacity depends not only on the number of chunks of information one is attempting to process but also on the strength of those chunks in memory. Our prior study demonstrated that the strength of the chunks reflects the familiarity as one’s prior knowledge of the stimuli modulates the effects of complexity [32]. According to the chunking strength theory, we propose that less working memory is required to encode ordered stimuli. That is, the coding advantage in binding ordered bi-symbol pairs was greater since ordered graphical symbol contained more similar parts and these parts were arranged more regularly, representing a greater number of parts that could be more easily chucked into fewer units. Therefore, while four groups of stimulus types (complex and ordered, complex and disordered, simple and ordered, and simple and disordered) expended working memory resources to encode the bi-symbol pair combinations, the processing and binding of ordered stimuli depleted less working memory resources as chunks became stronger. Conversely, disordered graphical symbol were more difficult to encode into bi-symbol pairs and to associate with English words, as the irregular organization led to a weaker chunking strength and only a few parts of disordered constituent elements could be chunked.
This view can also be found similarly in other image-related research [33,40]. For example, Kemps [71] manipulated the number and position of blocks on the board and found that the impact of visual complexity is determined by the combination of quantifiable physical attributes and structural factors. Our work builds on theirs by demonstrating that complexity can be moderated by the organizational forms of the elements, i.e., the order degree.
Our research also challenges the view that “order is the opposite pole of complexity and simple equals to ordered” [11]. Our study proves that objective complexity and visual order are not two irrelevant properties, and order is not the antonym of complexity. The results demonstrate that there is a significant interaction between order and complexity in memory perception. Visual order acts as a reduction in objective complexity. In addition, complexity appears to be a multidimensional property instead of a one-dimensional property, and controlling the effects of objective complexity requires both reducing the number of the constituent elements and improving the visual order.
Aside from informing theoretical studies of complexity, the order optimization effects may be potentially useful for improving theories related to visual design. Prior research has shown that an effective way to reduce complexity is to reduce the quantity in such a way as to reduce the working memory and cognitive load during visual cognition, as postulated by Tinio and Leder [10]. Several helpful strategies have been proposed to reduce the effects of complexity, such as reducing silhouette points [72] and compression ratios [6]. While it is true that reducing the physical number of constituent elements could reduce the cognitive load and thus improve the overall cognitive effects, in many cases, the information function determines the type and number of visual elements that cannot be reduced. Enhancing the visual order of compositional elements is another way to reduce the impact of complexity. Particularly in the fields of graphic design, visual communication design, and interface design, designers should not only follow the design strategy of “less is more” but also “order is more”. Improving the level of visual order will be an effective way to improve coding ability while maintaining the same amount of information.
This research remained characterized by some limitations. First, to exclude other confounding factors and to control the level of visual order of the stimuli, all the novel meaningless graphical symbols we generated were black. However, relevant studies have shown that color has effects on complexity [73] and on user experience [74]. Second, since the stimuli were composed of three linear geometric shapes, our experiment manipulated the number of shapes in the graphical symbols but not the line thickness or symbol style, which may affect the visual order. As a practical graphical symbol usually needs to convey a certain message or corporate culture, many symbol styles are used in the actual design to convey brand characteristics and distinctiveness, such as dynamic styles, fill styles, and gradient styles. Therefore, based on the existing results, future research could further explore the effects of color and line thickness on visual order in graphical symbols and examine the variability under different symbol styles.
In summary, the current study provides evidence that complexity and visual order are not two irrelevant properties, and that the effects of graphical symbol complexity on memory performance are modulated by visual order. Once the stimuli are highly ordered, the working memory required to encode is reduced, and the effects of complexity are diminished.
Author Contributions
Methodology, writing—original draft and data curation, N.Z.; conceptualization, writing—review and editing, J.Z.; data curation, W.L.; visualization, S.J.; investigation, X.D. All authors have read and agreed to the published version of the manuscript.
Funding
This paper was supported by the National Nature Science Foundation of China Grant (No. 72201128), the China Postdoctoral Science Foundation (No. 2023M730483) and the Collaborative Education Program of the Chinese Education Ministry (No. 202102298009).
Institutional Review Board Statement
The study was conducted in accordance with the Declaration of Helsinki and with the approval of the IEC of the College of Furniture and Industrial Design, Nanjing Forestry University (approval date: 1 January 2023).
Informed Consent Statement
Informed consent was obtained from all subjects involved in the study.
Data Availability Statement
The original contributions presented in the study are included in the article, further inquiries can be directed to the corresponding author.
Conflicts of Interest
The authors declare no conflicts of interest.
References
- Bonev, B.; Chuang, L.L.; Escolano, F. How Do Image Complexity, Task Demands and Looking Biases Influence Human Gaze Behavior? Pattern Recognit. Lett. 2013, 34, 723–730. [Google Scholar] [CrossRef]
- Guo, F.; Chen, J.; Li, M.; Lyu, W.; Zhang, J. Effects of Visual Complexity on User Search Behavior and Satisfaction: An Eye-Tracking Study of Mobile News Apps. Univers. Access Inf. Soc. 2022, 21, 795–808. [Google Scholar] [CrossRef]
- Eng, H.Y.; Chen, D.; Jiang, Y. Visual Working Memory for Simple and Complex Visual Stimuli. Psychon. Bull. Rev. 2005, 12, 1127–1133. [Google Scholar] [CrossRef]
- Liu, T.; Chen, W.; Liu, C.H.; Fu, X. Benefits and Costs of Uniqueness in Multiple Object Tracking: The Role of Object Complexity. Vis. Res. 2012, 66, 31–38. [Google Scholar] [CrossRef] [PubMed]
- Palumbo, L.; Ogden, R.; Makin, A.D.J.; Bertamini, M. Examining Visual Complexity and Its Influence on Perceived Duration. J. Vis. 2014, 14, 3. [Google Scholar] [CrossRef]
- Yoon, S.H.; Lim, J.; Ji, Y.G. Assessment Model for Perceived Visual Complexity of Automotive Instrument Cluster. Appl. Ergon. 2015, 46, 76–83. [Google Scholar] [CrossRef]
- Bieri, J. Cognitive Complexity-Simplicity and Predictive Behavior. J. Abnorm. Soc. Psychol. 1955, 51, 263–268. [Google Scholar] [CrossRef]
- Xie, F.; Li, L.; Zhao, S.; Wang, J.; Paterson, K.; White, S.; Warrington, K. Aging and Pattern Complexity Effects on the Visual Span: Evidence from Chinese Character Recognition. Vision 2019, 3, 11. [Google Scholar] [CrossRef]
- Nadal, M.; Munar, E.; Marty, G.; Cela-Conde, C.J. Visual Complexity and Beauty Appreciation: Explaining the Divergence of Results. Empir. Stud. Arts 2010, 28, 173–191. [Google Scholar] [CrossRef]
- Tinio, P.P.L.; Leder, H. Just How Stable Are Stable Aesthetic Features? Symmetry, Complexity, and the Jaws of Massive Familiarization. Acta Psychol. 2009, 130, 241–250. [Google Scholar] [CrossRef]
- Ngo, D.C.L.; Teo, L.S.; Byrne, J.G. Modelling Interface Aesthetics. Inf. Sci. 2003, 152, 25–46. [Google Scholar] [CrossRef]
- Deng, L.; Poole, M.S. Aesthetic Design of E-Commerce Web Pages—Webpage Complexity, Order and Preference. Electron. Commer. Res. Appl. 2012, 11, 420–440. [Google Scholar] [CrossRef]
- Tang, W.; Chen, S.; Xue, C.; Niu, Y.; Shao, J.; Zhu, Y. Influence of Nuclear Power Plant Interface Complexity on User Decision-Making: An ERP Study. Ergonomics 2023, 66, 1099–1117. [Google Scholar] [CrossRef]
- Jakesch, M.; Leder, H. The Qualitative Side of Complexity: Testing Effects of Ambiguity on Complexity Judgments. Psychol. Aesthet. Creat. Arts 2015, 9, 200–205. [Google Scholar] [CrossRef]
- Berlyne, D.E.; Ogilvie, J.C.; Parham, L.C. The Dimensionality of Visual Complexity, Interestingness, and Pleasingness. Can. J. Psychol./Rev. Can. Psychol. 1968, 22, 376–387. [Google Scholar] [CrossRef]
- Snodgrass, J.G.; Vanderwart, M. A Standardized Set of 260 Pictures: Norms for Name Agreement, Image Agreement, Familiarity, and Visual Complexity. J. Exp. Psychol. Hum. Learn. Mem. 1980, 6, 174–215. [Google Scholar] [CrossRef] [PubMed]
- Chen, X.; Li, B.; Liu, Y. The Impact of Object Complexity on Visual Working Memory Capacity. Psychology 2017, 8, 929–937. [Google Scholar] [CrossRef][Green Version]
- Han, K.; You, W.; Shi, S.; Deng, H.; Sun, L. The Doctrine of the Mean: Chinese Calligraphy with Moderate Visual Complexity Elicits High Aesthetic Preference. Int. J. Hum.–Comput. Interact. 2022, 40, 1355–1368. [Google Scholar] [CrossRef]
- Cheng, S.; Sheng, D.; Yao, J.; Shen, Z. Poster Graphic Design with Your Eyes: An Approach to Automatic Textual Layout Design Based on Visual Perception. Displays 2023, 79, 102458. [Google Scholar] [CrossRef]
- Peng, Q.; Li, Z.; Chen, J.; Liu, W. Complexity-Based Matching between Image Resolution and Map Scale for Multiscale Image-Map Generation. Int. J. Geogr. Inf. Sci. 2021, 35, 1951–1974. [Google Scholar] [CrossRef]
- Guo, X.; Qian, Y.; Li, L.; Asano, A. Assessment Model for Perceived Visual Complexity of Painting Images. Knowl. Based Syst. 2018, 159, 110–119. [Google Scholar] [CrossRef]
- Shen, Z.; Xue, C.; Wang, H. Effects of Users’ Familiarity With the Objects Depicted in Icons on the Cognitive Performance of Icon Identification. i-Perception 2018, 9, 2041669518780807. [Google Scholar] [CrossRef]
- Shen, Z.; Zhang, L.; Li, R.; Hou, J.; Liu, C.; Hu, W. The Effects of Color Combinations, Luminance Contrast, and Area Ratio on Icon Visual Search Performance. Displays 2021, 67, 101999. [Google Scholar] [CrossRef]
- Bai, T.; Peng, C.; Wu, Y.; Dong, W. Not Simply a Circle: Directional You-Are-Here Symbol Design Improves the Usability of Indoor Layout Maps. Cartogr. Geogr. Inf. Sci. 2023, 50, 214–231. [Google Scholar] [CrossRef]
- Miton, H.; Morin, O. Graphic Complexity in Writing Systems. Cognition 2021, 214, 104771. [Google Scholar] [CrossRef] [PubMed]
- Kitterman, A.C. Designing an Effective Graphic Abstract. Sci. Robot. 2021, 6, eabn1724. [Google Scholar] [CrossRef]
- Reder, L.M.; Liu, X.L.; Keinath, A.; Popov, V. Building Knowledge Requires Bricks, Not Sand: The Critical Role of Familiar Constituents in Learning. Psychon. Bull. Rev. 2015, 23, 271–277. [Google Scholar] [CrossRef]
- Braun, J.; Amirshahi, S.A.; Denzler, J.; Redies, C. Statistical Image Properties of Print Advertisements, Visual Artworks and Images of Architecture. Front. Psychol. 2013, 4, 60395. [Google Scholar] [CrossRef]
- Mather, G. The Psychology of Visual Art: Eye, Brain and Art; Cambridge University Press: Cambridge, UK, 2013. [Google Scholar]
- Marin, M.M.; Leder, H. Examining Complexity across Domains: Relating Subjective and Objective Measures of Affective Environmental Scenes, Paintings and Music. PLoS ONE 2013, 8, e72412. [Google Scholar] [CrossRef]
- Zhang, J.; Liu, X.L.; So, M.; Reder, L.M. Familiarity Acts as a Reduction in Objective Complexity. Mem. Cogn. 2020, 48, 1376–1387. [Google Scholar] [CrossRef]
- Wagemans, J. Perceptual Organization. In Stevens’ Handbook of Experimental Psychology and Cognitive Neuroscience; Wixted, J.T., Ed.; Wiley: Hoboken, NJ, USA, 2018; pp. 1–70. [Google Scholar]
- Chipman, S.F. Complexity and Structure in Visual Patterns. J. Exp. Psychol. Gen. 1977, 106, 269–301. [Google Scholar] [CrossRef] [PubMed]
- Oliva, A.; Mack, M.L.; Shrestha, M.; Peeper, A. Identifying the Perceptual Dimensions of Visual Complexity of Scenes. In Proceedings of the Twenty-Sixth Annual Conference of the Cognitive Science Society, Chicago, IL, USA, 4–7 August 2004; Forbus, K., Gentner, D., Regier, T., Eds.; Lawrence Erlbaum Assoc Publish: Mahwah, NJ, USA, 2004; pp. 1041–1046. [Google Scholar]
- Yang, X.; Yang, B.; Tang, C.; Mo, X.; Hu, B. Visual Attention Quality Research for Social Media Applications: A Case Study on Photo Sharing Applications. Int. J. Hum.–Comput. Interact. 2023, 40, 3827–3840. [Google Scholar] [CrossRef]
- Reder, M.S.; Van Der Vloed, G.; Van Der Helm, P.A. Interactions between Constituent Single Symmetries in Multiple Symmetry. Atten. Percept. Psychophys. 2011, 73, 1487–1502. [Google Scholar]
- Li, R.; Chen, Y.V.; Sha, C.; Lu, Z. Effects of Interface Layout on the Usability of In-Vehicle Information Systems and Driving Safety. Displays 2017, 49, 124–132. [Google Scholar] [CrossRef]
- Chen, K.; Li, Z.; Jamieson, G.A. Influence of Information Layout on Diagnosis Performance. IEEE Trans. Hum.-Mach. Syst. 2018, 48, 316–323. [Google Scholar] [CrossRef]
- Chen, H.; Pang, L.; Wanyan, X.; Liu, S.; Fang, Y.; Tao, D. Effects of Air Route Alternation and Display Design on an Operator’s Situation Awareness, Task Performance and Mental Workload in Simulated Flight Tasks. Appl. Sci. 2021, 11, 5745. [Google Scholar] [CrossRef]
- Wilson, A.; Chatterjee, A. The Assessment of Preference for Balance: Introducing a New Test. Empir. Stud. Arts 2005, 23, 165–180. [Google Scholar] [CrossRef]
- Goldberg, J.H.; Kotval, X.P. Computer Interface Evaluation Using Eye Movements: Methods and Constructs. Int. J. Ind. Ergon. 1999, 24, 631–645. [Google Scholar] [CrossRef]
- Katkov, M.; Harris, H.; Sagi, D. Visual Perception of Order-Disorder Transition. Front. Psychol. 2015, 6, 734. [Google Scholar] [CrossRef]
- Arnheim, R. Toward a Psychology of Art: Collected Essays; University of California Press: Berkeley, CA, USA, 1966; Volume 242. [Google Scholar]
- Eysenck, H.J. The Experimental Study of the ’Good Gestalt’—A New Approach. Psychol. Rev. 1942, 49, 344–364. [Google Scholar] [CrossRef]
- Birkhoff, G.D. Aesthetic Measure; Harvard University Press: Cambridge, MA, USA, 2013. [Google Scholar]
- Gartus, A.; Leder, H. Predicting Perceived Visual Complexity of Abstract Patterns Using Computational Measures: The Influence of Mirror Symmetry on Complexity Perception. PLoS ONE 2017, 12, e0185276. [Google Scholar] [CrossRef]
- Van Geert, E.; Wagemans, J. Order, Complexity, and Aesthetic Appreciation. Psychol. Aesthet. Creat. Arts 2020, 14, 135–154. [Google Scholar] [CrossRef]
- Post, R.A.G.; Blijlevens, J.; Hekkert, P. ‘To Preserve Unity While Almost Allowing for Chaos’: Testing the Aesthetic Principle of Unity-in-Variety in Product Design. Acta Psychol. 2016, 163, 142–152. [Google Scholar] [CrossRef]
- Eisenman, R. Pleasing and Interesting Visual Complexity: Support for Berlyne. Percept. Mot. Ski. 1966, 23, 1167–1170. [Google Scholar] [CrossRef] [PubMed]
- Sigaki, H.Y.D.; Perc, M.; Ribeiro, H.V. History of Art Paintings through the Lens of Entropy and Complexity. Proc. Natl. Acad. Sci. USA 2018, 115, E8585–E8594. [Google Scholar] [CrossRef] [PubMed]
- Arnheim, R. Order and Complexity in Landscape Design; University of California Press: Berkeley, CA, USA, 1968. [Google Scholar]
- Miller, G.A. The Magical Number Seven, plus or Minus Two: Some Limits on Our Capacity for Processing Information. Psychol. Rev. 1956, 63, 81–97. [Google Scholar] [CrossRef] [PubMed]
- Simon, H.A. How Big Is a Chunk?: By Combining Data from Several Experiments, a Basic Human Memory Unit Can Be Identified and Measured. Science 1974, 183, 482–488. [Google Scholar] [CrossRef]
- Shen, Z.; Popov, V.; Delahay, A.B.; Reder, L.M. Item Strength Affects Working Memory Capacity. Mem. Cogn. 2018, 46, 204–215. [Google Scholar] [CrossRef]
- Gilhooly, K.J.; Logie, R.H. Age-of-Acquisition, Imagery, Concreteness, Familiarity, and Ambiguity Measures for 1944 Words. Behav. Res. Methods Instrum. 1980, 12, 395–427. [Google Scholar] [CrossRef]
- Pwr: Basic Functions for Power Analysis. 2017. Available online: https://nyuscholars.nyu.edu/en/publications/pwr-basic-functions-for-power-analysis (accessed on 25 July 2024).
- Muller, K. Statistical Power Analysis for the Behavioral Sciences. Technometrics 1989, 31, 499–500. [Google Scholar] [CrossRef]
- Cohen, J. A Power Primer. Psychol. Bull. 1992, 112, 155–159. [Google Scholar] [CrossRef] [PubMed]
- Baayen, R.H.; Davidson, D.J.; Bates, D.M. Mixed-Effects Modeling with Crossed Random Effects for Subjects and Items. J. Mem. Lang. 2008, 59, 390–412. [Google Scholar] [CrossRef]
- Jaeger, T.F. Categorical Data Analysis: Away from ANOVAs (Transformation or Not) and towards Logit Mixed Models. J. Mem. Lang. 2008, 59, 434–446. [Google Scholar] [CrossRef]
- Schrepp, M.; Hinderks, A.; Thomaschewski, J. Construction of a Benchmark for the User Experience Questionnaire (UEQ). Int. J. Interact. Multimed. Artif. Intell. 2017, 4, 40. [Google Scholar] [CrossRef]
- Keil, J.; Edler, D.; Kuchinke, L.; Dickmann, F. Effects of Visual Map Complexity on the Attentional Processing of Landmarks. PLoS ONE 2020, 15, e0229575. [Google Scholar] [CrossRef]
- Yanyan, C.; Huijuan, W.; Xinjiang, M. Digital Image Enhancement Method Based on Image Complexity. Int. J. Hybrid Inf. Technol. 2016, 9, 395–402. [Google Scholar] [CrossRef]
- Lin, S.-W.; Lo, L.Y.-S.; Huang, T.K. Visual Complexity and Figure-Background Color Contrast of E-Commerce Websites: Effects on Consumers’ Emotional Responses. In Proceedings of the 2016 49th Hawaii International Conference on System Sciences (HICSS), Koloa, HI, USA, 5–8 January 2016; IEEE: Piscataway, NJ, USA, 2016; pp. 3594–3603. [Google Scholar]
- Sweller, J. Element Interactivity and Intrinsic, Extraneous, and Germane Cognitive Load. Educ. Psychol. Rev. 2010, 22, 123–138. [Google Scholar] [CrossRef]
- Rosenholtz, R.; Li, Y.; Nakano, L. Measuring Visual Clutter. J. Vis. 2007, 7, 17–22. [Google Scholar] [CrossRef]
- Wagemans, J.; Elder, J.H.; Kubovy, M.; Palmer, S.E.; Peterson, M.A.; Singh, M.; von der Heydt, R. A Century of Gestalt Psychology in Visual Perception: I. Perceptual Grouping and Figure–Ground Organization. Psychol. Bull. 2012, 138, 1172–1217. [Google Scholar] [CrossRef]
- Wertheimer, M. Untersuchungen Zur Lehre von Der Gestalt. II. Psychol. Forsch. 1923, 4, 301–350. [Google Scholar] [CrossRef]
- Simon, H.A. Information-Processing Models of Cognition. J. Am. Soc. Inf. Sci. 1981, 32, 364–377. [Google Scholar] [CrossRef]
- Baddeley, A.D.; Hitch, G.J.; Allen, R.J. Working Memory and Binding in Sentence Recall. J. Mem. Lang. 2009, 61, 438–456. [Google Scholar] [CrossRef]
- Kemps, E. Effects of Complexity on Visuo-Spatial Working Memory. Eur. J. Cogn. Psychol. 1999, 11, 335–356. [Google Scholar] [CrossRef]
- Attneave, F.; Arnoult, M.D. The Quantitative Study of Shape and Pattern Perception. Psychol. Bull. 1956, 53, 452–471. [Google Scholar] [CrossRef]
- Kocaoğlu Aslanoğlu, R.; Olguntürk, N. Color and Visual Complexity in Abstract Images: Part II. Color Res. Appl. 2019, 44, 941–947. [Google Scholar] [CrossRef]
- Kimmons, R. Color Theory in Experience Design. In Learner and User Experience Research; EdTech Books: London, UK, 2020; pp. 103–125. Available online: https://edtechbooks.org/ (accessed on 25 July 2024).


Disclaimer/Publisher’s Note: The statements, opinions and data contained in all publications are solely those of the individual author(s) and contributor(s) and not of MDPI and/or the editor(s). MDPI and/or the editor(s) disclaim responsibility for any injury to people or property resulting from any ideas, methods, instructions or products referred to in the content. |
© 2024 by the authors. Licensee MDPI, Basel, Switzerland. This article is an open access article distributed under the terms and conditions of the Creative Commons Attribution (CC BY) license (https://creativecommons.org/licenses/by/4.0/).