Article

Analytical and Experimental Investigation of Windage–Churning Behavior in Spur, Bevel, and Face Gears

College of Mechanical and Electrical Engineering, Central South University, Changsha 410083, China
*
Author to whom correspondence should be addressed.
Appl. Sci. 2024, 14(17), 7603; https://doi.org/10.3390/app14177603
Submission received: 31 July 2024 / Revised: 25 August 2024 / Accepted: 26 August 2024 / Published: 28 August 2024
(This article belongs to the Special Issue Mathematical Methods and Simulations in Mechanics and Engineering)

Abstract

:
This paper presents comparable sets of the no-load power loss as a product of windage and churning behaviors of a family of various rotating parts (i.e., disc, spur gear, straight bevel gear, and orthogonal face gear). Experimental measurements were carried out under pure air only and under partial immersion in oil to qualify and quantify the windage and churning effects of no-load power losses of a family of spur, bevel, and face gears along with a representative disc as the baseline. Aiming at exploring the influence of gear teeth on the total no-load power losses, two different theoretical analytical approaches are introduced to account for the churning contributions, by which the total power losses are estimated. Both analytical approaches compare well with the experimental findings. Furthermore, a spatial intersecting cross-axis gear (e.g., straight bevel gear and orthogonal face gear) results in higher no-load power losses than that of a representative disc or a parallel-axes gear. The significance of gear teeth (gear vs. disc) on windage behavior is presented, as well as the gear windage effects on the churning phenomenon in a high-speed splash-lubricated gear.

1. Introduction

In intermediate and tail gearboxes in rotorcrafts or conventional automotive applications, the gears are partially submerged in lubricating oil, while the non-submerged parts are lubricated by oil droplets and ligaments flung off from the oil bath, known as dip or splash lubrication. The heat generated during the interaction of oil with rotating wheels is called churning loss, a type of no-load power loss independent of loading conditions. Another no-load loss related to air is called windage loss. Additionally, loss occurs due to the compression and expansion of both oil and air in the gear meshes, known as pumping loss. This study does not address pumping loss, as we focused on an isolated wheel, including a disc, spur gear, straight bevel gear, and orthogonal face gear (see Figure 1).
Not only experimental and theoretical investigations on the interactions of a nonhomogeneous fluid of air–oil mixture with rotary wheels under splash lubrication, but also computational fluid dynamics (CFD) have been widely used to reproduce the complexity of two-phase flow. Many scientific papers have focused on the drag torque of rotary discs (e.g., Soo [1], Daily and Nece [2], and Mann and Marston [3]). Among them, some studies noted that the main difference in no-load power losses between the disc and gear lies in the windage losses of gear teeth [4].
To date, a substantial portion of the scientific literature has concentrated on investigating the churning losses of spur gears. Andersson [5] found that the gears churn the lubricant, giving rise to power losses that are related to the amount and properties of the lubricant. Changenet et al. [6,7,8] and Seetharaman et al. [9,10] proposed a set of theoretical analytical models for predicting the churning drag torque of an isolated cylindrical gear or gear pair with or without a shroud. Neurouth et al. [11] investigated the influence of oil aeration on churning losses. Furthermore, the transition state between windage and churning phenomena was experimentally and theoretically explored, respectively [12,13]. Windage losses can be 25% greater for oil-immersion depths under the gear tip compared to those without oil. Leveraging CFD techniques, some studies (Concli et al. [14,15,16]; Mastrone and Concli et al. [17,18]; Kodela et al. [19]; Chen and Matsumoto [20]; Cavotta et al. [21]; Hu et al. [22]; Atencio et al. [23]) estimated the churning drag torques and reproduced the oil flow pattern characteristics of splash-lubricated gears. The CFD technique applies not only to rotating gears but also to rolling bearings. Liebrecht et al. [24] presented experimental studies and numerical simulations that illustrate the influence of the oil quantity on the drag and churning losses. Maccioni et al. [25] numerically predicted the aeration that influences lubrication mechanisms in rolling element bearings and compared the results with experimental data acquired on a dedicated test rig exploiting particle image velocimetry (PIV).
Mauz [26] proposed some models to predict the no-load losses of gearboxes even if their accuracy and range of application are limited. Diab et al. [27] and Seetharaman and Kahraman [28] proposed a prediction model for gear windage losses, and the total power losses of a gear pair were also obtained, including the windage losses of individual gears as well as pumping losses [29,30]. Marchesse et al. [31] and Pallas et al. [32] numerically investigated the complexity of the actual airflow patterns aspirated in the axial direction and ejected radially and effectively estimated the gear windage power losses. Ruzek et al. [33] measured the windage losses of a pseudo-gear pair using a test rig and indicated that the total windage losses were slightly less than the sum of the losses of each gear, similar to the foundation obtained by Dai et al. [34] via CFD simulations.
Spiral bevel gears are usually adopted in gear transmission systems in rotorcrafts. Laruelle et al. [35] and Quiban et al. [36] experimentally investigated churning losses of a single spiral bevel gear and then improved an analytical model of churning losses that introduced the dynamic immersion depth, a similar quasi-analytical model that estimates the churning losses of a spiral bevel gear considering the influence of windage effect to change the oil-immersed depth (Dai et al. [37]). Aiming at an intermediate gearbox of helicopters under splash lubrication, the CFD method was also employed to predict the energy dissipation and oil liquid flow property [38,39,40]. Two other meshless methods, the smoothed particle hydrodynamics and moving particle semi-implicit methods, were also used to address the churning behavior of spiral bevel gears [41,42]. In terms of windage loss of spiral bevel gears, Rapley et al. [43,44] concluded that the shroud geometry causes significant variation in windage-resisting torque levels for an isolated spiral bevel gear by leveraging the CFD method. Zhu et al. [45,46,47] numerically and theoretically investigated the windage phenomenon of bevel gears and suggested that the presence of a shroud can significantly reduce losses by approximately 80% compared to an unshrouded gear. Several other researchers conducted related work [48,49,50,51].
Several previous studies concentrated on no-load power losses of orthogonal face gears. Dai et al. [52] conducted CFD simulations on the windage behavior of an isolated shrouded or unshrouded face gear and found that the clearance of the gear with the shroud is crucially important to power losses. Zhu and Dai [53] developed an analytical approach for the estimation of churning losses of a dip-lubricated face gear considering the wind effect.
Given the above literature, there are still some issues regarding the no-load power losses of various wheels, especially concerning their essential difference and similarities in terms of windage and churning behaviors. Accordingly, we aimed to carry out a series of experiments and analyses of a family of typical wheels. For this purpose, a family of disc, spur gear, straight bevel gear, and orthogonal face gear were lubricated and tested on an ad hoc test bench. For splash-lubrication tests, oil depth and rotational speed were defined as operating condition parameters to measure their influence. Likewise, the related theoretical formulas of the no-load power losses as the sum of the windage and churning losses are also presented. Comparable qualitative and quantitative analyses of windage–churning behavior for various wheels are further provided.

2. No-Load Power Loss Formulas for a Rotating Part

Generally speaking, the total no-load power losses Pno-load of an isolated splash-lubricated wheel can be divided into two parts: churning losses Pch and windage losses Pwi.

2.1. Churning Parts

2.1.1. Dimension Analysis Method

It is widely accepted that the most influential parameters of churning power losses are the outside radius R0, the angular velocity ω, the oil density ρoil, the oil-wetted area Sm, and the dimensionless churning torque coefficient Cch based on the Pi Theorem according to Diab et al. [27] and Laruelle et al. [35].
The churning losses can be given as:
P c h = 0.5 ρ o i l ω 3 S m R 0 3 C c h
where Sm is the oil-wetted area:
S m = 0.5 π arcsin 1 h ¯ 1 h ¯ h ¯ 2 h ¯ R 0 2
with
C c h = 1.45 R e 0.25 Fr 0.53 h / R 0 0.15 V 0 / R 0 3 0.2 ( R e 2 × 10 4 ,   laminar   flow ) 0.12 F r 0.53 h / R 0 0.15 V 0 / R 0 3 0.2 ( R e > 2 × 10 4 ,   turbulent   flow )
where V0 represents the linear velocity for outside radius, Re is the Reynolds number, and Fr represents the Froude number.

2.1.2. Fluid Flow Method

Following Dai et al. [37] based on the boundary layer theory, the churning power losses Pch can be regarded as the sum of the power losses exerted on faces Pch_f, the circumference Pch_p, and the gear teeth Pch_rf:
P c h = P c h _ p + P c h _ f + P c h _ r f
where
P c h _ p = 4 μ o i l b g ω 2 R 0 2 cos 1 1 h ¯
and
P c h _ f = 0.205 ρ o i l μ o i l 0.5 ω 2.5 R 0 4 0.5 π arcsin 1 h ¯ 1 h ¯ h ¯ 2 h ¯ sin arccos 1 h ¯ ( R e 5 × 10 4 ,   laminar   flow ) 0.0125 ρ o i l μ o i l 0.14 ω 2.86 R 0 4.72 0.5 π arcsin 1 h ¯ 1 h ¯ h ¯ 2 h ¯ sin arccos 1 h ¯ 0.14 ( R e 5 × 10 5 ,   turbulent   flow )
and
P c h _ f s = n μ o i l ω θ c r i r r 2 r i + r r k 3 r i r r k 4
A combination of experimental observation and theoretical analysis suggests that, instead of static depth, the dynamic immersed depth is more suitable for predicting churning power losses according to Quiban et al. [36] and Dai et al. [37]. The evolution model of dynamic depth is given as:
h ¯ d y n = h ¯ s t a t F r * 25 7.88 h ¯ s t a t 2 5.51 h ¯ s t a t F r * 25 / 30 7.88 h ¯ s t a t + 6.51 + h ¯ s t a t   25 F r * 55   h ¯ s t a t / 7.88 h ¯ s t a t + 6.51 F r * 55
where Fr* represents the Froude number for oil-free surface flows, as:
F r * = ω R 0 / g h

2.2. Windage Parts

Following the approach of Dai et al. [37] based on the boundary layer theory, the windage power losses Pwi of a disc are the set of the power losses generated from faces Pwi_f and the circumference P wi_p, expressed as:
P w i = P w i _ p + P w i _ f
where the power losses generated from the circumference P wi_p is related to air viscosity μair, gear width b, angular velocity ω, and the outside radius R0 of the gear, as:
P w i _ p = 4 π μ a i r b ω 2 R 0 2
and
P w i _ t = 0.205 ρ a i r μ a i r 0.5 ω 2.5 R 0 4 0.5 π arcsin 1 h ¯ 1 h ¯ h ¯ 2 h ¯ sin arccos 1 h ¯ ( R e 5 × 10 4 ,   laminar   flow ) 0.0125 ρ a i r μ a i r 0.14 ω 2.86 R 0 4.72 0.5 π arcsin 1 h ¯ 1 h ¯ h ¯ 2 h ¯ sin arccos 1 h ¯ 0.14 ( R e 5 × 10 5 ,   turbulent   flow )
In terms of gears, the windage power losses also include the energy dissipation that occurs within the tooth space. These windage power losses Pwi_t of gear teeth are expressed as:
P w i _ t = 0.5 C w i _ t ρ a i r ω 3 R p 5
For spur gears, the dimensionless windage torque coefficient is determined according to Diab et al. [27]:
C w i _ t ξ Z 4 b g R p 1 + 2 1 + x 1 Z 4 ( 1 cos ϕ ) ( 1 + cos ϕ ) 3
For bevel gears, the dimensionless windage torque coefficient is derived by Zhu et al. [45]:
C w i _ t ξ R p 5 0 b g 1 4 Z R e b g sin δ 4 1 + cos δ h a * + x 1 Z 4 ( 1 cos ϕ ) ( 1 + cos ϕ ) 3 d b
The reduction coefficient ξ represents the inhibiting effect of the shroud, flanges, gearbox housing, etc. on the fluid aspiration happening in the gear teeth.

2.3. Air–Oil Ratio Relation

As these gears are under the influence of both air and oil, the fluid medium should be an air–oil mixture due to the severe fluid–solid interaction, and its density can be given as proposed by Dai et al. [13]:
ρ m i x = α a i r ρ a i r + ( 1 α a i r ) ρ o i l = χ ρ a i r
where the air–oil ratio of the oil–gas mixture χ is the product of the tangential velocity and non-dimensional oil depth h ¯ as:
χ = p 0 + p 1 V + p 2 ( h ¯ ) + p 3 V 2 + p 4 V ( h ¯ ) + p 5 ( h ¯ ) 2 + p 6 V 3 + p 7 V 2 ( h ¯ ) + p 8 V ( h ¯ ) 2
where pi (i = 1, 2, 3, …, 8) represents the constant coefficient; the values refer to ref. [13].

3. Experimental Methodology

3.1. Test Bench

An ad hoc test rig was set up and used for the high-speed lubrication tests of various wheels including disc, cylindrical gear, bevel gear, and orthogonal face gear (see Figure 2). The specific test bench consists of a high-speed motor whose rated rotating speed is 12,000 rpm, a torque transducer whose accuracy is 0.1 Nm, and the full-range value is 10 Nm, a 3D printed testing wheel, and a rectangular gearbox housing (380 mm × 266 mm × 100 mm) made of Plexiglas, which is convenient for observation by a high-speed camera. It is generally acknowledged that the PIV technique should be used to obtain the velocity information for the flow field and further determine the pressure field, vorticity field, and other physical information for quantitative research prior to the flow field images captured by a high-speed camera for qualitative research [25]. Subject to the experimental conditions, a high-speed camera is adopted in this paper. We used 3D-printed gears instead of metal gears to investigate the no-load power loss, for the following reasons. Firstly, it is accepted that the no-load power loss, whether windage or churning loss, is caused by the relative motion between the rotating wheel and the surrounding fluid medium. Secondly, the net resistance concerning windage or churning loss is extracted from the gear system by subtracting the no-gear system. Therefore, these power losses have no connection with the gear materials. Similarly, 3D-printed gear was used to conduct splash lubrication for an orthogonal face gear, and the experiments agreed well with theoretical analysis according to Zhu and Dai [53]. The rotary speed and resistance torque were measured and recorded by a torque transducer (DYN-200, accuracy = 0.1%, measuring range = 0–10 Nm) and each test reached relative stability as the torque variation rate did not exceed 8%. It takes about 1–2 min for each case to reach relative stability. The net drag torque concerning windage or churning loss is determined by subtracting the no-gear resisting torque from the gear resisting torque. Additionally, the churning power loss generated by different wheels in this paper is not very large and raises the oil temperature very little in such short a time; therefore, the oil density or viscosity is regarded to be nearly constant over all cases.
The main parameters of different kinds of wheels, including outside diameter (D0 = 163.5 mm), teeth width (bt = 17.83 mm), and teeth number (Z = 51), remain the same to explore the influence of the wheel types. The typical geometric structure is shown in Figure 3, with the pitch angle of the bevel gear being 45°. The test speeds of revolutions in the counterclockwise direction were changed from 0 to 6000 rpm. Aviation lubricating oil was replaced by purified water for cleaning purposes. The initial dimensionless oil immersion depth was 0.3 and 0.5.

3.2. Experimental Results

The windage drag torque of the disc is negligible as calculated by Equations (10) and (11). Figure 4 depicts the change laws of disc drag torque values as the sum of the torque of the no-gearing system and the windage torque of the disc in the gearbox housing against the rotational speed. It is observed that the drag torque of the disc is less sensitive to the rotational speed. Hence it can be inferred that the windage drag torque of the disc is negligible, as theoretically analyzed by Equations (10) and (11). Therefore, these experimental measurements are the baseline test to obtain the net no-load power loss of all types of wheels. The standard deviations of the total no-load resisting torque from 1000 rpm to 6000 rpm are 0.0812, 0.0080, 0.0055, 0.0066, 0.0058, and 0.0027, respectively.
Furthermore, the net no-load resisting torque was obtained at different oil-immersion depths and rotational speeds (Figure 5). As presented, the total no-load torque consisting of windage and churning drag torques showed a positive correlation with the rotational speed and oil depth. However, the changing trends between the resisting torque and the speed do not dovetail neatly with the parabolic rate law ( T a l l ω λ , λ 2 ). The two main reasons resulting in this changing law may be the strong windage effects and the non-constant churning torque coefficient Cch. For example, at the immersion depth h ¯ of 0.5, the resisting torque evolves as the rotational speed power of nearly 0.76 for the spur gear (speed power of 0.79 in ref. [13] and 0.84 in ref. [12]), while windage torque evolves as the rotational speed power 2 as concluded by Diab et al. [27]. This suggests that both the windage and churning phenomenon are remarkable and co-exist as stated by Quiban et al. [12] and Dai et al. [13]. Other gears have similar situations as shown in Figure 5. The standard deviations of the total no-load resisting torque for the immersion depth of 0.3 and 0.5 are listed in Table 1 and Table 2, respectively.
Although these wheels are fairly comparable in size and form, they are diverse in power losses and fluid flow patterns due to the gear teeth. Different wheels have a greater or lesser degree of windage effect, while the windage effect of the disc is the smallest. For straight bevel gears and orthogonal face gears, the churning behavior was investigated by Quiban et al. [36] and Dai et al. [37]. Their studies found that due to the air-pumping effect around these cross gears, the dynamic oil depth appears instead of the static oil depth. Corresponding qualitative analysis was carried based on churning behavior images captured by a high-speed camera, as depicted in Figure 6 and Figure 7. As observed, a great amount of oil is stirred up along the rotational direction of the wheel, and most of it then hits the right wall of the housing and works in unison to flow back to the pool. Meanwhile, a higher rotational speed or oil depth contributes to more violent waves. The oil-free surface is very close to calm at a lower rotational speed and oil depth (h/Ro = 0.2, ng ≈ 1000 rpm), especially for the disc. The light windage effect of the gear teeth disturbs the surface of the oil pool in the gearbox for the spur, bevel, and face gears. At a higher rotational speed and oil depth (h/Ro = 0.3, ng ≈ 6000 rpm), the front and right walls of the housing are filled with an enormous quantity of liquid droplets and ligaments, especially for these gears. Additionally, high-speed rotating airflow driven by the rotating wheels, namely the strong windage effect, generates a surrounding air pillow and changes the oil-immersion depth less than the initial static oil depth by direct naked-eye observation, particularly noticeable at higher rotational speeds. The results reflect the hypothesis of dynamical immersion depth raised by Quiban et al. [36].

4. Results and Discussion

4.1. Comparisons of Various Methods

As the sum of the windage power losses and churning power losses, the total no-load power losses for the disc can be calculated and determined based on Section 2. Figure 8 compares these calculated power losses using different empirical formulas or theoretical models with the experimental measurements for the disc at a dimensionless depth h/R0 of 0.5. The empirical formula based on Terekhov [54] grossly overestimates the total losses, while the theoretical method developed by Boness [55] significantly underestimates the power losses. The estimations obtained by Laruelle et al. [35] and theoretical analysis considering the effect of the oil–air ratio in this paper are in good agreement with those experimental findings, whose average errors are only 12.97% and 16.71%, respectively. Windage losses account for about 1% of the disc’s no-load losses, again indicating that the windage effect can be ignored for the disc. However, the windage losses of gears are at least one order of magnitude higher than those of discs of the same size. It is also demonstrated that the gear teeth are main contributors to the windage power losses.
The results from the semi-empirical formulas (Laruelle et al. [35]) and the theoretical method in this paper are compared with the experiments at a depth h/R0 of 0.3 in Figure 9. The estimations obtained by Laruelle et al. [35] slightly underestimate the power losses, while the theoretical analysis method in this paper slightly overestimates the losses; their average errors are 19.54% and 26.18%, respectively. Overall, both compared well with experimental findings.

4.2. Predictions of Different Wheels

As described above, both the dimension analysis method by Laruelle et al. [35] and the fluid flow method considering the dynamic depth integrating the air–oil ratio can make a good predictor of churning power losses for a typical disc. These approaches are then applied to other wheels including the spur gear, straight bevel gear, and orthogonal face gear. Figure 10, Figure 11 and Figure 12 show the total no-load power losses using these two analytical approaches against rotational speed for the spur, bevel, and face gears. The experimental results are also superimposed in Figure 10, Figure 11 and Figure 12. To sum up, acceptable agreements between the theoretical calculations and experimentations are shown, except in the case of an oil depth h/R0 of 0.3 and rotational speed of approximately 6000 rpm caused by experimental measuring errors.
Some observations can be made:
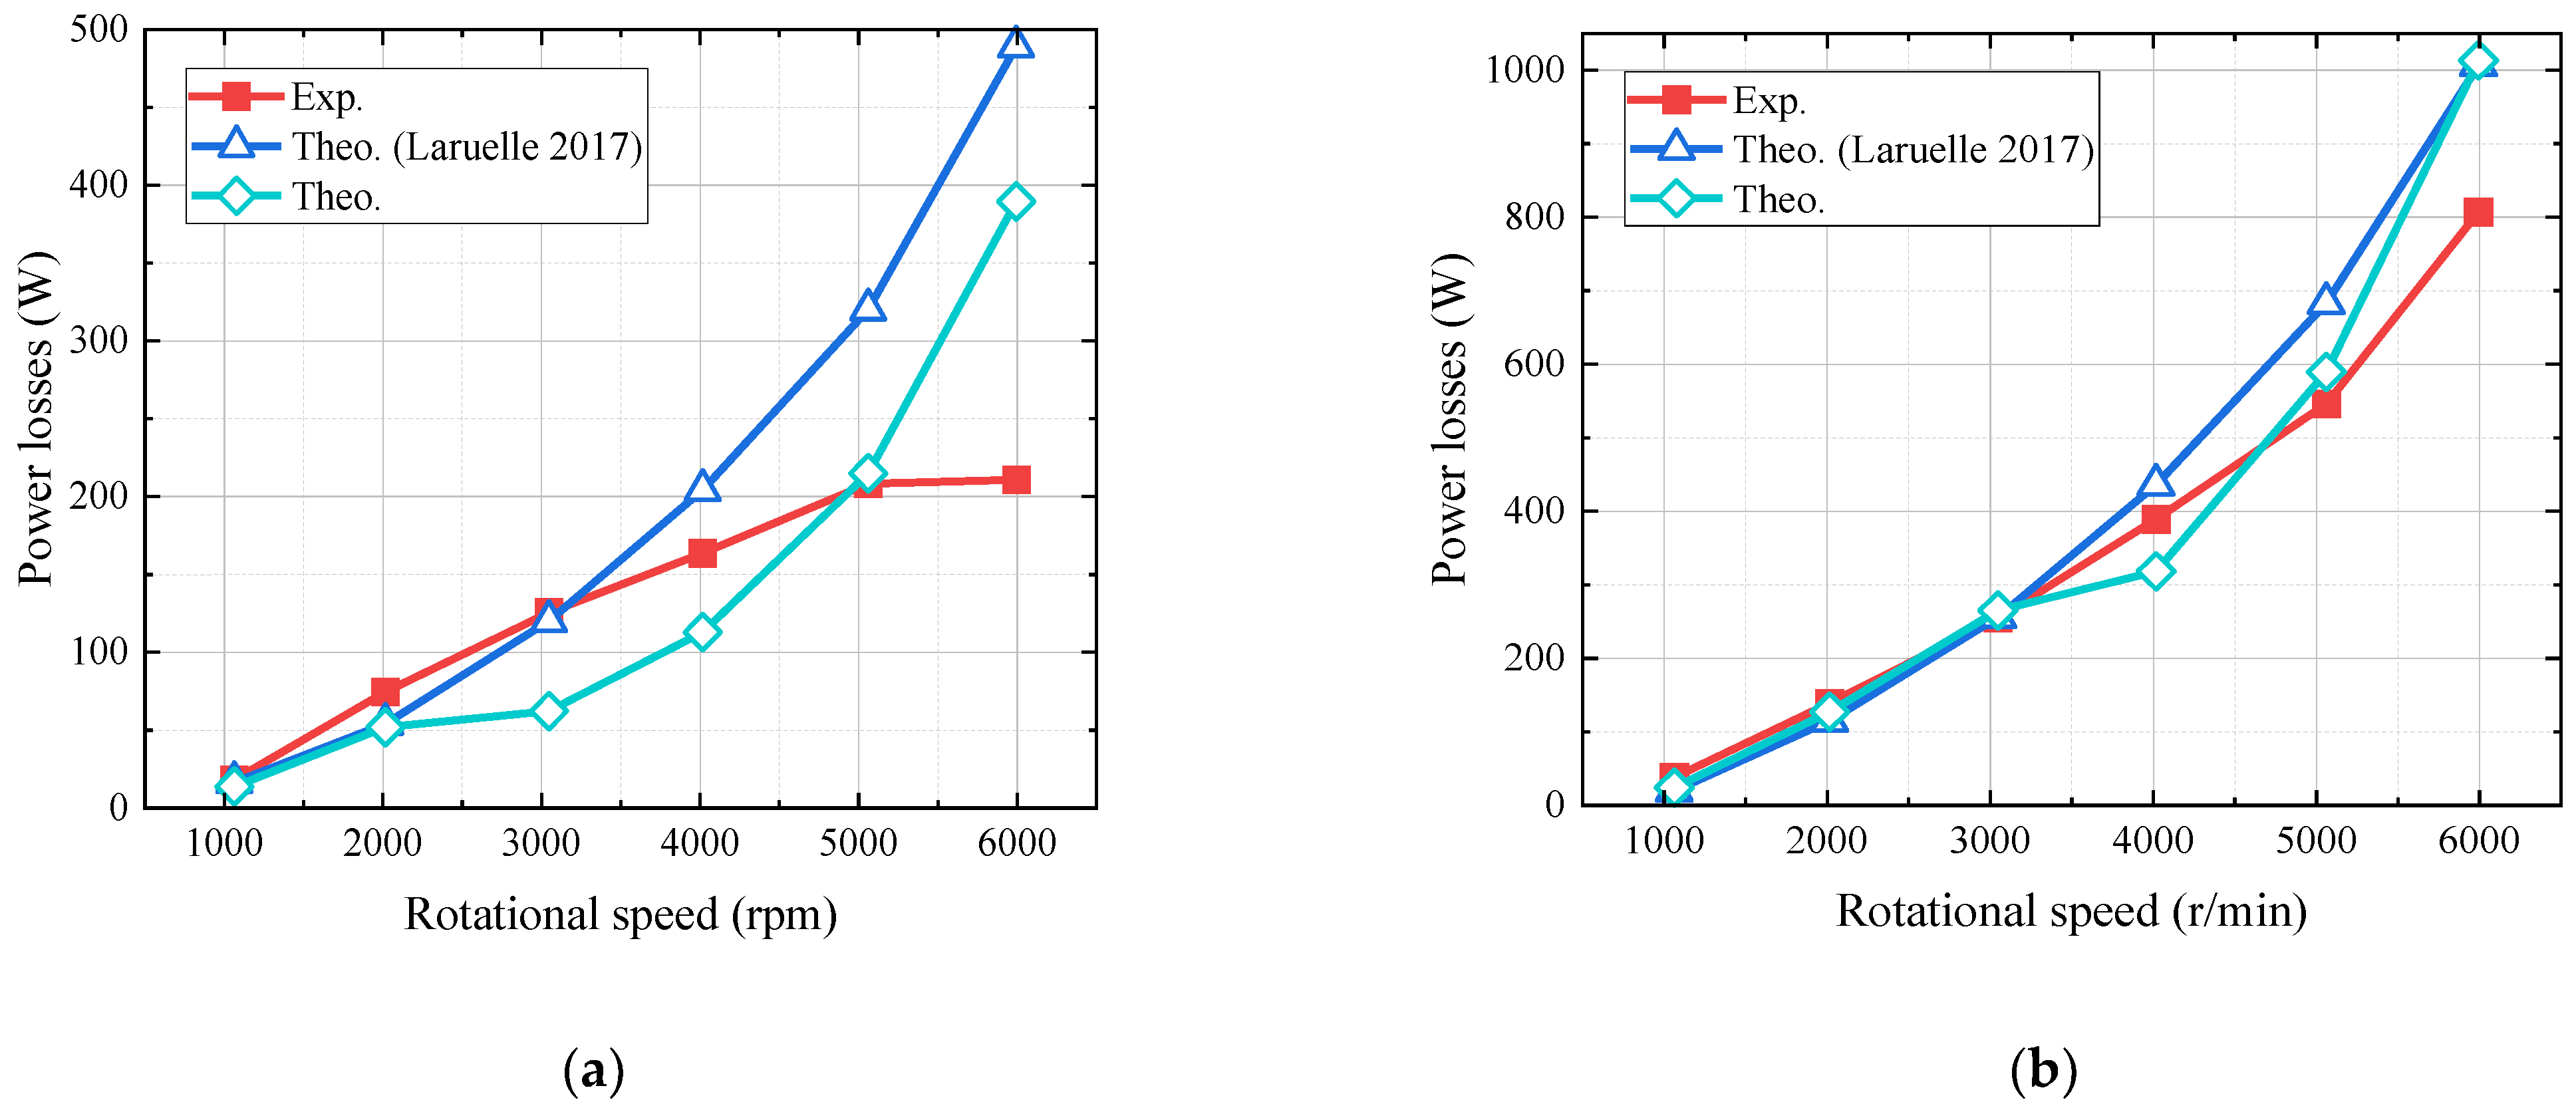
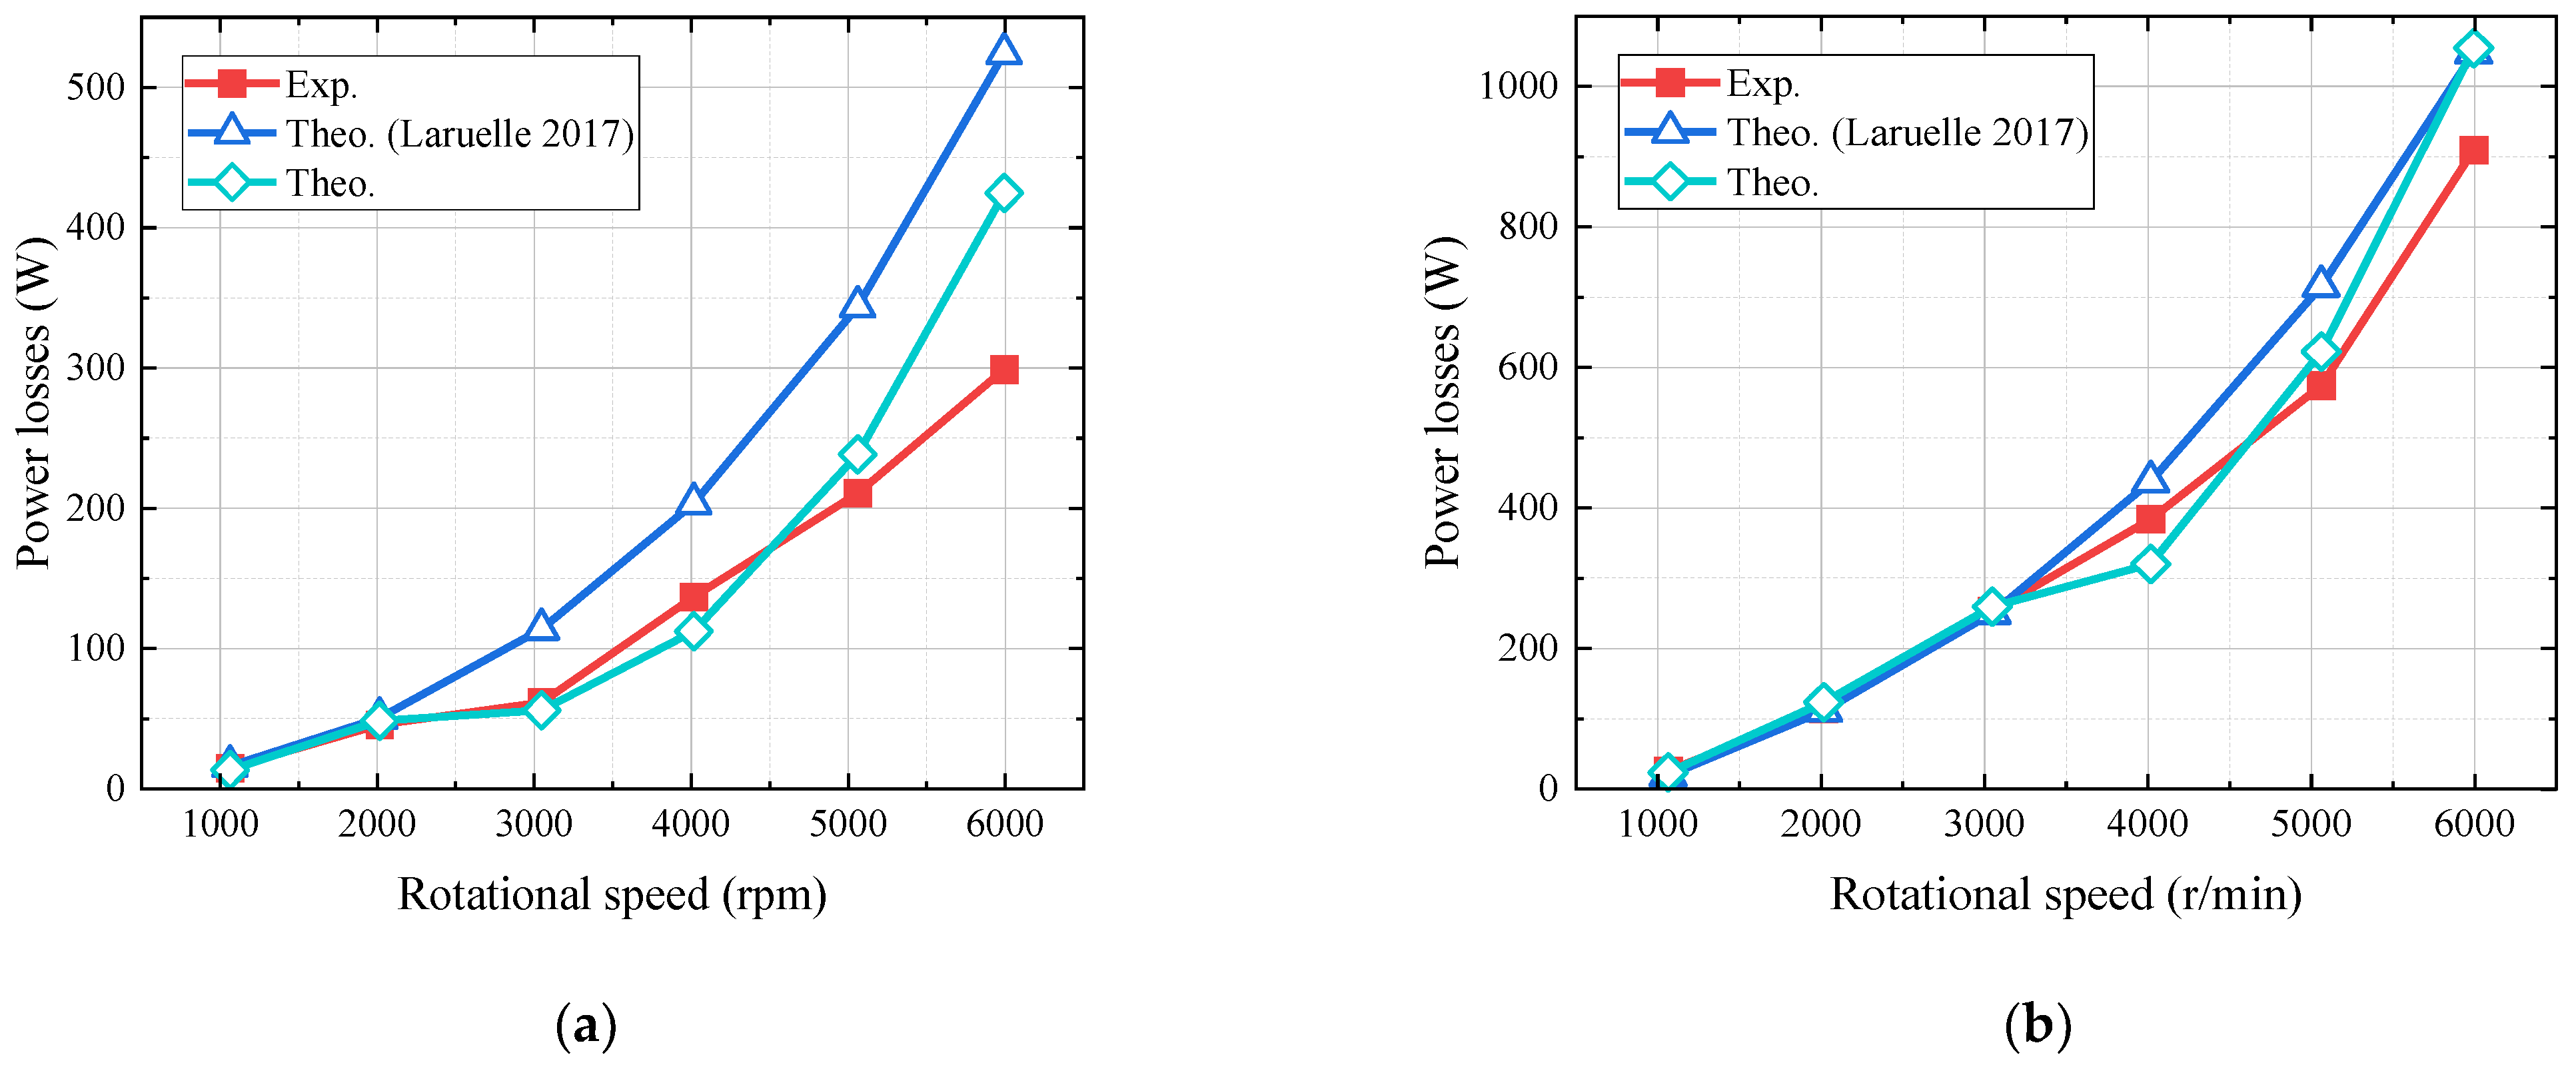
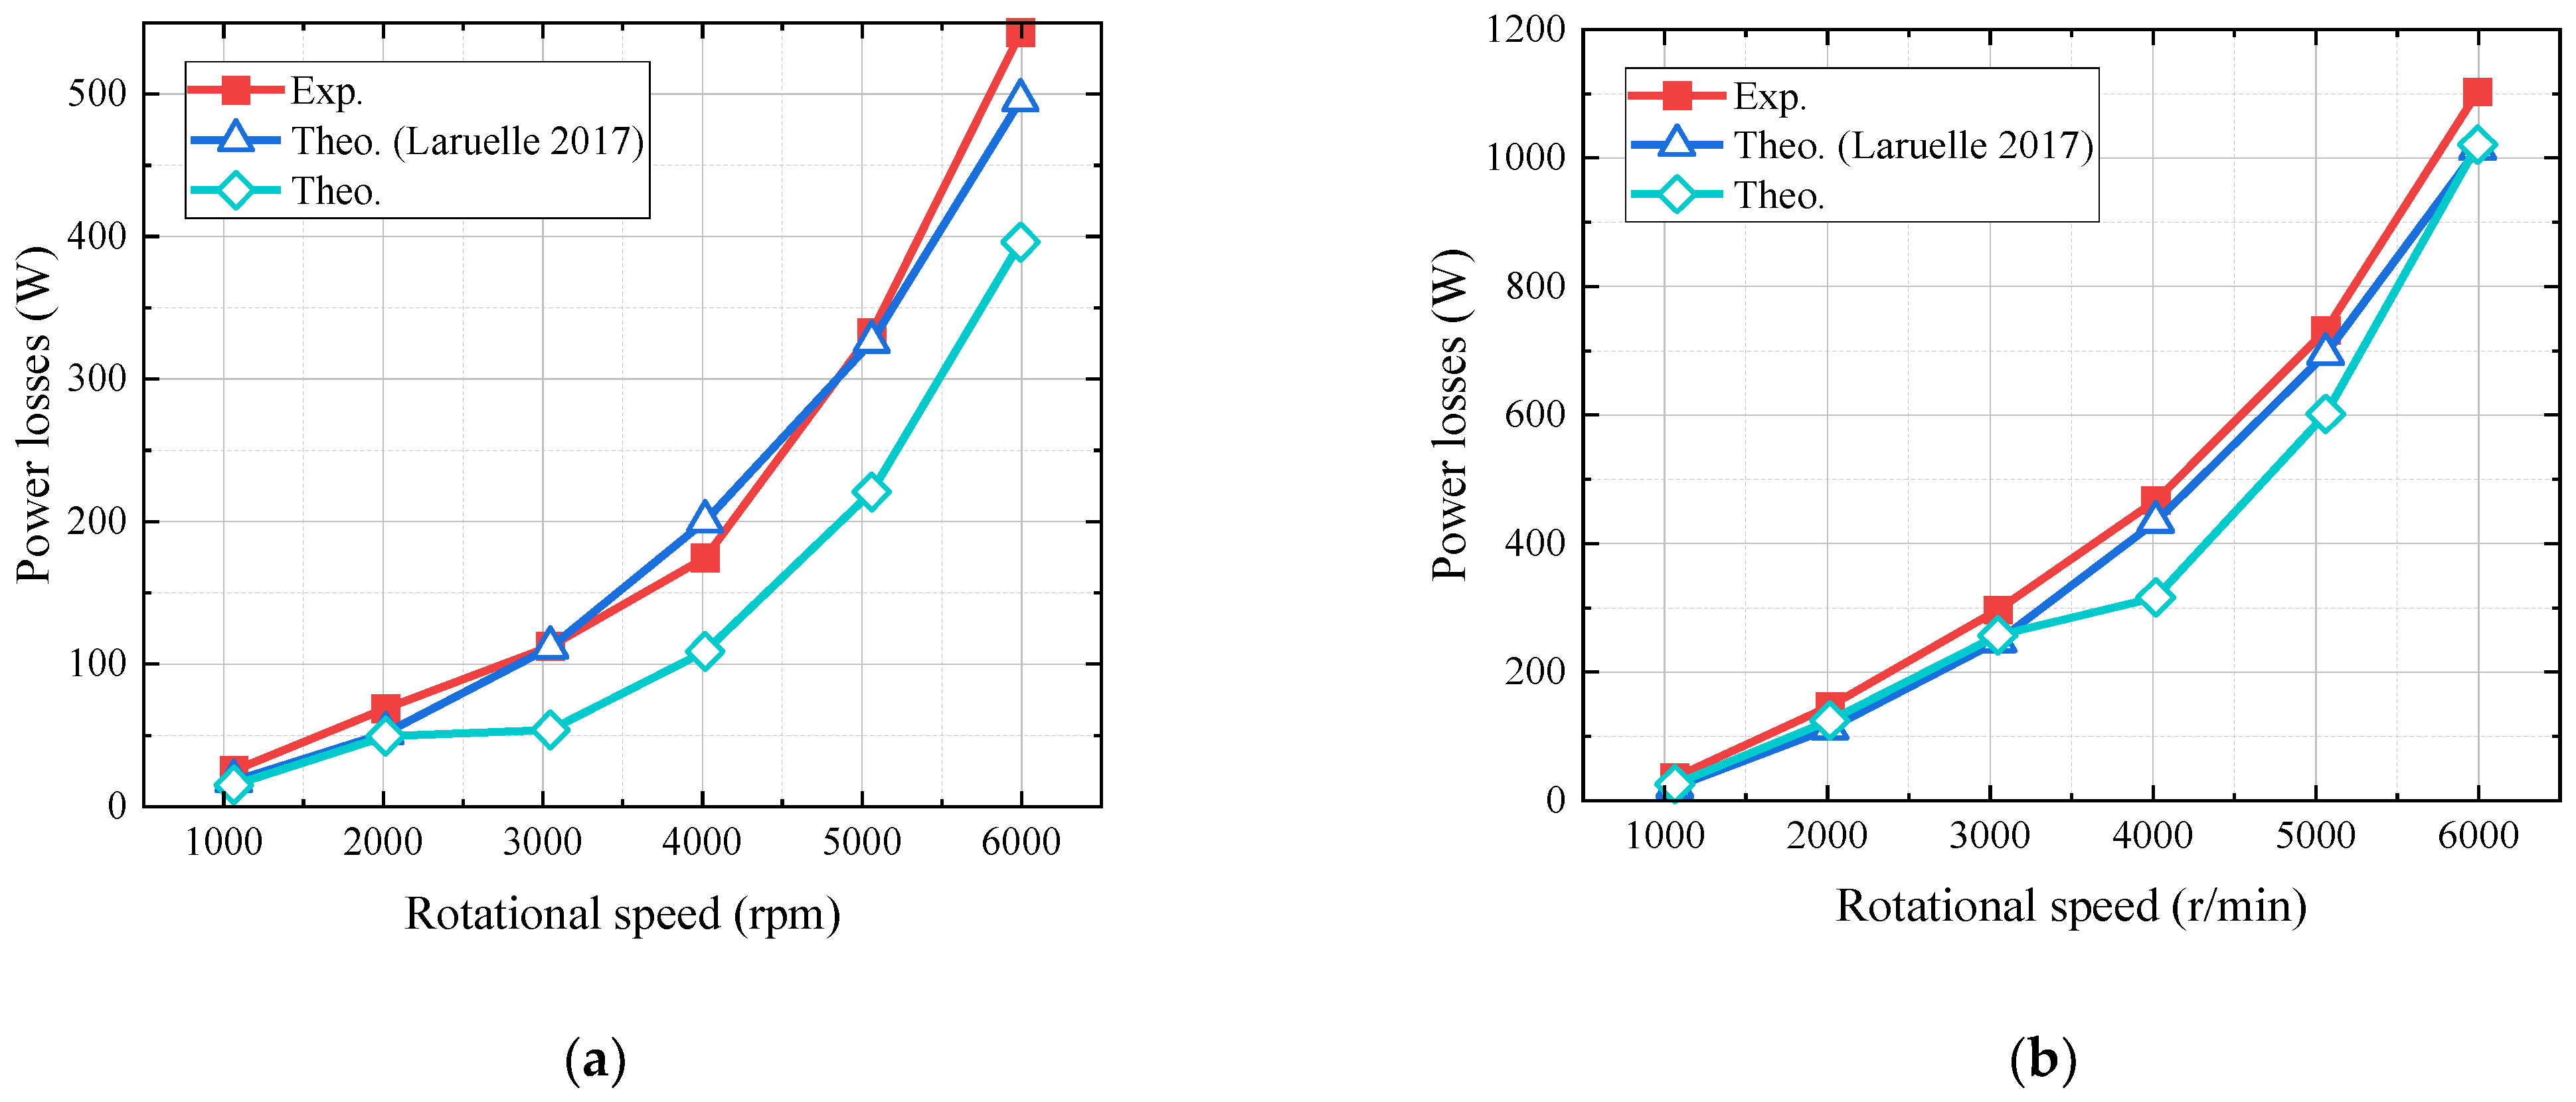
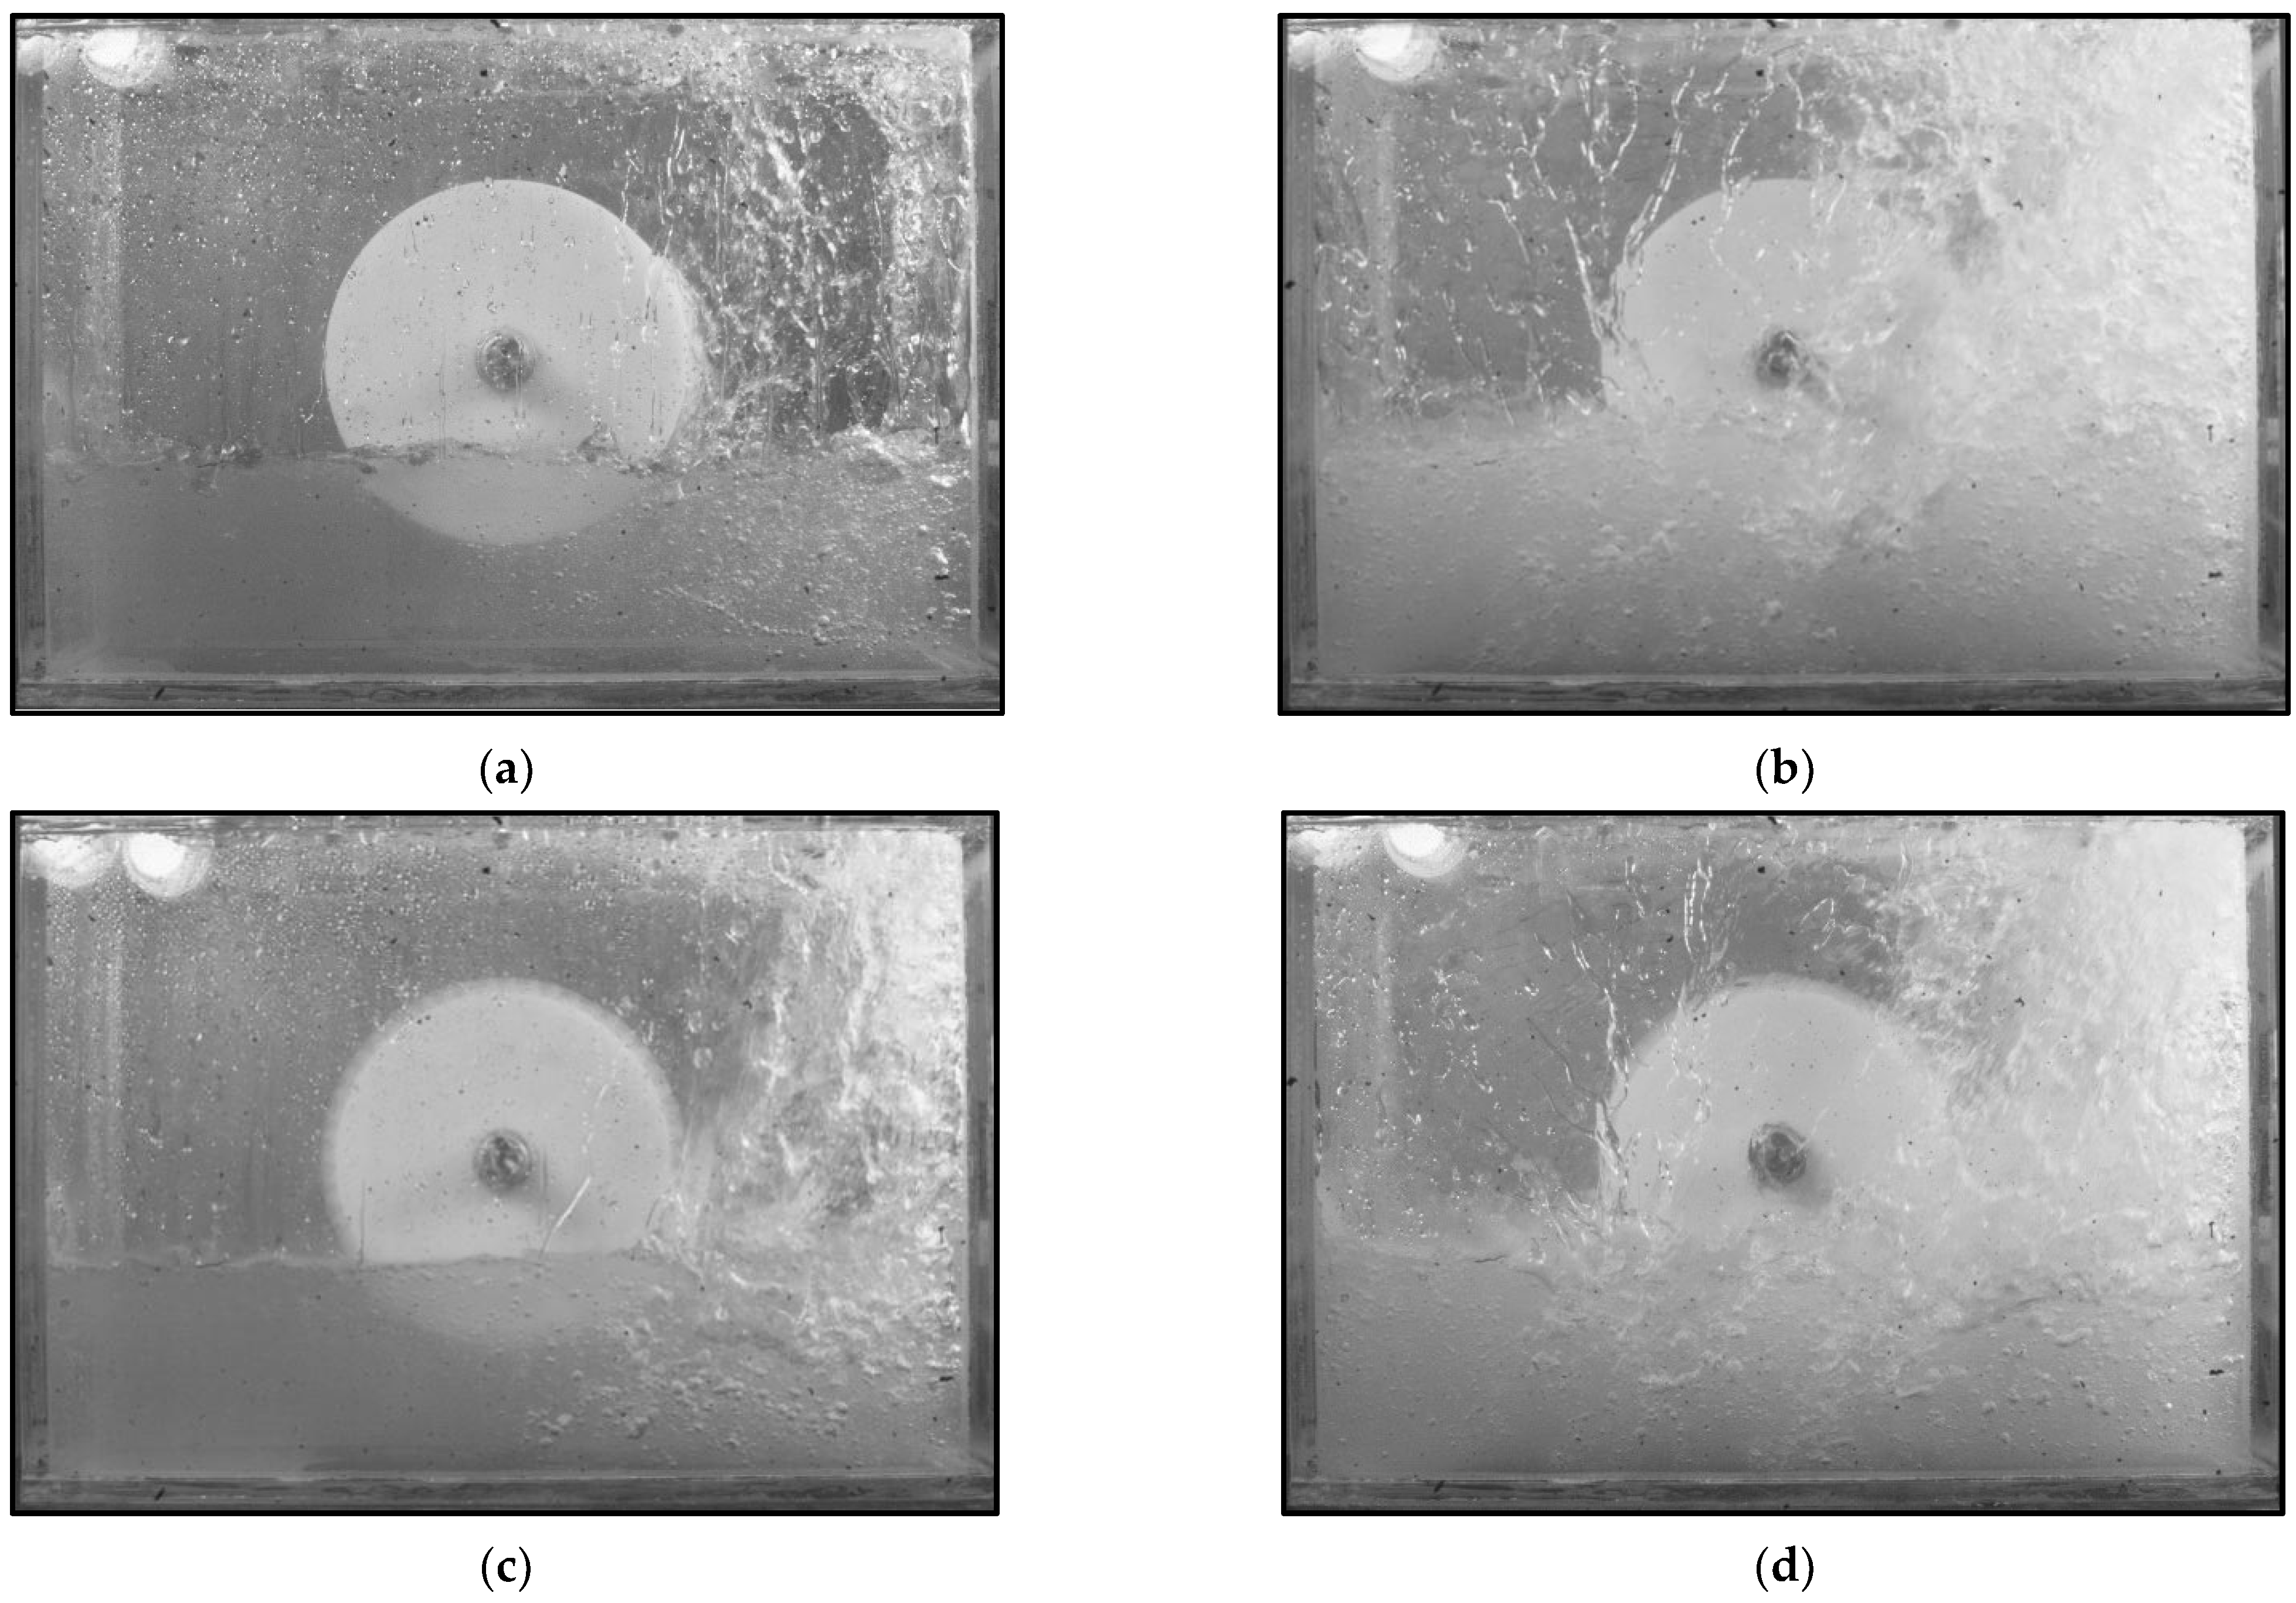
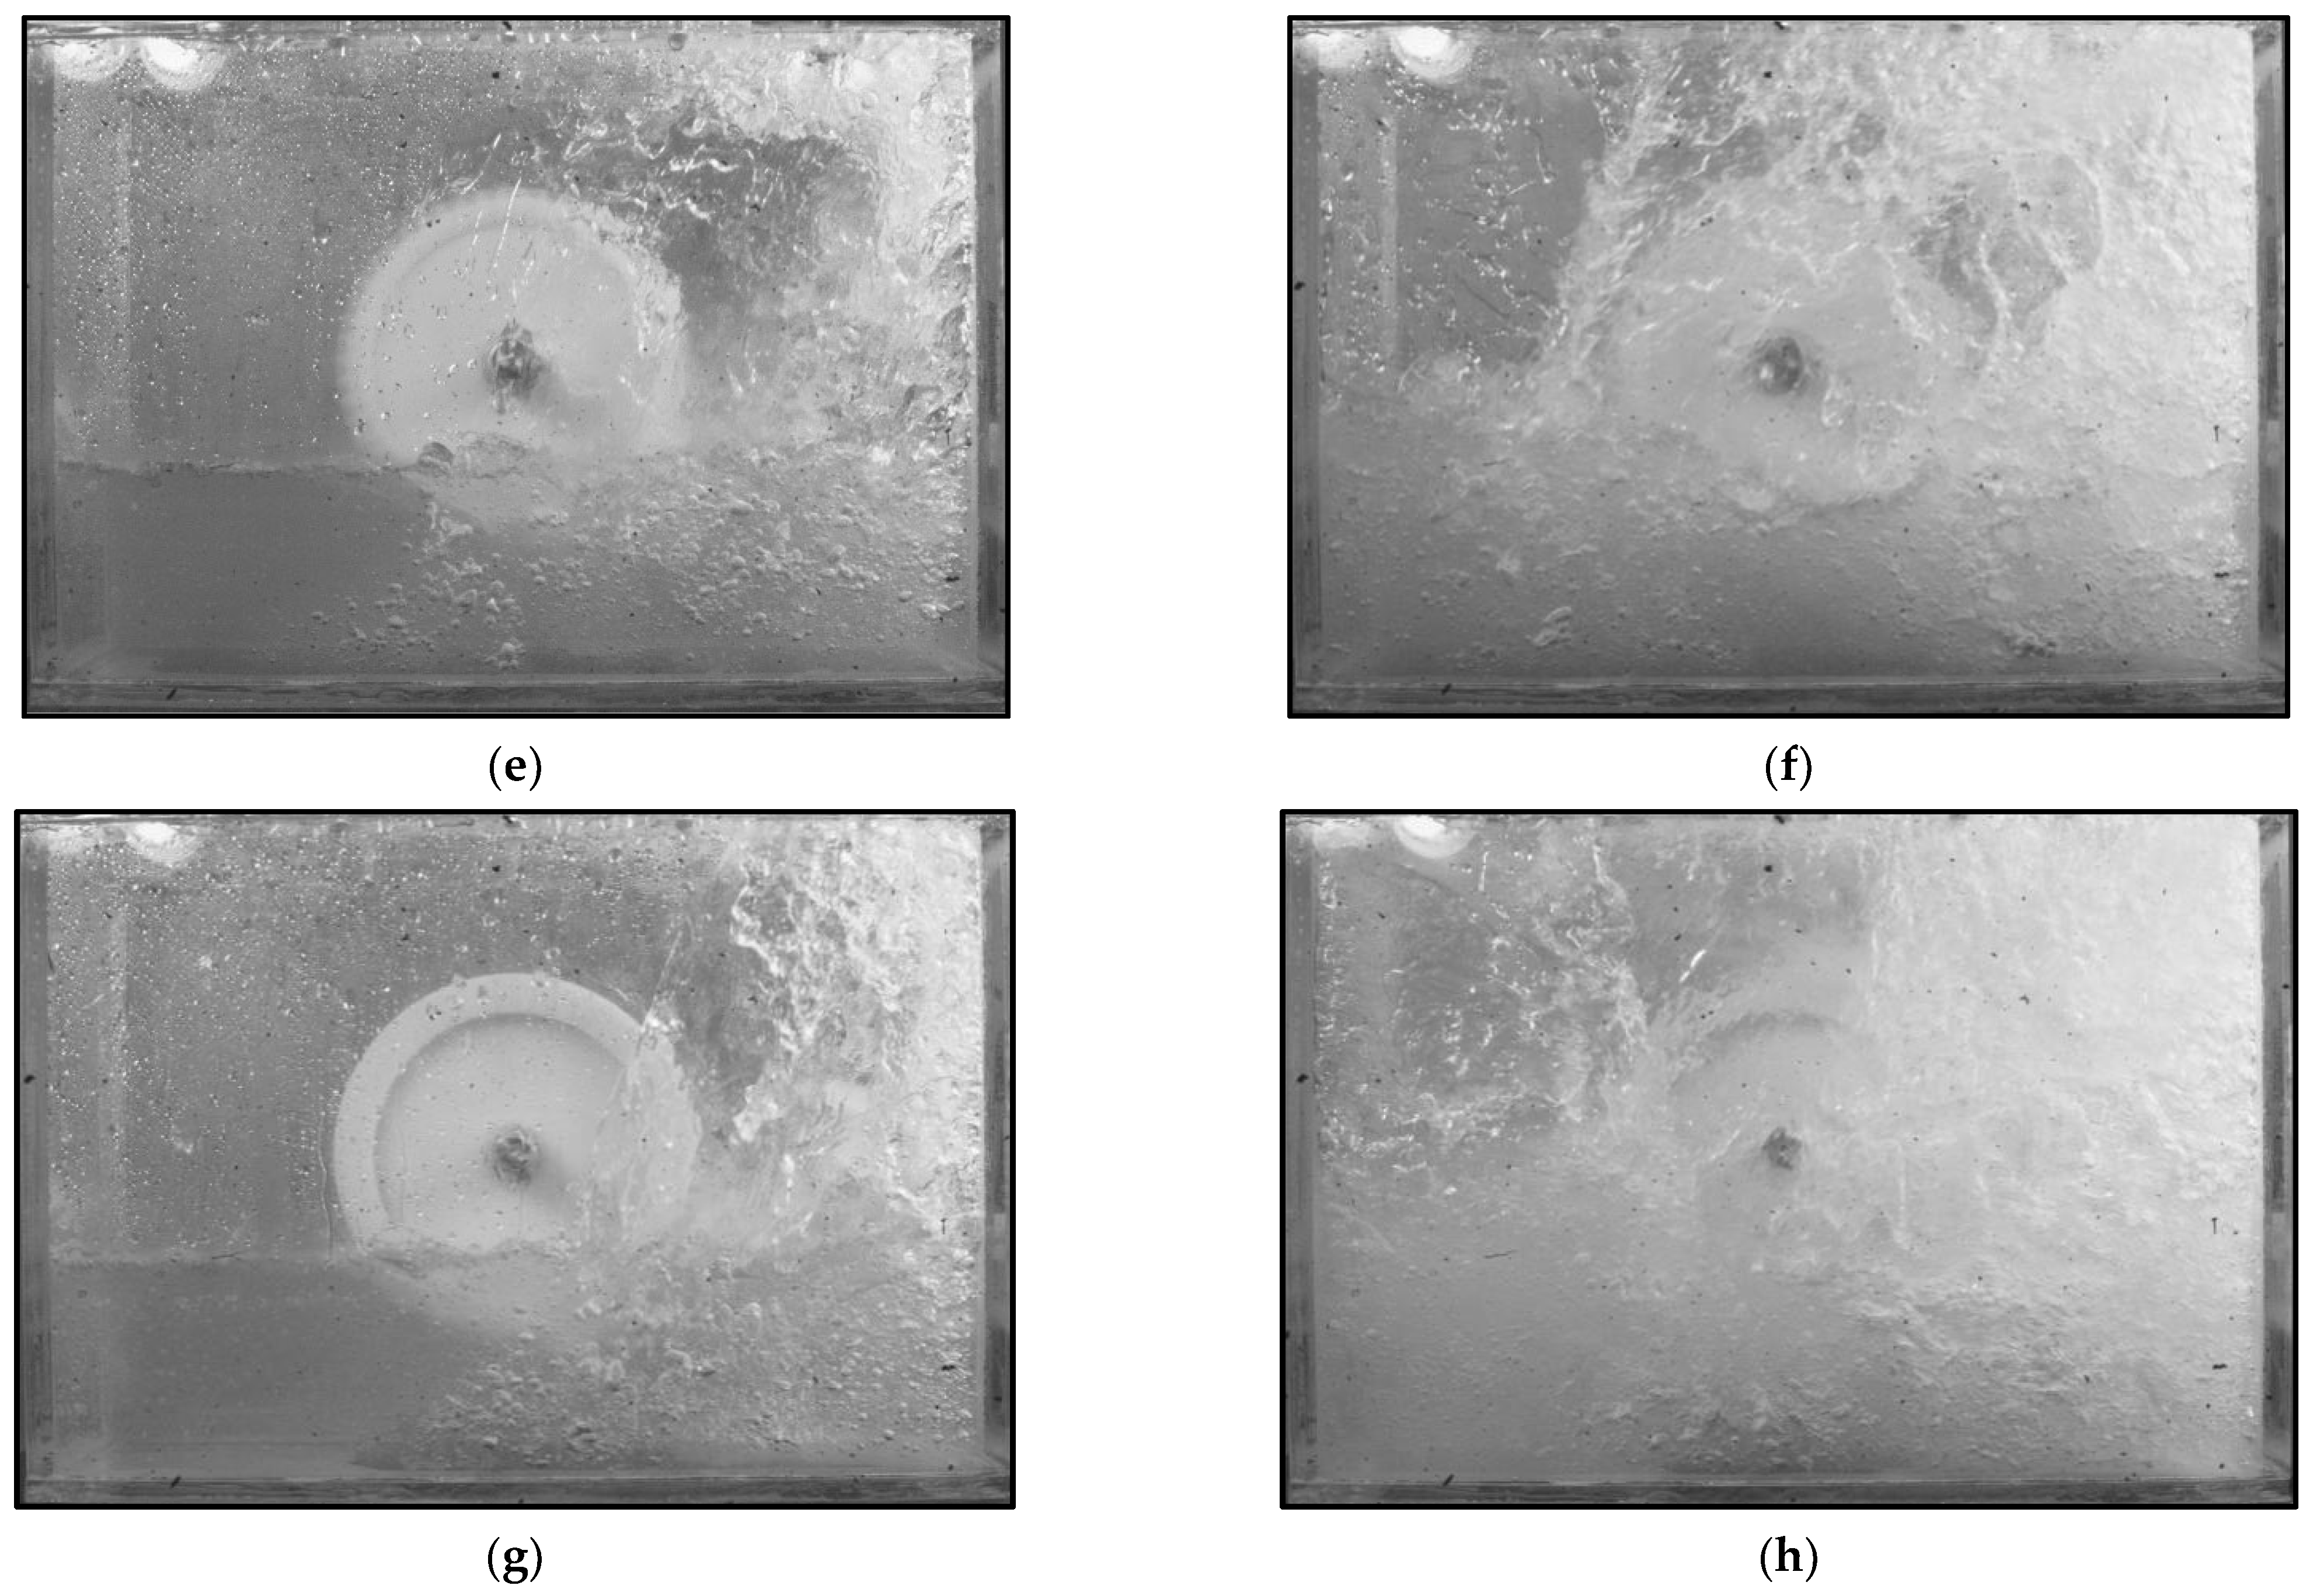
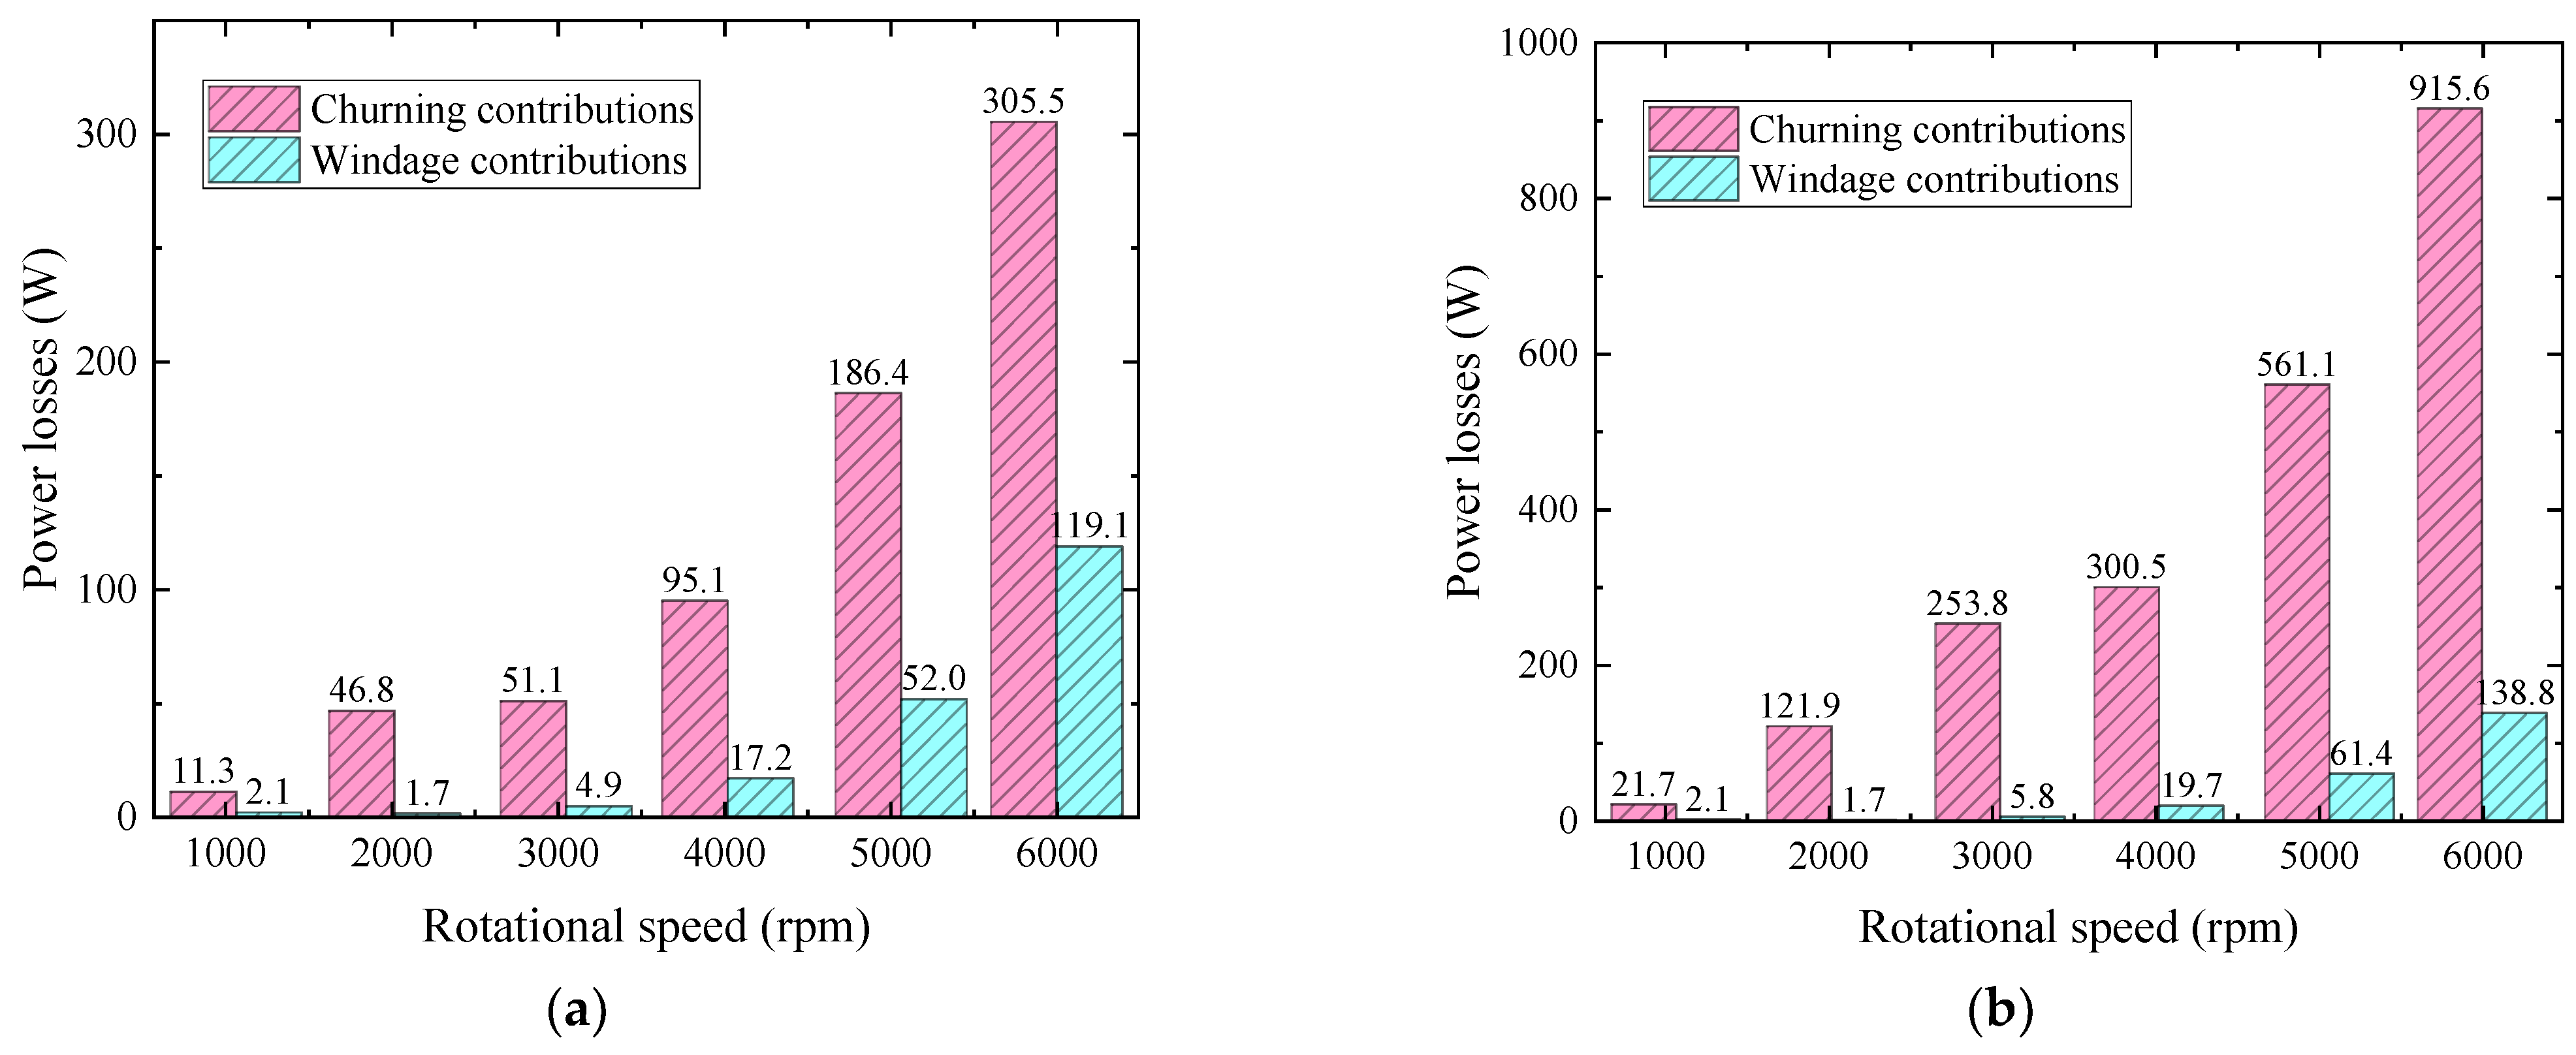
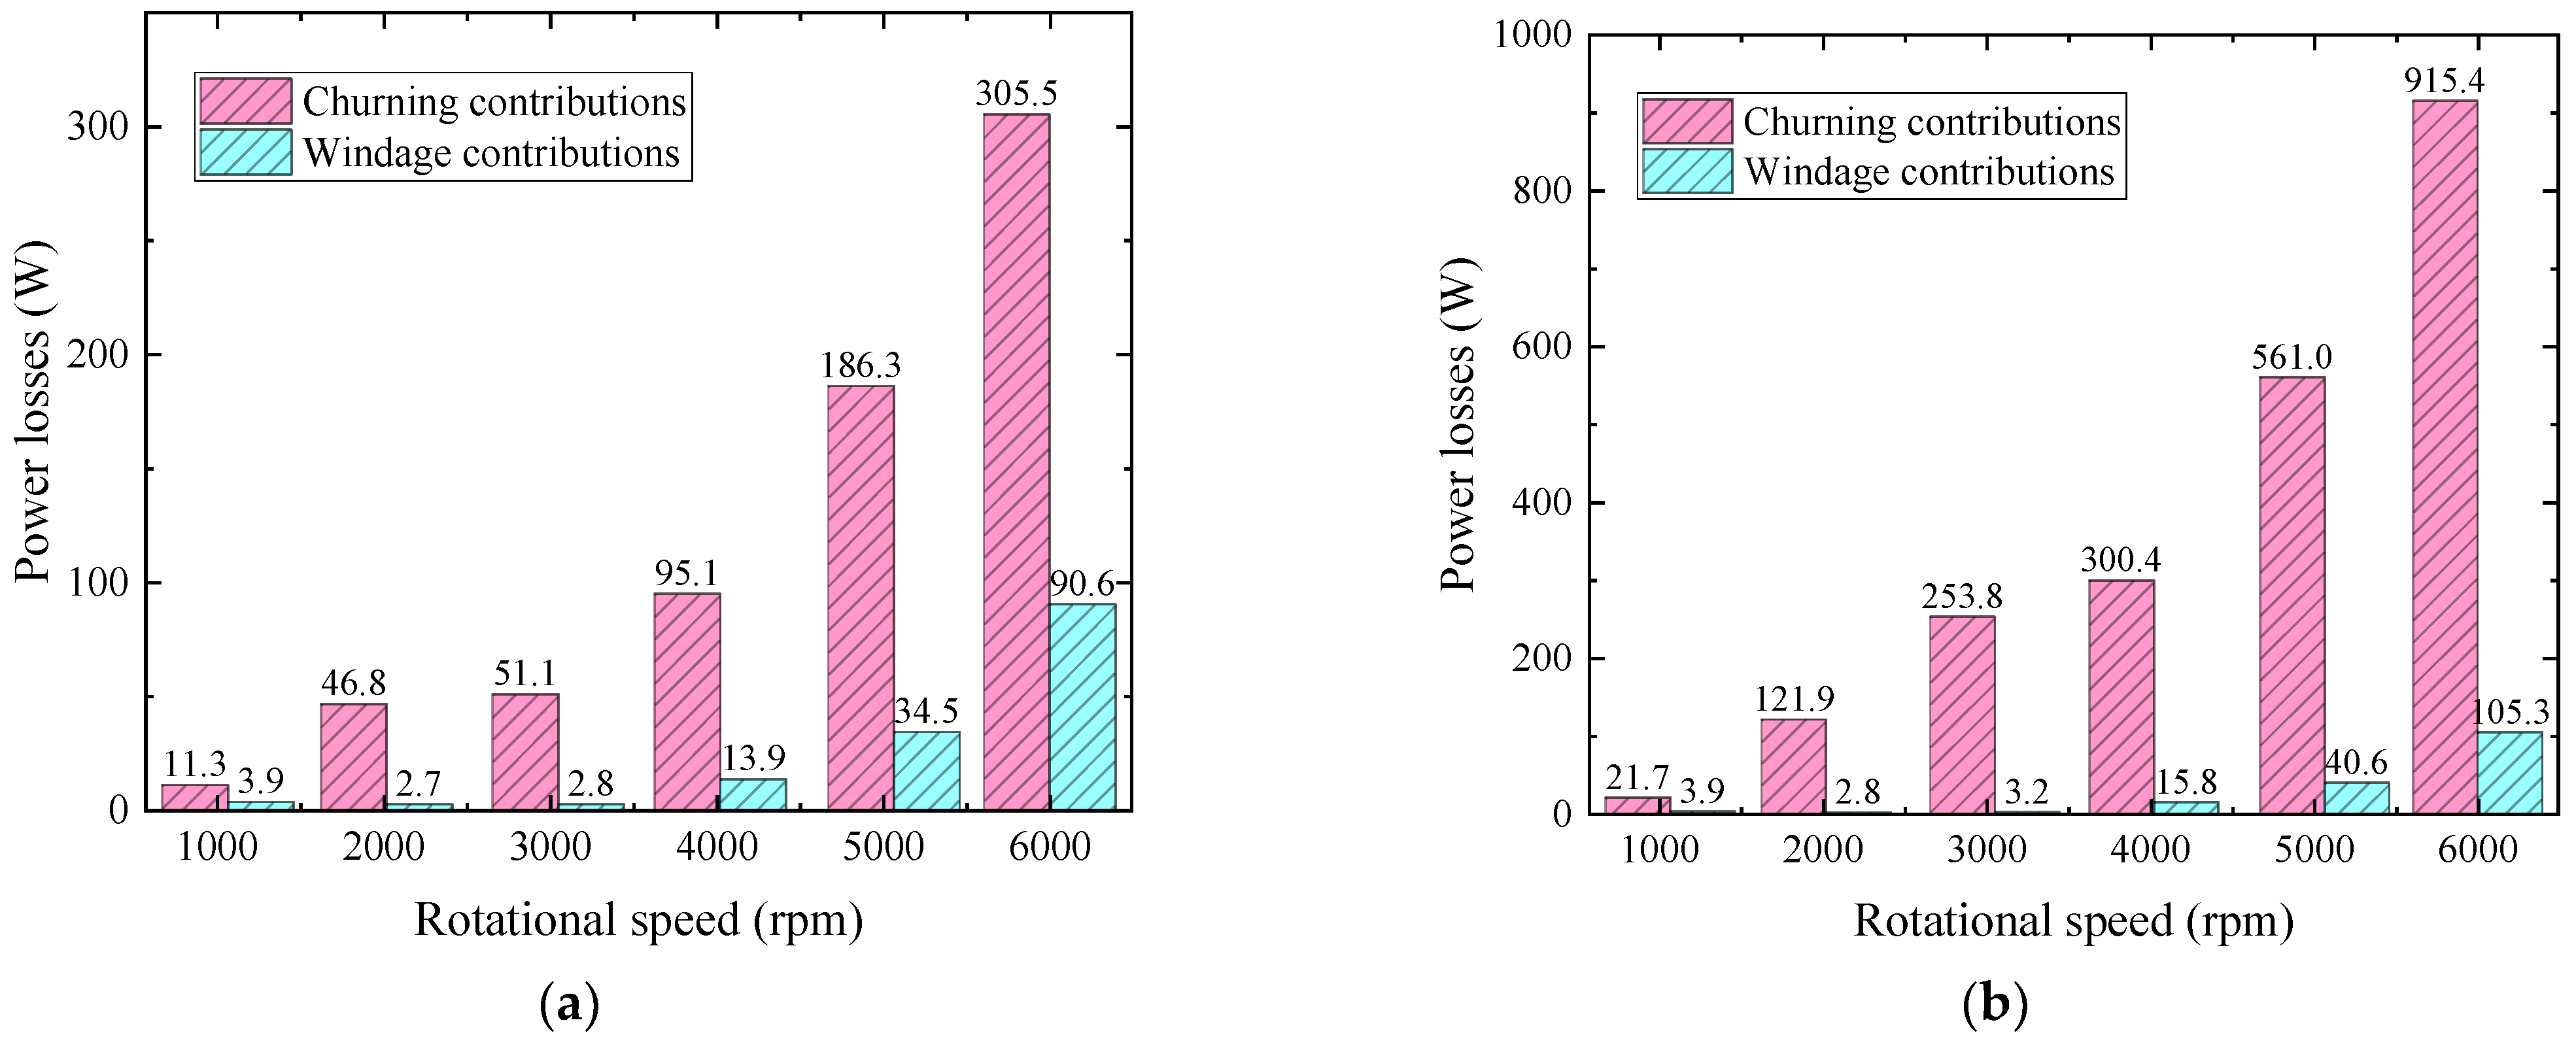
  • There is no doubt that the rotational speed and oil-immersed depth are the most important parameters in energy dissipation. The higher the rotational speed of the gears is, the stronger the windage effect of the gear teeth becomes. The greater the oil depth of the wheels is, the more obvious is the churning effect of the cylinders. These two aspects balance and lead to these complex phenomena of various wheels under splash lubrication. It is also found that for spur, bevel, and face gears, the oil-churning characteristics are similar to that of the disc, and the influence of windage behavior can be neglected at low speeds.
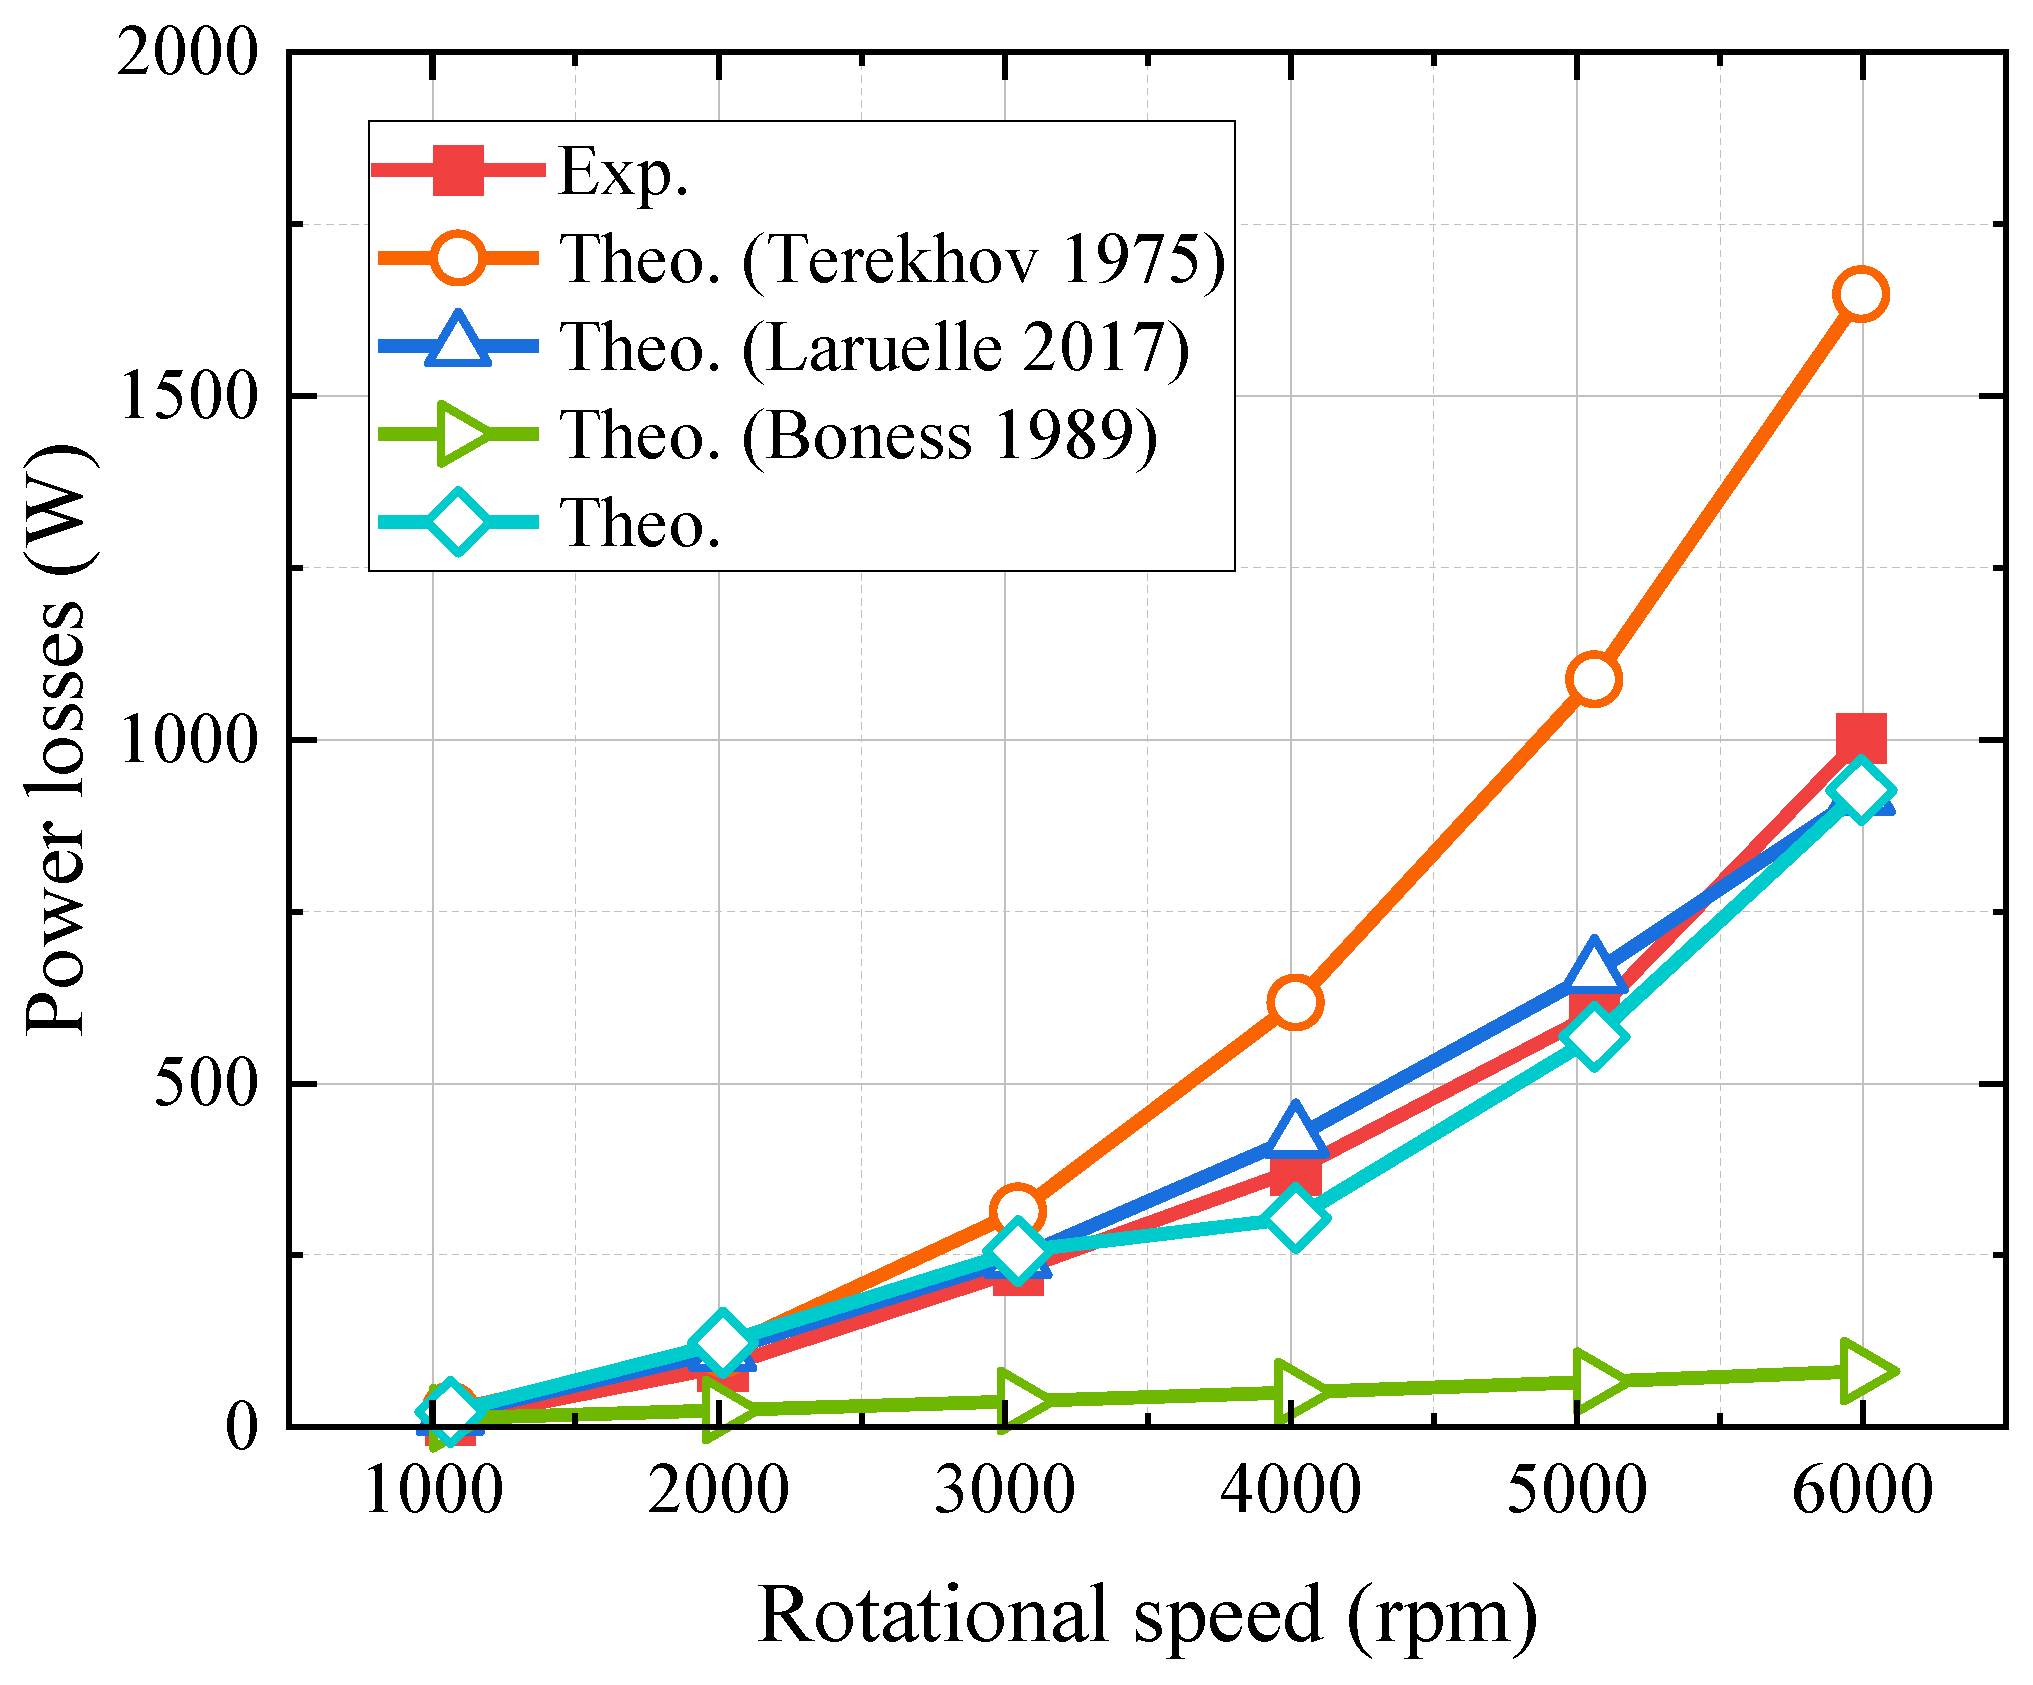
  • Broadly speaking, the calculations for these gears are in accordance with experiments. The accuracy of predictions for the oil depth of 0.5 is higher than that of 0.3. For the depth of 0.5, the average relative errors between the calculations based on Laruelle et al. [35] and the experiments are about 21.39%, 14.04%, and 12.02% for the spur, bevel, and face gears, respectively, while the average relative errors between the calculations based on the fluid flow method and experiments are about 16.89%, 10.09%, and 17.23%, respectively, as listed in Table 3. For the depth of 0.3, the average relative errors between the calculations based on Laruelle et al. [35] and experiments are about 27.58%, 48.71%, and 10.23% for the spur, bevel and face gears, respectively, while the average relative errors between the calculations based on the fluid flow method and experiments are about 28.75%, 16.29%, and 35.70%, respectively, as listed in Table 4. Both of these approaches have their merits, but the latter method loses to the experimental data, as the applicability and accuracy of the physical analytical method are better.
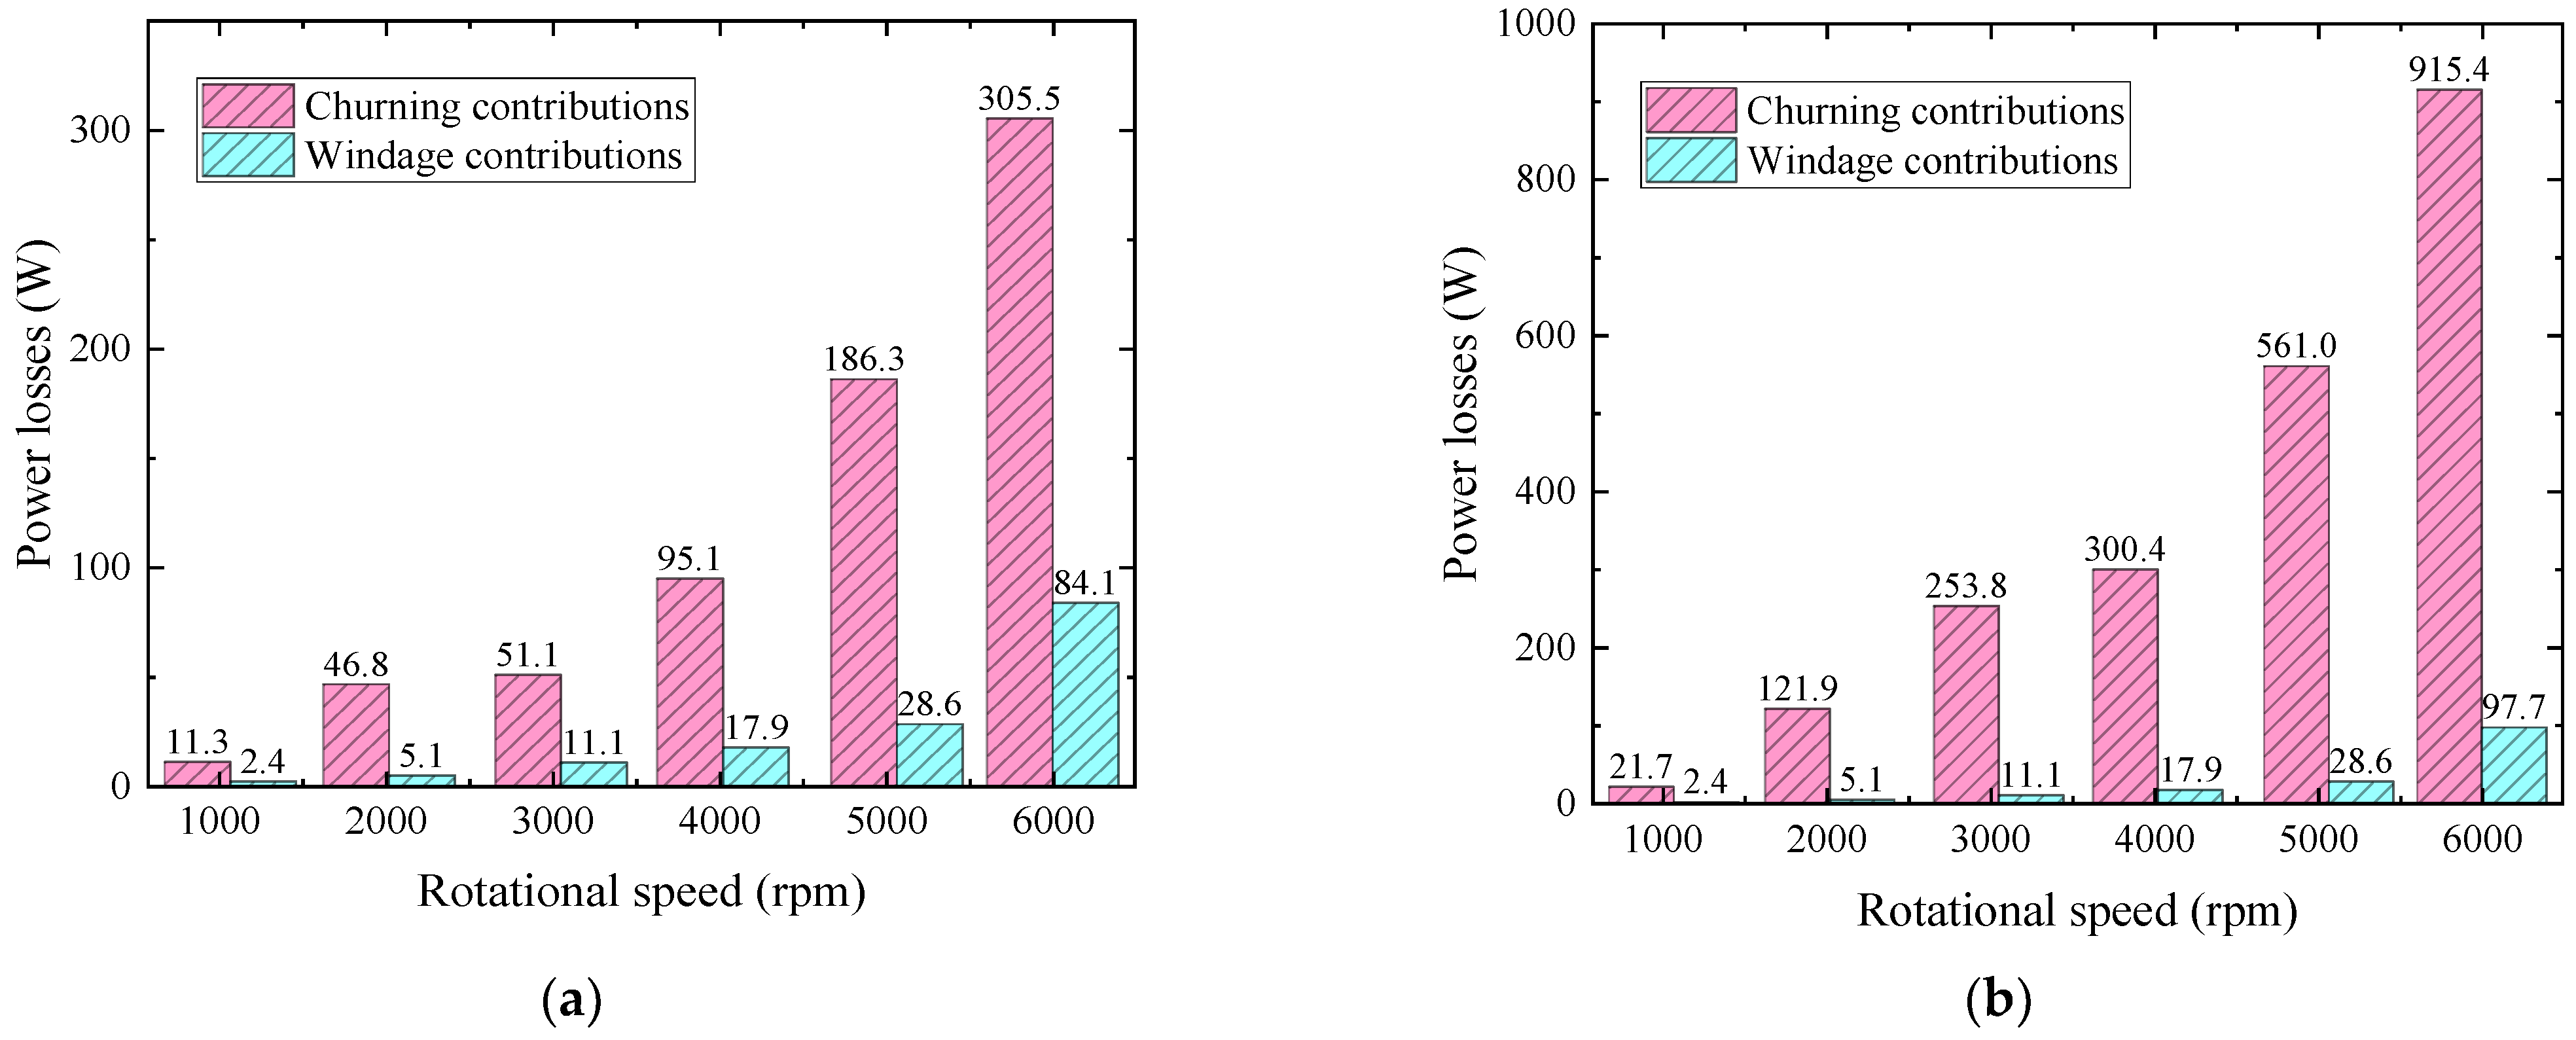
  • Furthermore, different kinds of gears have different windage effects. The windage power losses of discs can be ignored as shown above. However, the windage losses of spatial crossed gears (bevel and face gears) are much higher than those of spur cylindrical gears, and this ultimately affects their total no-load power losses under the condition of splash lubrication.
Figure 10. Comparison between the calculated and experimental power losses for spur gear: (a) h/R0 = 0.3; (b) h/R0 = 0.5 [35].
Applsci 14 07603 g010
Figure 11. Comparison between the calculated and experimental power losses for bevel gear: (a) h/R0 = 0.3; (b) h/R0 = 0.5 [35].
Applsci 14 07603 g011
Figure 12. Comparison between the calculated and experimental power losses for face gear: (a) h/R0 = 0.3; (b) h/R0 = 0.5 [35].
Applsci 14 07603 g012

4.3. Distributions of Different Power Losses

Figure 13, Figure 14 and Figure 15 illustrate the different parts of no-load power losses for these gears under splash-lubrication conditions. Regardless of whether the spur, bevel, or face gears were used, the power losses generated from the churning behavior contribute to over 80% of the total no-load losses. Compared to the negligible windage losses at low speeds, the windage losses can account for over 10% at high speeds. On one hand, once the gear reaches a moderate speed, the windage effect cannot be ignored anymore; on the other hand, the windage effect facilitates the acute and fast interaction between the rotating gear and the lubrication oil, and then changes the density of the air–oil mixture surrounding the rotating parts. As shown in Figure 14, the windage power loss of the bevel gear is larger than that of the spur gear or face gear. This difference is mainly due to the pitch angle of the bevel gear that can strengthen the windage behavior characteristics.

5. Conclusions

This paper introduces two theoretical methods to estimate the power losses caused by windage and churning behavior of various rotating components (disc, spur gear, straight bevel gear, and orthogonal face gear). Experiments conducted using a specific lubrication test rig verify the theoretical methods.
The initial immersion depth and rotating speeds have significant effects on churning power losses. The no-load losses increase as the depth and rotation speed increase. The no-load power losses of various rotating components evaluated by the dimensional analysis method and the fluid flow method correlate well with the experimental results. Additionally, different types of gears exhibit varying windage effects. The windage losses of spatial crossed gears (bevel and face gears) are significantly higher than those of spur cylindrical gears.
Regardless of rotating speeds and oil depths, the power losses generated from churning behavior contribute to over 80% of the total no-load losses. At high speeds, windage losses can account for more than 10% of the total, in contrast to the insignificant losses at low speeds. Moreover, the bevel gear experiences greater windage power loss compared to the spur gear or face gear. The primary factor that might enhance the windage behavior is the pitch angle of the bevel gear.

Author Contributions

Conceptualization, Y.D. and C.Y.; methodology, H.L.; software, C.Y.; validation, H.L., Y.D. and X.Z.; formal analysis, H.L.; investigation, C.Y.; resources, Y.D.; data curation, C.Y.; writing—original draft preparation, X.Z.; writing—review and editing, C.Y.; visualization, X.Z.; supervision, X.Z. and Y.D.; project administration, Y.D.; funding acquisition, Y.D. All authors have read and agreed to the published version of the manuscript.

Funding

This research was funded by the National Natural Science Foundation of China (Grant No. 52305081 and 52475078), the Natural Science Foundation of Changsha City of China (Grant No. kq2208275), and the National Defense Pre-Research Foundation of China (Grant No. KY-1044-2023-0451).

Institutional Review Board Statement

Not applicable.

Informed Consent Statement

Not applicable.

Data Availability Statement

The original contributions presented in the study are included in the article, further inquiries can be directed to the corresponding author.

Acknowledgments

The authors are deeply grateful for the help of Ru Zhang from AECC South Industry Company Limited, Zhuzhou.

Conflicts of Interest

The authors declare no conflicts of interest.

Nomenclature

bgteeth width, mm
Cchdimensionless churning torque coefficient
Fr Froude   number = ω 2 R 0 / g
Fr*Froude number for oil-free surface flows
gacceleration of gravity, m/s2
hoil-immersed depth, mm
h ¯ dimensionless oil-immersed depth
h* aaddendum coefficient
k1, k2, k3, k4parameters calculated based on the boundary conditions
Pchchurning losses, W
Pwiwindage losses, W
Pno-loadno-load power losses, W
riexternal radius of the creeping flow, mm
Rccone distance, mm
Re Reynolds   number =   ω R 0 2 / V 0
R0outer radius, mm
Rppitch radius of the bevel gear, mm
Smoil-wetted area, mm2
Vlinear velocity, m/s
x1modification factor
Zteeth number
αpressure angle, rad
airair volume fraction
δpitch angle, rad
θcangle across the tooth space, rad
μairair viscosity, Pa·s
μoiloil viscosity, Pa·s
ξreduction coefficient
ρmixdensity of the air–oil mixture, kg/m3
ρairair density, kg/m3
ρoiloil density, kg/m3
χ air–oil ratio
ωangular velocity, rad/s

References

  1. Soo, S.L. Laminar flow over an enclosed rotating disk. Trans. ASME 1958, 80, 287–294. [Google Scholar] [CrossRef]
  2. Daily, J.W.; Nece, R.E. Chamber dimension effects on induced flow and frictional resistance of enclosed rotating disks. J. Basic Eng. 1960, 82, 217–230. [Google Scholar] [CrossRef]
  3. Mann, R.W.; Marston, C.H. Friction drag on bladed disks in housings as a function of Reynolds number, axial and radial clearance, and blade aspect ratio and solidity. J. Basic Eng. 1961, 83, 719–723. [Google Scholar] [CrossRef]
  4. Handschuh, M.; Guner, A.; Kahraman, A. An experimental investigation of windage and oil churning power losses of gears and discs. Proc. Inst. Mech. Eng. Part J. J. Eng. Tribol. 2023, 237, 163–177. [Google Scholar] [CrossRef]
  5. Andersson, M. Churning Losses and Efficiency in Gearboxes. Doctoral Dissertation, KTH Royal Institute of Technology, Stockholm, Sweden, 2014. [Google Scholar]
  6. Changenet, C.; Velex, P. A model for the prediction of churning losses in geared transmissions—Preliminary results. J. Mech. Des. 2007, 129, 128–133. [Google Scholar] [CrossRef]
  7. Changenet, C.; Velex, P. Housing influence on churning losses in geared transmissions. J. Mech. Des. 2008, 130, 062603. [Google Scholar] [CrossRef]
  8. Changenet, C.; Leprince, G.; Ville, F.; Velex, P. A note on flow regimes and churning loss modeling. J. Mech. Des. 2011, 133, 121009. [Google Scholar] [CrossRef]
  9. Seetharaman, S.; Kahraman, A.; Moorhead, M.; Petry-Johnson, T. Oil churning power losses of a gear pair: Experiments and model validation. J. Tribol. Trans. ASME 2009, 131, 022202. [Google Scholar] [CrossRef]
  10. Seetharaman, S.; Kahraman, A. Load-independent spin power losses of a spur gear pair: Model formulation. J. Tribol. Trans. ASME 2009, 131, 022201. [Google Scholar] [CrossRef]
  11. Neurouth, A.; Changenet, C.; Ville, F.; Octrue, M.; Tinguy, E. Experimental investigations to use splash lubrication for high-speed gears. J. Tribol. Trans. ASME 2017, 139, 061104. [Google Scholar] [CrossRef]
  12. Quiban, R.; Changenet, C.; Marchesse, Y.; Ville, F. Experimental investigations about the power loss transition between churning and windage for spur gears. J. Tribol. Trans. ASME 2021, 143, 024501. [Google Scholar] [CrossRef]
  13. Dai, Y.; Zhang, Y.; Zhu, X. Generalized analytical model for evaluating the gear power losses transition changing from windage to churning behavior. Tribol. Int. 2023, 185, 108572. [Google Scholar] [CrossRef]
  14. Concli, F.; Gorla, C. Analysis of the Oil Squeezing Power Losses of a Spur Gear Pair by Mean of CFD Simulations; ASME Engineering Systems Design and Analysis: Nantes, France, 2012. [Google Scholar]
  15. Concli, F.; Gorla, C. Influence of lubricant temperature, lubricant level and rotational speed on the churning power losses in an industrial planetary speed reducer: Computational and experimental study. Int. J. Comput. Methods Exp. Meas. 2013, 1, 353–366. [Google Scholar]
  16. Concli, F.; Maccioni, L.; Gorla, C. Lubrication of gearboxes: CFD analysis of a cycloidal gear set. WIT Trans. Eng. Sci. 2019, 123, 101–112. [Google Scholar]
  17. Mastrone, M.N.; Concli, F. CFD simulation of grease lubrication: Analysis of the power losses and lubricant flows inside a back-to-back test rig gearbox. J. Non-Newton. Fluid Mech. 2021, 297, 104652. [Google Scholar] [CrossRef]
  18. Mastrone, M.N.; Concli, F. CFD simulations of gearboxes: Implementation of a mesh clustering algorithm for efficient simulations of complex system’s architectures. Int. J. Mech. Mater. Eng. 2021, 16, 12. [Google Scholar] [CrossRef]
  19. Kodela, C.; Kraetschmer, M.; Basa, S. Churning loss estimation for manual transmission gear box using CFD. SAE Int. J. Passeng. Cars-Mech. Syst. 2015, 8, 391–397. [Google Scholar] [CrossRef]
  20. Chen, S.; Matsumoto, S. Influence of relative position of gears and casing wall shape of gear box on churning loss under splash lubrication condition some new ideas. Tribol. Trans. 2016, 59, 993–1004. [Google Scholar] [CrossRef]
  21. Cavotta, M.; Hotait, M.; Singh, A. A Computational Fluid Dynamics (CFD) Model for Gear Churning; SAE Technical Papers; SAE: Singapore, 2018. [Google Scholar]
  22. Hu, X.; Li, P.; Wu, M. Influence of the dynamic motion of a splash-lubricated gearbox on churning power losses. Energies 2019, 12, 3225. [Google Scholar] [CrossRef]
  23. Atencio, B.; Yao, H.; Chernoray, V. Experiments and lattice-boltzmann simulation of flow in a vertically aligned gearbox. J. Tribol. Trans. ASME 2023, 145, 114103. [Google Scholar] [CrossRef]
  24. Liebrecht, J.; Si, X.; Sauer, B.; Schwarze, H. Investigation of drag and churning losses on tapered roller bearings. Stroj. Vestn.-J. Mech. Eng. 2015, 61, 399–408. [Google Scholar] [CrossRef]
  25. Maccioni, L.; Chernoray, V.G.; Mastrone, M.N.; Bohnert, C.; Concli, F. Study of the impact of aeration on the lubricant behavior in a tapered roller bearing: Innovative numerical modelling and validation via particle image velocimetry. Tribol. Int. 2022, 165, 107301. [Google Scholar] [CrossRef]
  26. Mauz, W. Hydraulische Verluste von Strinradgetrieben bei Umfansgsgeschwindigkeiten bis 60m/s; IMK: Stuttgart, Germany, 1987. [Google Scholar]
  27. Diab, Y.; Ville, F.; Velex, P.; Changenet, C. Windage losses in high speed gears—Preliminary experimental and theoretical results. J. Mech. Des. 2004, 126, 903–908. [Google Scholar] [CrossRef]
  28. Seetharaman, S.; Kahraman, A. A windage power loss model for spur gear pairs. Tribol. Trans. 2010, 53, 473–484. [Google Scholar] [CrossRef]
  29. Diab, Y.; Ville, F.; Houjoh, H.; Sainsot, P.; Velex, P. Experimental and numerical investigations on the air-pumping phenomenon in high-speed spur and helical gears, P.I. Mech. Eng. C J. Mec. 2005, 219, 785–800. [Google Scholar]
  30. Talbot, D.; Kahraman, A.; Seetharaman, S. A helical gear pair pocketing power loss model. J. Tribol. Trans. ASME 2014, 136, 021105. [Google Scholar] [CrossRef]
  31. Marchesse, Y.; Changenet, C.; Ville, F.; Velex, P. Investigations on CFD Simulations for Predicting Windage Power Losses in Spur Gears. J. Mech. Des. 2011, 133, 024501. [Google Scholar] [CrossRef]
  32. Pallas, S.; Marchesse, Y.; Changenet, C.; Ville, F.; Velex, P. A windage power loss model based on CFD study about the volumetric flow rate expelled by spur gears. Mech. Ind. 2012, 13, 317–323. [Google Scholar] [CrossRef]
  33. Ruzek, M.; Ville, F.; Velex, P.; Boni, J.; Marchesse, Y. On windage losses in high-speed pinion-gear pairs. Mech. Mach. Theory 2019, 132, 123–132. [Google Scholar] [CrossRef]
  34. Dai, Y.; Xu, L.; Zhu, X.; Ouyang, B. Application of an unstructured overset method for predicting the gear windage power losses. Eng. Appl. Comp. Fluid Mech. 2021, 15, 130–141. [Google Scholar] [CrossRef]
  35. Laruelle, S.; Fossier, C.; Changenet, C.; Ville, F.; Koechlin, S. Experimental investigations and analysis on churning losses of splash lubricated spiral bevel gears. Mech. Ind. 2017, 18, 412. [Google Scholar] [CrossRef]
  36. Quiban, R.; Changenet, C.; Marchesse, Y.; Ville, F.; Belmonte, J. Churning losses of spiral bevel gears at high rotational speed. Proc. Inst. Mech. Eng. Part J J. Eng. Tribol. 2020, 234, 172–182. [Google Scholar] [CrossRef]
  37. Dai, Y.; Ma, F.; Zhu, X.; Ouyang, B. Development of an analytical model to estimate the churning power losses of a spiral bevel gear. Tribol. Int. 2020, 151, 106536. [Google Scholar] [CrossRef]
  38. Hu, X.; Jiang, Y.; Luo, C.; Feng, L.; Dai, Y. Churning power losses of a gearbox with spiral bevel geared transmission. Tribol. Int. 2019, 129, 398–406. [Google Scholar] [CrossRef]
  39. Hu, X.; Wang, A.; Li, P.; Wang, J. Influence of dynamic attitudes on oil supply for bearings and churning power losses in a splash lubricated spiral bevel gearbox. Tribol. Int. 2021, 159, 106951. [Google Scholar] [CrossRef]
  40. Lu, F.; Wang, M.; Bao, H.; Huang, W.; Zhu, R. Churning power loss of the intermediate gearbox in a helicopter under splash lubrication. Proc. Inst. Mech. Eng. Part J J. Eng. Tribol. 2022, 236, 49–58. [Google Scholar] [CrossRef]
  41. Legrady, B.; Taesch, M.; Tschirschnitz, G.; Mieth, C. Prediction of churning losses in an industrial gear box with spiral bevel gears using the smoothed particle hydrodynamic method. Forsch. Ingenieurwesen-Eng. Res. 2021, 86, 379–388. [Google Scholar] [CrossRef]
  42. Shen, L.; Zhu, Y.; Shao, S.; Zhou, H.; Wang, Z. Research on splash lubrication characteristics of a spiral bevel gearbox based on the MPS method. Lubricants 2023, 11, 520. [Google Scholar] [CrossRef]
  43. Rapley, S.; Eastwick, C.; Simmons, K. The Application of CFD to Model Windage Power Loss from a Spiral Bevel Gear; ASME Turbo Expo: Montreal, QC, Canada, 2007. [Google Scholar]
  44. Rapley, S.; Eastwick, C.; Simmons, K. Effect of Variations in Shroud Geometry on Single Phase Flow over a shrouded Single Spiral Gear; ASME Turbo Expo: Berlin, Germany, 2008. [Google Scholar]
  45. Zhu, X.; Dai, Y.; Ma, F. Development of a quasi-analytical model to predict the windage power losses of a spiral bevel gear. Tribol. Int. 2020, 146, 106258. [Google Scholar] [CrossRef]
  46. Zhu, X.; Dai, Y.; Ma, F. CFD modelling and numerical simulation on windage power loss of aeronautic high-speed spiral bevel gears. Simul. Model. Pract. Theory 2020, 103, 102080. [Google Scholar] [CrossRef]
  47. Zhu, X.; Dai, Y.; Ma, F. On the estimation of the windage power losses of spiral bevel gears: An analytical model and CFD investigation. Simul. Model. Pract. Theory 2021, 110, 102334. [Google Scholar] [CrossRef]
  48. Johnson, G.; Chandra, B.; Foord, C.; Simmons, K. Windage power losses from spiral bevel gears with varying oil flows and shroud configurations. J. Turbomach. Trans. ASME 2009, 131, 041019. [Google Scholar] [CrossRef]
  49. Zhang, Y.; Li, L.; Zhao, Z. Optimal design of computational fluid dynamics: Numerical calculation and simulation analysis of windage power losses in the aviation. Processes 2021, 9, 1999. [Google Scholar] [CrossRef]
  50. Li, L.; Wang, S.; Liu, L. An analysis model for predicting windage power loss of aviation spiral bevel gears under optimal injection jet layout. Tribol. Trans. 2023, 66, 1057–1077. [Google Scholar] [CrossRef]
  51. Li, L.; Wang, S. Experimental study and numerical analysis on windage power loss characteristics of aviation spiral bevel gear with oil injection lubrication. Stroj. Vestn.-J. Mech. Eng. 2023, 69, 235–247. [Google Scholar] [CrossRef]
  52. Dai, Y.; Ma, F.; Zhu, X.; Jia, J. Numerical simulation investigation on the windage power loss of a high-speed face gear drive. Energies 2019, 12, 2093. [Google Scholar] [CrossRef]
  53. Zhu, X.; Dai, Y. Development of an analytical model to predict the churning power losses of an orthogonal face gear. Eng. Sci. Technol. Int. J. 2023, 41, 101383. [Google Scholar] [CrossRef]
  54. Terekhov, A.S. Hydraulic losses in gearboxes with oil immersion. Russ. Eng. J. 1975, 55, 7–11. [Google Scholar]
  55. Boness, R.J. Churning losses of discs and gears running partially submerged in oil. In Proceedings of the ASME International Power Transmission and Gearing Conference, Chicago, IL, USA, 25–28 April 1989. [Google Scholar]
Figure 1. Rotating parts including disc, spur gear, straight bevel gear, and orthogonal face gear.
Applsci 14 07603 g001
Figure 2. Schematic diagram of the ad hoc test bench for splash-lubrication tests: (a) three-dimensional model; (b) experimental set-up.
Applsci 14 07603 g002
Figure 3. Typical geometric structure: (a) disc; (b) face gear; (c) bevel gear; (d) spur gear.
Applsci 14 07603 g003
Figure 4. Evolution of the baseline drag torque of the disc against the rotational speed.
Applsci 14 07603 g004
Figure 5. Evolution of the total no-load resisting torque against rotational speed: (a) h ¯ = 0.3 ; (b) h ¯ = 0.5 .
Applsci 14 07603 g005
Figure 6. Photos of splash-lubricated wheels (h/Ro = 0.3): (a) disc (ng ≈ 1000 rpm); (b) disc (ng ≈ 6000 rpm); (c) spur gear (ng ≈ 1000 rpm); (d) spur gear (ng ≈ 6000 rpm); (e) straight bevel gear (ng ≈ 1000 rpm); (f) straight bevel gear (ng ≈ 6000 rpm); (g) orthogonal face gear (ng ≈ 1000 rpm); (h) orthogonal face gear (ng ≈ 6000 rpm).
Applsci 14 07603 g006aApplsci 14 07603 g006b
Figure 7. Photos of splash-lubricated wheels (h/Ro = 0.5): (a) disc (ng ≈ 1000 rpm); (b) disc (ng ≈ 6000 rpm); (c) spur gear (ng ≈ 1000 rpm); (d) spur gear (ng ≈ 6000 rpm); (e) straight bevel gear (ng ≈ 1000 rpm); (f) straight bevel gear (ng ≈ 6000 rpm); (g) orthogonal face gear (ng ≈ 1000 rpm); (h) orthogonal face gear (ng ≈ 6000 rpm).
Applsci 14 07603 g007aApplsci 14 07603 g007b
Figure 8. Comparison between the calculations determined by various methods and disc measurements (h/R0 = 0.5) [35,54,55].
Applsci 14 07603 g008
Figure 9. Comparison between the calculations determined by various methods and disc measurements (h/R0 = 0.3) [35].
Applsci 14 07603 g009
Figure 13. Distributions of total no-load power losses for spur gear: (a) h/R0 = 0.3; (b) h/R0 = 0.5.
Applsci 14 07603 g013
Figure 14. Distributions of total no-load power losses for bevel gear: (a) h/R0 = 0.3; (b) h/R0 = 0.5.
Applsci 14 07603 g014
Figure 15. Distributions of total no-load power losses for face gear: (a) h/R0 = 0.3; (b) h/R0 = 0.5.
Applsci 14 07603 g015
Table 1. Standard deviations of the total no-load resisting torque for an immersion depth of 0.3.
Type of GearDiscSpur GearBevel GearFace Gear
10000.0549 0.0519 0.0631 0.0259
20000.0091 0.0200 0.0268 0.0170
30000.0201 0.0310 0.0363 0.0216
40000.0259 0.0472 0.0470 0.0403
50000.0335 0.0870 0.0671 0.0691
60000.0541 0.0642 0.0879 0.1019
Table 2. Standard deviations of the total no-load resisting torque for an immersion depth of 0.5.
Type of GearDiscSpur GearBevel GearFace Gear
10000.0109 0.0225 0.0457 0.0233
20000.0147 0.0311 0.0367 0.0674
30000.0381 0.0590 0.0916 0.0908
40000.0753 0.1091 0.1340 0.1156
50000.1094 0.1709 0.1663 0.1816
60000.1691 0.2680 0.2222 0.2223
Table 3. Average relative errors between calculated and experimental power losses for the immersion depth of 0.5.
Type of GearSpur GearBevel GearFace Gear
Theoretical calculation (Laruelle et al. [35])21.39%14.04%12.02%
Theoretical calculation (This study)16.89%10.09%17.23%
Table 4. Average relative errors between calculated and experimental power losses for the immersion depth of 0.3.
Type of GearSpur GearBevel GearFace Gear
Theoretical calculation (Laruelle et al. [35])27.58%48.71%10.23%
Theoretical calculation (This study)28.75%16.29%35.70%
Disclaimer/Publisher’s Note: The statements, opinions and data contained in all publications are solely those of the individual author(s) and contributor(s) and not of MDPI and/or the editor(s). MDPI and/or the editor(s) disclaim responsibility for any injury to people or property resulting from any ideas, methods, instructions or products referred to in the content.

