Abstract
The objective of this study is to implement a more realistic integrated analysis model for micro gas turbines by incorporating secondary flow and combustion efficiency into the existing model, which includes main engine components such as the compressor and turbine, and to validate this model by comparing it with test results. The study was based on the JetCat P300-RX, which has a maximum thrust level of 300 N. Simulations were performed using ANSYS CFX, employing the κ-ω SST turbulence model and a mixing plane interface between individual components. The eddy dissipation model (EDM), with a combustion efficiency of 90%, was used as the combustion model. A user subroutine was also applied for the power matching of the compressor and turbine to calculate the fuel flow rate in each iteration. For secondary flow, it was assumed that 3% of the total air flow rate would flow through the secondary path and be applied to the compressor and turbine. Simulations were conducted over a range of 30,000 to 104,000 RPM, with ground conditions evaluated, including altitude-simulated conditions. To validate the analysis model, engine performance metrics such as pressure ratio, air flow rate, fuel flow rate, and exhaust gas temperature (EGT) were compared with test results. The results demonstrated that errors were less than 5% for most engine performance metrics, except for EGT and fuel flow. The discrepancy in EGT was attributed to differences in the sensing methods, while the variation in fuel flow was found to be due to the lubrication system and losses due to the secondary air flow. Consequently, this study confirmed that the integrated simulation model accurately predicts engine performance. The results indicate that the integrated simulation model provides a more realistic prediction of overall engine performance compared to previous studies. Therefore, it can evaluate detailed thermo-fluid properties without the need for component performance maps, enhancing performance evaluation and analysis.
1. Introduction
The term ‘micro gas turbine’ is typically used to describe small gas turbines with a thrust level of 1000 N or less. These engines are employed as a propulsion system for unmanned aerial vehicles (UAVs) and small airplanes in a variety of fields, including civilian and military applications, primarily due to their compact size, low cost, straightforward structure, and minimal maintenance requirements. In the early days of micro gas turbine development, these engines were primarily utilized for civilian applications, such as hobby RC airplanes or research aircraft. However, in recent years, micro gas turbine engines have become an increasingly significant area of military interest. As the use of micro gas turbine engines continues to expand, research in a range of fields has been undertaken. Most of the research in this field is dedicated to the analysis and prediction of gas turbine performance, with a particular emphasis on engine and component optimization to enhance efficiency. This research area is still under active investigation. In the domain of analytical research, a case study was conducted by Leylek et al. [1] to implement a one-dimensional thermodynamic analysis model of an entire engine. Verification of the analysis model with the test results revealed a high degree of similarity, even at off-design points. Rahman et al. [2] developed an analytical model that incorporates the secondary flow path of the engine using the MATLAB SIMULINK. In a related study, Kim et al. [3] implemented a performance analysis program for a gas turbine with a thermodynamic model using MATLAB.
In addition to thermodynamic modeling studies, various component-level 3D analysis studies have also been conducted. For example, Lodewyk [4] analyzed and optimized the performance of centrifugal compressors in micro gas turbine engines. Similarly, Bosman [5] studied the design process of small centrifugal compressors and the performance prediction of compressors. Kang et al. [6,7] employed computational analysis to characterize the aerodynamic performance of centrifugal compressors for micro gas turbines and to identify the causes of compressor losses at high RPM. They also proposed a method for improving flow matching by flow cuts to reduce losses. In the context of combustor research, Daniel et al. [8,9] conducted a study to design and fabricate an ultra-compact combustor (UCC) for micro gas turbines. This involved reducing the size of the combustor by one-third. Kim et al. [10] conducted a combustor design study to improve the combustion efficiency of micro gas turbines. The combustion efficiency was evaluated by fabricating the designed combustor via additive manufacturing (AM) and conducting combustion tests. Park [11] created a model of the combustor of an actual micro gas turbine to analyze the internal combustion reaction. Other studies related to the exhaust nozzle include an analysis of exhaust nozzle geometry and an observation of infrared signal characteristics by Lee et al. [12].
As in the preceding studies presented above, various analysis model implementation studies have been conducted for prediction and optimization studies, conducted in two ways: thermodynamic model and 3D CFD. In the case of the thermodynamic model, the performance of each component is predicted by finding the point at which the performance for each element is matched. This approach offers the advantage of reduced analysis time; however, it necessitates the utilization of a performance map for each component. Also, it is not possible to observe the detailed thermo-fluid characteristics inside the engine. In contrast, component-level 3D CFD has the advantage of being able to observe the detailed thermo-fluid characteristics through the internal flow field, and relatively accurate performance prediction of components is possible. However, it is impossible to make a similar prediction at the system level. As a result, there has been a growing tendency to undertake analytic studies integrating major gas turbine engine elements to overcome these disadvantages. For example, Aniwat et al. [13] employed 3D CFD to analyze the internal flow and heat transfer in a gas turbine. Johan [14] integrated the primary components of a micro gas turbine engine but substituted a heat source for the combustion model, thereby reducing the analysis time. Carlos et al. [15,16] performed a large-eddy simulation (LES) analysis of the geometry of a gas turbine from the fan to the combustor, excluding the turbine. Similarly, Badami et al. [17] employed ANSYS CFX to examine the entire engine and corroborated the analytical model through a comparison with test outcomes. In another case, Briones et al. [18,19] conducted a fully coupled turbojet engine CFD simulation and subsequently compared the results with those obtained from cycle analysis. Based on this study, they proceeded to perform a large-eddy simulation with a sliding mesh method.
In a comparable approach, Chung et al. [20] and Lee et al. [21] devised an analytical model integrating the primary components of a micro gas turbine engine and validated the model by contrasting the analytical outcomes with the ground test results.
As introduced in the previous section, the results of micro gas turbine studies have been identified. However, there is a limitation in predicting the accurate performance of the engine because the previous study did not consider the influence of various factors such as lubrication system, combustion efficiency, secondary air flow, etc.
Therefore, in this study, based on the integrated analysis model of Lee et al. [21], a realistic integrated analysis model is implemented by applying combustion efficiency and secondary flow among the various factors mentioned above, and its accuracy is verified by comparing it with the experimental results of a micro gas turbine engine.
2. Methodology
2.1. Engine Model
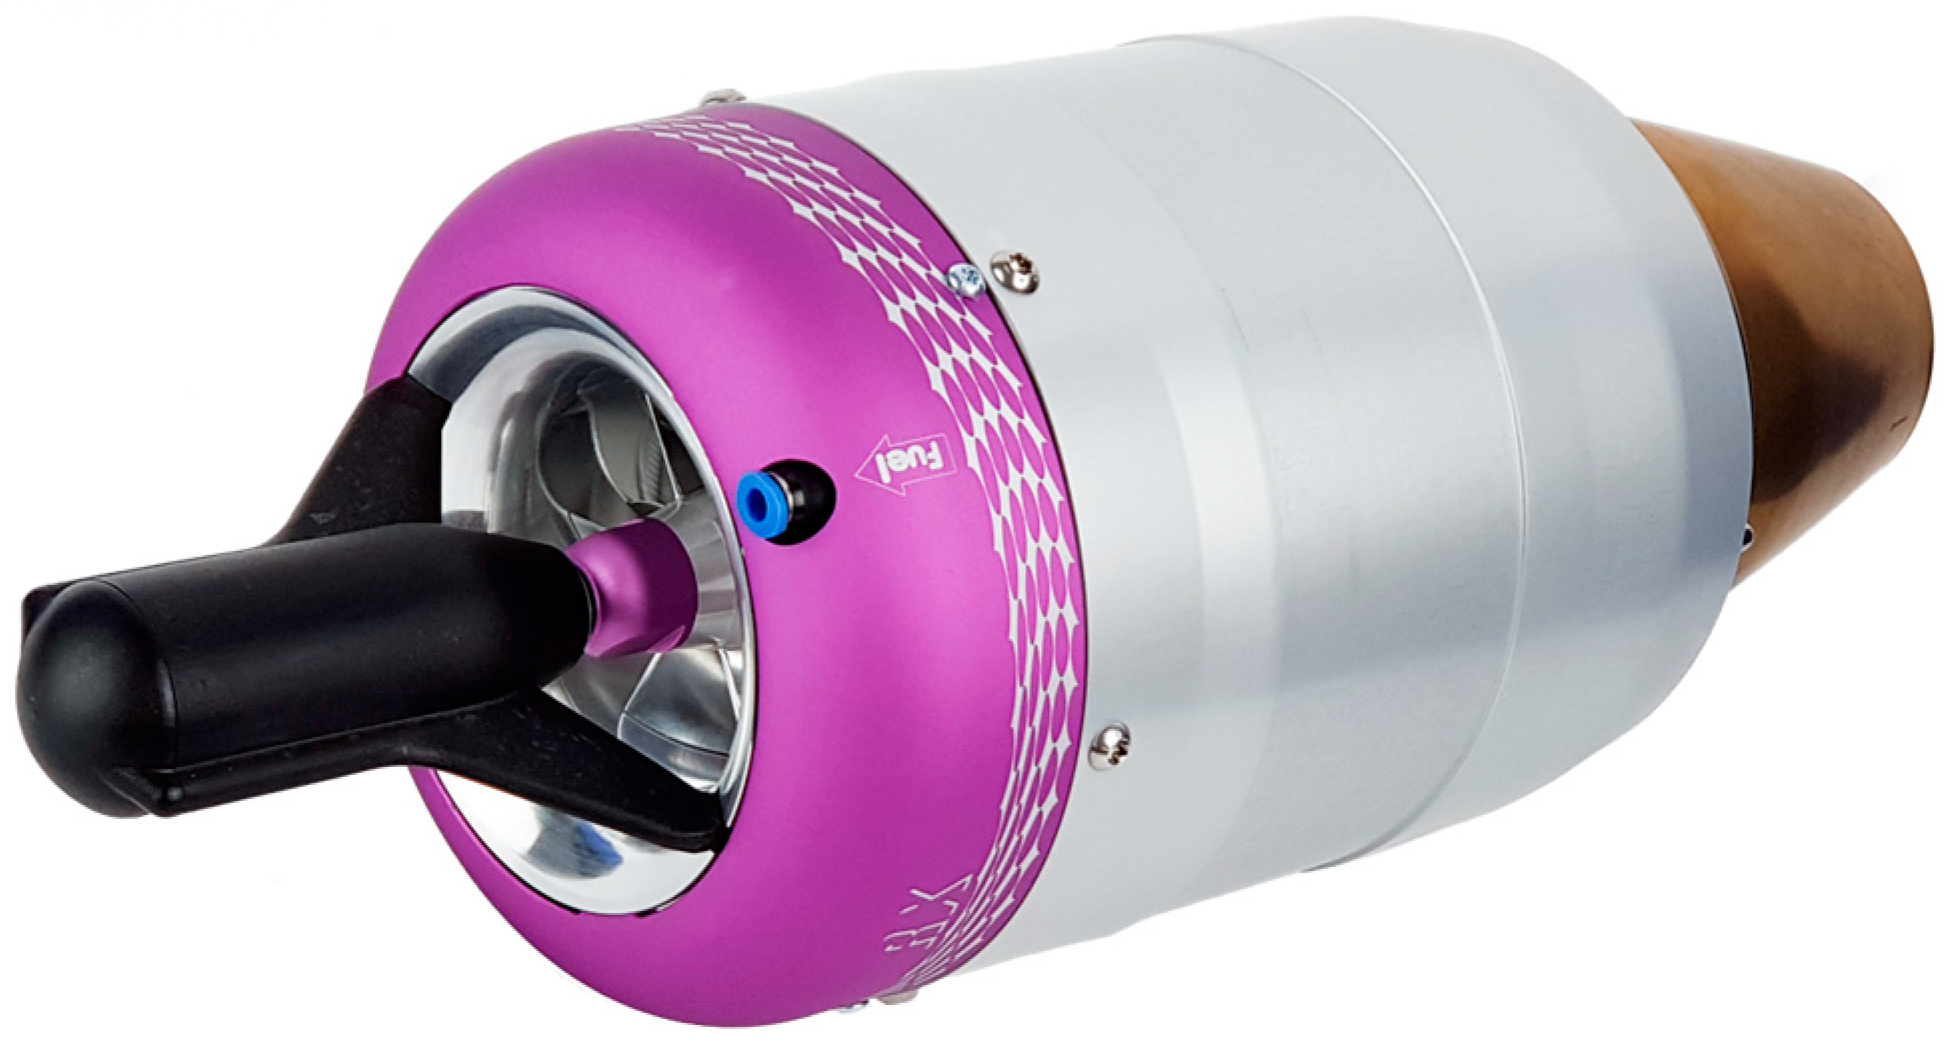
The micro gas turbine engine employed in this study to implement the integrated analytical model is the JetCat P300-RX (Ballrechten-Dottingen, Germany), which has a maximum thrust of 300 N. Its geometry and performance are illustrated in Table 1 and Figure 1 and Figure 2, respectively. The Korea Aerospace Research Institute (KARI) has conducted numerous prior studies on the same engine, and its extensive test dataset makes this engine an optimal subject for this research.

Table 1.
P300-RX Specification [21].

Figure 1.
P300-RX Micro Gas Turbine Engine [22].
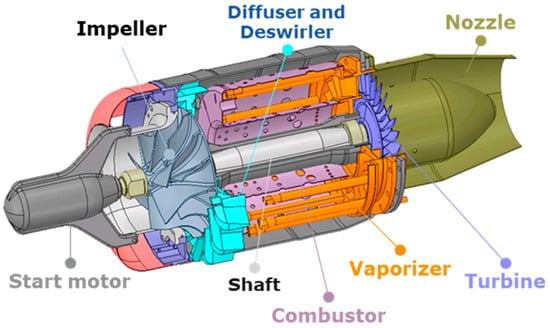
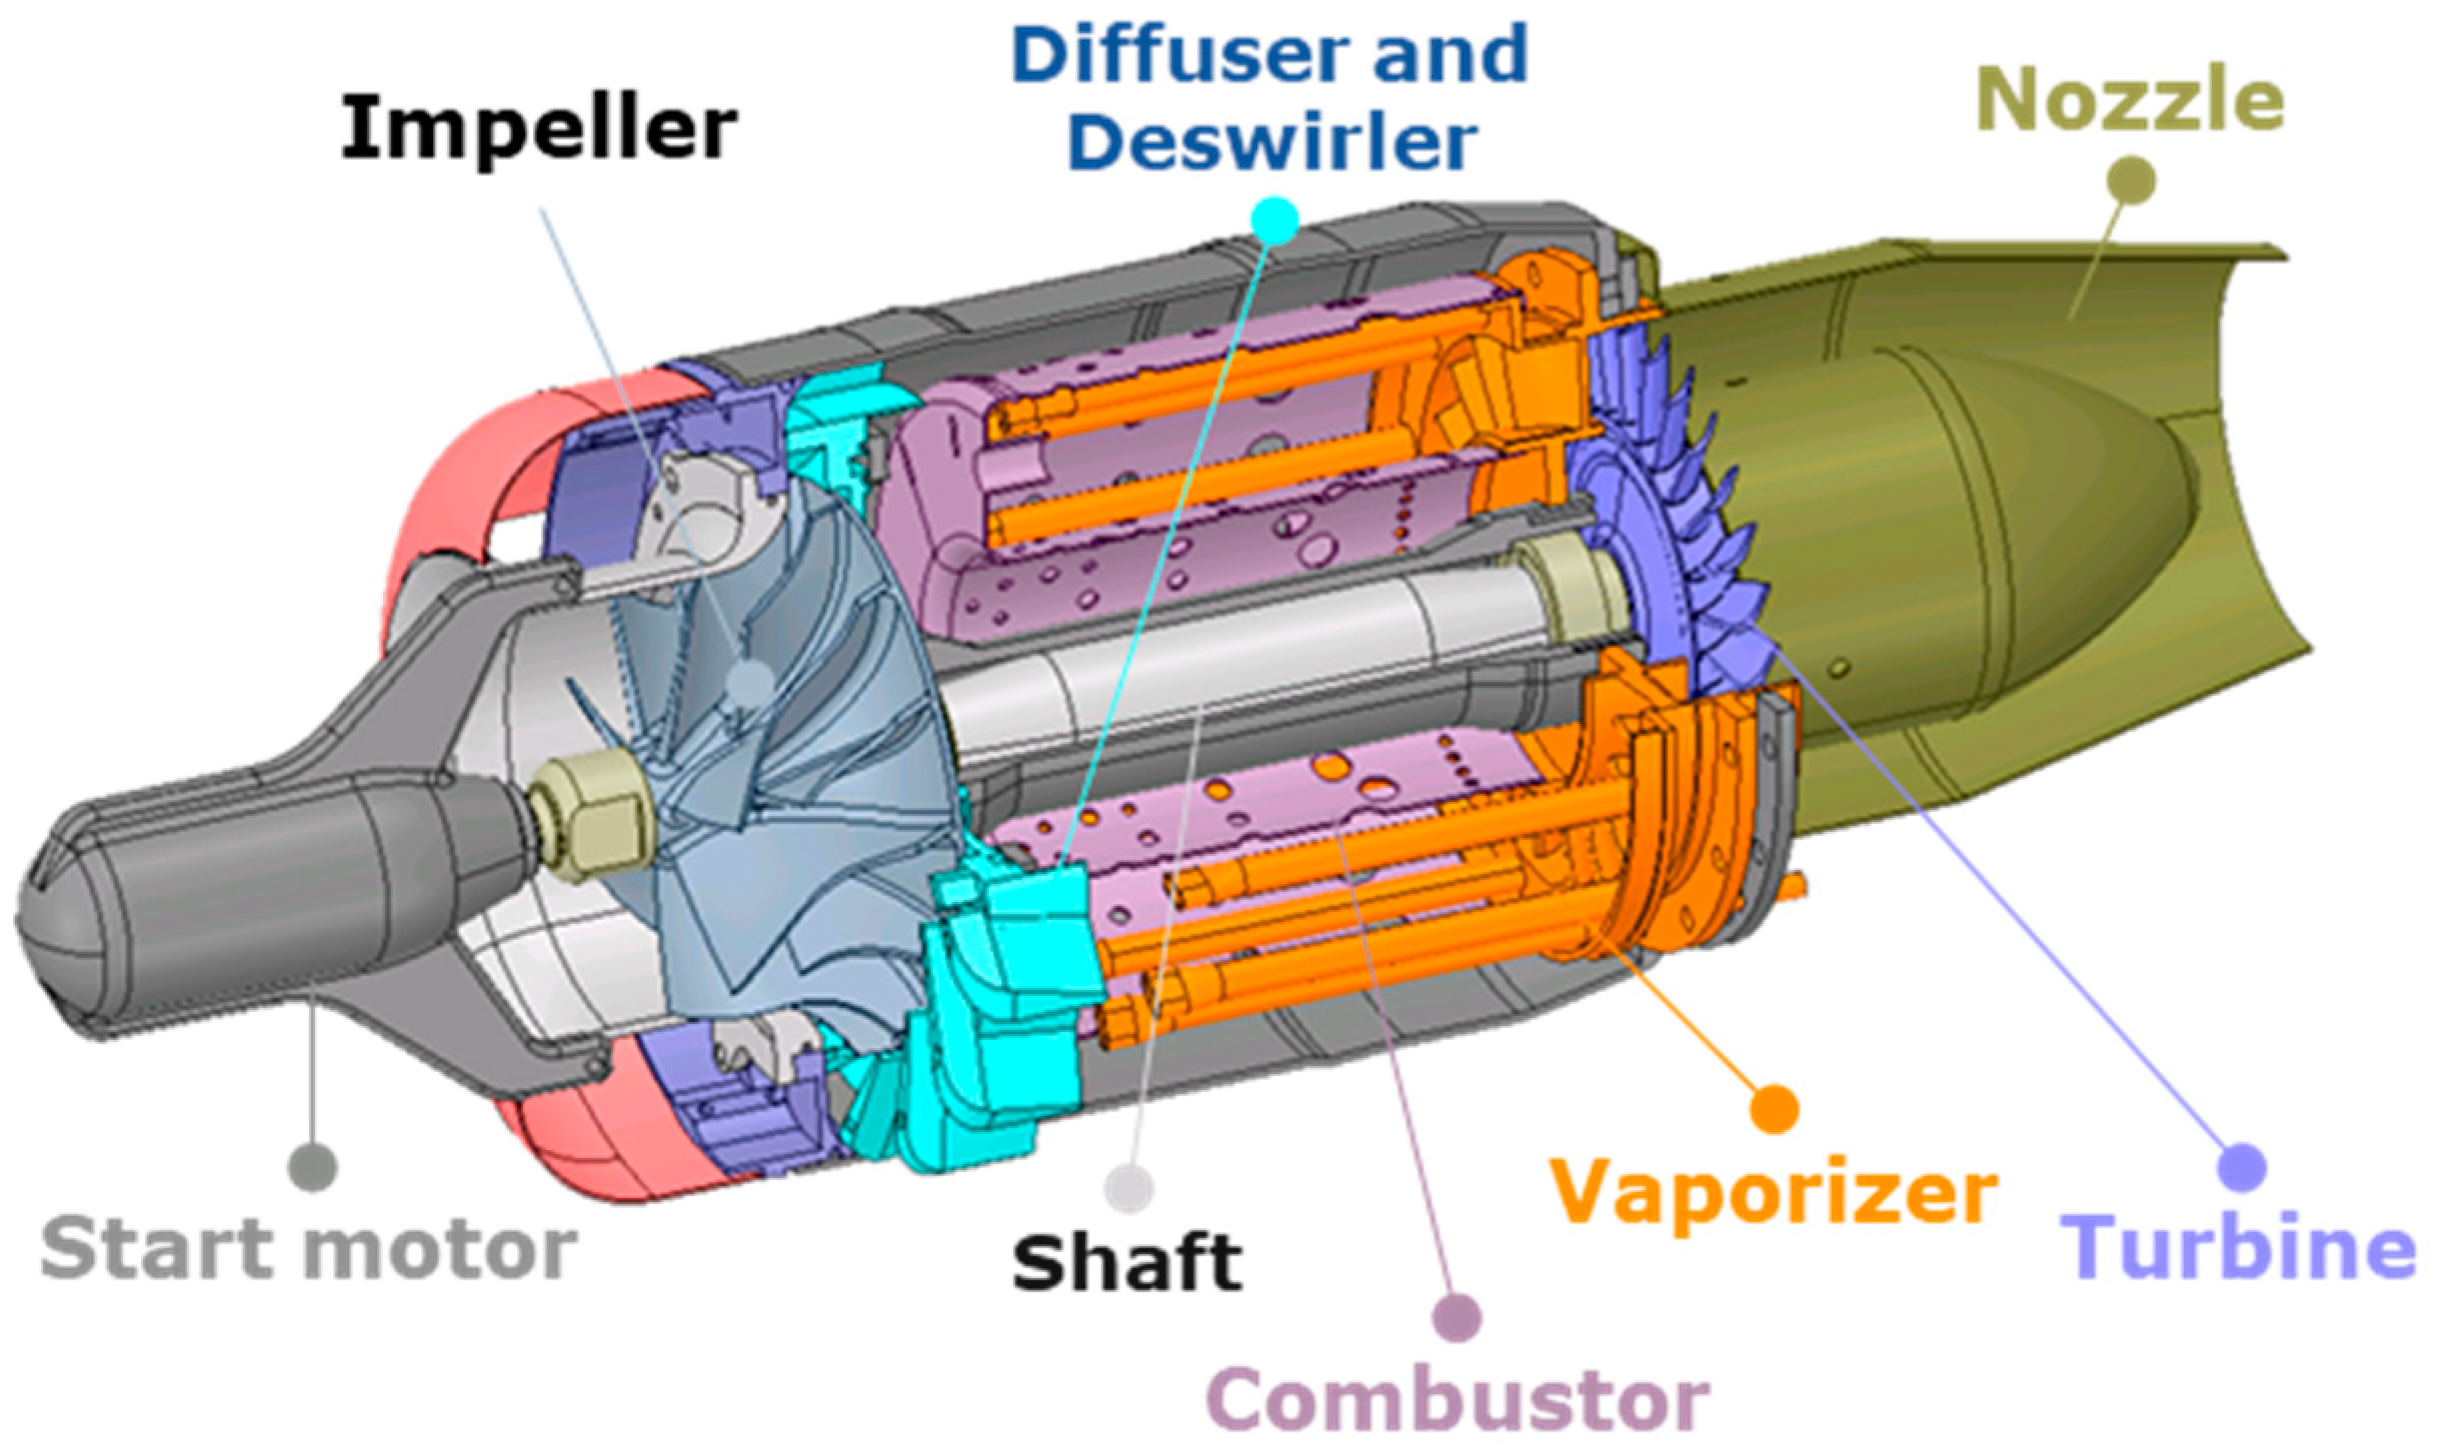
Figure 2.
Micro Gas Turbine Engine Main Components [20].
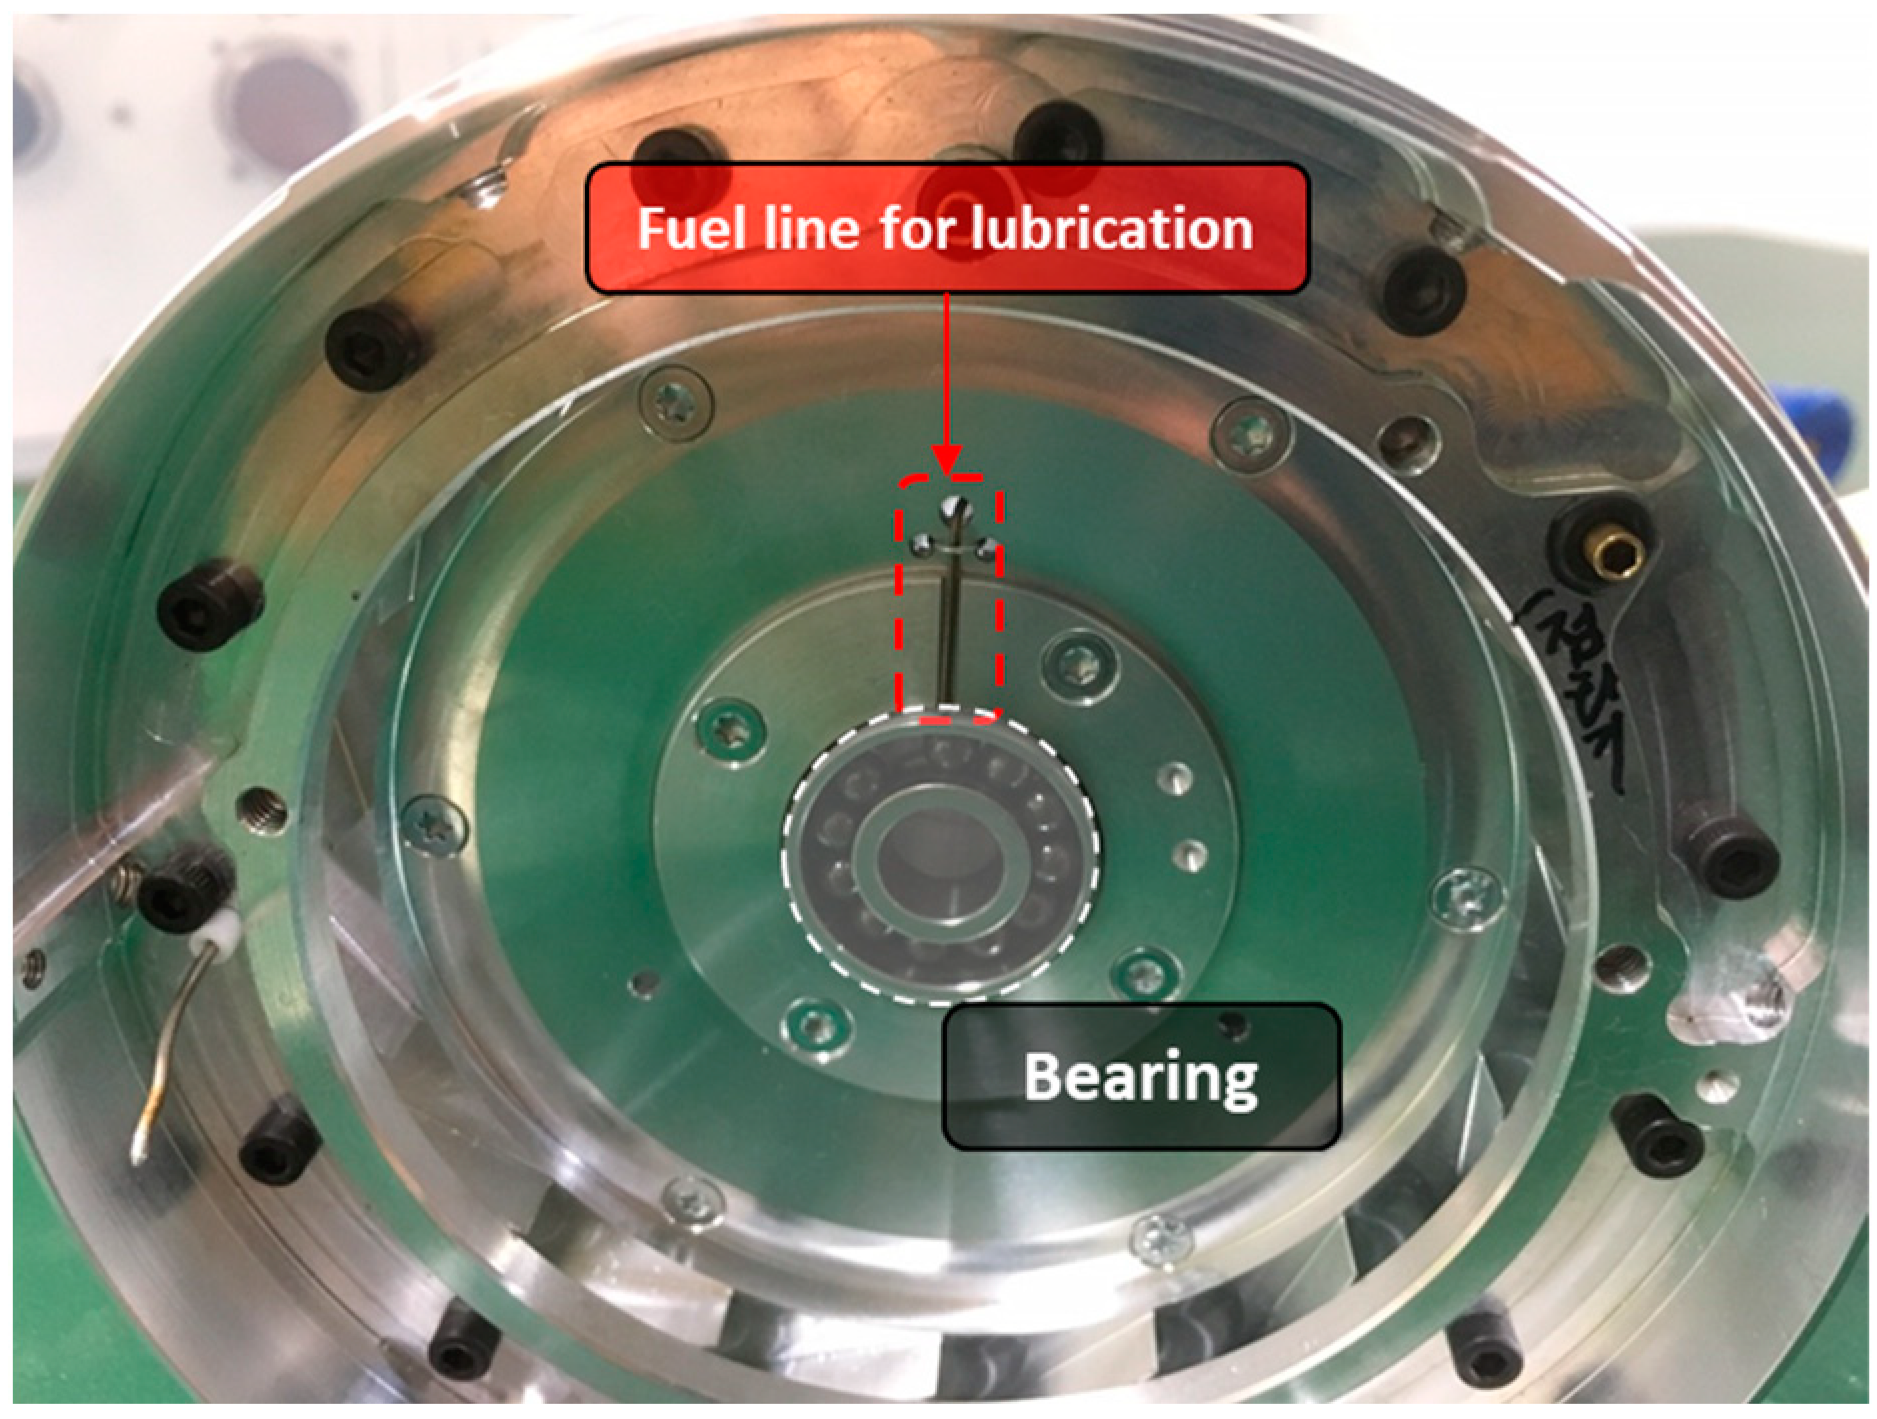
The target engine comprises a start motor, a compressor, a combustor, a turbine, and an exhaust nozzle, as illustrated in Figure 2. The solid shaft connects the single-stage centrifugal compressor to the single-stage axial turbine. The combustor is an annular combustor comprising 12 vaporizers, through which the liquid fuel is vaporized and burned to enhance combustion efficiency. The fuel utilized in the engine is Jet A-1 (ExxonMobil, Houston, TX, USA), mixed with a lubricant (Mobil Jet Oil 2) at a ratio of 5%. The fuel is supplied to the engine via a fuel pump and 13 fuel lines. Since there is no separate lubrication system, fuel is sprayed in a compressor side bearing from one of the 13 fuel lines to lubricate the engine.
A secondary flow path was also modeled and applied, as illustrated in Figure 3. The air then proceeds through the impeller, compressor-side bearing, shaft, and shaft housing, subsequently reaching the turbine-side bearing. It is then discharged through the gap between the turbine rotor and the turbine stator.
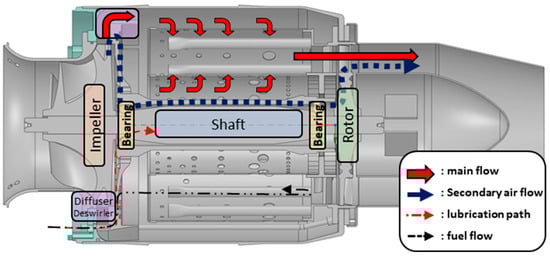
Figure 3.
Secondary Air Flow Schematic.
2.2. Integrated Analysis Model
2.2.1. Domain and Grid
The simulation domain was defined in the geometric specifications of the target engine, P300-RX. The fluid domain was divided into five regions, as illustrated in Figure 4: the inlet region, compressor, combustor, turbine, and exhaust nozzle, and the outlet region. The start motor was excluded from the simulation domain; tip clearances of 0.3 mm and 0.2 mm were applied to the compressor and turbine, respectively. Furthermore, the analysis was performed on the sector geometry rather than the full annular geometry to reduce the analysis time, as demonstrated in Table 2.
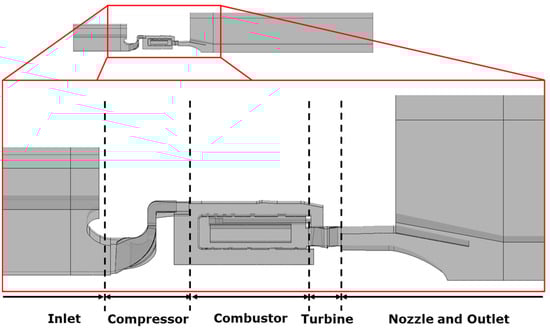
Figure 4.
Fluid Domain of Integrated Analysis Model.
Table 2.
Grid Information.
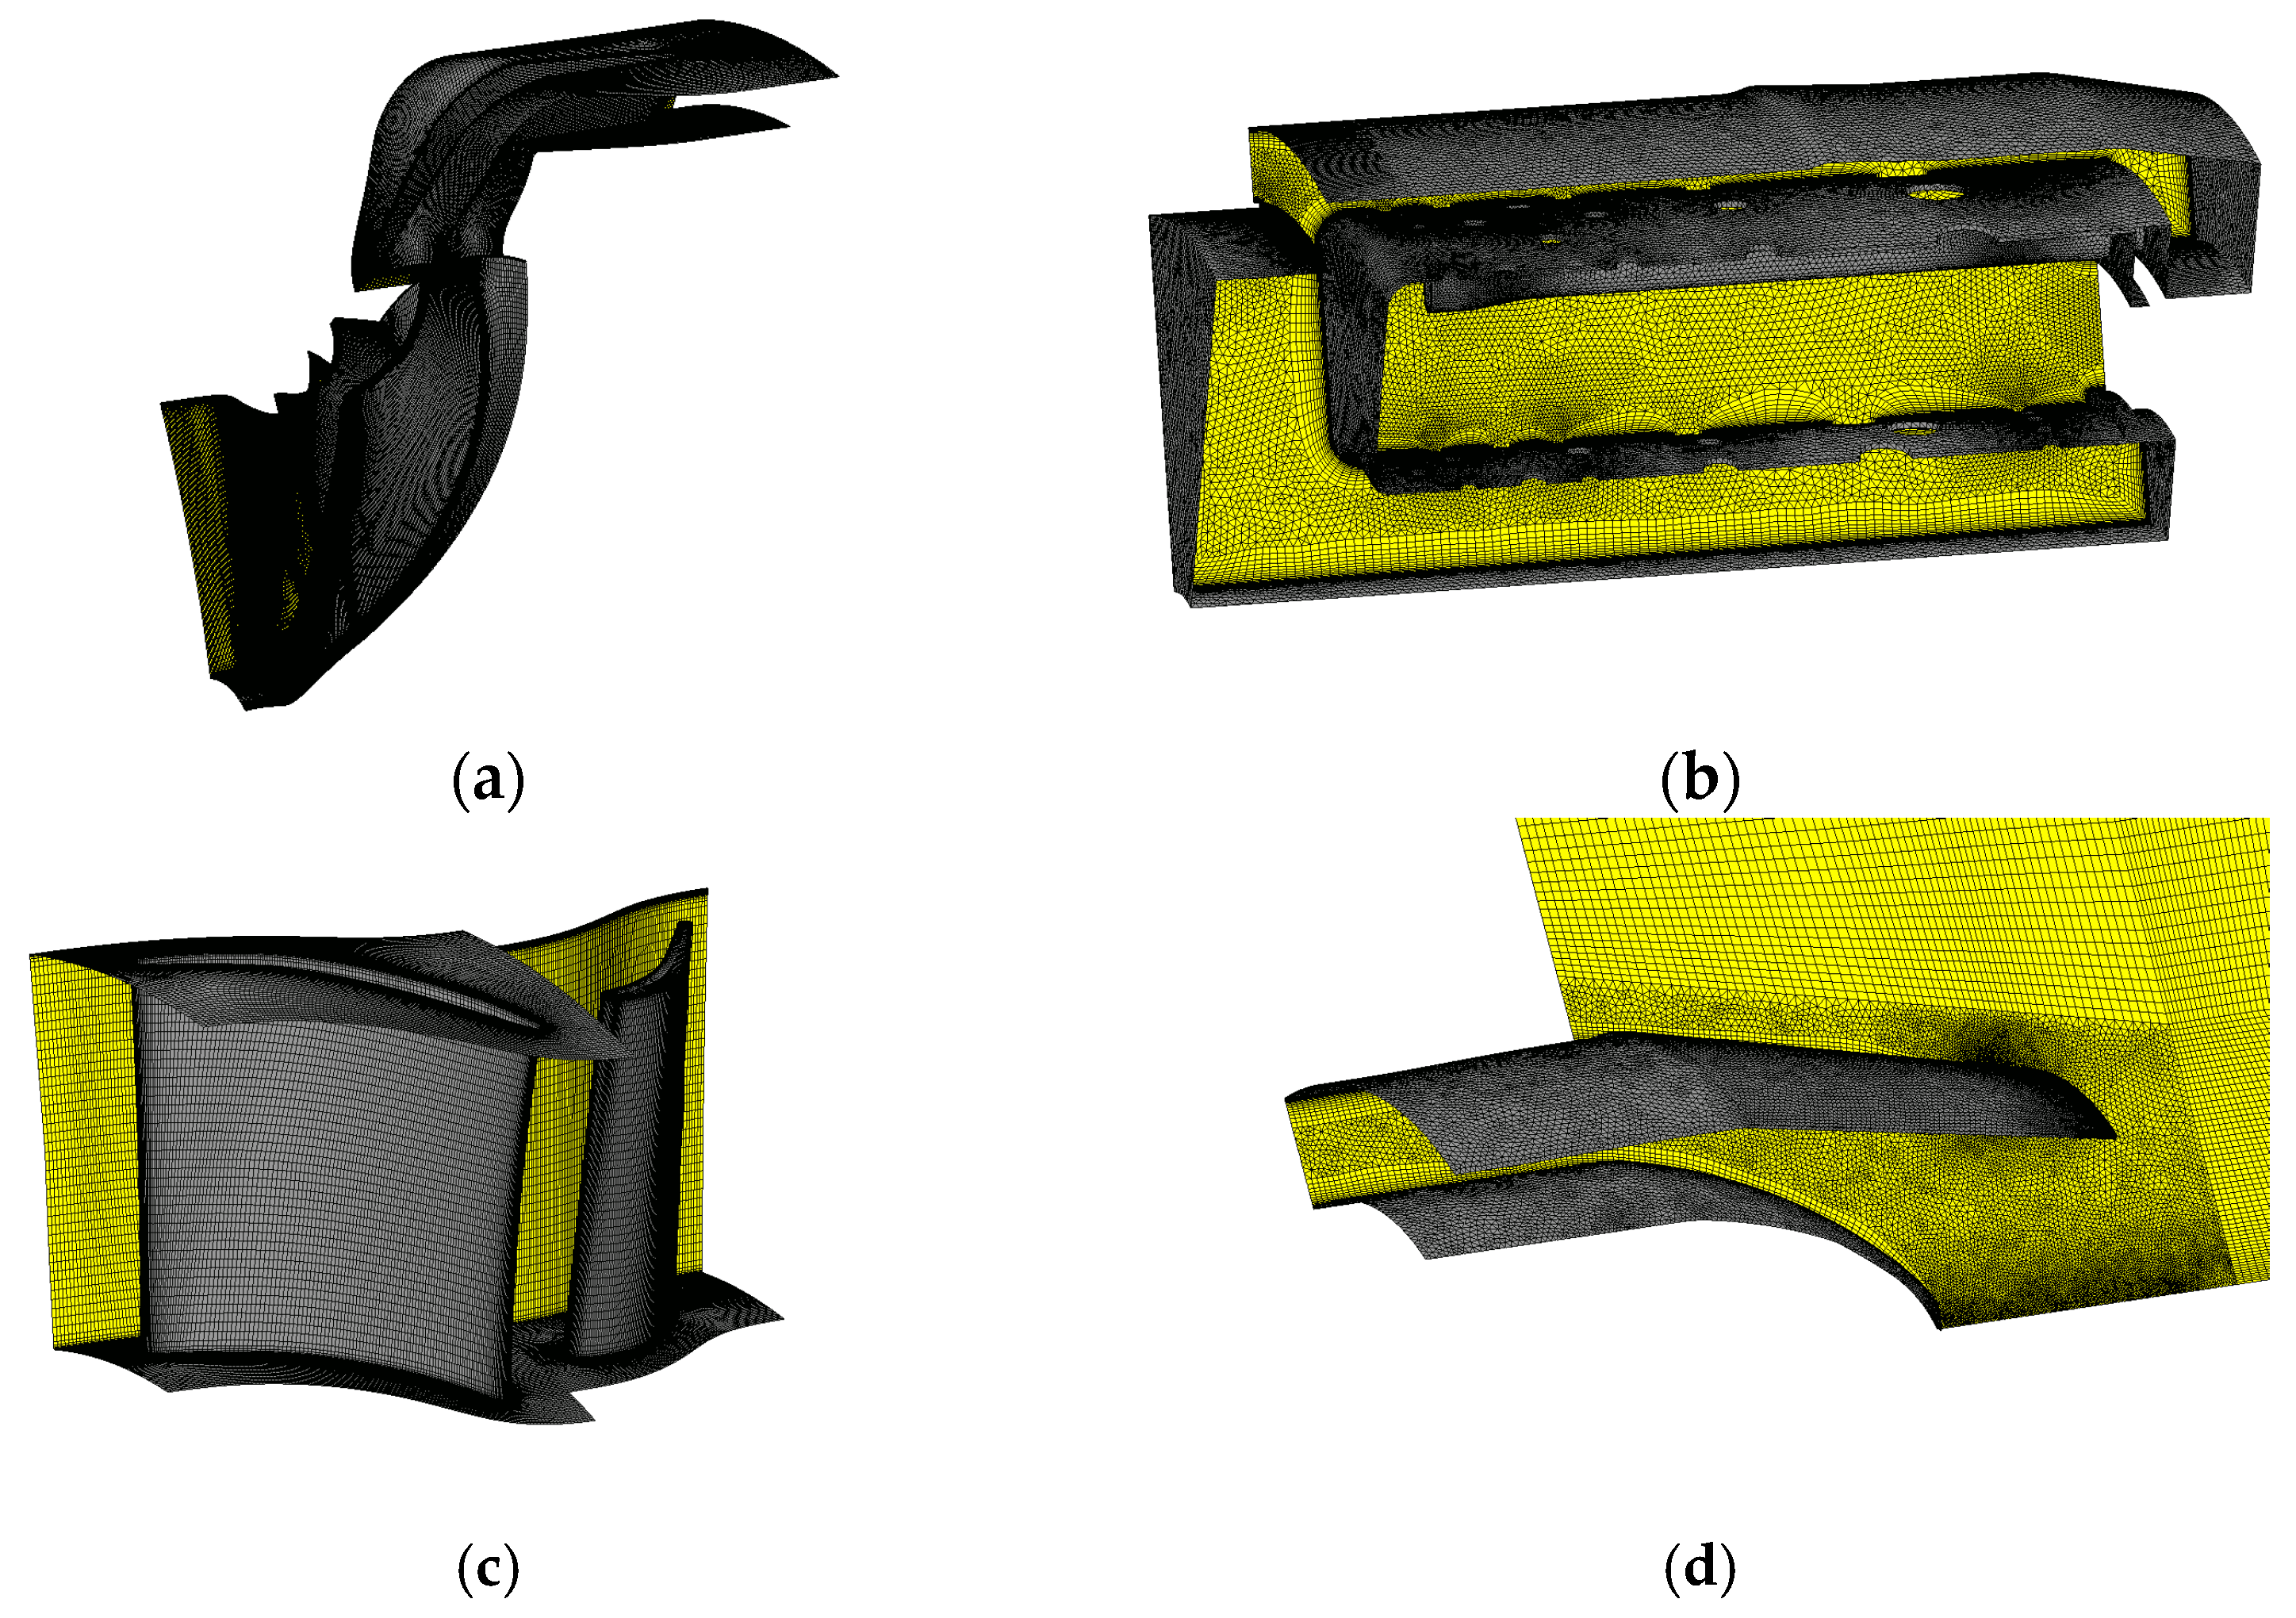
The grid was generated via the compressor or turbine as an aligned grid in the hex/prism format using TurboGrid software (2021 R1) from ANSYS (Canonsburg, PA, USA). The remaining portion of the domain was generated as a non-aligned grid utilizing a combination of the hex/prism and tetrahedral formats, leveraging the meshing program of ANSYS. The grid configuration resulted in approximately 9 million nodes and 14 million elements across the entire domain. The grid geometry and the number of nodes and elements for each domain are presented in Figure 5 and Table 2, respectively.
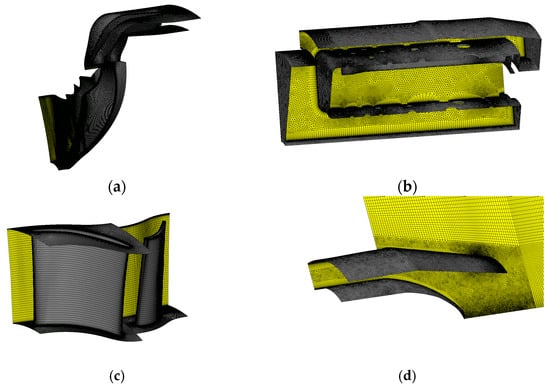
Figure 5.
Grid System of Integrated Analysis Model: (a) Compressor; (b) Combustor; (c) Turbine; (d) Exhaust Nozzle.
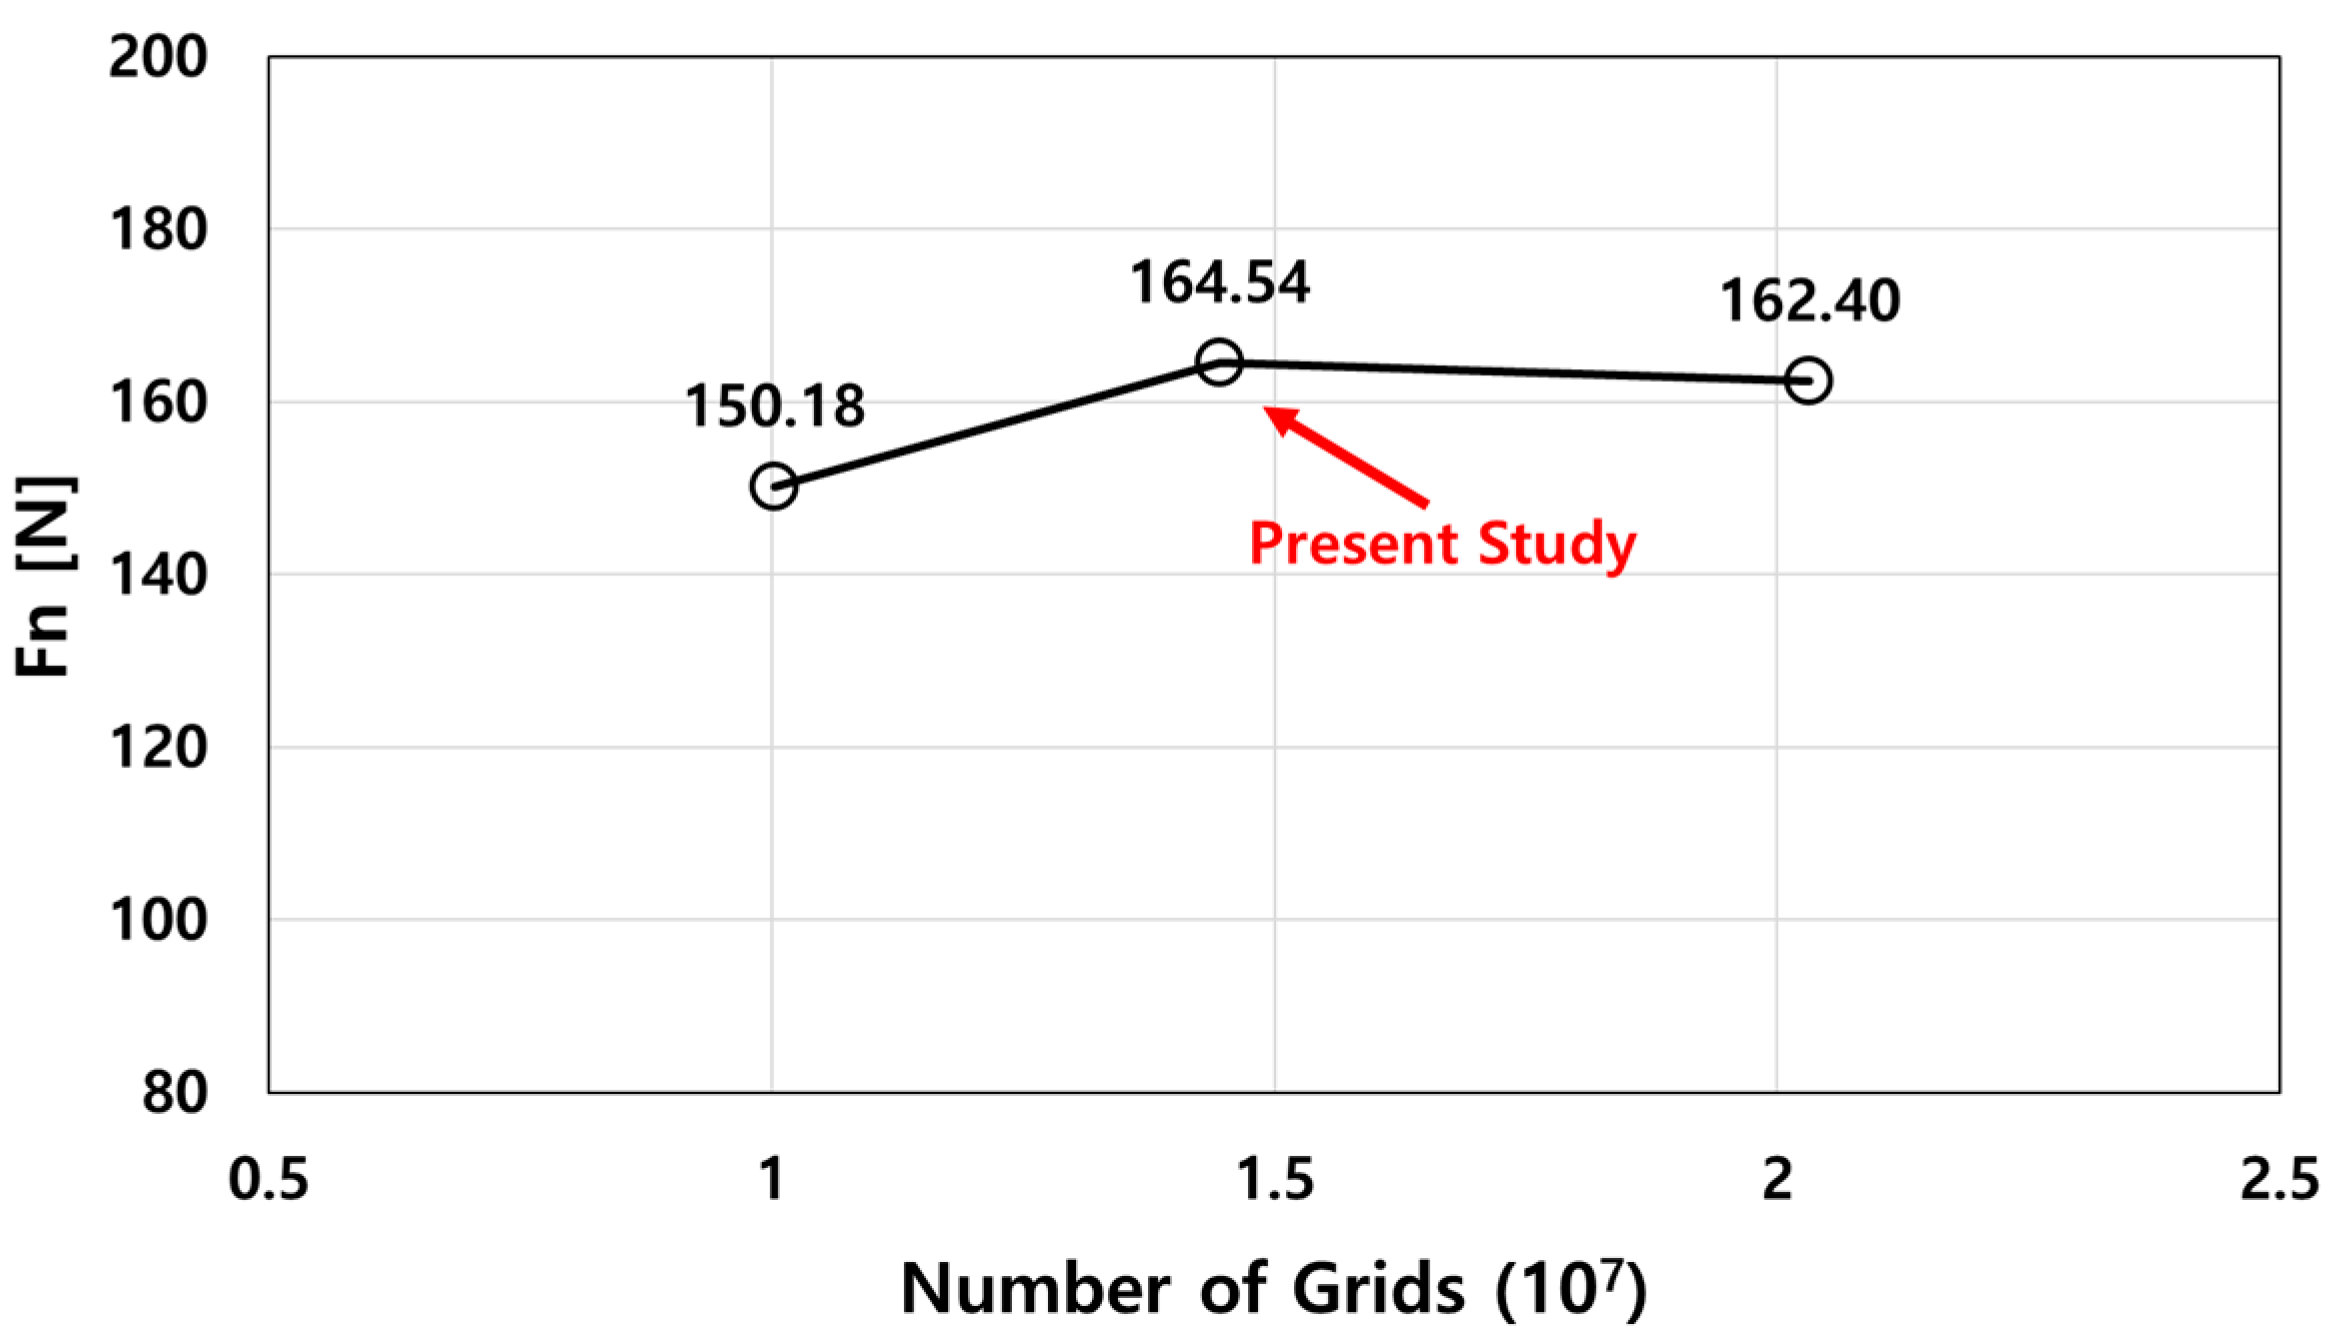
To validate the grid, the Y+ values were examined on the analysis results at engine speeds of 50,000 RPM and 104,000 RPM, respectively. As illustrated in Figure 6, the Y+ values were found to be no higher than 10 in most regions, even at higher RPM, except in the limited region near the impeller tip. Furthermore, as shown in Figure 7 below, a grid independence check was conducted by varying the grids from 10 million to 20 million. The results demonstrated that, compared to the present grid system, the thrust difference was 8.7% for the 10 million grid system. This difference was reduced to less than 1.3% for the 20 million grid system, which is 1.5 times the present grid system, confirming that there is no problem with the present grid system.
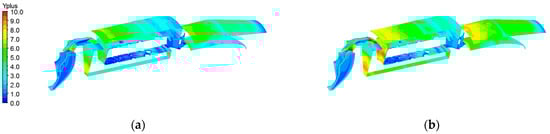
Figure 6.
Y+ Contour Plots at Different Engine RPM Conditions: (a) 50,000 RPM; (b)104,000 RPM.

Figure 7.
Grid Independence Test at 90,000 RPM Condition.
2.2.2. Solver Setting
The solver CFX (v.17.1) from ANSYS, typically utilized for turbomachinery analysis, was selected, and the steady-state analysis was conducted. The turbulence model was chosen for the analysis as it is well-suited for inverse pressure gradient analysis. However, the solver usually overpredicts the recirculation area, which can lead to divergences in the analysis of compressors that are sensitive to the recirculation area. To mitigate this, the reattach modification (RM) option was implemented on the model to prevent the overprediction of recirculation regions.
For the combustion model, the eddy dissipation model (EDM), which is a reactive gas model, was employed. For the reaction model, the JetA Air WD1 Phase 1 reaction model was adapted, which uses JetA as the reactant.
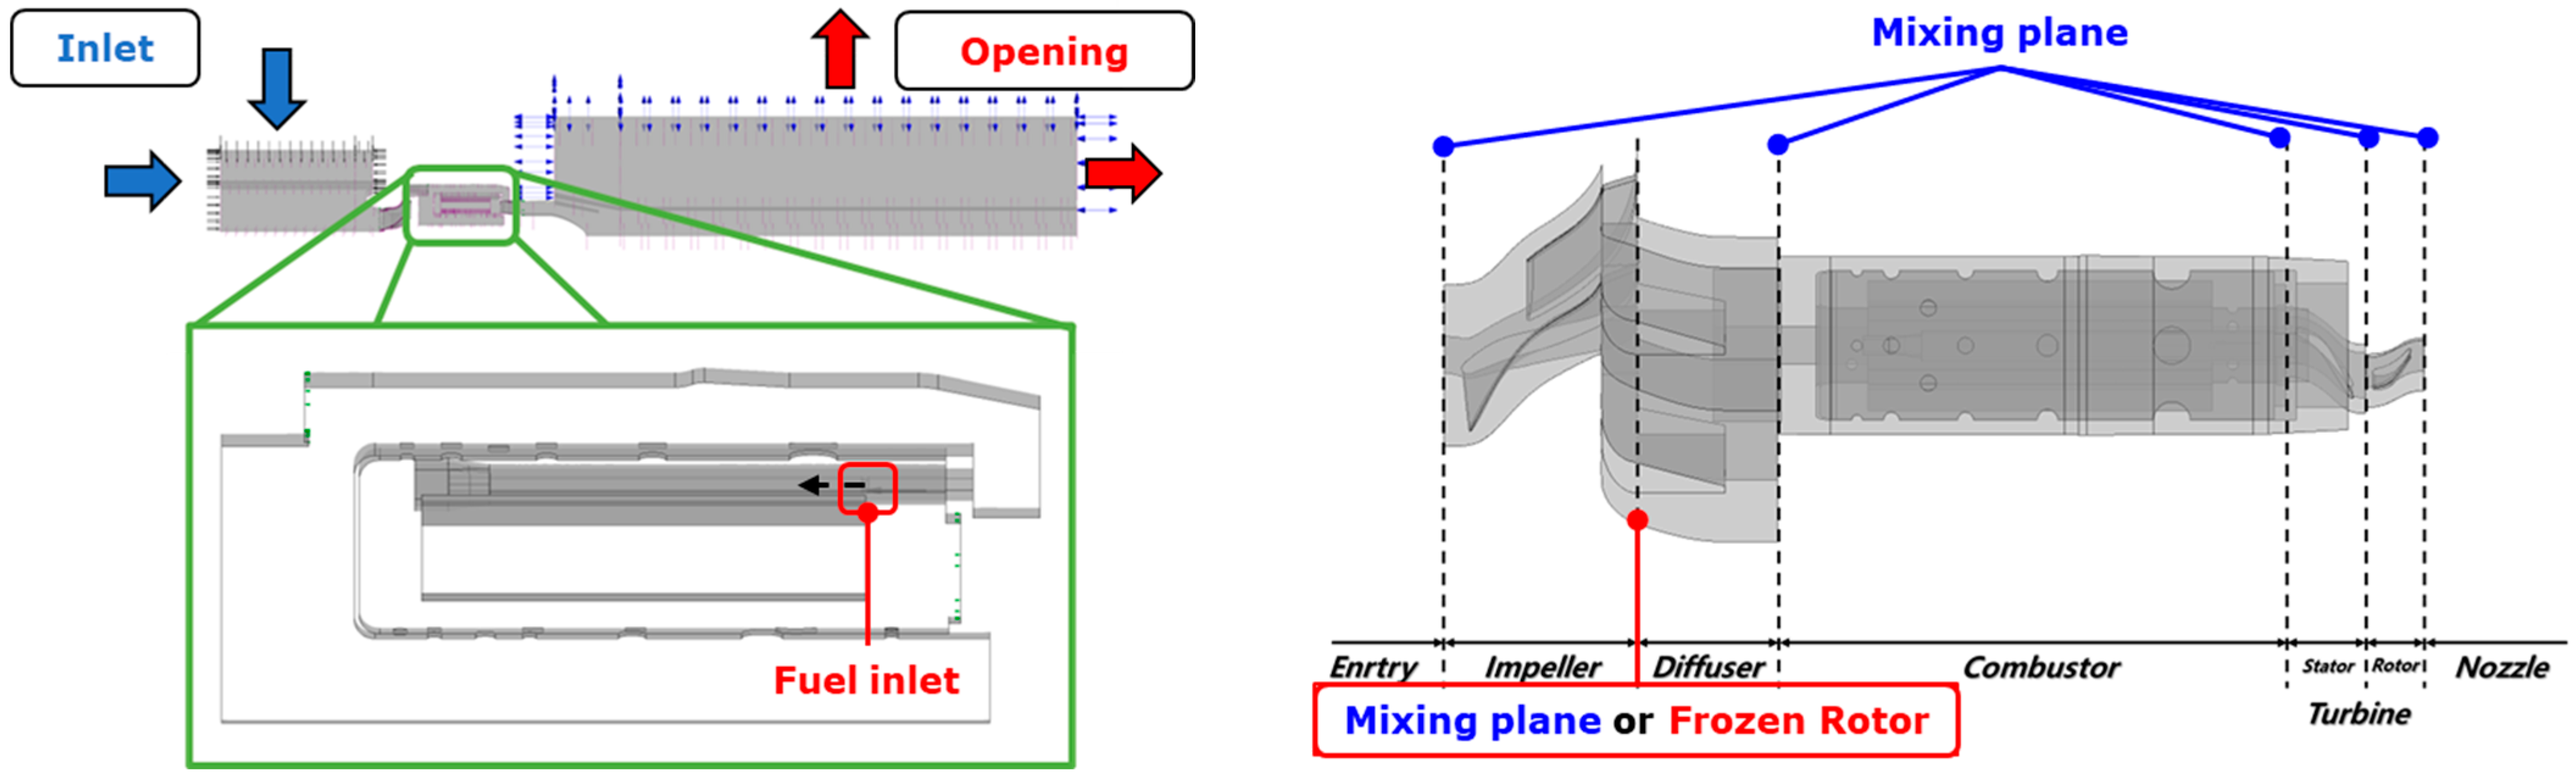
The analysis was conducted on a series of specified RPMs, ranging from 30,000 RPM to 104,000 RPM, of the engine to compare the actual engine test data and the analyzed results. As shown in Figure 8 and Table 3, the boundary conditions were applied. Among the boundary conditions, it was assumed that the entry boundary’s fluid composition was constituted of O2 and N2, with the absence of other substances such as H2O and CO2. For the outlet, complete combustion was assumed, so it was assumed to consist of O2, N2, H2O, and CO2, with no other substances present, such as CO or NOx. For the fuel boundary condition, a mass flow rate was applied to the fuel inlet, and a user-defined subroutine was employed to calculate and apply the fuel flow rate in each iteration. A detailed description of this subroutine is presented in the latter part of this section.
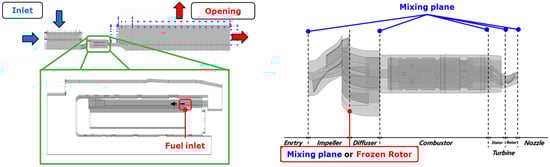
Figure 8.
Boundary Conditions and Interfaces of Numerical Domain.
Table 3.
Boundary Conditions for Micro Gas Turbine Engine.
To implement a fully coupled analysis model, it is necessary to establish an interface between each domain component. In this analysis model, the components of a system are represented as both rotating parts, such as compressors and turbines, and fixed parts, such as combustors and nozzles, which exist simultaneously. Accordingly, a mixing plane (stage) interface was implemented to guarantee that the analysis outcomes remain unaltered regardless of the relative angles between the domains, as illustrated in Figure 8.
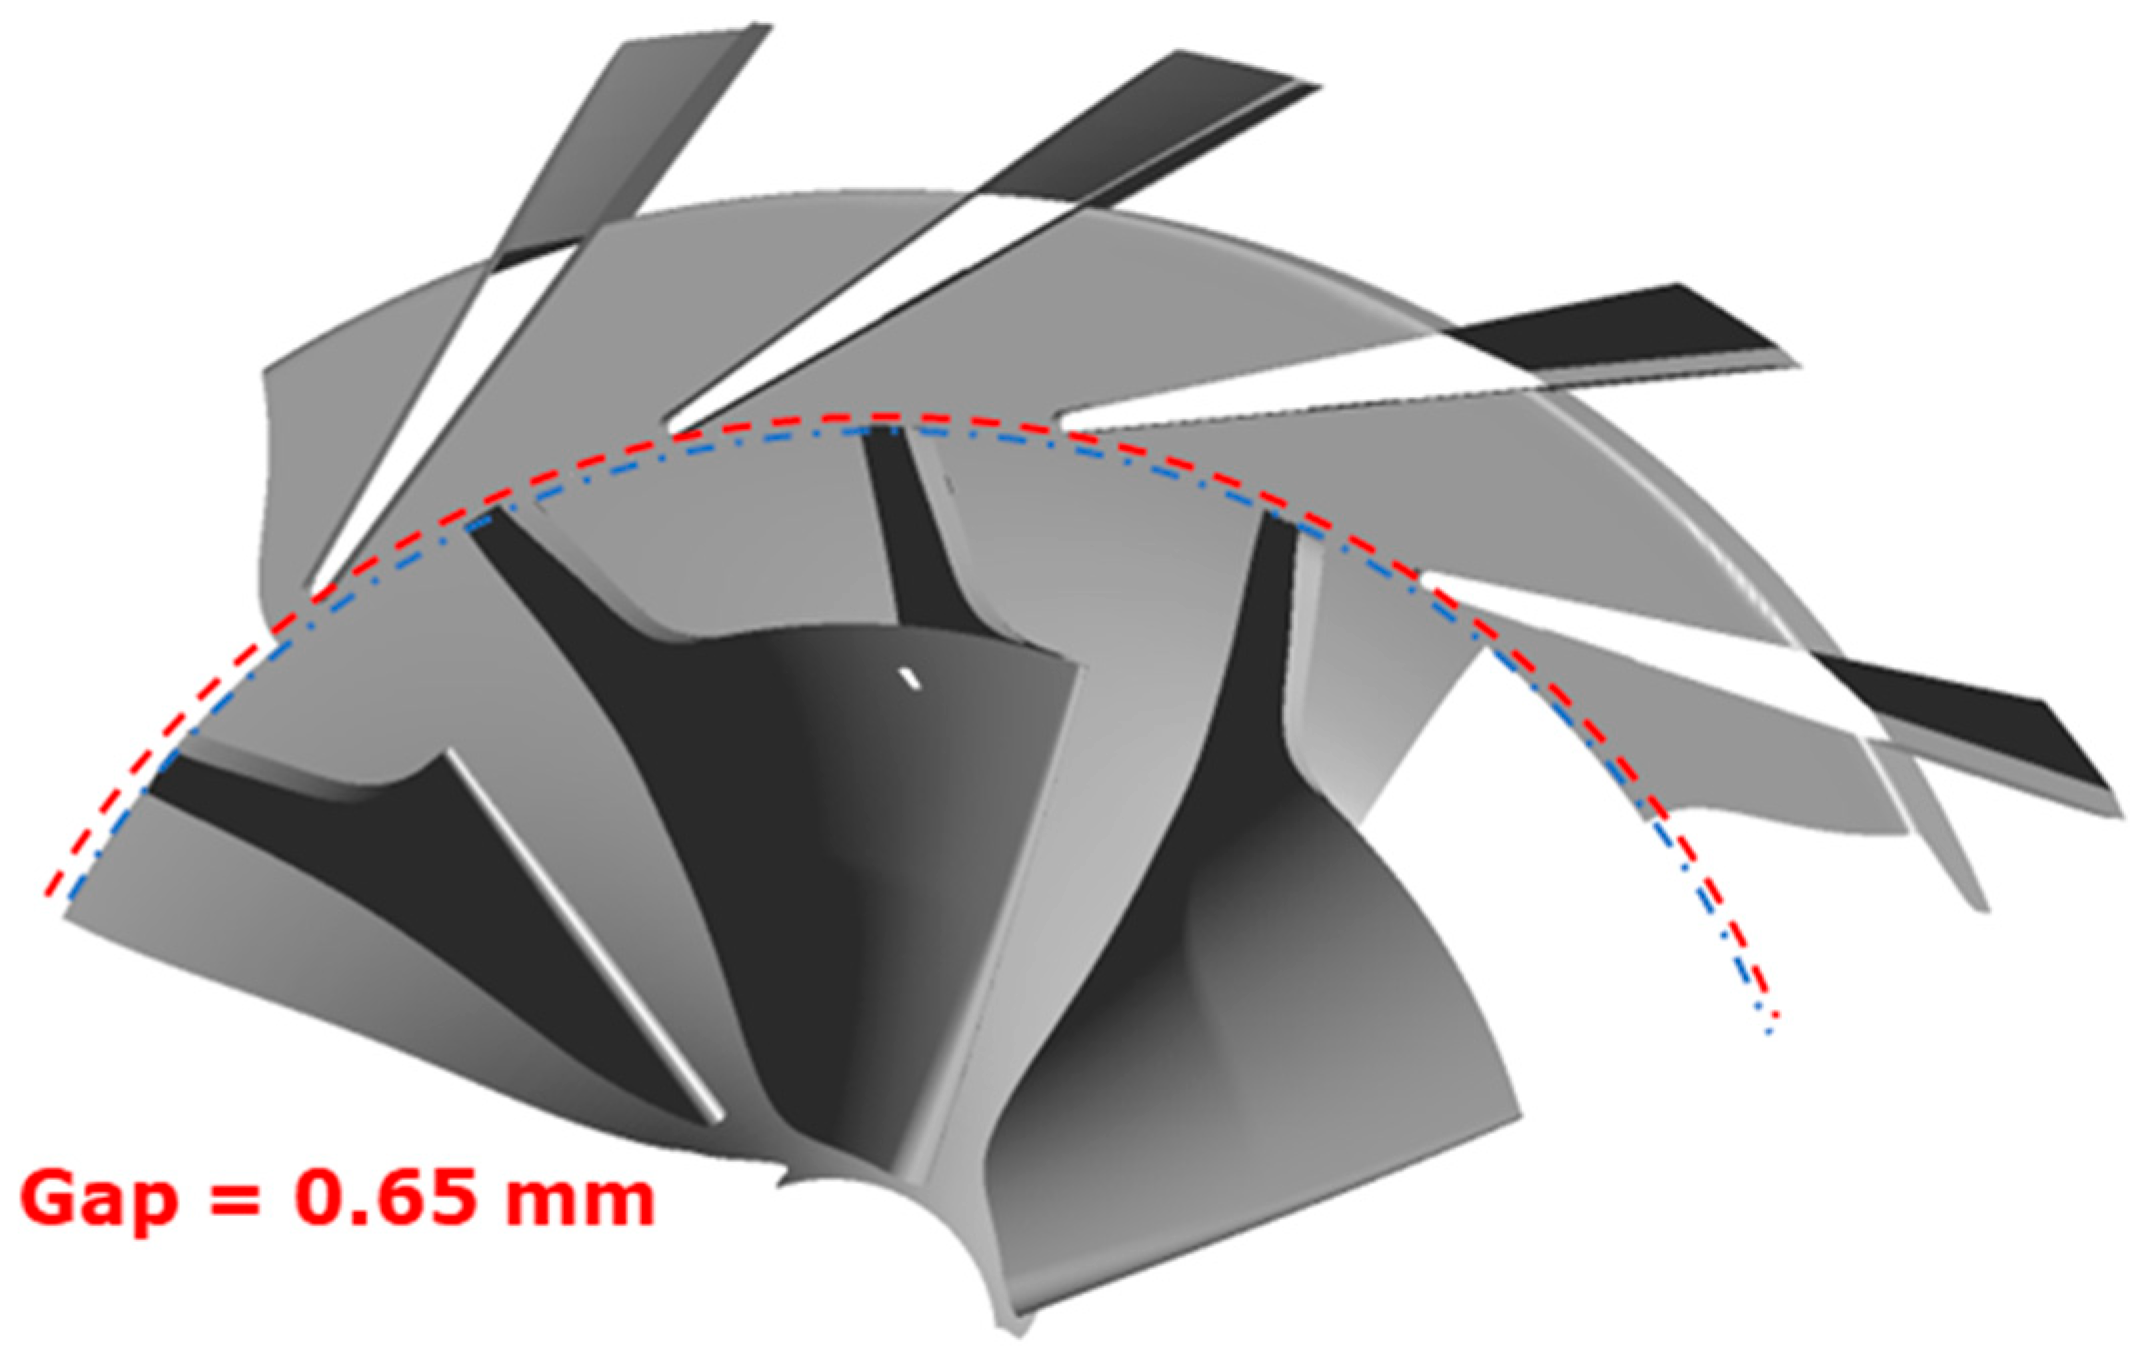
Furthermore, the micro gas turbine engine operates at a high rotational speed, which causes the compressor to operate near the surge region; the small size of the micro gas turbine engine results in a minimal distance between the impeller and diffuser blades, with a value of 0.65 mm, as illustrated in Figure 9. This proximity between the impeller and diffuser presents a challenge to the convergence of the simulation. Considering these, this study employed simulations of mixing plane interfaces between the impeller and diffuser and compared with the previous study [21] case, which adapted the frozen rotor interface at the impeller and diffuser.

Figure 9.
Impeller and Diffuser Blade Geometry.
- Frozen rotor interface w/ secondary air flow [21].
- Mixing plane w/ secondary air flow.
In the case of the “Stage Interface with Secondary Air Flow”, the objective was to establish a more realistic analysis model by simulating the secondary air flow system in the actual engine.
Table 4 provides a summary of the solver settings described above.
Table 4.
Analysis Models and Solver Setting Information.
2.3. Power Matching
The target engine is comprised of a single shaft, and the compressor and turbine operate at the same rotational speed. When the micro gas turbine engine is operating at a constant rotational speed, the torque produced by the turbine and the torque required by the compressor are identical, referred to as power matching. However, CFX does not provide a distinct model or option to reflect power matching. So, an additional subroutine was applied to adjust the fuel flow rate based on the torque of the compressor and turbine, as determined by the torque ratio of the compressor and turbine. This subroutine was incorporated into the analysis model to control the fuel flow rate during computation. The subroutine is based on the previous research [21], and the equation is as follows:
In Equation (1), represents the torque of the compressor or turbine, and represents the fuel mass flow rate.
However, when Equation (1) is applied, the amount of change in the fuel flow rate becomes significant when the torque ratio changes rapidly. In such cases, convergence may take a considerable amount of time, and in severe instances, the analysis may diverge. To enhance the convergence of the analysis, a relaxation factor (RF) is introduced. As shown in Equation (2), the RF value of 0.005 is selected in this study.
2.4. Combustion Efficiency
It is essential to reflect the appropriate combustion efficiency in the analysis model to predict engine performance, such as air flow rate, fuel flow rate, and thrust TSFC. A review of previous research was conducted to determine the combustion efficiency. Among them, the results of Kim et al. [10] indicated that the combustion efficiency of the combustor of P300-RX was 91~93%. Furthermore, a previous study by Kim et al. [23] employed experimental techniques to assess the combustion efficiency of a similar micro gas turbine engine, with the resulting efficiency of approximately 88%. So, in this study, the combustion efficiency of the micro gas turbine was selected as 90%, according to the findings of previous studies [10,23]. However, since CFX does not have a separate option to apply combustion efficiency, we applied efficiency by modifying the enthalpy value of JetA-1 by changing the NASA 7-coefficient polynomial parameterization, as registered in the CFX library.
2.5. Secondary Air Flow
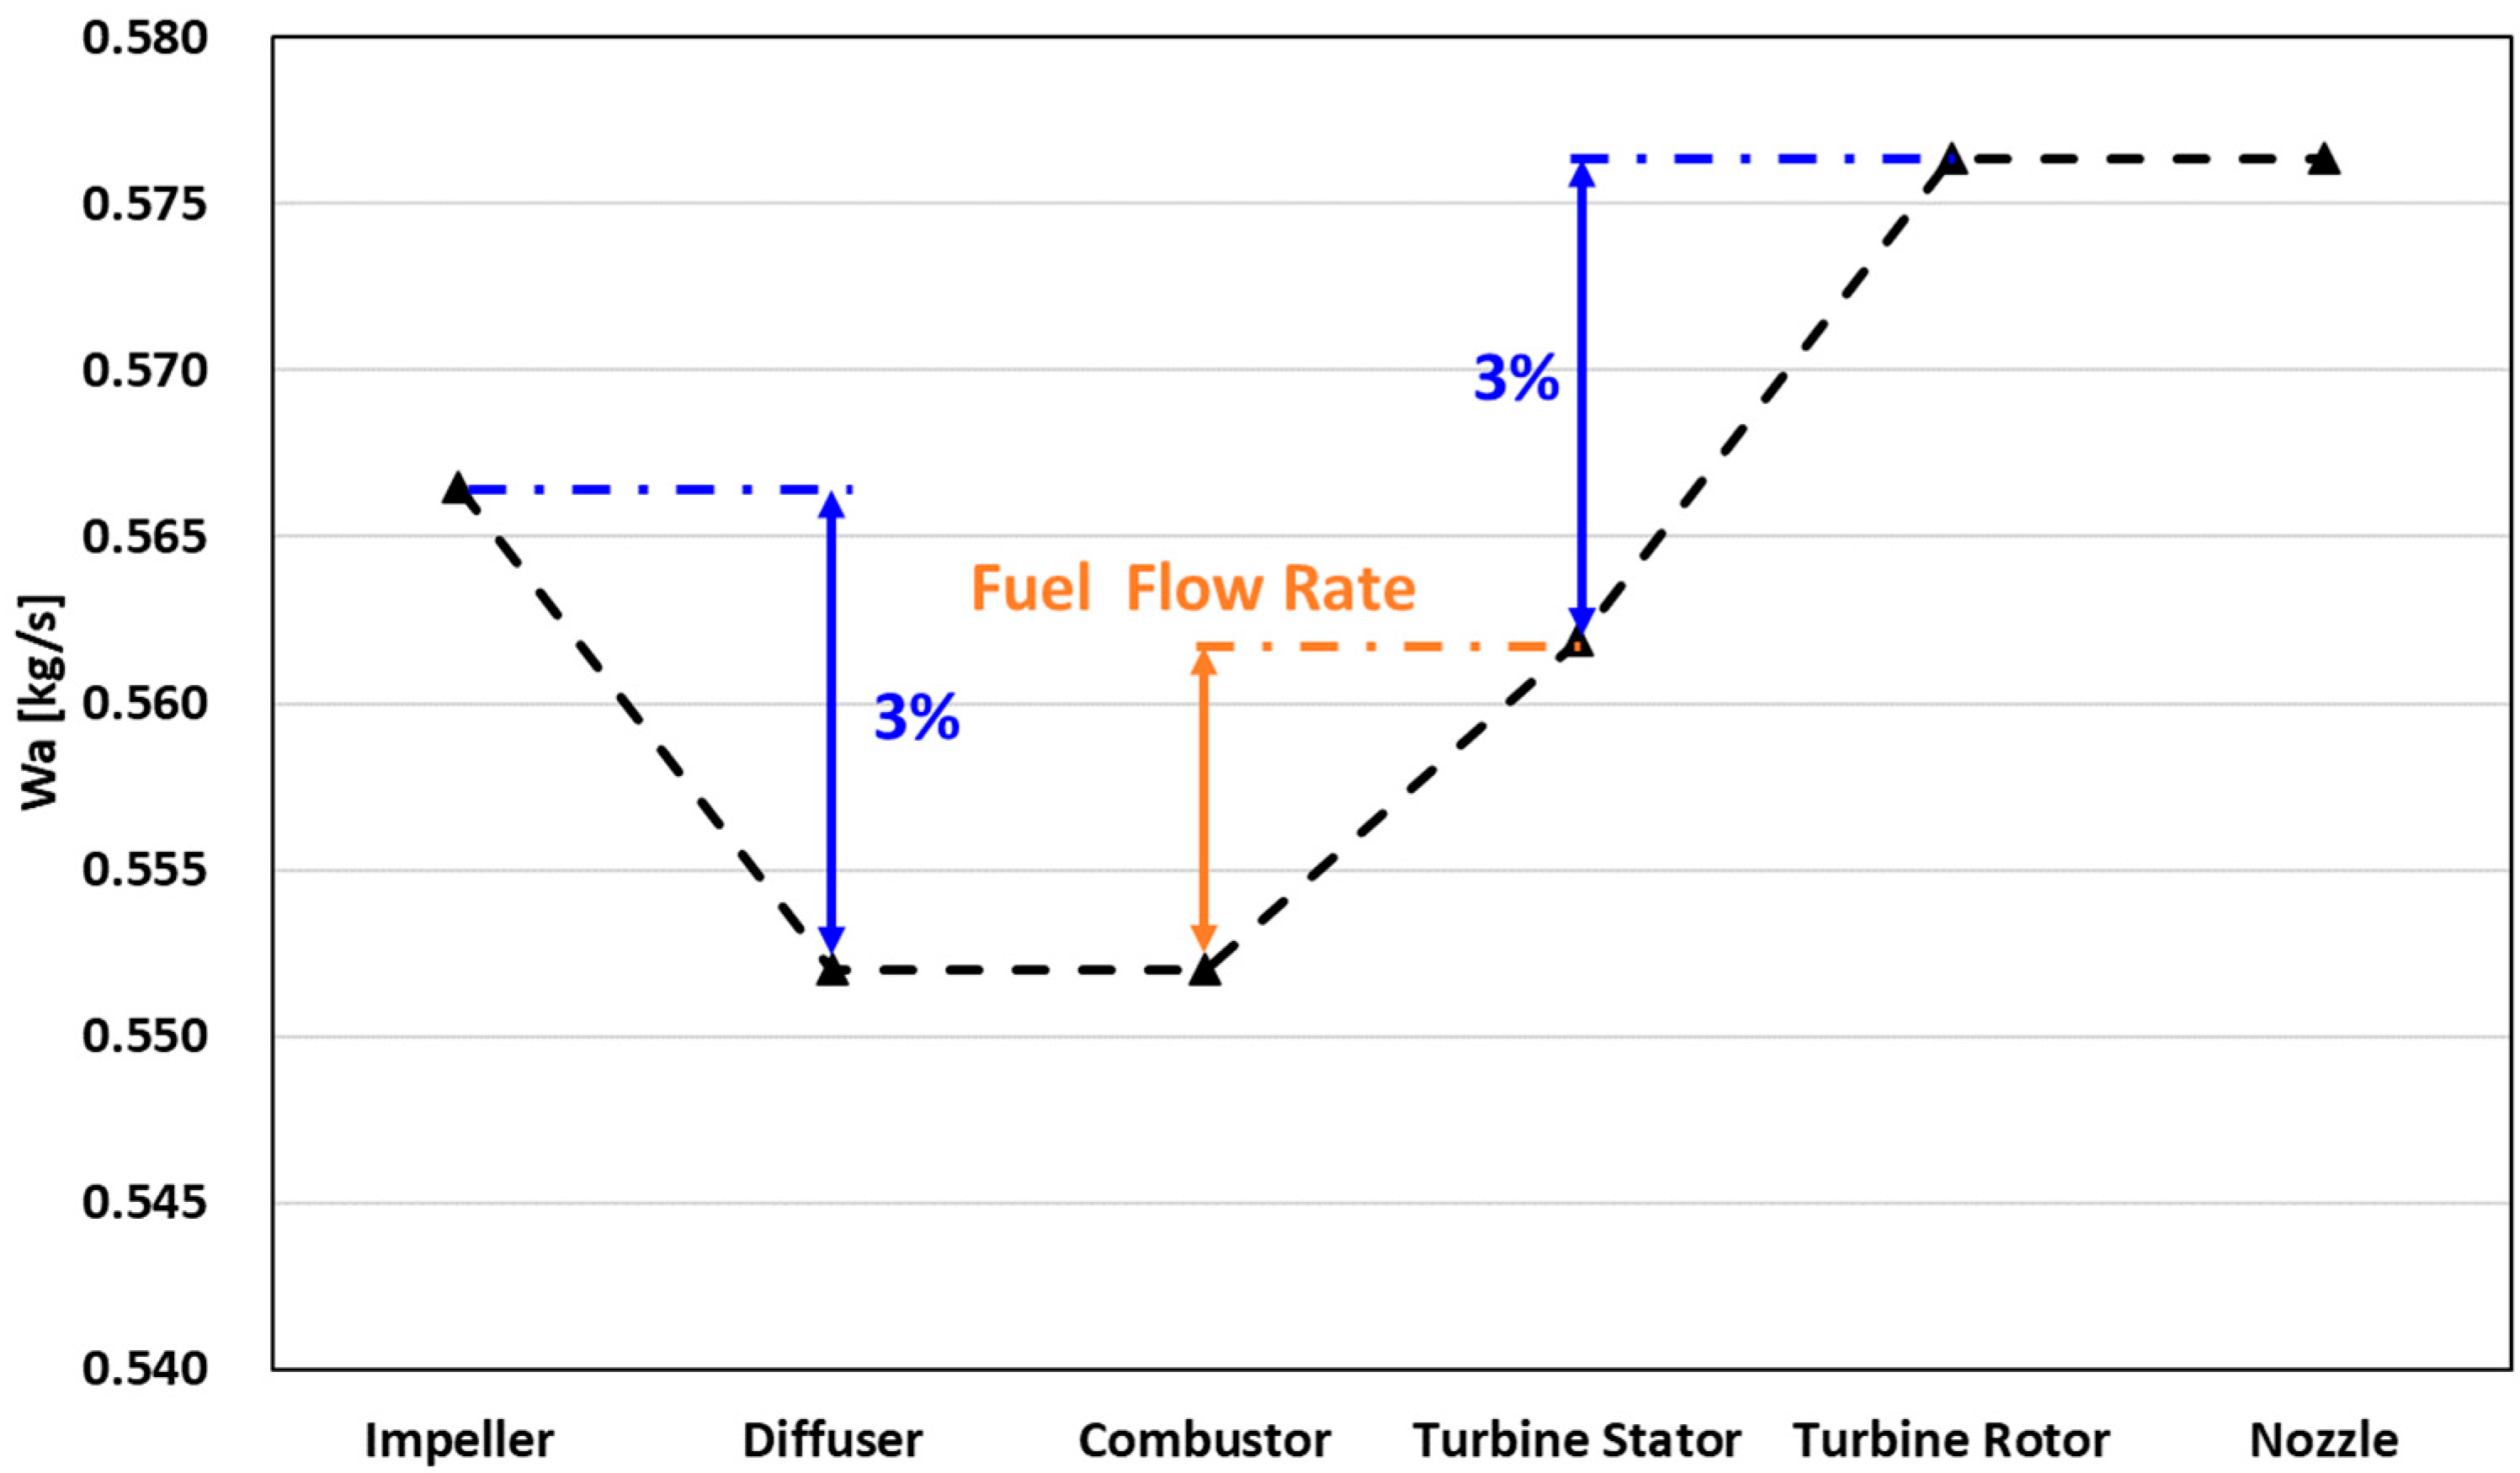
As previously stated, in a real engine, secondary air flows through the gap into the shaft housing interior space. After that, it discharges through the gap between the turbine stator and the rotor as presented in Figure 3. Therefore, the secondary air flow is reflected in the simulation model for a more accurate simulation model. However, it is difficult to demonstrate all the secondary air flow path geometries. So, only the bleed air through the compressor and turbine was reflected. The secondary flow is simulated through CFX’s source function and is set to bleed out an air flow equal to 3% of the compressor inlet flow in the area between the impeller and diffuser, as shown in Figure 10a, and an equal amount of bleed-out air flow is set to discharge through some of the hub areas between the turbine stator and turbine rotor, as shown in Figure 10b. To validate the secondary flow system, it was applied and analyzed at 104,000 RPM conditions. After that, the air flow rates at each component inlet were compared. The results showed a 3% reduction in the air flow rate between the impeller and diffuser and a 3% increase in the air flow rate between the turbine stator and rotor shown in Figure 11. These findings confirm that the secondary flow system was applied correctly.
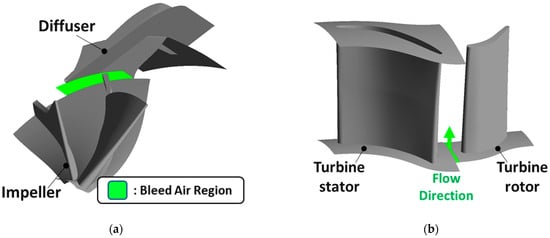
Figure 10.
Secondary Air Flow Modeling: (a) Impeller–Diffuser; (b) Turbine Stator–Turbine Rotor.
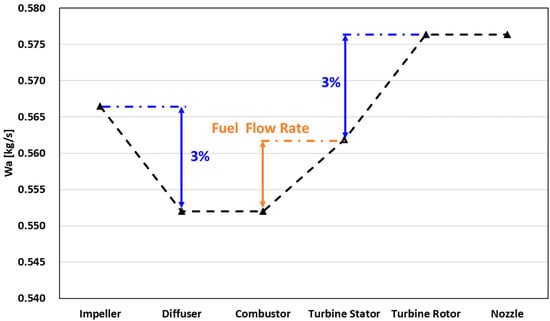
Figure 11.
Mass flow Rate of Working Fluid for Each Components Inlet at 104,000 RPM.
3. CFD Results
3.1. Compressor
In the compressor case, as shown in Figure 12, the analysis results by interface option at 104,000 RPM, it was confirmed that flow separation occurs on the hub side of the diffuser and the suction side of the diffuser blade, resulting in pressure loss. For a mixed plane interface, choking occurs over the entire hub area of the diffuser throat, but for a frozen rotor, the relative angle determines the choking region and is expected to vary with the relative angle between the impeller and diffuser. In a study conducted by Sebelev et al. [24], the results showed that the frozen rotor results are valid only for the specific relative angle. This is because the analysis results vary depending on the relative angle of a frozen rotor interface. So, a mixing plane interface was identified as a proper option for the compressor. In addition, implementing a secondary flow system, which represents an actual operational condition for the engine, under the mixing plane interface condition can help the flow matching between the impeller and diffuser and improve the convergence of analysis.
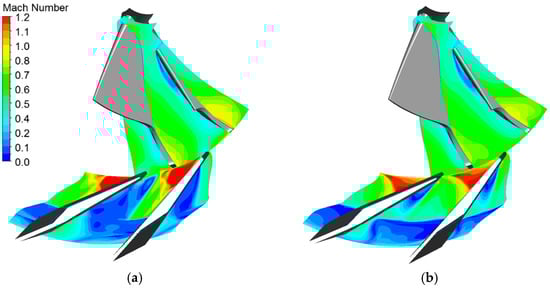
Figure 12.
Flow Field Contour Plots Depending on Interface Conditions at 10% Span at 104,000 RPM Condition: (a) Frozen Rotor Interface w/o Secondary Flow; (b) Mixing Plane Interface w/ Secondary Flow.
3.2. Combustor
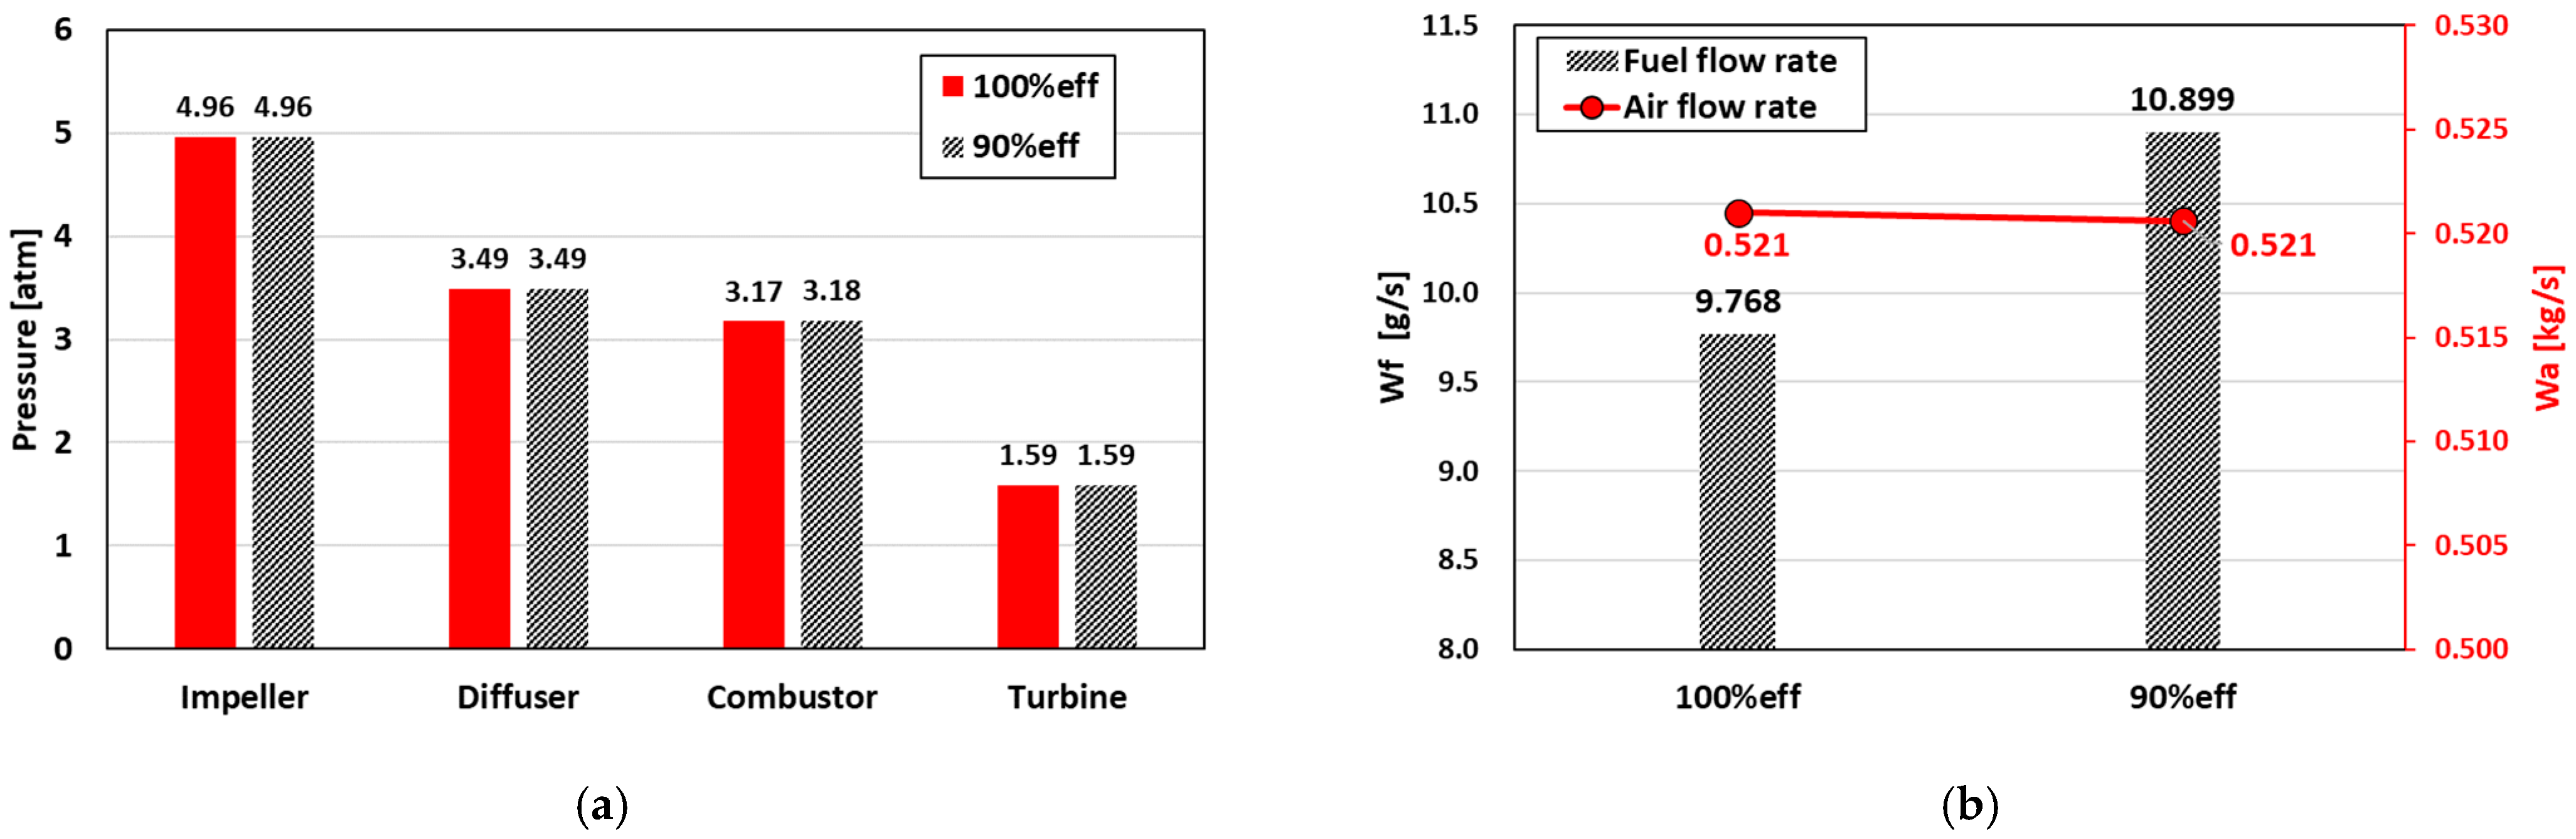
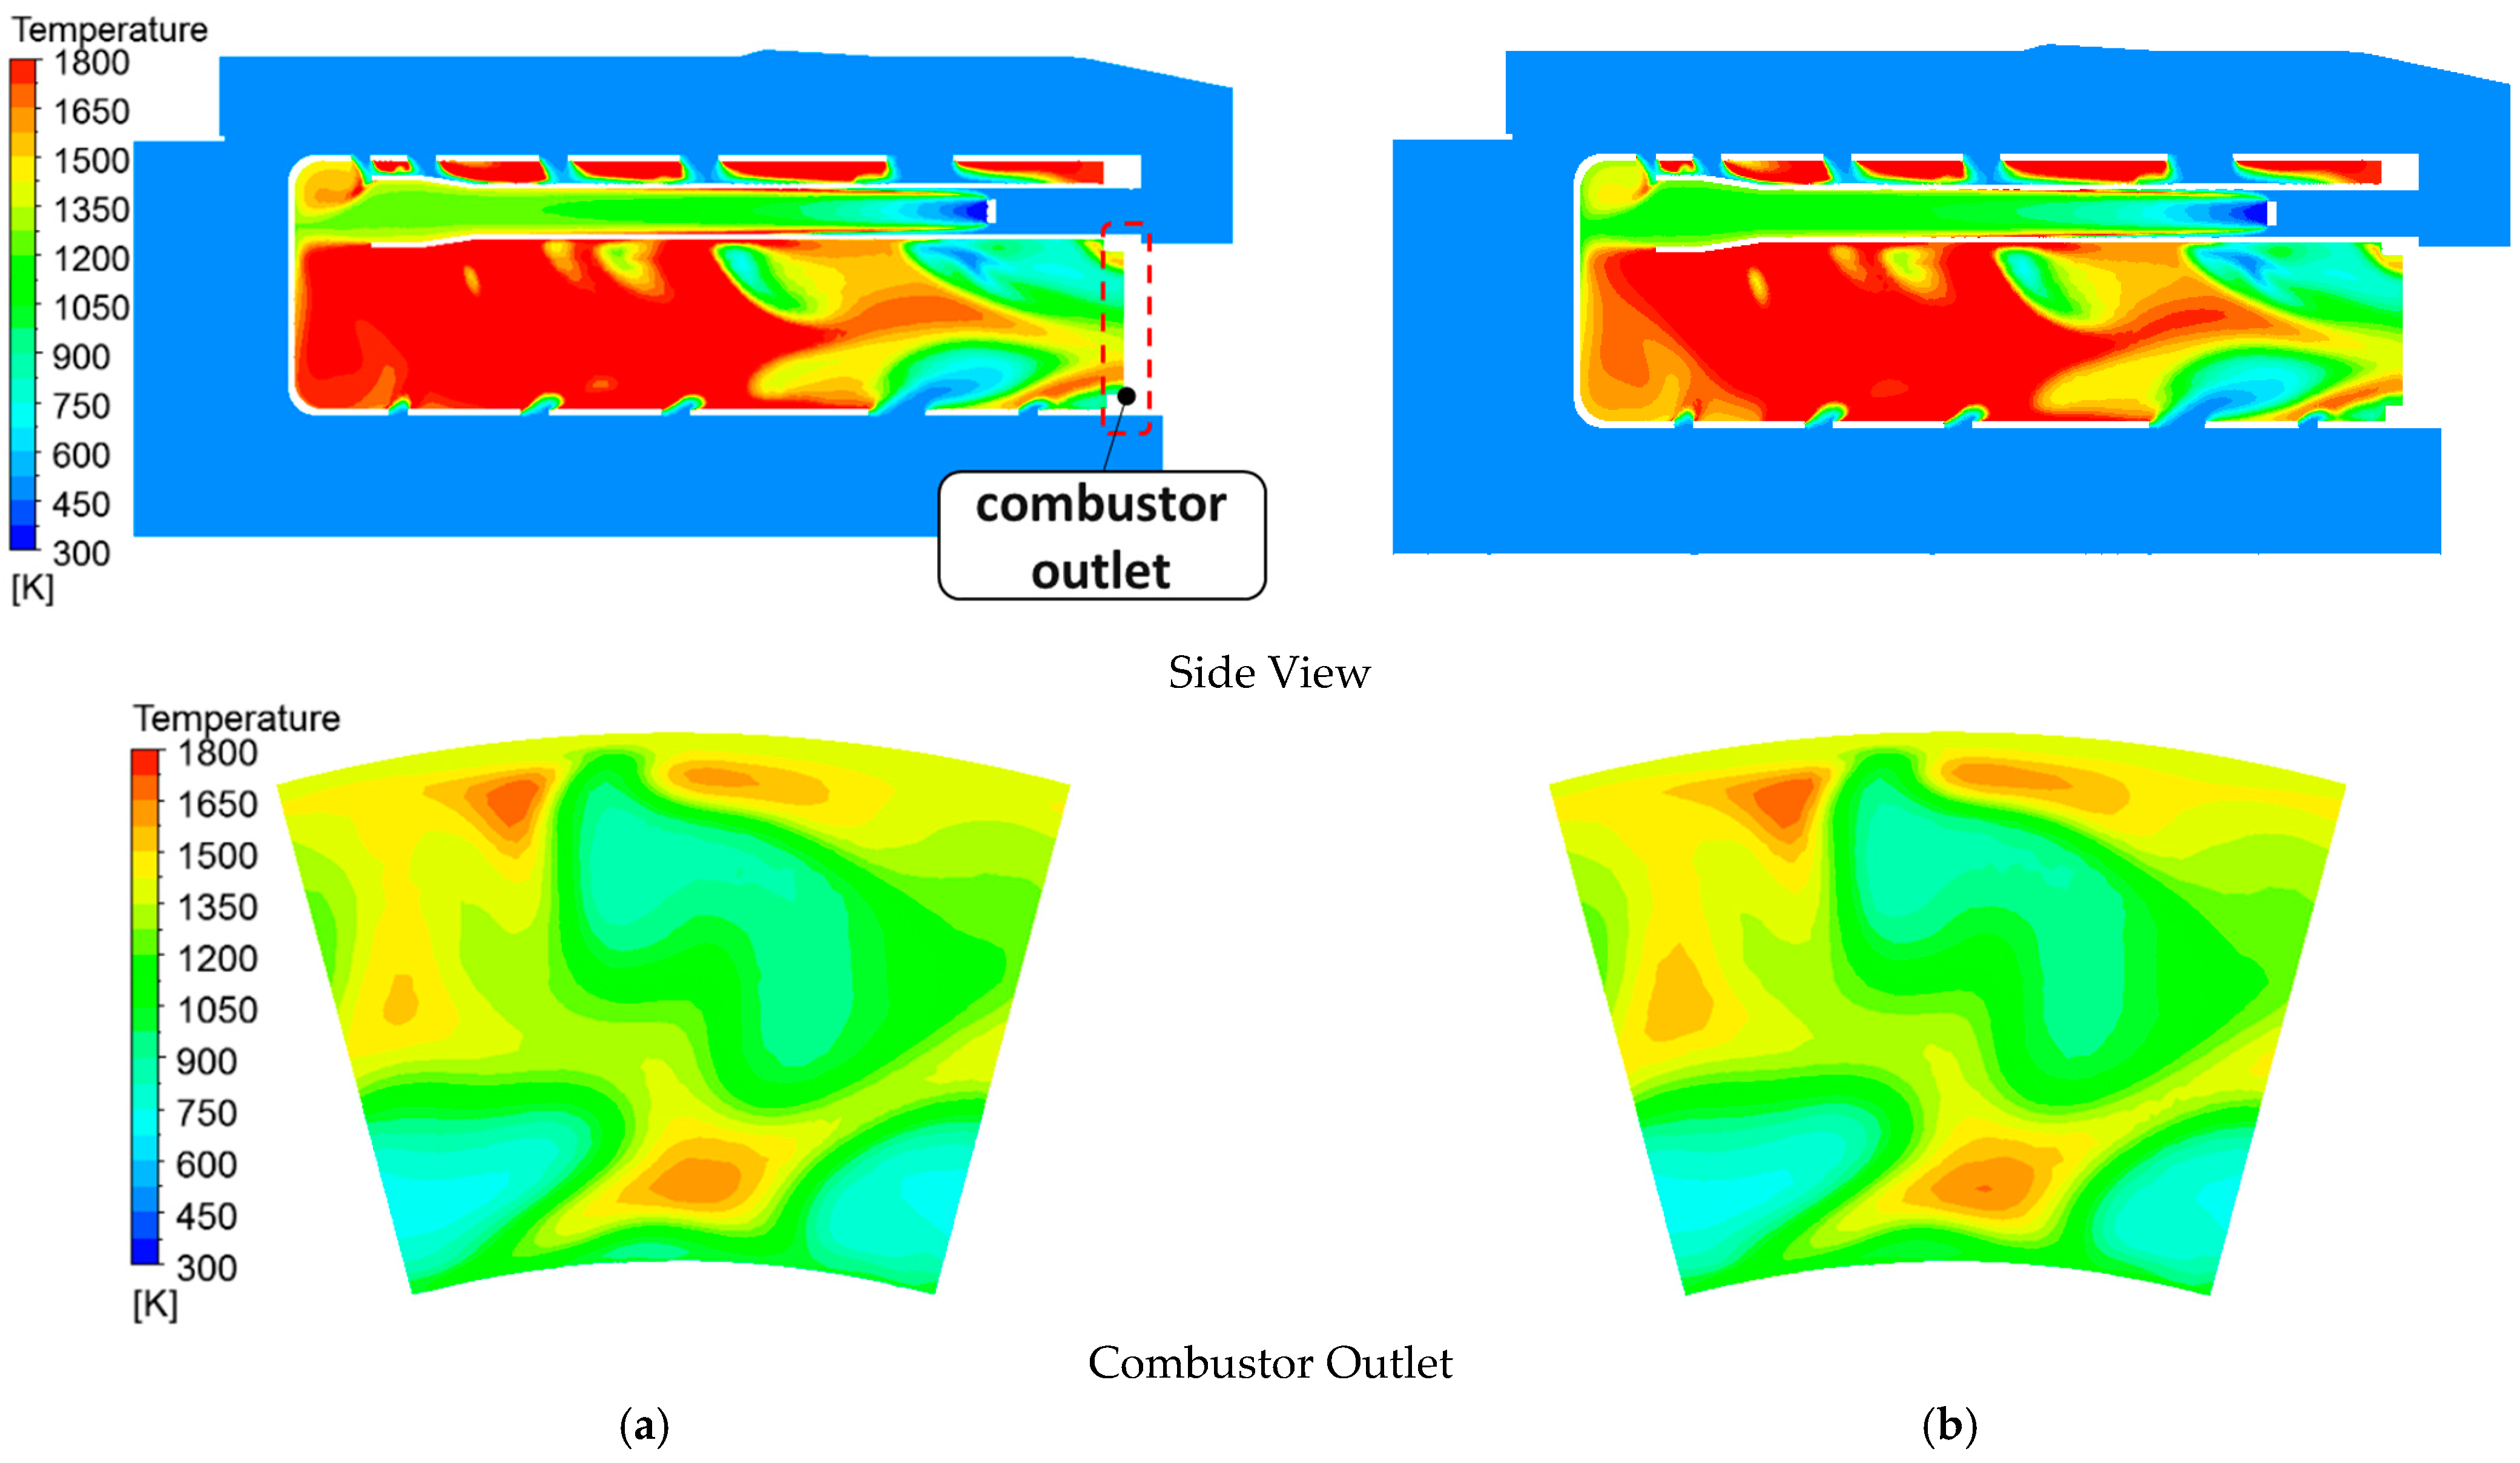
As described in Section 2.4, the combustion efficiency of 90% is derived from the previous studies [10,23]. A comparison of the internal temperature field at the same solver setting except for combustion efficiency at 100,000 RPM analysis conditions revealed that the average exit temperature of the combustor exhibited a discrepancy of less than 1%. In addition, as illustrated in Figure 13, the pressure and the air mass flow rate at each component remained consistent, while the fuel flow rate increased by 10% as combustion efficiency decreased. Therefore, as shown in Figure 14, the temperature field at the combustor also shows a similar trend. This is because the integrated analysis model only adjusts the calorific value of the fuel rather than adding a separate reaction model when applying combustion efficiency. It can be stated that the combustion efficiency model has no impact on engine performance, except for the fuel flow rate.
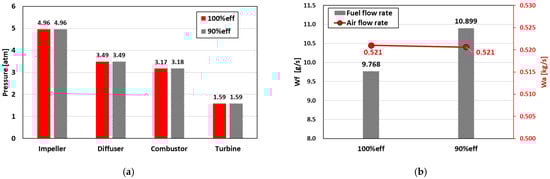
Figure 13.
Engine Performances According to Combustion Efficiency at 100,000 RPM: (a) Total Pressure at Each Component; (b) Air and Fuel Mass Flow Rates.
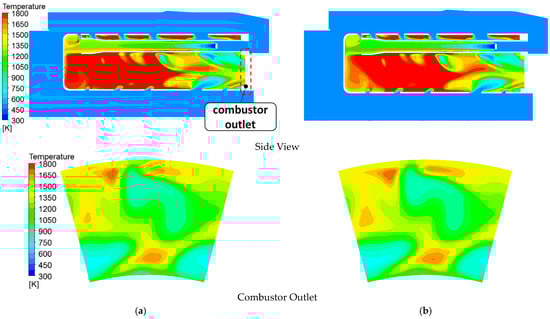
Figure 14.
Combustor Temperature Contour Plots at 104,000 RPM: (a) 100% Combustion Efficiency; (b) 90% Combustion Efficiency.
3.3. Turbine
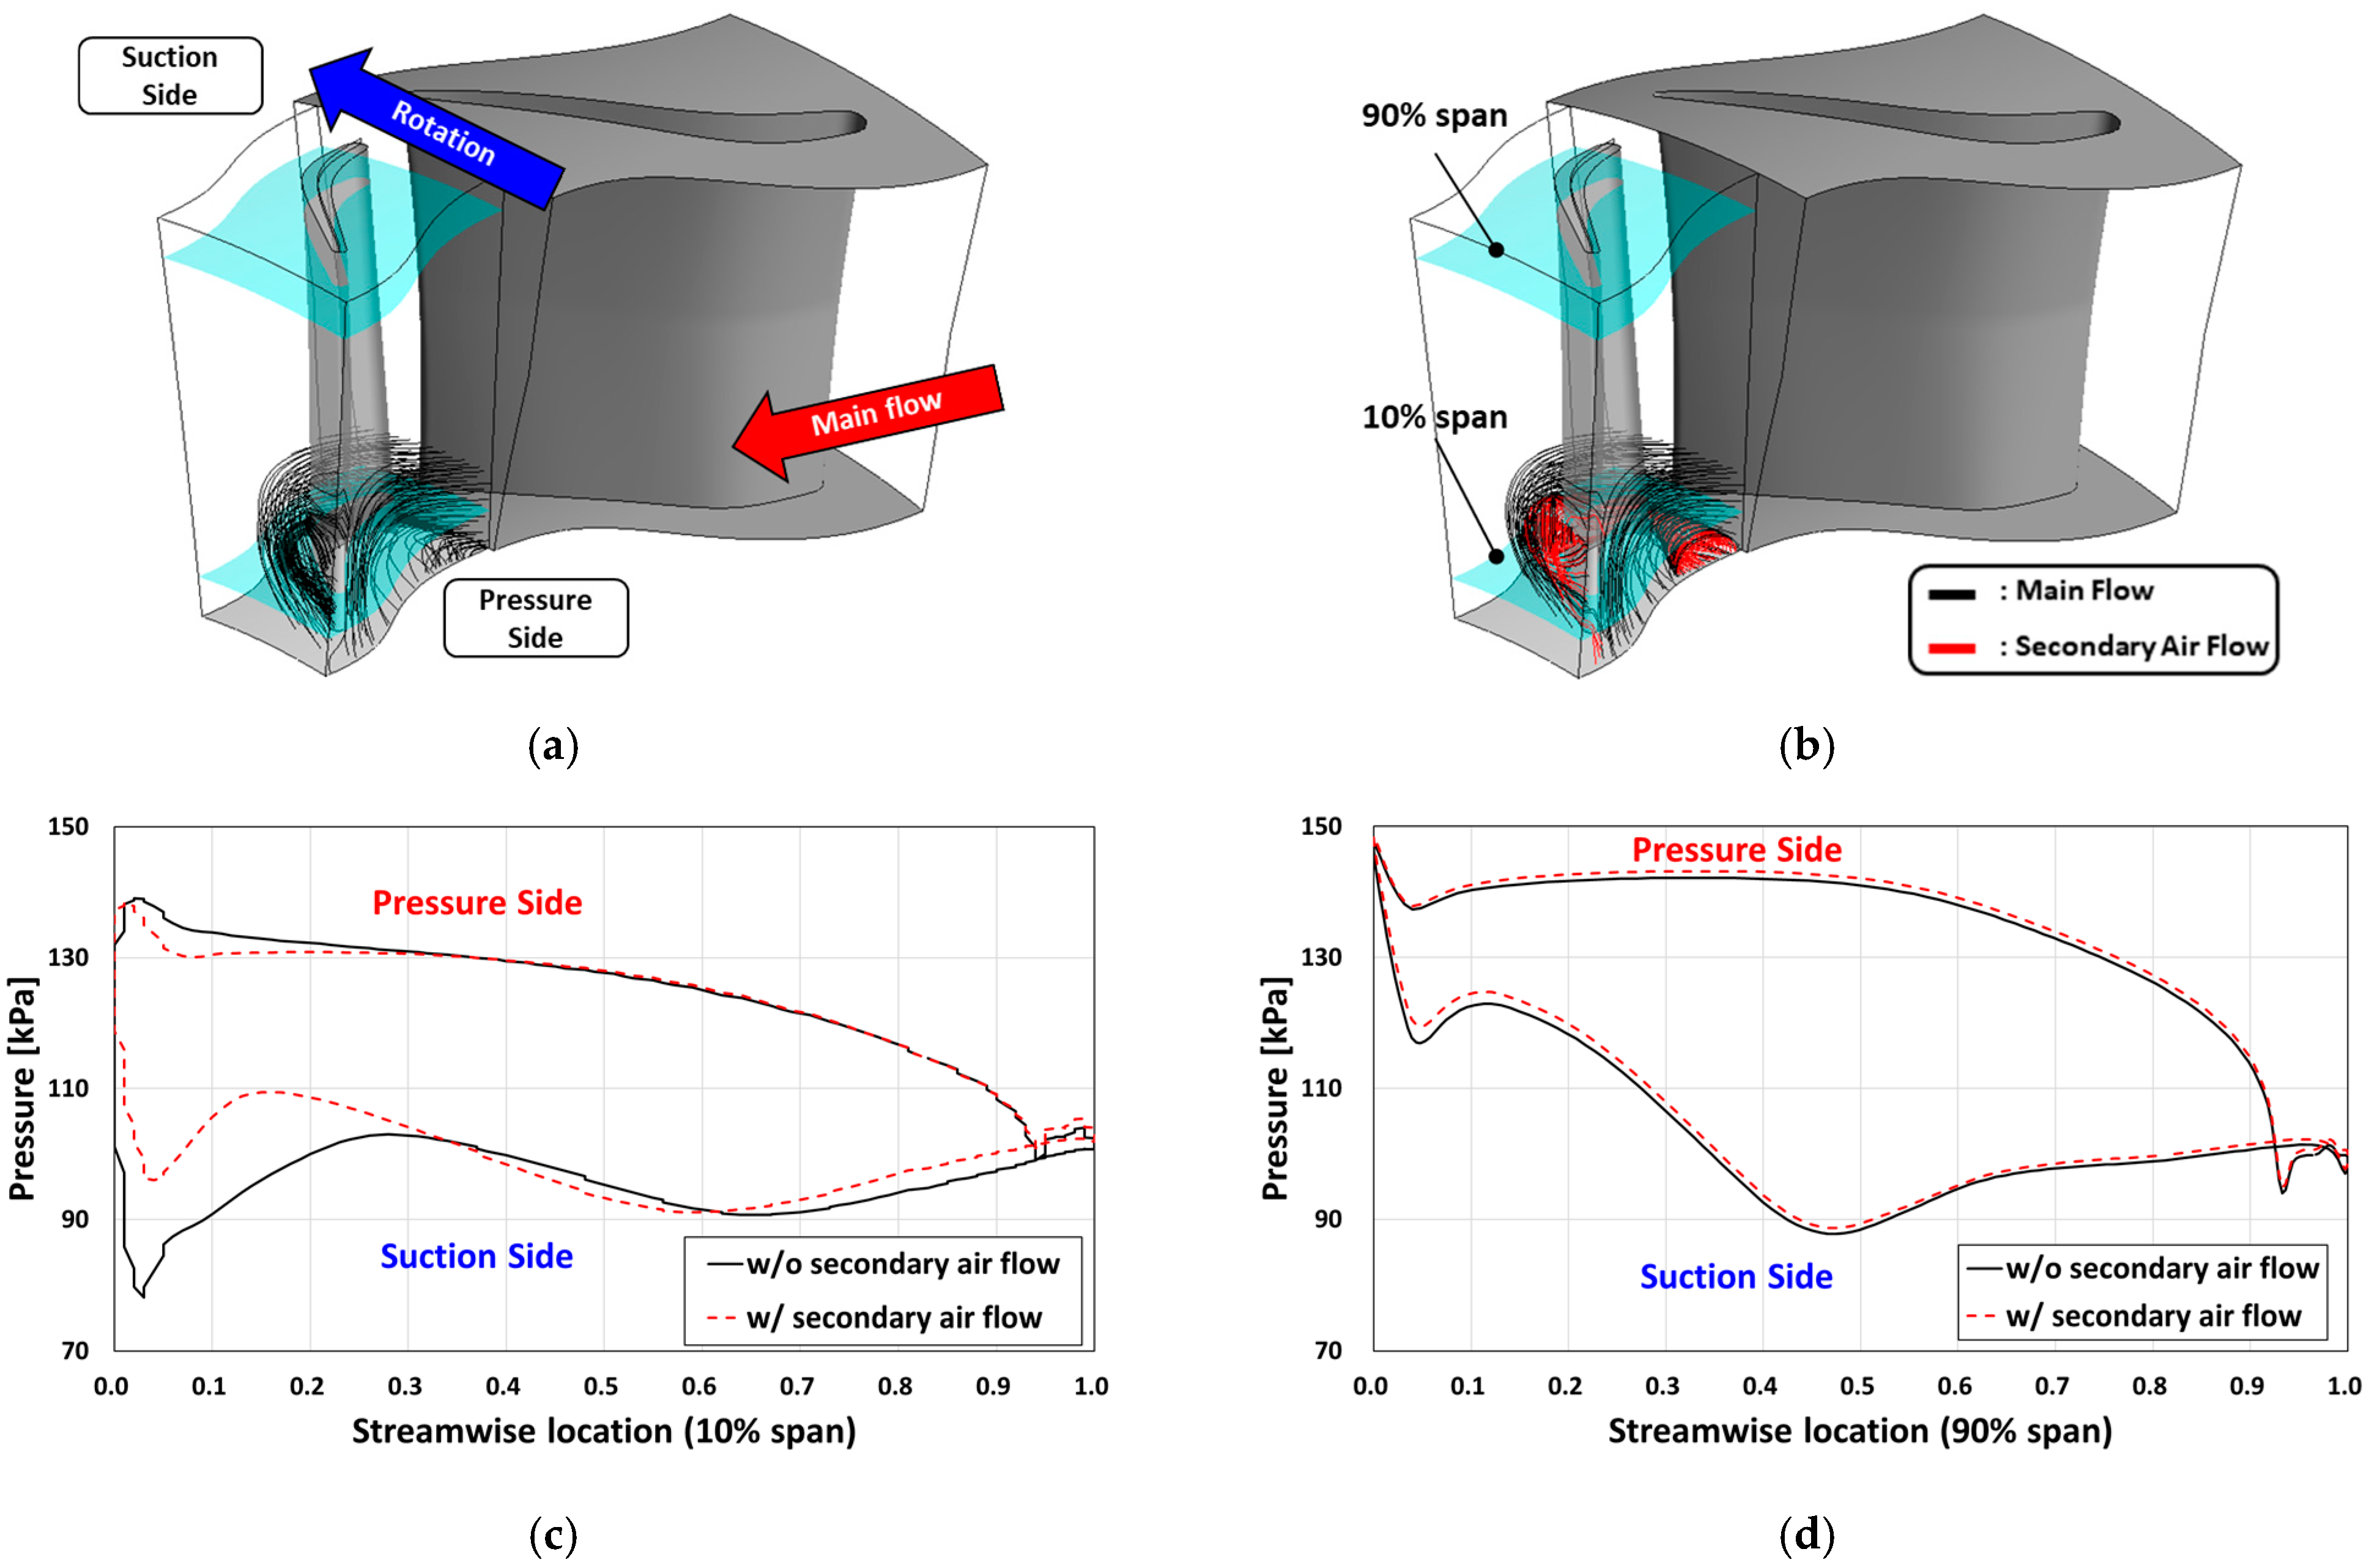
The research by Metodi [25] indicates that leakage of secondary flow air through the axial turbine acts as a loss in the turbine. A comparison of the cases with the secondary flow case and without the secondary flow, under the same conditions, showed that the pressure is elevated on the suction side near the hub upstream region of the turbine blade and the blade loading is decreased, as shown in Figure 15c. The loss, caused by the secondary flow, decreases the torque of the turbine output, necessitating the injection of extra fuel to compensate for the power deficit.
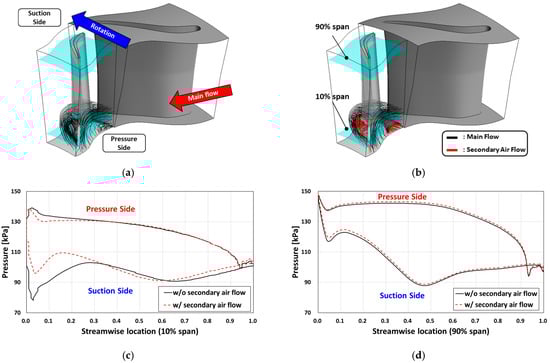
Figure 15.
Streamlines of Turbine Rotor (70,000 RPM) and Static Pressure Distribution According to Secondary Air Flow: (a) w/o Secondary Air Flow; (b) w/ Secondary Air Flow; (c) 10% Span; (d) 90% Span.
4. CFD Validation and Discussion
4.1. Test Facility
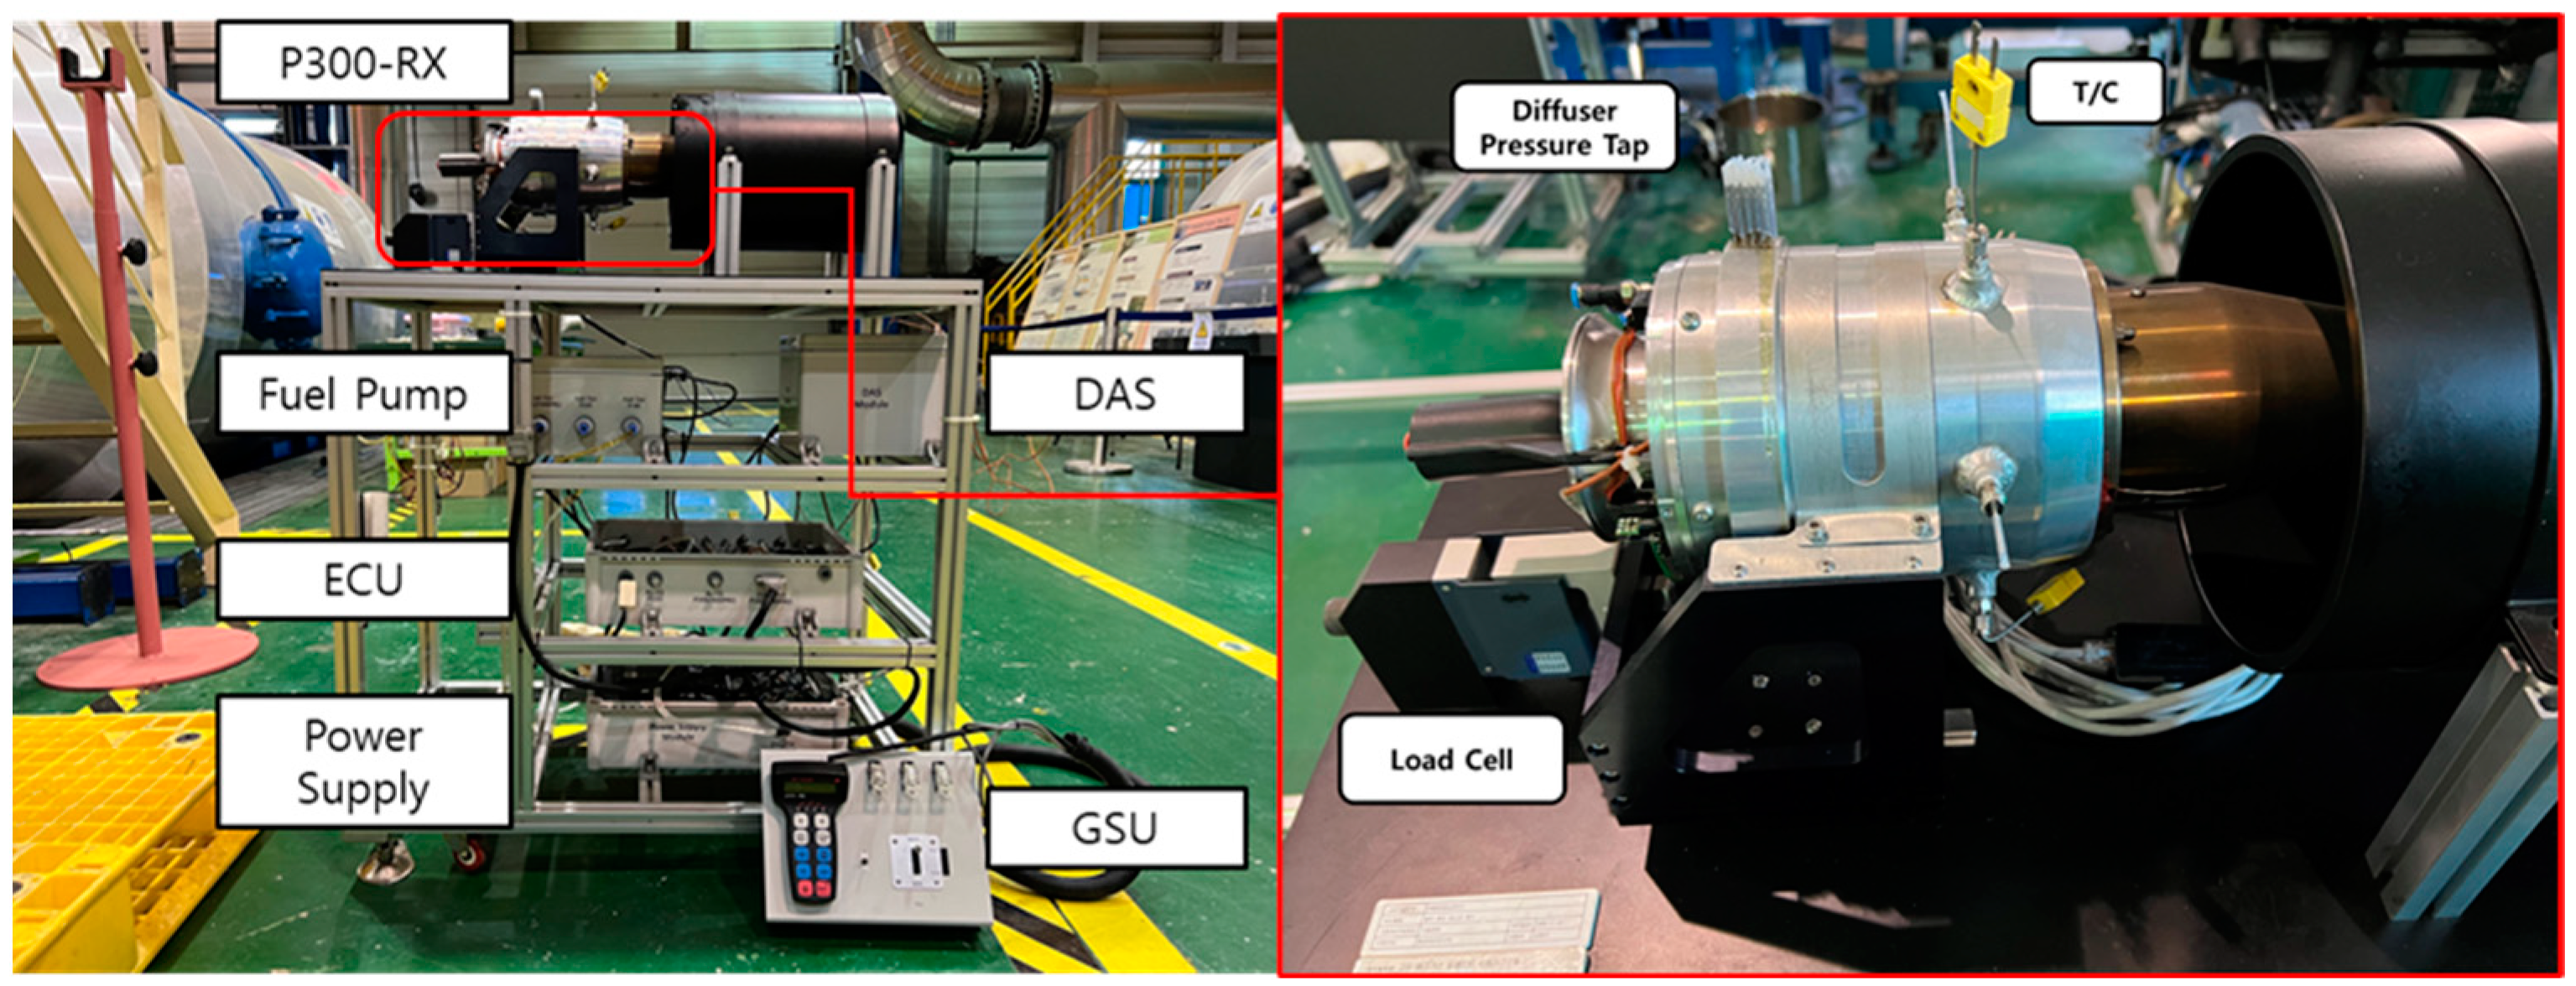
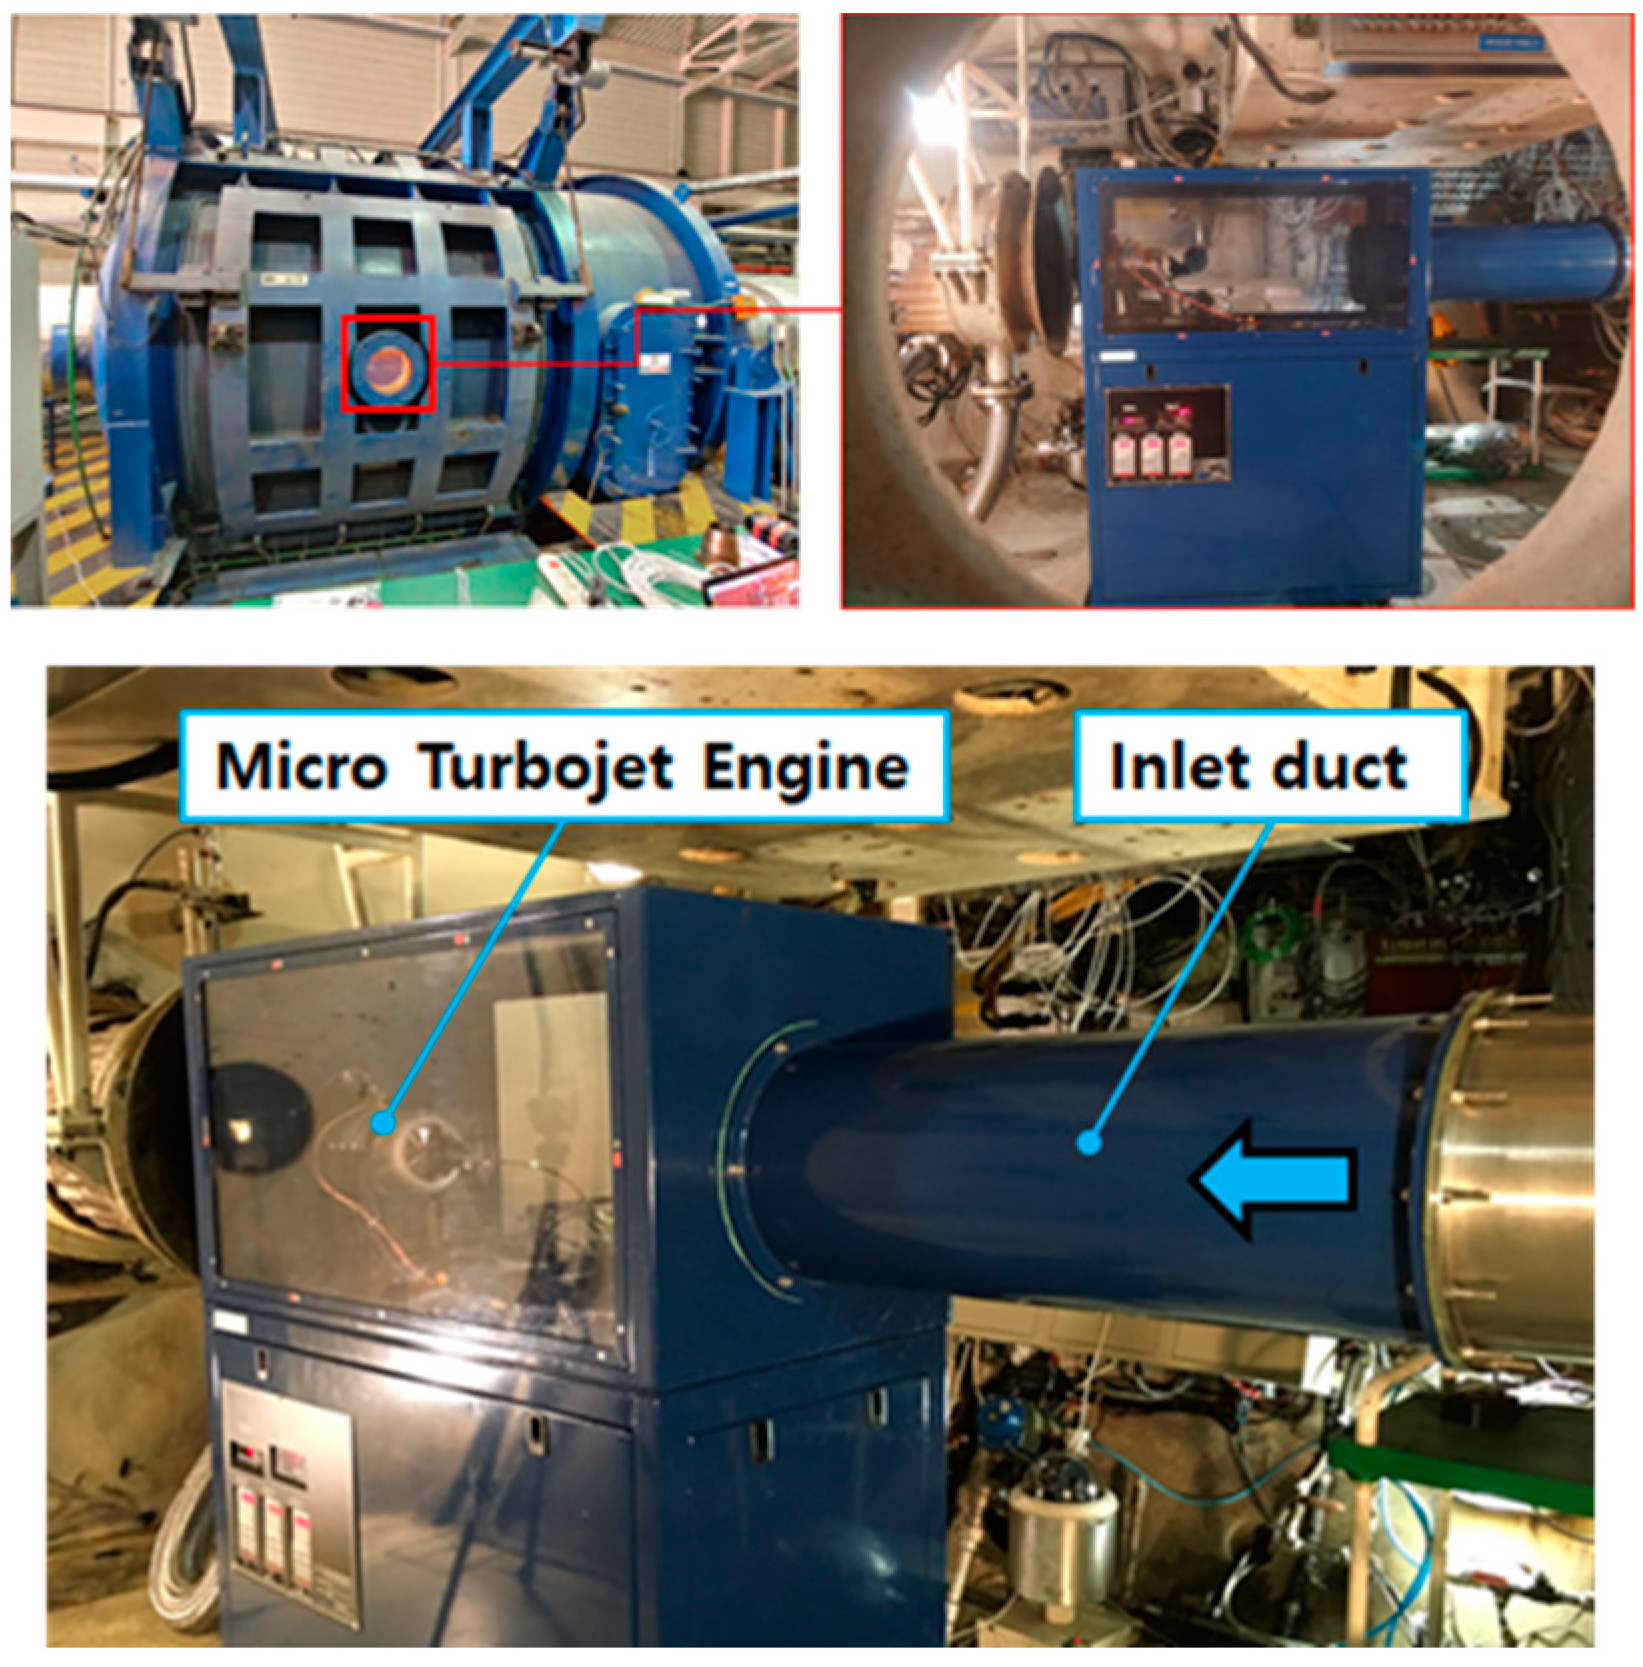
As previously described, the simulation model of this study was validated by comparing the results with experimental results. The engine test was conducted using the test rig shown in Figure 16 for ground conditions, and the Altitude Engine Test Facility of the Korea Aerospace Research Institute was used, as presented in Figure 17. The altitude-simulated conditions are demonstrated in Table 3. Through the tests, a series of data was acquired, including RPM, EGT, fuel pump voltage, thrust, fuel flow rate, air flow rate, and diffuser outlet pressure (pressure ratio). As in Figure 16, diffuser outlet pressure is measured by the pressure taps. So, the test value is static pressure, and the pressure ratio is calculated by the ratio of static pressure from the compressor outlet and total pressure from the compressor inlet.
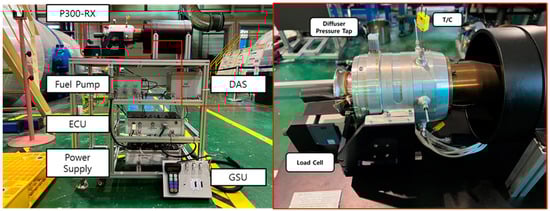
Figure 16.
Micro Gas Turbine Ground Test Rig.

Figure 17.
Altitude Engine Test Facility (AETF) at KARI [26].
To exclude the influence of atmospheric pressure and temperature during the test, the corrected parameters were used for the performance comparison. Corrected RPM, corrected thrust, corrected fuel flow rate, and corrected TSFC were calculated by using Equations (3)–(6) and the dimensionless values of θ and δ, which are the normalized values of atmospheric temperature and pressure, respectively, to standard atmospheric conditions.
4.2. Engine Performances Validation at Sea-Level Conditions
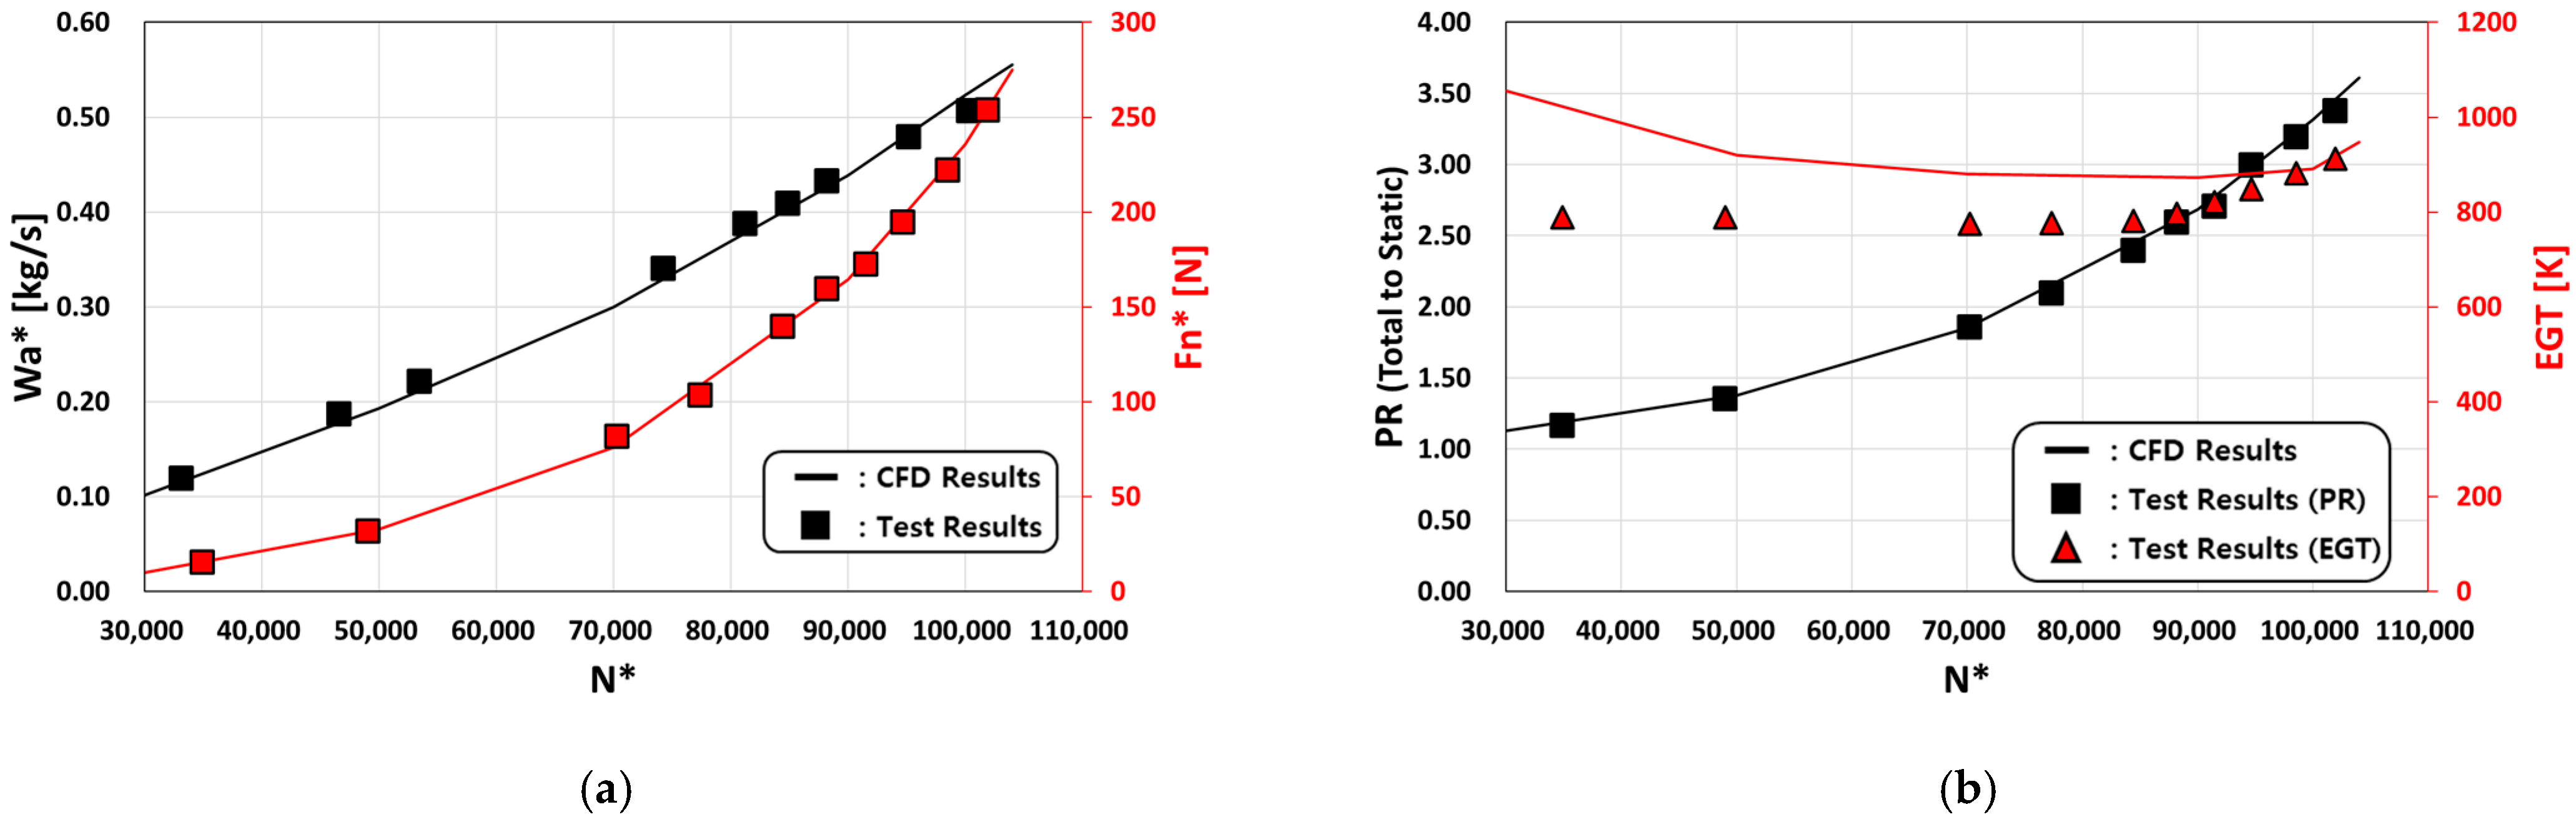
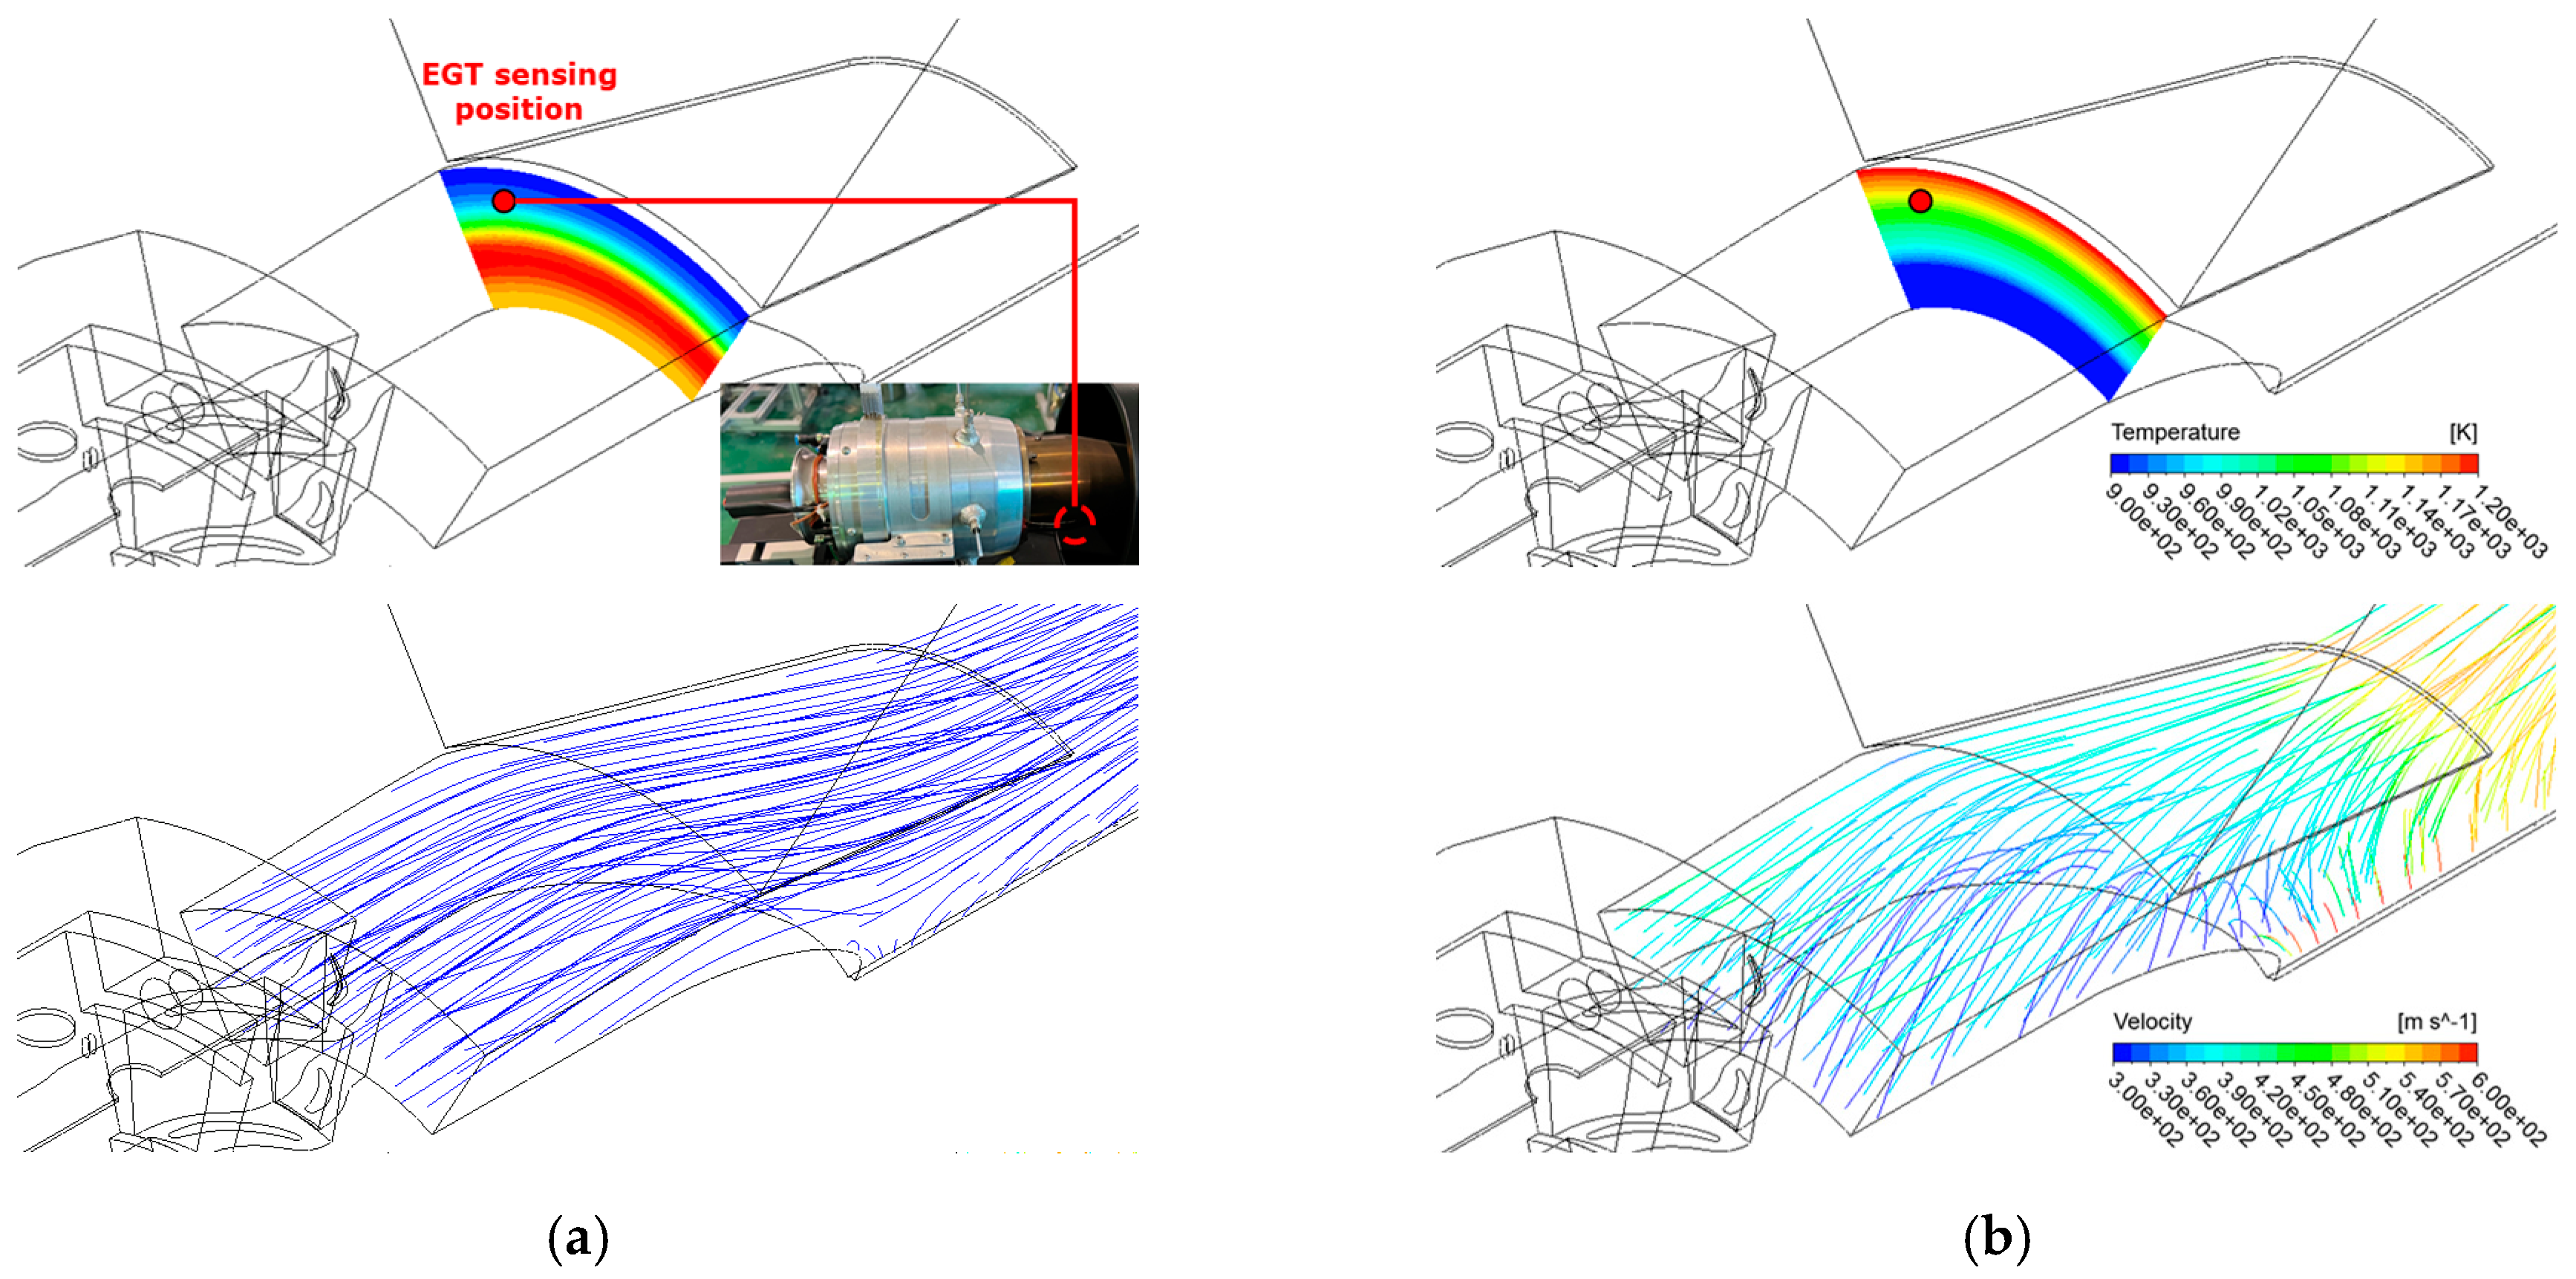
Comparing the CFD results with the test results in sea-level conditions shows that the CFD results predict the engine performance well, with most of the performances having errors within 5%, as shown in Figure 18 and Figure 19. As illustrated in Figure 18b, the error in the EGT value is minimal in the high-RPM region. However, in the low-RPM region below 70,000 RPM, the difference in EGT reaches up to 200 K, which results in a maximum error of 24%. This error is mainly due to the difference in EGT measurement locations. In the experimental test, the temperature at a point near the exhaust nozzle wall is measured by a K-type thermocouple mounted on the engine. On the other hand, when calculating the EGT value of CFD, the average temperature value is used. As illustrated in Figure 20a, the temperature field at CFD revealed a temperature gradient in the radial direction. Because of this, in the case of low RPM (30,000 RPM), there is a significant discrepancy of over 200 K between the temperature value between the sensor location and the average temperature value. So, this contributed to the difference in EGT at low RPM. Conversely, the increased swirl resulted in a higher temperature near the wall in the region of high RPM. Consequently, the discrepancy between the mass flow rate average temperature and the temperature near the wall is reduced.

Figure 18.
Engine Performances Comparison According to Shaft Rotating Speed: (a) Air Flow Rate and Thrust; (b) Pressure Ratio and EGT.
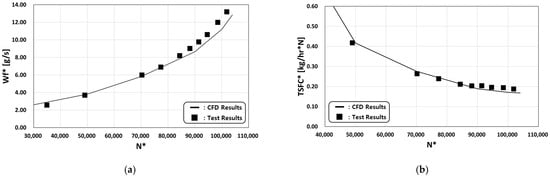
Figure 19.
Engine Performances Comparison According to Shaft Rotating Speed: (a) Fuel Flow Rate; (b) TSFC.
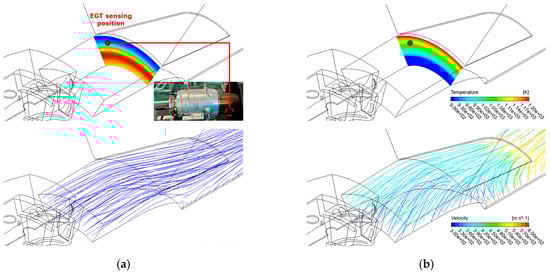
Figure 20.
Temperature Profile and Streamlines around EGT Sensor Location: (a) 30,000 RPM; (b) 104,000 RPM.
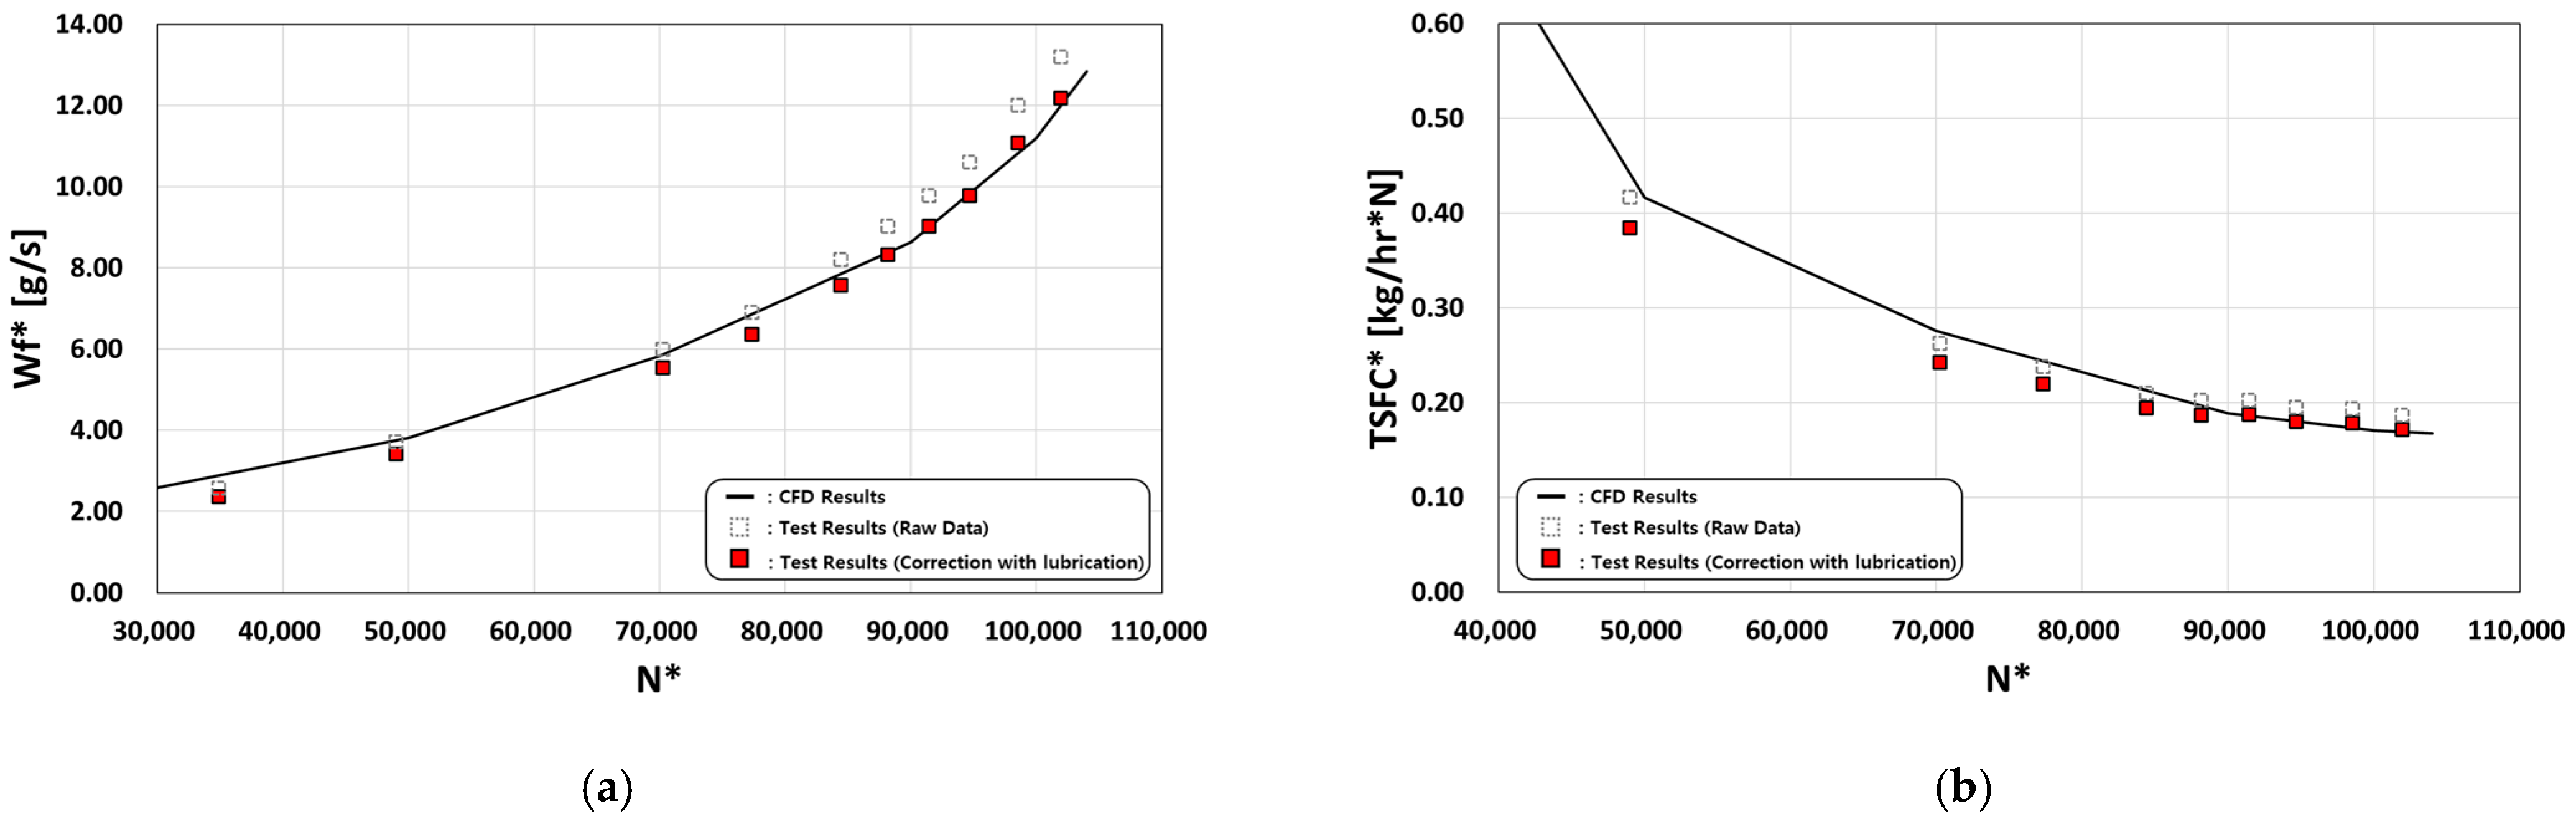
As shown in Figure 19, the fuel flow rate showed an error of up to 7%. Similarly, TSFC, a performance metric related to fuel flow rate, also showed an error of up to 10%. Following an investigation into the source of the fuel flow rate error, it was determined that the error was caused by the lubrication. As shown in Figure 21, one of the fuel lines is used for lubrication purposes; therefore, approximately 92% of the measured fuel flow rate at the test is used for combustion. After correction of the fuel flow rate, the error between CFD and experimental results was reduced after calibrating the test results, as shown in Figure 22. This reduced the error in the fuel flow rate and TSFC from 7% and 10% to 1% and 2.8%, respectively.
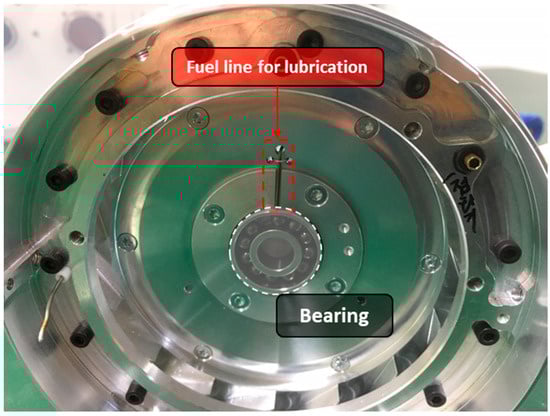
Figure 21.
Fuel Lubrication System.
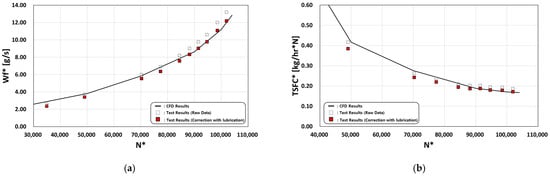
Figure 22.
Engine Performances Comparison Considering the Lubrication Effect According to Shaft Rotating Speed: (a) Fuel Flow Rate; (b) TSFC.
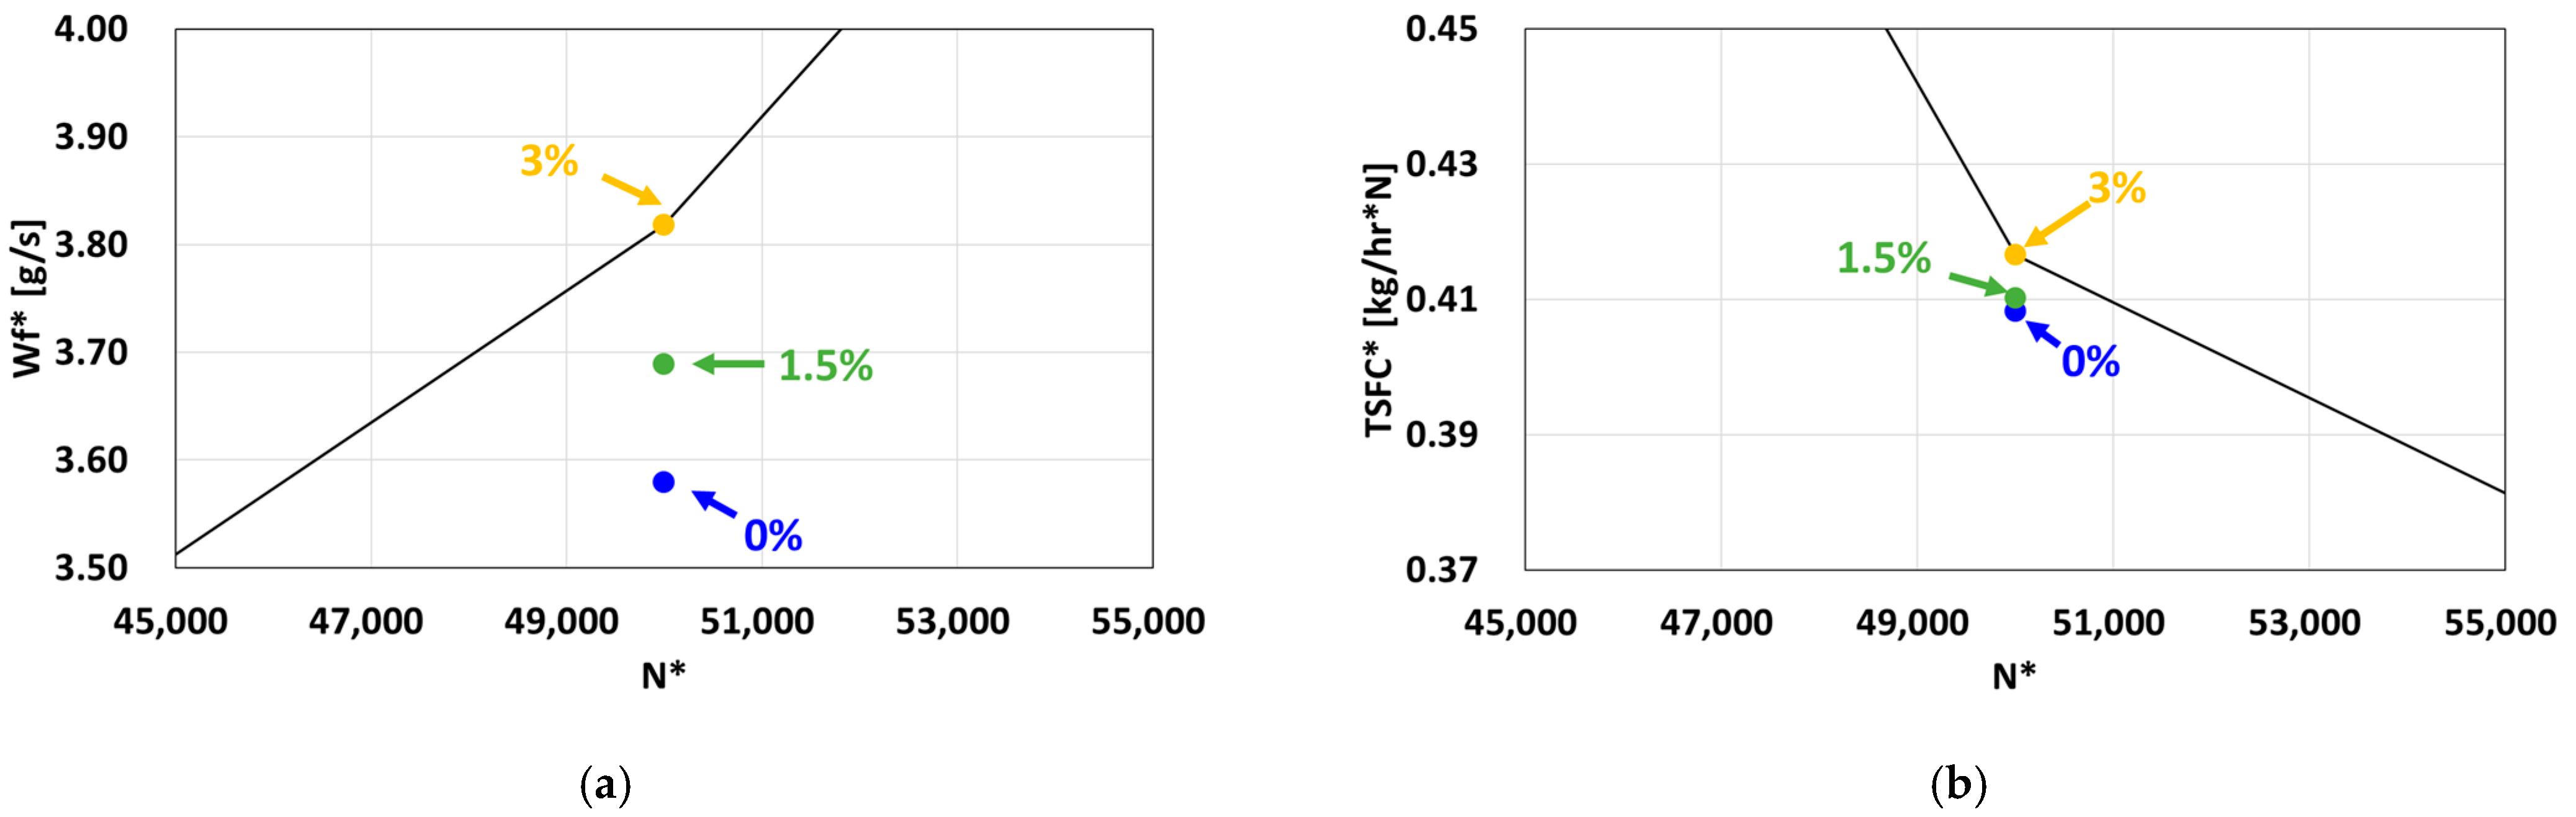
However, contrary to what was described earlier, the error tended to increase in the low-RPM region below 50,000 RPM. To determine the underlying cause of this phenomenon, the analysis varied the bleed air flow rate to 0%, 1.5%, and 3% at 50,000 RPM conditions and compared these. As a result, as the bleed flow rate decreases, the fuel flow rate decreases by approximately 3%, as shown in Figure 23. In the analytical model presented in this paper, the bleed air flow rate is set to be 3% for all the RPM ranges. However, it should be considered that this bleed flow rate changes with RPM due to the differential pressure varying with RPM.
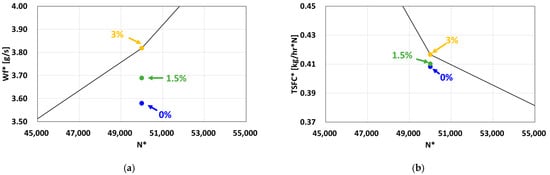
Figure 23.
Engine Performances According to Bleed Mass Flow Rate at 50,000 RPM: (a) Fuel Flow Rate; (b) TSFC.
4.3. Engine Performances Validation at Altitude Conditions
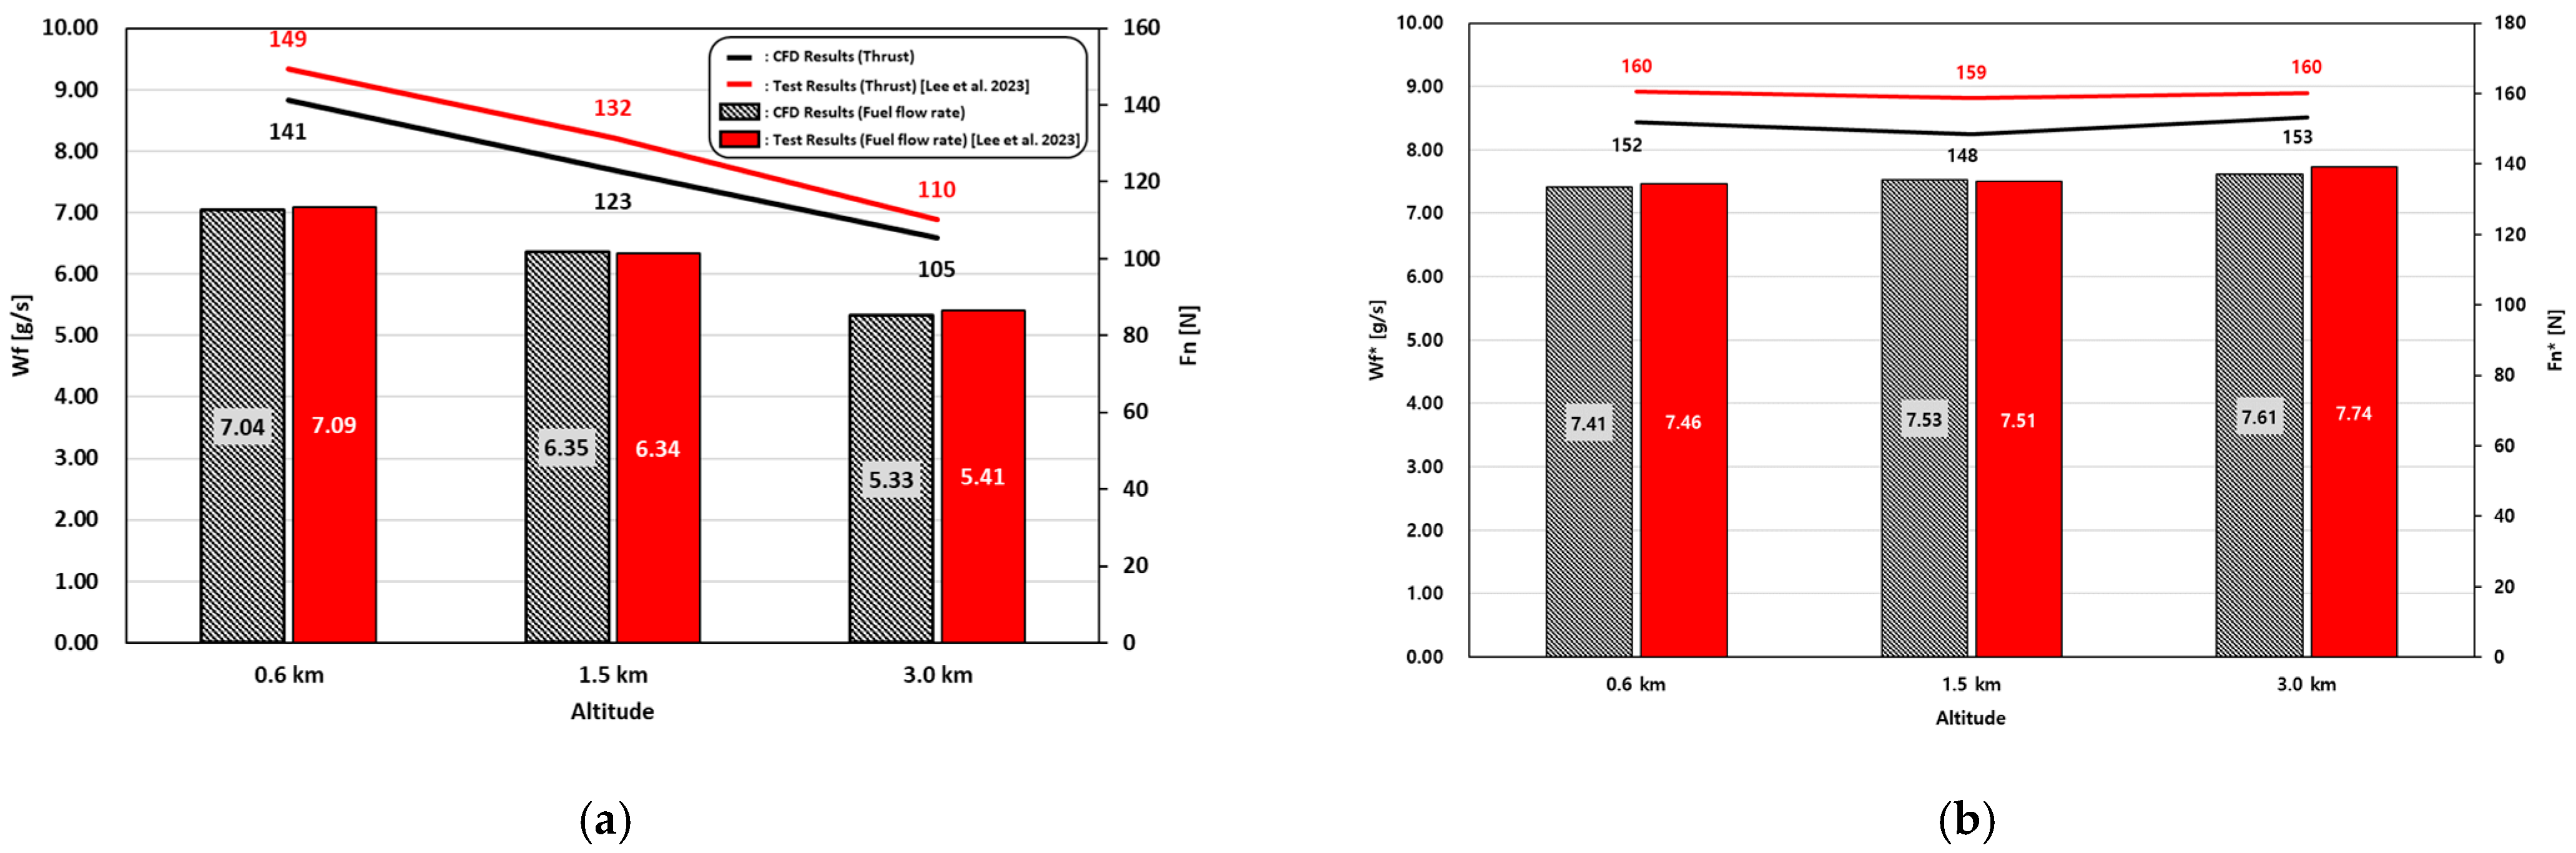
To validate the analytical model at altitude conditions, comparison was conducted with the test results [26]. Since the test simulated only the pressure at altitude conditions, the analysis was also performed with the same conditions as the test, as shown in Table 3. The results at 100,000 RPM were compared with the test data for various altitude conditions. From the comparison, it can be observed that thrust tends to decrease as density decreases with increasing altitude, as demonstrated in Figure 24a. The comparison of calibrated values indicates an error of less than 5%, which is comparable to the ground conditions. This result confirms that the integrated analytical model implemented in this study is capable of accurately predicting the performance of the actual engine.
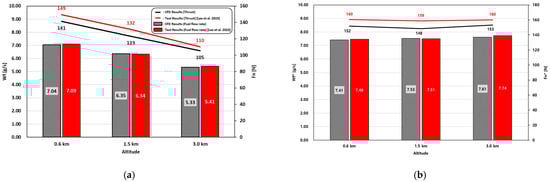
Figure 24.
Fuel Flow Rate and Thrust at 100,000 RPM According to Altitude Conditions: (a) Raw Performances; (b) Corrected Performances [21].
5. Conclusions
This study presents a 3D integrated analysis model of a micro turbojet engine that is more realistic than the previous study by reflecting secondary flow and combustion efficiency. To validate the model, compare engine performance for ground- and altitude-simulated conditions for various RPM ranges. The results are summarized as follows:
- Due to the high rotational speed and small size of micro gas turbines, the interface setting between the impeller and diffuser is important, and a mixing plane interface with secondary air flow is a suitable option.
- Based on previous studies, a combustion efficiency of 90% was reflected, and in the case of secondary air flow, a 3% air flow rate was designated for bleeding in and out at the impeller and turbine rotor, respectively.
- Compared with test data, most engine performances, such as air flow rate, pressure ratio, and thrust, are within 5% of the test values, indicating that the engine performance is predicted well.
- Among the engine performances, EGT exhibits a relatively large error of over 10%. However, this discrepancy is exclusive to low-RPM regions and attributed to the differences between test values obtained at a single point and CFD results that employ an average temperature at the plane. So, there was no issue with the EGT.
- Due to the fuel-lubricated system, a test result of the fuel flow rate includes the combustion fuel flow rate and the lubricated flow rate. In contrast, the analysis model excluded the lubricated flow rate. Therefore, the lubrication system exerts an influence on the fuel flow rate and TSFC. Upon correcting the flow rate utilized for lubrication, it was confirmed that the error was reduced.
- The analysis was performed using the same 3% bleed mass flow rate condition for all cases. The results demonstrated that the bleed flow rate should be adjusted according to RPM and that the fuel flow rate tended to increase as the secondary air flow increased.
In conclusion, an integrated engine analysis model was successfully implemented in this study, verifying that it predicts engine performance within a 5% error. Therefore, it is expected that the integrated analysis model can compensate for the shortcomings of performance prediction using the existing thermodynamic model and the disadvantages of individual component analysis. It is also expected that the performance of the engine can be predicted using only the overall geometry of the micro gas turbine engine components without the analysis and testing of individual components. Furthermore, integrating the combustion model and implementing the secondary air flow into the analysis model thereby enabled a more realistic estimation of engine performance. As a follow-up study, it is thought that a more realistic analysis model can be developed by incorporating the following: lubrication system, the domain of the secondary air flow path, the percentage of bleed air along the RPM, and a CHT analysis. And the findings of this study can be utilized in many micro gas turbine-related studies, including the optimization of micro-gas turbine component geometry and the conversion to a late combustor or turbofan engine.
Author Contributions
Conceptualization, D.L. and D.-H.R.; methodology, D.L., H.C. and D.-H.R.; software, D.L, H.C. and Y.S.K.; validation, D.L., Y.S.K. and D.-H.R.; formal analysis, D.L. and D.-H.R.; investigation, D.L. and Y.S.K.; resources, D.L. and D.-H.R.; data curation, D.L.; writing—original draft preparation, D.L.; writing—review and editing, Y.S.K. and D.-H.R.; visualization, D.L.; supervision, Y.S.K. and D.-H.R.; project administration, Y.S.K.; funding acquisition, Y.S.K. All authors have read and agreed to the published version of the manuscript.
Funding
This research was funded by the Korea Research Institute for Defense Technology Planning and Advancement (KRIT)—grant funded by the Defense Acquisition Program Administration (DAPA) (KRIT-CT-22-053).
Data Availability Statement
The original contributions presented in the study are included in the article, further inquiries can be directed to the corresponding author.
Conflicts of Interest
The authors declare no conflict of interest.
Nomenclature
| N | Shaft Rotating Speed [RPM] |
| TSFC | Thrust-Specific Fuel Consumption [kg/h-N] |
| Fn | Thrust [N] |
| EGT | Exhaust Gas Temperature [K] |
| PR | Compressor Pressure Ratio |
| Wf | Fuel Flow Rate [g/s] |
| Wa | Air Flow Rate [kg/s] |
| RF | Relaxation Factor |
| Greek symbol | |
| τ | Torque [Nm] |
| Δ | Normalized Pressure |
| Θ | Normalized Temperature |
| Subscripts | |
| Comp | Compressor |
| Turb | Turbine |
| SLS | Sea Level Standard |
| * | Corrected Value |
References
- Leylek, Z. An investigation into performance modeling of a small gas turbine engine. In Proceedings of the ASME Turbo Expo, San Antonio, TX, USA, 3–7 June 2013. GT2013-94405. [Google Scholar]
- Rahman, N.U.; Whldborne, J.F. A numerical investigation into the effect of engine bleed on performance of a single-spool turbojet engine. J. Aerosp. Eng. 2008, 222, 939–949. [Google Scholar] [CrossRef]
- Kim, J.H. Development a Performance Analysis Program for Gas Turbine and Analysis of the Operating Characteristics of a 200kW Class Micro Gas Turbine. Master’s Thesis, Inha University, Incheon, Republic of Korea, 2014, unpublished. [Google Scholar]
- de Villiers, L.C.B. Design of a Centrifugal Compressor for Application in Micro Gas Turbines. Master’s Thesis, Stellenbosch University, Stellenbosch, South Africa, 2014, unpublished. [Google Scholar]
- van der Merwe, B.B. Design of a Centrifugal Compressor Impeller for Micro Gas Turbine Application. Master’s Thesis, Stellenbosch University, Stellenbosch, South Africa, 2012, unpublished. [Google Scholar]
- Kang, Y.S.; Huh, J.S. Aerodynamic Performance Characteristics of MGT Compressor. KSFM J. Fluid Mach. 2021, 24, 47–55. [Google Scholar] [CrossRef]
- Kang, Y.S.; Jun, S.; Rhee, D.H. Stage Matching Improvement between Impeller and Diffuser in a Centrifugal Compressor by Applying Flow Cut to the Impeller. KSFM J. Fluid Mach. 2019, 22, 62–69. [Google Scholar] [CrossRef]
- Holobeny, D.; Bohan, B.T.; Polanka, M.D. Computational and Experimental Analysis of a Compact Combustor Integrated Into a JetCat P90 RXi. J. Eng. Gas Turbines Power 2021, 143, 091023. [Google Scholar] [CrossRef]
- Holobeny, D.; Bohan, B.T.; Polanka, M.D. Analysis of a Compact Combustor for Use in a JetCat P90 RXi. In Proceedings of the AIAA SciTech 2020 Forum, Orlando, FL, USA, 6–10 January 2020. Paper No. AIAA 2020-0625. [Google Scholar]
- Kim, J.H.; Kim, H.M.; Park, P.M.; Rhee, D.H. Performance Test of Metal 3D Printed Micro Gas Turbine Engine Combustor. KSPE J. Korean Soc. Propuls. Eng. 2019, 23, 51–58. [Google Scholar]
- Park, H.S. Numerical Study of Combustion Performance of Micro Turbo-Jet Engine. Master’s Thesis, Inha University, Incheon, Republic of Korea, 2008, unpublished. [Google Scholar]
- Lee, H.J.; An, C.H.; Myoung, R.S.; Choi, S.M.; Kim, W.C. Computational Investigation of Nozzle Flowfield in a Micro Turbojet Engine and Its Scaling Characteristics. J. Comput. Fluids Eng. 2017, 22, 43–50. [Google Scholar] [CrossRef]
- Tiralap, A.; Tan, C.S. Aero-Thermal-Mechanical Interactions In Ultra High-Speed Micro Gas Turbines Part 1: Conjugate Heat Transfer Computational Fluid Dynamics and Finite Element Model. In Proceedings of the ASME Turbo Expo 2022, Rotterdam, The Netherlands, 13–17 June 2022. Paper No. GT2022-82739. [Google Scholar]
- Kotze, J.C. Complete Engine CFD of a Micro Gas Turbine by Modelling Combustion as a Heat Source. Master’s Thesis, University of PRETORIA, Pretoria, South Africa, 2018, unpublished. [Google Scholar]
- Pérez Arroyo, C.; Dombard, J.; Duchaine, F.; Gicquel, L.; Martin, B.; Odier, N.; Staffelbach, G. Towards the Large- Eddy Simulation of a full engine: Integration of a 360 azimuthal degrees fan, compressor and combustion chamber. Part I: Methodology and initialization. J. Glob. Power Propuls. Soc. 2021, 1–16. [Google Scholar] [CrossRef] [PubMed]
- Perez Arroyo, C.; Dombard, J.; Duchaine, F.; Gicquel, L.; Martin, B.; Odier, N.; Staffelbach, G. Towards the Large- Eddy Simulation of a full engine: Integration of a 360 azimuthal degrees fan, compressor and combustion chamber. Part II: Comparison against stand-alone simulations. J. Glob. Power Propuls. Soc. 2021, 1–16. [Google Scholar] [CrossRef]
- Badami, M.; Nuccio, P.; Signoretto, A. Experimental and numerical analysis of a small-scale turbojet engine. Energy Convers. Manag. 2013, 76, 225–233. [Google Scholar] [CrossRef]
- Briones, A.M.; Caswell, A.W.; Rankin, B.A. Fully Coupled Turbojet Engine Computational Fluid Dynamics and Cycle Analysis along the Equilibrium Running Line. J. Eng. Gas Turbines Power 2021, 143, 061019. [Google Scholar] [CrossRef]
- Briones, A.M.; Rankin, B.A. Large Eddy Simulation with Sliding Mesh Method of a Small-Scale Turbojet Engine. In Proceedings of the ASME Turbo Expo 2024, London, UK, 24–28 June 2024. Paper No. GT2024-121649. [Google Scholar]
- Chung, H.Y.; Rhee, D.H.; Kang, Y.S. Simulation of Aero-propulsion Micro Gas Turbine Engine Using CFD. KSFM J. Fluid Mach. 2021, 24, 5–12. [Google Scholar]
- Lee, D.E.; Chung, H.Y.; Kang, Y.S.; Rhee, D.H. A Study on the Implementation of a Micro Turbojet Integrated Analysis Model for Predicting Engine Performances for Various Operating Conditions. KSFM J. Fluid Mach. 2023, 26, 5–15. [Google Scholar] [CrossRef]
- Available online: https://www.jetcat.de/en/products/produkte/jetcat/kategorien/hobby (accessed on 1 August 2024).
- Kim, S.J.; Choi, S.M.; Rhee, D.H. Off-design Performance Analysis based on Experimental Data of a Micro Gas Turbine Engine. KSPE J. Korean Soc. Propuls. Eng. 2018, 22, 64–71. [Google Scholar]
- Sebelev, A.A.; Tikhonov, A.S.; Aleksenskiy, V.A.; Shengals, A.A.; Klyavin, O.I. Aerodynamics analysis of the small-scaled centrifugal compressor for micro-turbojet engine applications. Int. Conf. Aviat. Mot. 2020, 1891, 012017. [Google Scholar] [CrossRef]
- Zlatinov, M.B. Secondary Air Interaction with Main Flow in Axial Turbines. Master’s Thesis, Massachusetts Institute of Technology, Cambridge, MA, USA, 2011, unpublished. [Google Scholar]
- Rhee, D.H.; Lee, K.J.; Kang, Y.S.; Chung, H.Y. Performance Test and Evaluation of Micro Turbojet Engine at Sea Level and Altitude-Simulating Inlet Pressure Conditions. KSFM J. Fluid Mach. 2020, 23, 34–40. [Google Scholar] [CrossRef]


Disclaimer/Publisher’s Note: The statements, opinions and data contained in all publications are solely those of the individual author(s) and contributor(s) and not of MDPI and/or the editor(s). MDPI and/or the editor(s) disclaim responsibility for any injury to people or property resulting from any ideas, methods, instructions or products referred to in the content. |
© 2024 by the authors. Licensee MDPI, Basel, Switzerland. This article is an open access article distributed under the terms and conditions of the Creative Commons Attribution (CC BY) license (https://creativecommons.org/licenses/by/4.0/).