Abstract
We aimed to (1) compare external training loads obtained in futsal players during pre-season and in-season training weeks to explore how these loads are periodized by the coaching staff; and (2) compare the external training loads using the match day minus approach during the pre-season and in-season periods to determine how the within-microcycle training load varies between these periods. A total of 432 recordings were obtained of twelve national-level male amateur players using IPS devices. These data were collected over four consecutive microcycles from the beginning to the end of the pre-season, as well as during four additional consecutive microcycles at the start of the in-season. The external load variables evaluated were: total distance covered (TD; m), relative distance covered (Drel; m/min), high-speed running (HSR; m > 18.8 km/h), sprint distance (SPR; m > 25.2 km/h), number of intense accelerations (ACC; >2.5 m/s2) and decelerations (DEC; >−2.5 m/s2). Results indicated significant week-by-week variation (p < 0.05) in all external load variables during the pre-season. During the in-season, significant variations (p < 0.05) were observed only in Drel, HSR, and ACC. In both phases, all variables were higher (p < 0.05) two days before the match. In conclusion, it is important to consistently quantify the external loads of futsal players to ensure appropriate variation in loading and tapering within the microcycle, as well as during the pre-season and in-season periods.
1. Introduction
Periodization of training load is a strategy that offers a framework for planned and systematic variation in training parameters, aimed at optimizing adaptations specific to a particular sport [1]. Considering that the majority of periodization theorists propose models based on personal beliefs and experience, and rely on limited scientific evidence, they fail to account for individual biological responses to training stimuli [2] and to offer practical information to tailor the content of each training session [3], especially in team sports. Currently, there is a considerable amount of scientific evidence supporting the appropriateness of quantifying external and internal training loads, along with their respective physiological and psychological responses, to continuously adjust training content [4]. This approach aims to avoid overreaching and optimize adaptation [5]. Within this framework, quantifying training and match loads is essential for understanding the organization of training and its impact on adaptive responses. This is particularly crucial in sports with stochastic and unpredictable movement patterns, such as team sports like futsal [6].
In this regard, the locomotor demands of the futsal match have been extensively described [7]. Players typically cover a total distance of 3728 ± 1152 m during a match [8], with distances of 136.6 and 129.2 m/min in the 1st and 2nd halves, respectively, when solely considering the in-play time [9]. Additionally, matches can include more than 25 sprints [10] 233.5 ± 125.9 m at speeds > 18 km/h [8]. Furthermore, heart rate is typically maintained at ≥85% maximal heart rate and ~80% maximum oxygen uptake [11,12]. This demand generates a high degree of post-match central fatigue, impairing maximal isometric force [13]. Such a brief description of futsal highlights its high-intensity nature, characterized by sprints, accelerations, decelerations, and changes of direction, among other actions [14]. Of note, the sport heavily taxes both the aerobic and anaerobic systems [15].
Despite the knowledge of match load, less is known about current practices concerning typical training loads during the pre-season and in-season. The initial studies that described the training microcycle used the session rating of perceived exertion (sRPE) to quantify the internal training load in futsal [16,17,18]. These studies revealed that sRPE accumulated during the pre-season is greater than that accumulated during the in-season [17]. This is consistent with some perspectives on periodization in team sports, which suggest that pre-seasons should be used to achieve multiple training goals by incorporating various training strategies and loads. In contrast, the frequent official matches during the competitive season limit the variation in training loads, focusing instead on maintaining physical and technical abilities [19]. In addition, reducing training loads as the competition approaches facilitates the necessary taper to optimize performance [20]. However, as far as we know, no studies have used objective training data (e.g., distance covered) to compare training weeks within pre-season and in-season phases to verify how they are planned and whether they conform to previously published recommendations [19].
Typically, the quantification of the training microcycle using external load data has been conducted in relation to the number of days before the competitive match (i.e., match day (MD) minus) [6]. In this regard, there is a progressive reduction in external training load (e.g., total distance covered per session) leading up to the match day, known as the tapering effect [21]. Evidence of this, as reported by Illa et al. [6], indicates that high-demand scenarios significantly decreased in the sessions preceding the match compared to the rest of the microcycle, with the session 2 days before the match being the most similar to the match itself. While it is accepted that MD-1 typically shows the lowest load during a typical competitive in-season microcycle, less is known about the tapering practices prior to matches during the pre-season. This is because, during the pre-season, players are focused on rebuilding fitness parameters and cannot afford too many rest periods within a training cycle [22]. On the other hand, although the quantification of the training microcycle is well-documented in some sports, such as soccer [21], this information is less available for indoor sports. This is likely because, in indoor sports, Global Positioning Systems (GPS) cannot be used to provide accurate estimates of distances covered, as the gymnasium roof obstructs the signals. Therefore, it appears that the quantification of external training loads during microcycles and prior to match days is lacking in court team sports, both in-season and pre-season. Ultra-wide band (UWB)-based systems represent the most appropriate alternatives, yet they are still rarely utilized [23]. UWB should be more widely employed in team sports mainly due to its cost-effectiveness and ease of use [24]. This technology utilizes small, lightweight tags and requires fewer antennas compared to other systems [25].
Therefore, the aims of this study were: (1) to compare external training loads in futsal players during pre-season and in-season training weeks to explore how these loads are periodized by the coaching staff in each training period; and (2) to compare external training loads using the MD minus approach during the pre-season and in-season periods to examine how the within-microcycle training load varies between these periods.
2. Materials and Methods
2.1. Participants
Twelve national-level male semi-professional outfield futsal players (i.e., Spanish second division team; age, 25.9 ± 5.8 years; height, 175.3 ± 5.9 cm; body mass, 67.3 ± 8.1 kg) with 11.7 ± 2.1 years of training and competition experience and classified as Tier-3 (highly trained/national level) [26] were recruited for the study. Players regularly completed four 100–120-minute training sessions per week, along with an official match on weekends (Table 1). They were required to complete 20 training sessions (5 per microcycle) during the pre-season and 16 training sessions (4 per microcycle) during the in-season period. To be included in the study, players were required to complete all the training sessions within the analyzed microcycles during both the pre-season and in-season periods and participate in all games scheduled during these periods. Goalkeepers were excluded from the study due to the distinct nature of their activity. In total, 432 recordings were obtained, comprising 240 pre-season training sessions and 192 in-season training sessions. Data were collected from 4 wings, 4 defenders, and 4 pivots. Participants were fully informed about the aims of the study, the procedures involved, and the potential risks and benefits of their participation. Subsequently, volunteers signed an informed consent form. The study was conducted following the Declaration of Helsinki.

Table 1.
Typical training week in each period.
2.2. Measurements
In the first pre-season session, height (Seca Leicester Stadiometer®, Seca Ltd., Birmingham, UK) and body mass (Tanita BC-418®, Tanita Corp., Tokyo, Japan) were measured. External load measurements were performed using 12 Indoor Positioning System (IPS) units (Polar Team Pro v.2.0., Polar®, Kempele, Finland), which featured a sampling frequency of 10 Hz and a 200-Hz triaxial accelerometer. The sensors were placed in a specially designed pouch embedded in the players’ chest straps. These sensors utilize multiple adaptive data sources and filtering algorithms to calculate player acceleration, speed, and distance. Indoors, all movement data are derived from the information provided by the Inertial Measurement Unit, which includes an accelerometer, gyroscope, and magnetometer sensor [27]. Each unit was activated 15 minutes before the start of the data collection period, with marks recorded at the beginning and end of each measurement session. To avoid inter-unit error, each player used the same device throughout the study period. The external load variables measured were (i) total distance covered (TD; m), (ii) relative distance covered (Drel; m/min), (iii) high-speed running (HSR; m > 18.1 km/h), iv) sprint distance (SPR; m > 25.1 km/h) [11], and v) number of intense accelerations (ACC; >2.5 m/s2), and decelerations (DEC; >−2.5 m/s2) [21]. The collected data were extracted using the manufacturer’s supplied software (Polar Team Pro v.2.0., Polar®, Kempele, Finland). The validity and reliability of the system had been established previously [28].
2.3. Procedures
Data were collected over 4 consecutive microcycles during the pre-season (i.e., August and September) and an additional 4 consecutive microcycles at the start of the in-season (i.e., October and November) 2020–2021. The first pre-season training microcycle was not monitored because the players only completed 5 sessions of general physical conditioning (i.e., athletic exercises) without any court-based training. Each of the 4 pre-season microcycles analyzed (PS-M1, PS-M2, PS-M3, and PS-M4) consisted of four training sessions and a friendly match on the weekend (i.e., 4 friendly matches), with all players participating. In contrast, the in-season microcycles analyzed (IS-M1, IS-M2, IS-M3, and IS-M4) included 4 training sessions and an official match on the weekend (i.e., 4 official matches). During these in-season microcycles, 8 outfield players participated in the official matches, while 4 players were not selected and instead performed a compensatory training session on match day. Only 1 player in the sample experienced repeated non-selection across the four analyzed matches. Figure 1 illustrates the structure of each training period studied, including the total session time and microcycle duration. In both training periods, the microcycles were adjusted according to the players’ schedules, physical recovery status, and conditioning requirements [29]. The training sessions were categorized according to previously suggested methods, considering their chronological order before competition [30]. During the pre-season, all training sessions (i.e., match day plus 1 (MD+1), Monday; match day minus 3 (MD-3), Tuesday; match day minus 2 (MD-2), Thursday; match day minus 1 (MD-1), Friday) included a warm-up (with a general and/or specific focus) and workouts aiming at enhancing physical condition and technical-tactical skills. These sessions were designed to develop the game model that the coach implemented. So, MD+1 involved neuromuscular training with plyometric exercises and small-sided games with numerical superiority (i.e., 4 vs. 4 + 2 internal wildcards), mini-goals, and playing areas of <50 m2 per player. In the MD-3 session, players engaged in specific endurance training activities, including 8 to 12 minutes of high-intensity interval training (i.e., 10 seconds of running followed by 10 seconds of recovery. They also participated in medium and large-sided games with numerical equality (i.e., 4 vs 4 to 6 vs 6), in playing areas ranging from 50 to 75 m2 per player. On MD-2, the coach focused on defensive phase training according to the team’s game model, while the physical trainer incorporated injury prevention exercises. These included core exercises (plank: 2 sets × 30 repetitions; side plank: 2 sets × 20 repetitions), eccentric strength exercises (Nordic hamstring curls, 2 sets × 4 repetitions; bridging: 2 sets × 6 repetitions); proprioception exercises (floor volley exercise: 2 sets × 10 repetitions), and joint mobility exercises (forward swings: 10 repetitions on the left leg + 10 repetitions on the right leg; side leg swings: 10 repetitions on the left leg + 10 repetitions on the right leg). Finally, MD-1 included training tasks aimed at developing the offensive phase. During this period, friendly matches were played on Saturdays. During the in-season, the first training session of the week (i.e., MD+1, Monday) involved aerobic-regenerative drills and stretching. The second training session of the week (i.e., MD-3, Wednesday) involved neuromuscular training with external loads, circuit training incorporating movements specific to futsal, and small-sided games. The third training session of the week (i.e., MD-2, Thursday) involved specific endurance training with small-sided games, as well as a simulated 5 vs 5 match. The fourth training session of the week (i.e., MD-1, Friday), close to the competition day on Sunday, included activation drills (i.e., accelerations and ballistic exercises) and tactical drills in preparation for the match.
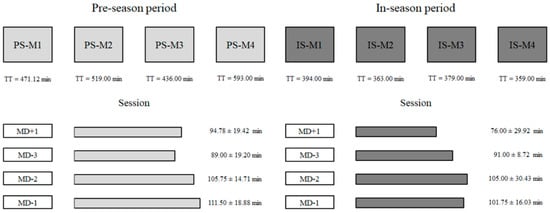
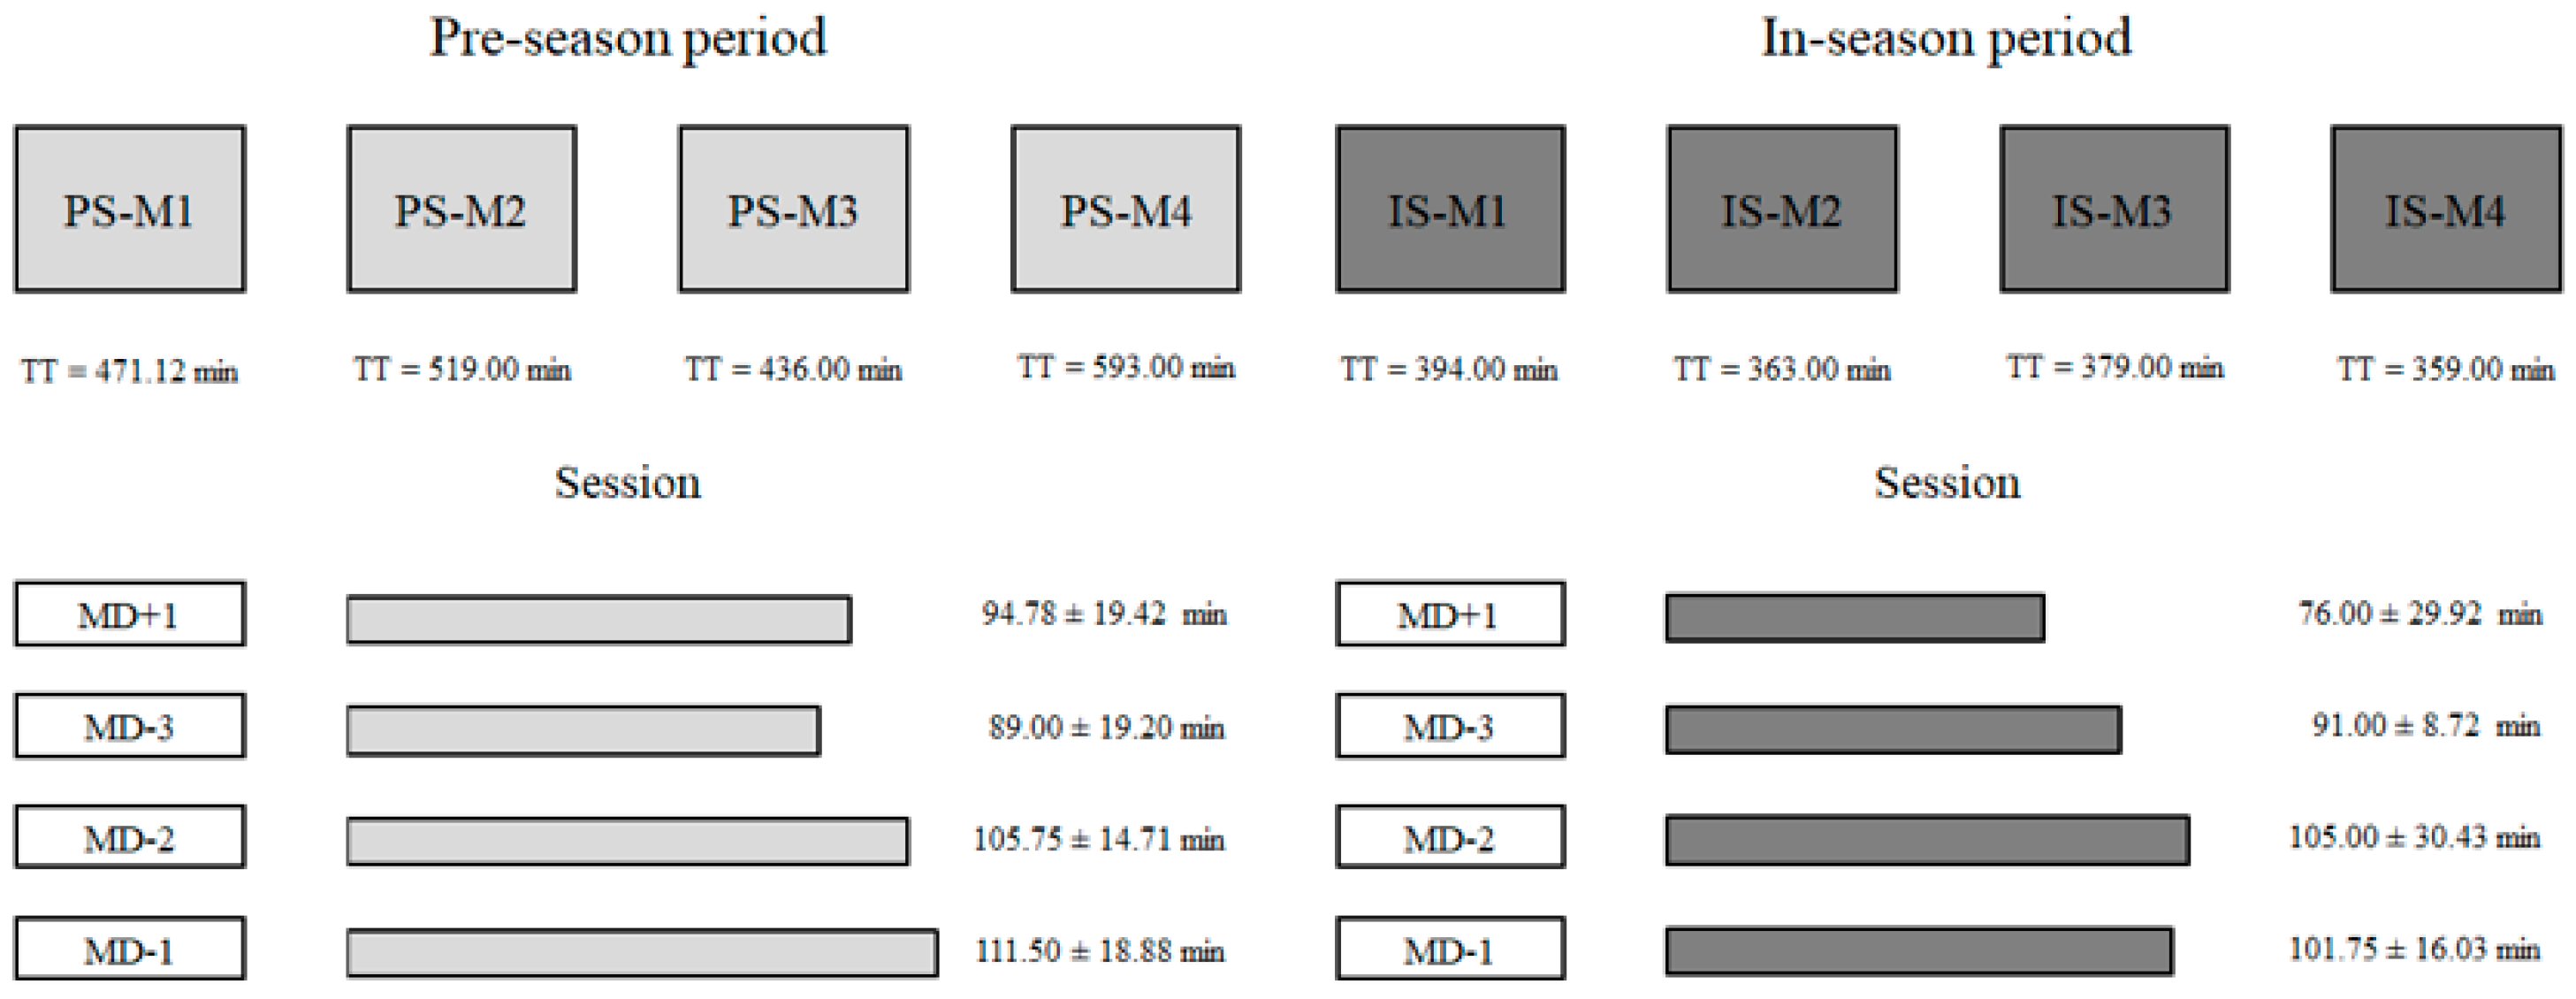
Figure 1.
Structure of each training period studied. PS-M1 = microcycle one of the pre-season; PS-M2 = microcycle two of the pre-season; PS-M3 = microcycle three of the pre-season; PS-M4 = microcycle four of the pre-season; IS-M1 = microcycle one of the in-season; IS-M2 = microcycle two of the in-season; IS-M3 = microcycle three of the in-season; IS-M4 = microcycle four of the in-season; TT = total time; MD+1 = match day plus 1; MD-3 = match day minus 3; MD-2 = match day minus 2; MD-1 = match day minus 1.
The external load of the microcycle was calculated by summing the values of each variable for each training session (i.e., TD PS-M1 = (MD+1) + (MD-3) + (MD-2) + (MD-1)). The external load for the training session was determined as the mean value of each session across the 4 analyzed microcycles of the period (i.e., MD+1 = (MD+1(PS-M1) + MD+1(PS-M2) + MD+1(PS-M3) + MD+1(PS-M4)) ÷ 4). The training games during the pre-season and the competition games during the in-season were not included in the analysis of the external load of the microcycles.
2.4. Statistical Analyses
The statistical analysis was performed with the software IBM SPSS Statistics 20.0 (SPSS Inc., Chicago, IL, USA) and data are expressed as mean ± standard deviation (SD). Data normality was assessed using the Shapiro–Wilk test. To compare dependent variables between microcycles and between sessions, multivariate analysis of variance (MANOVA) with repeated measures was used, with the Bonferroni post hoc and α at p < 0.05 and p < 0.01. In addition, the standardized differences in effect size (ES) with 90% confidence limits (CL) were calculated using the pooled SD. Threshold values for Cohen’s ES statistics were defined as <0.2 (trivial), 0.2–0.59 (small), 0.6–1.19 (moderate), 1.2–1.9 (high), and >2 (very high) [31].
3. Results
3.1. Training Microcycles
Table 2 shows the external load for the analyzed microcycles in each training period. In the pre-season, TD was significantly lower in PS-M1 and PS-M3 than in PS-M2 and PS-M4 (p < 0.01 and p < 0.05). Regarding Drel, PS-M1 presented lower values compared to PS-M2 and PS-M3 (p < 0.05). For HSR, players achieved lower values in PS-M1 than in PS-M2 (p < 0.05), PS-M3 (p < 0.01), and PS-M4 (p < 0.01). Additionally, HSR was lower in PS-M3 compared to PS-M4 (p < 0.05). The SPR values in PS-M1 and PS-M3 were also lower compared to those in PS-M4 (p < 0.05). A lower number of ACC was recorded during PS-M1 compared with PS-M2 and PS-M4 (p < 0.05). Additionally, ACC was lower in PS-M1 compared to PS-M2 and PS-M4, and in PS-M3 compared to PS-M4 (p < 0.05). Meanwhile, DEC was significantly lower (p < 0.01) in PS-M1 compared to the other three pre-season microcycles, and PS-M3 showed lower DEC values compared to PS-M4 (p < 0.05).
Table 2.
External load of the microcycles during pre-season and in-season.
Furthermore, during the in-season training period (Table 2), Drel was lower in IS-M1 compared to IS-M3 (p < 0.05). Conversely, the HSR values obtained in IS-M1 and IS-M3 were higher than those in IS-M4 (p < 0.05 and p < 0.01, respectively). Additionally, a higher (p < 0.05) number of ACC was recorded during IS-M3 compared to IS-M4.
3.2. Training Sessions
The external loads of the training sessions of each period are detailed in Table 3. During the pre-season, TD was lower on MD+1 compared to the other training days (p < 0.01). In addition, TD was lower on MD-3 than on MD-2 and MD-1 (p < 0.01). Regarding Drel, MD+1 presented lower values compared to the other sessions (p < 0.01). Additionally, HSR values on MD+1 were lower than on MD-2 and MD-1 (p < 0.01). HSR was also lower on MD-3 compared to MD-2 and MD-1, and higher on MD-2 compared to MD-1 (p < 0.01 and p < 0.05, respectively). For SPR, players recorded lower values on MD-3 compared to MD-2 and MD-1 (p < 0.05). In relation to ACC, MD+1 showed higher values compared to MD-3, and lower values compared to MD-2 and MD-1 (p < 0.05). Additionally, ACC was lower on MD-3 than on MD-2 and MD-1 (p < 0.01). The ACC values were also higher on MD-2 than on MD-1 (p < 0.05). Fewer DECs were recorded on MD+1 compared to MD-2 and MD-1 (p < 0.01). Additionally, DEC was lower on MD-3 compared to MD-2 and MD-1, and higher on MD-2 compared to MD-1 (p < 0.01).
Table 3.
External load of sessions in pre-season and in-season.
During the in-season, TD was lower on MD+1 compared to the other training sessions (p < 0.01). Additionally, TD was also lower on MD-3 compared to MD-2, and greater on MD-2 compared to MD-1 (p < 0.01). For Drel, MD+1 showed lower values compared to MD-3 and MD-2 (p < 0.01). The Drel values were lower on MD-3 compared to MD-2, and higher on MD-2 compared to MD-1 (p < 0.01 and p < 0.05, respectively). For HSR, players recorded lower values on MD+1 and MD-3 compared to MD-2 (p < 0.01 and p < 0.05, respectively). A lower number of ACC was recorded on MD+1 compared to MD-3 and MD-2 (p < 0.05). Additionally, fewer decelerations (DEC) were observed on MD+1 compared to MD-3 (p < 0.01), MD-2 (p < 0.01), and MD-1 (p < 0.05). DEC was also lower on MD-3 compared to MD-2, and higher on MD-2 compared to MD-1 (p < 0.05 and p < 0.01, respectively).
3.3. Differences between Periods in Each Type of Session
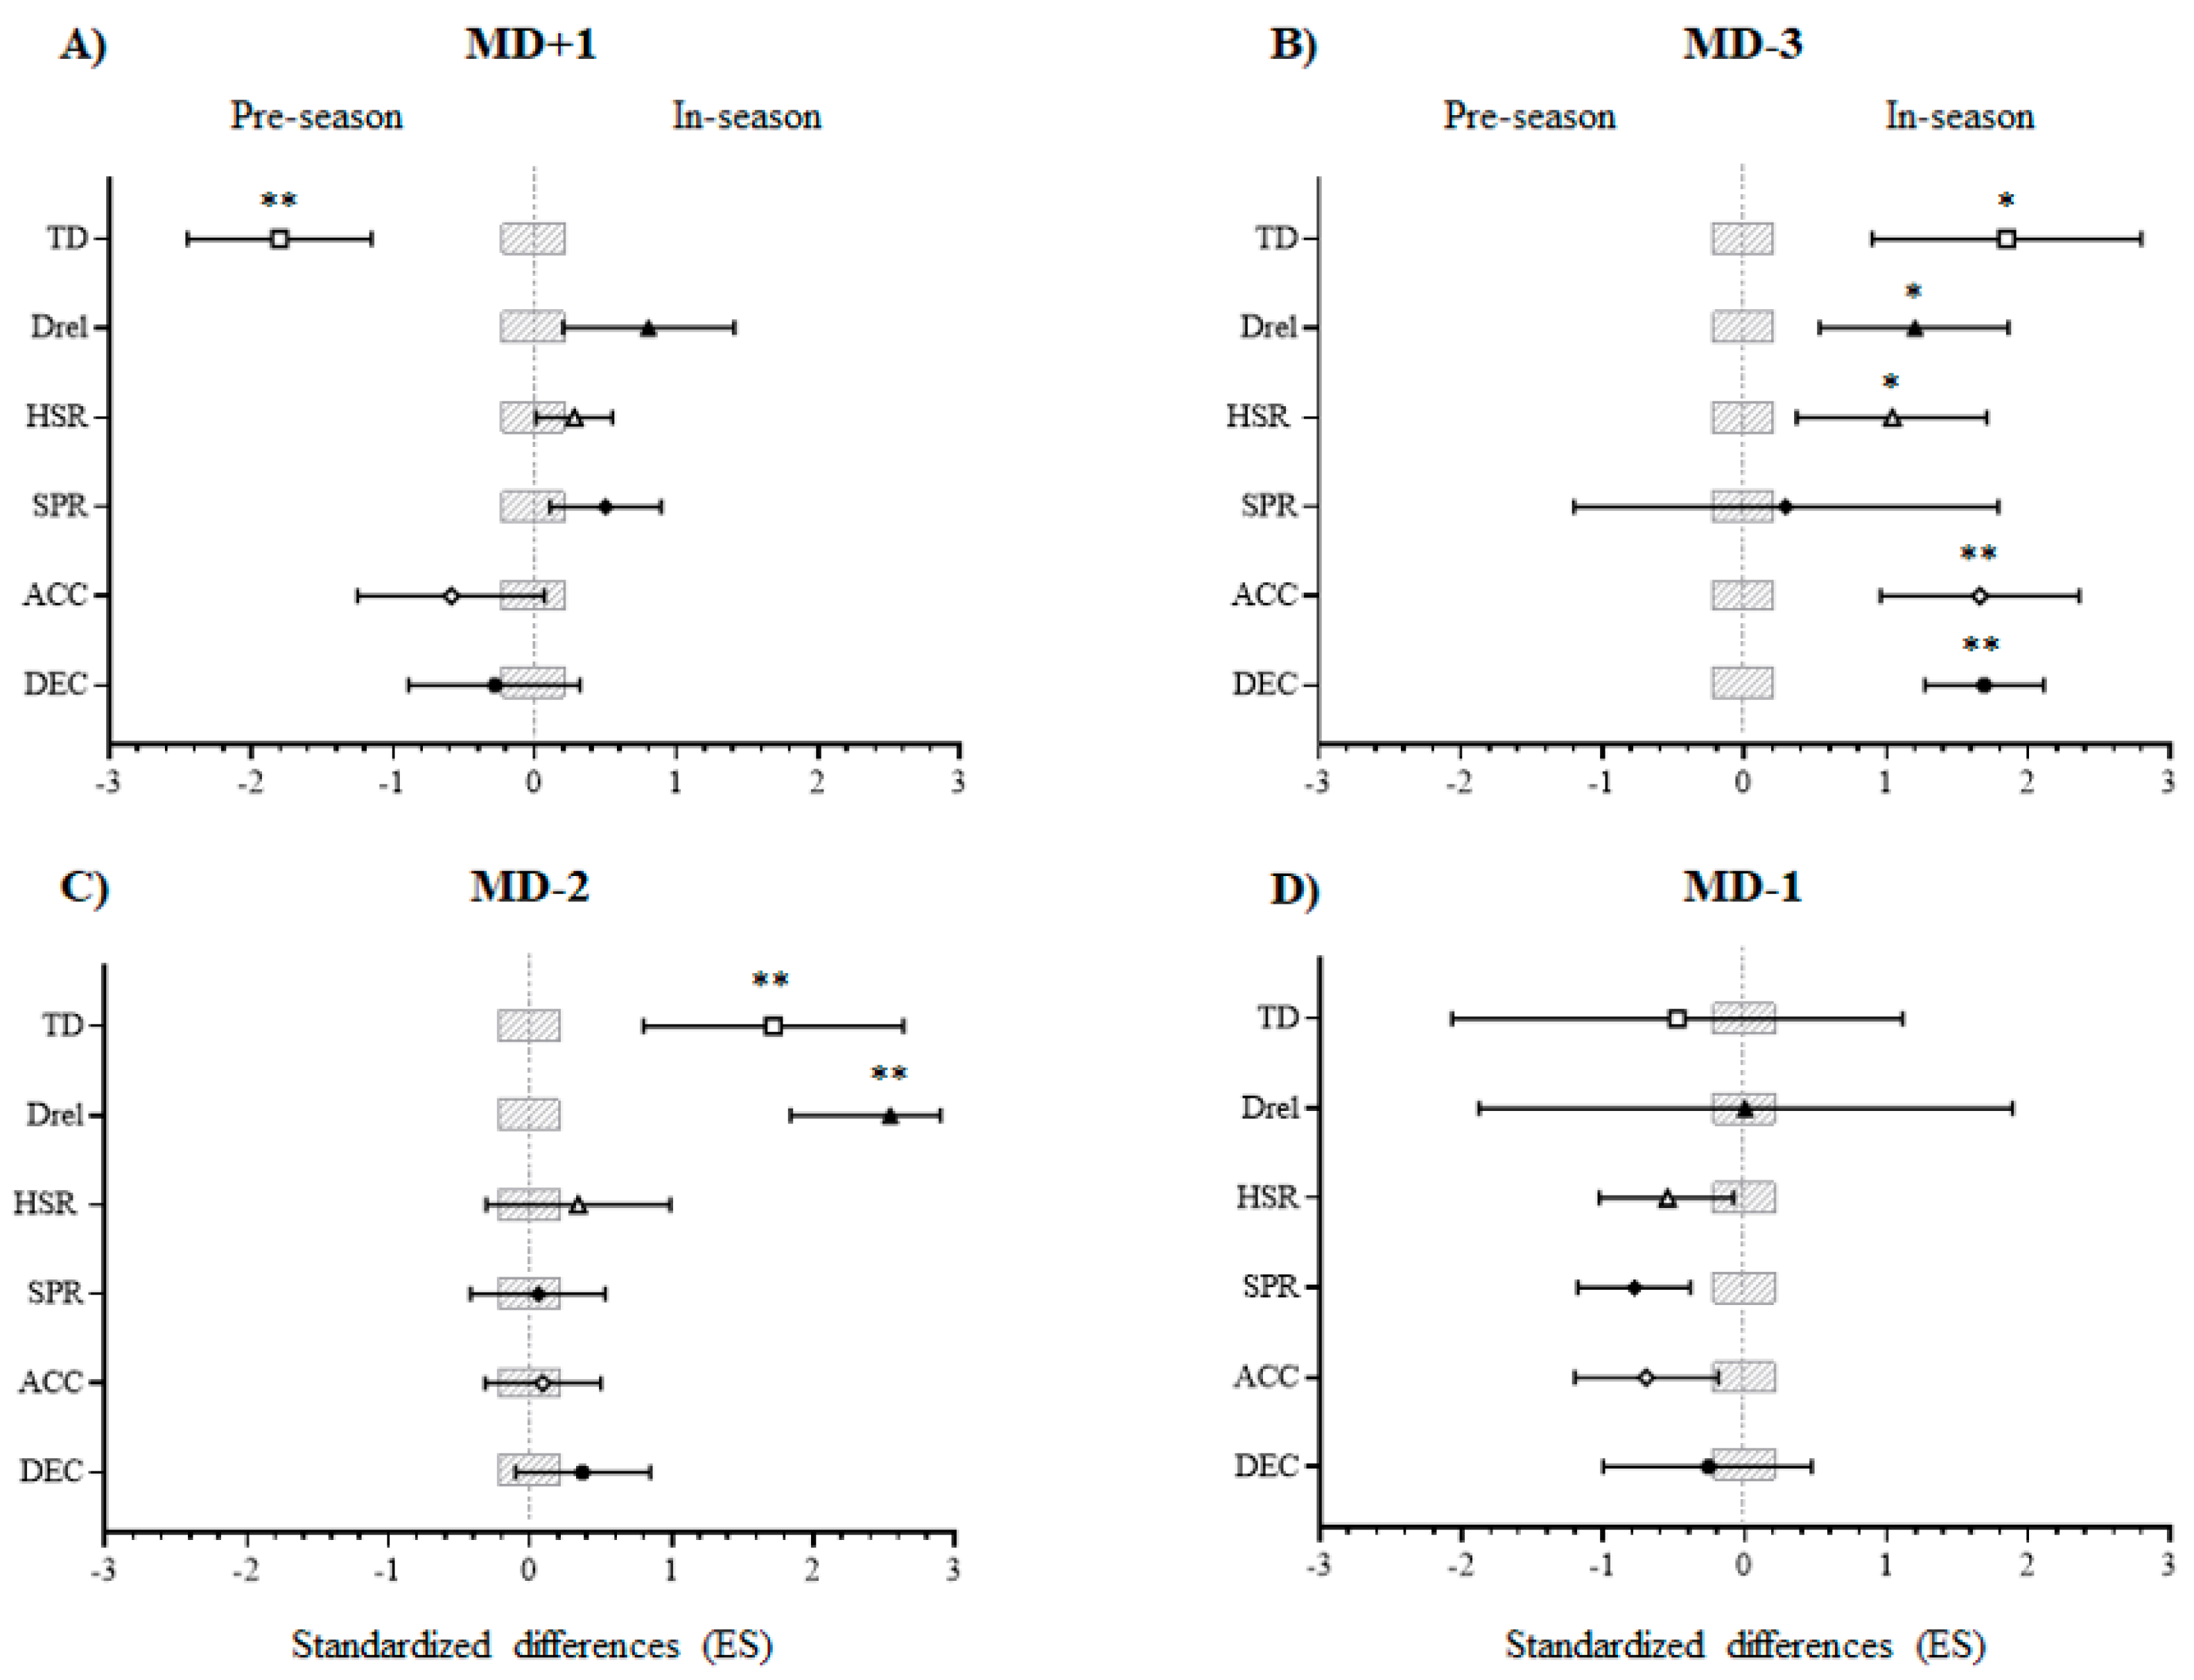
Figure 2 shows the comparisons of the external loads between pre-season and in-season periods, focusing on the average values for each training session of the respective microcycles. Notably, TD on MD+1 was significantly greater during the pre-season compared to the in-season (ES = 1.80). Regarding MD-3, TD values were lower during the pre-season than in the in-season (ES = 1.85). Additionally, Drel was lower during the pre-season than in the in-season (ES = 1.20). For HSR, the values during the pre-season were lower than in the in-season (ES = 1.04). The ACC was lower during the pre-season compared to the in-season (ES = 1.66). In addition, DEC were lower during the pre-season compared to the in-season (ES = 1.69). For the MD-2 session, TD was also lower during the pre-season than in the in-season (ES = 1.72). In addition, Drel was also lower (ES = 2.54) during pre-season than in the in-season. For MD-1, no statistical differences were observed between training periods in any of the variables analyzed.
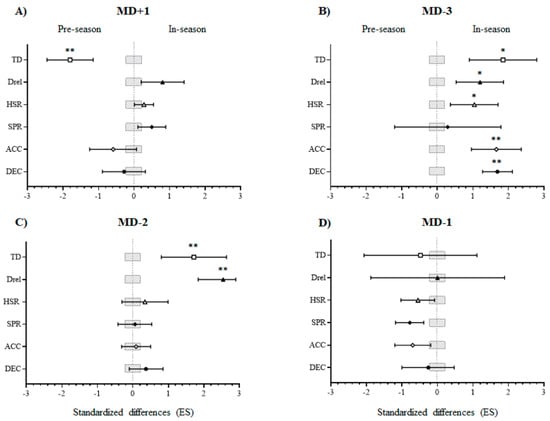
Figure 2.
(A) MD+1 = match day plus 1; (B) MD-3 = match day minus 3; (C) MD-2 = match day minus 2; (D) MD-1 = match day minus 1; TD = total distance covered (m); Drel = relative distance covered (m/min); HRS = high-speed running (m > 18.8 km/h); SPR = sprint distances (m > 25.2 km/h); ACC = number of intense accelerations (>2.5 m/s2); DEC = number of intense decelerations (>−2.5 m/s2); ES = effect size. *, ** = denote difference between periods (p < 0.05 and p < 0.01, respectively).
4. Discussion
This study aimed to investigate the periodization of training load in a high-level futsal team by comparing external loads between pre-season and in-season phases, as well as analyzing the variations in training loads across specific training sessions within these periods. The main findings reveal greater week-to-week variation in training loads during the pre-season compared to the in-season. Both pre-season and in-season phases exhibited peak training loads on MD-2, while MD-1 featured a brief tapering period before matches. Notably, external loads on MD-3 and MD-2 were higher during the in-season than during the pre-season.
During the 4-week pre-season, there was considerable variation in training loads across the microcycles. This detailed examination of the team’s training practices and the variation in external training loads during the pre-season supports previous recommendations suggesting that a fixed sequence system is less suitable for team sports periodization [32]. Instead, a multilateral and variable training approach is preferred. More specifically, PS-M1 presented lower TD, HSR, SPR, ACC, and DEC compared to at least one of the following weeks. For instance, TD was significantly lower in PS-M1 compared to both PS-M2 and PS-M4. This indicates that the first week of the pre-season served as an introductory phase for rebuilding fitness, a common approach following the off-season, typically associated with detraining [33], even if only briefly [34]. The PS-M2 week accumulated the highest training load during the pre-season, followed by a reduction in training load during PS-M3. The training load increased again in the final week of the pre-season, PS-M4. This intensification between PS-M3 and PS-M4 was marked by increases in SPR, ACC, and DEC, indicating a higher training volume, greater exercise intensity, and neuromuscular overload before the in-season. Although this pre-season organization appears effective for (re)gaining fitness, it contrasts with some previous reports. For example, Miloski et al. [17] reported a decreasing weekly loading pattern in a professional futsal team over the pre-season. This approach aligns with the need to taper before entering the competitive period in order to avoid the deleterious effect of excessive fatigue hampering physiological adaptation during the competitive period [35]. However, the authors used sRPE rather than external training load markers. Using the same quantification method, it was recently shown that different teams from the same Professional Futsal League followed different loading patterns during the pre-season [36]. In the referred study, one of the investigated teams followed a progressive reduction in training loads similar to the team reported by Miloski et al. [17], while another team presented a loading pattern more similar to the one reported in the current study, with the first weeks having lower loads and the final week featuring very high loads [36]. On the other hand, using GPS-derived distances covered, a study involving elite soccer players reported very limited variation in training loads across the pre-season weeks [30]. These reports highlight the variable training strategies adopted by different teams during the pre-season. Nonetheless, it can be argued that in the current study, the weekly alternating load pattern during pre-season was appropriate to: (1) reduce the excessive fatigue immediately after returning from off-season (PS-M1), which could be used as an injury prevention strategy [37]; (2) allow rapid gains in fitness and technical-tactical abilities (PS-M2 and PS-M4); (3) recover players in the middle of the pre-season to avoid overreaching, which can impair in-season readiness to perform (PS-M3) [38]; and (4) prepare the players for the high training and competition loads that will be sustained during the in-season (PS-M4).
The in-season period was characterized by relatively even training loads across the weeks of observation. However, for example, Drel was lower in IS-M1 than in IS-M3, while IS-M4 presented higher HSR than IS-M1 and IS-M3. Apart from these “isolated” differences, the evenly distributed loads during the in-season phase (in which maintenance of physical capacities developed during the pre-season can be considered one of the main objectives) are consistent with other team sports such as soccer [30]. This is also consistent with the first weeks of the futsal in-season described by Miloski et al. [17] and seems to be a widely used strategy during competition, which is constrained by frequent matches [19] and congested fixtures [39]. On the other hand, there is evidence that some teams adjust the microcycle training structure based on the difficulty offered by the next match (e.g., home or away, top or bottom teams) [40]. However, it appears that the investigated team in this study does not use this strategy. Future studies are necessary to determine how prevalent this strategy is in high-level futsal [41].
During the pre-season, there was a very clear pattern of training load distribution during the week. The day after a match (MD+1) presented the lowest TD, Drel, HSR, SPR, ACC, and DEC of the week. This training session aims to recover players from the high-intensity efforts of the match [9,10], match fatigue [13], and muscle damage [42]. Afterward, MD-3 was also characterized by a reduced load, while the peak weekly value of external load was noticed in MD-2. This training day likely provides the highest training stimulus to improve players’ fitness through high neuromuscular demands (e.g., ACC and DEC) while also focusing on defensive activities with a high volume of work. Finally, MD-1 is characterized by high exercise intensity, as indicated by relatively high volumes of SPR, ACC, and DEC, but reduced HSR volume compared to MD-2. This approach facilitates a slight “taper” before the next match and focuses on developing offensive actions that are very intense but of short duration. During the in-season, training loads were similarly distributed throughout the week compared to the pre-season. However, MD-1 showed more pronounced differences from MD-2, with lower TD, Drel, and DEC observed on MD-1 compared to MD-2 [29]. This pattern constitutes evidence that the team staff focused more on player recovery before the matches during the pre-season than during the in-season. This approach might be reconsidered by the technical staff to enhance pre-match recovery [20]. This training load distribution is, at least in part, consistent with patterns observed in other team sports [21,30,43,44].
When comparing each day of the week using the MD-minus approach, MD+1 showed similarities between pre-season and in-season phases, except for TD. This difference is likely due to the increased need to focus on tactical and technical aspects of match-play during the in-season, which may involve more extensive and specific drills aimed at developing greater automatisms [45]. Some of the external load markers (TD and Drel) were also higher on MD-2 during the in-season compared to the pre-season. This contrasts with findings in young soccer players, who exhibited higher training loads during the pre-season than in-season [46]. More studies are necessary to ascertain whether team sports players accumulate more internal and external training loads during the pre-season or in the in-season, and to assess the implications for performance. The pre-season loading strategy might lead to fatigue accumulation during the competitive period, potentially reducing performance. This effect could be exacerbated by constant travel and increased psychological stress associated with competition, as observed in other team sports [47,48].
Some of the study’s main limitations include concerns about the validity of the technology used to measure the external load in indoor sports [49]. Additionally, the playing time during both pre-season friendly matches and official in-season matches varied among players, which may have influenced their training load responses, particularly in the initial sessions of each microcycle. Although compensatory training sessions were provided on match days for players not selected, the regulations allowed only eight outfield players to be registered for each match. Consequently, during the in-season period, four players were unable to participate in the competition each week. This variability in match participation could have introduced differences in the physical responses and adaptations observed among the players. Future studies should employ more accurate indoor tracking technologies [23] to better assess the external load of futsal training. The combination of these measurements together with the internal load values (e.g., sRPE) could offer valuable insights into the effects of the training load. The small number of participants from only one team and the limited number of microcycles analyzed should also be considered. In addition, the study only examined a consistent microcycle structure of 6 days between matches. It is important to investigate the dynamics of external load in different structures, including shorter or longer periods between matches. Finally, future research should consider positional differences in physical demands during training and include larger sample sizes.
It is recommended that futsal coaches monitor the external loads of their players to constantly adjust training in order to provide variation in the training content, especially during the in-season, and avoid excessive increases in training loads during the pre-season. The latter strategy could lead to the accumulation of fatigue and impaired performance during the first weeks of the in-season.
5. Conclusions
To conclude, futsal players from the investigated team presented a week-by-week variation in training loads during the pre-season and relatively stable external training loads across in-season microcycles. This pattern aligns with previous recommendations related to "periodization" in team sports. In both pre-season and in-season phases, a peak training load was observed two days before the match, followed by a brief “taper” prior to the match to allow for short-term recovery. Notably, the external loads three and two days before the match were higher in-season than during pre-season. This practice may need to be revised to reduce the risk of overreaching and injury.
Author Contributions
Conceptualization, J.S.-S.; methodology, J.S.-S., F.Y.N., D.H. and A.R.-F.; formal analysis, J.S.-S., D.H. and A.R.-F.; investigation, J.S.-S., D.H. and A.R.-F.; resources, J.S.-S.; data curation, A.R.-F.; writing—original draft preparation, J.S.-S., F.Y.N. and A.R.-F.; writing—review and editing, J.S.-S., F.Y.N. and A.R.-F.; supervision, J.S.-S., F.Y.N. and A.R.-F. All authors have read and agreed to the published version of the manuscript.
Funding
This work did not receive any funding.
Institutional Review Board Statement
The study was conducted in accordance with the Declaration of Helsinki and approved by the Institutional Review Board of Universidad de León (code 004-2021).
Informed Consent Statement
Informed consent was obtained from all subjects involved in the study.
Data Availability Statement
The data from this research can be made available by the corresponding author following a justified request. Due to privacy concerns, the data are not accessible to the public.
Acknowledgments
The authors express their gratitude to the participating athletes for their involvement in the study.
Conflicts of Interest
The authors declare no conflicts of interest.
References
- Reilly, T. The Science of Training—Soccer; Routledge: London, UK, 2007. [Google Scholar]
- Kiely, J. Periodization paradigms in the 21st century: Evidence-Led or Tradition-Driven? Int. J. Sports Physiol. Perform. 2012, 7, 242–750. [Google Scholar] [CrossRef] [PubMed]
- Loturco, I.; Nakamura, F.Y. Training Periodization: An Obsolete Methodology? Aspetar Sports Med. J. 2016, 5, 110–115. [Google Scholar]
- Halson, S.L. Monitoring Training Load to Understand Fatigue in Athletes. Sports Med. 2014, 44, 139–147. [Google Scholar] [CrossRef]
- Aubry, A.; Hausswirth, C.; Louis, J.; Coutts, A.J.; Le Meur, Y. Functional overreaching: The key to peak performance during the taper? Med. Sci. Sports Exerc. 2014, 46, 1769–1777. [Google Scholar] [CrossRef] [PubMed]
- Illa, J.; Fernandez, D.; Reche, X.; Carmona, G.; Tarragó, J.R. Quantification of an Elite Futsal Team’s Microcycle External Load by Using the Repetition of High and Very High Demanding Scenarios. Front. Psychol. 2020, 11, 577624. [Google Scholar] [CrossRef]
- Beato, M.; Coratella, G.; Schena, F. Brief review of the state of art in futsal. J. Sports Med. Phys. Fitness 2016, 56, 428–432. [Google Scholar] [PubMed]
- Uribarri, H.G.; Lago-Fuentes, C.; Bores-Arce, A.; Emilio, V.; Álvarez, V.; López-García, S.; Calero-Morales, S.; Mainer-Pardos, E. External Load Evaluation in Elite Futsal: Influence of Match Results and Game Location with IMU Technology. J. Funct. Morphol. Kinesiol. 2024, 9, 140. [Google Scholar] [CrossRef] [PubMed]
- De Oliveira-Bueno, M.J.; Caetano, F.G.; Pereira, T.J.; De Souza, N.M.; Moreira, G.D.; Nakamura, F.Y.; Cunha, S.A.; Moura, F.A. Analysis of the distance covered by Brazilian professional futsal players during official matches. Sports Biomech. 2014, 13, 230–240. [Google Scholar] [CrossRef]
- Caetano, F.G.; José, M.; Bueno, D.O.; Marche, A.L.; Nakamura, F.Y.; Cunha, S.A.; Moura, F.A. Characterization of the sprint and repeated-sprint sequences performed by professional futsal players, according to playing position, during official matches. J. Appl. Biomech. 2015, 31, 423–430. [Google Scholar] [CrossRef]
- Barbero-Alvarez, J.C.; Soto, V.M.; Barbero-Alvarez, V.; Granda-Vera, J. Match analysis and heart rate of futsal players during competition. J. Sports Sci. 2008, 26, 63–73. [Google Scholar] [CrossRef]
- Spyrou, K.; Freitas, T.; Marín-Cascales, E.; Alcaraz, P. Physical and physiological Match-Play Demands and Player Characteristics in Futsal: A Systematic Review. Front. Psychol. 2020, 11, 569897. [Google Scholar] [CrossRef] [PubMed]
- Milioni, F.; Vieira, L.H.; Barbieri, R.A.; Zagatto, A.M.; Nordsborg, N.B.; Barbieri, F.A.; dos-Santos, J.W.; Santiago, P.R.; Papoti, M. Futsal match-related fatigue affects running performance and neuromuscular parameters but not finishing kick speed or accuracy. Front. Physiol. 2016, 7, 518. [Google Scholar] [CrossRef] [PubMed]
- Ribeiro, J.N.; Monteiro, D.; Goncalves, B.; Brito, J.; Sampaio, J.; Travassos, B. Variation in Physical Performance of Futsal Players During Congested Fixtures. Int. J. Sports Physiol. Perform. 2022, 17, 367–373. [Google Scholar] [CrossRef] [PubMed]
- Castagna, C.; D’Ottavio, S.; Granda-Vera, J.; Barbero-Álvarez, J.C. Match demands of professional Futsal: A case study. J. Sci. Med. Sport. 2009, 12, 490–494. [Google Scholar] [CrossRef] [PubMed]
- Soares-Caldeira, L.F.; De Souza, E.A.; De Freitas, V.H.; De Morales, S.; Leicht, A.S.; Nakamura, F.Y. Effects of additional repeated sprint training during preseason on performance, heart rate variability, and stress symptoms in futsal players: A randomized controlled trial. J. Strength. Cond. Res. 2014, 28, 2815–2826. [Google Scholar] [CrossRef]
- Miloski, B.; de Freitas, V.H.; Nakamura, F.Y.; de A Noguera, F.C.; Bara-Filho, M.G. Seasonal training load distribution of professional futsal players: Effects on physical fitness, muscle damage and hormonal status. J. Strength. Cond. Res. 2016, 30, 1525–1533. [Google Scholar] [CrossRef]
- Nakamura, F.Y.; Pereira, L.A.; Rabelo, F.N.; Flatt, A.A.; Esco, M.R.; Bertollo, M.; Loturco, I. Monitoring weekly heart rate variability in futsal players during the preseason: The importance of maintaining high vagal activity. J. Sports Sci. 2016, 34, 2262–2268. [Google Scholar] [CrossRef]
- Gamble, P. Periodization of Training for Team Sports Athletes. Strength. Cond. J. 2006, 28, 56–66. [Google Scholar] [CrossRef]
- Marrier, B.; Robineau, J.; Piscione, J.; Lacome, M.; Peeters, A.; Hausswirth, C.; Morin, J.B.; Le Meur, Y. Supercompensation kinetics of physical qualities during a taper in team-sport athletes. Int. J. Sports Physiol. Perform. 2017, 12, 1163–1169. [Google Scholar] [CrossRef]
- Sanchez-Sanchez, J.; Hernández, D.; Martin, V.; Sanchez, M.; Casamichana, D.; Rodriguez-Fernandez, A.; Ramirez-Campillo, R.; Nakamura, F.Y. Assessment of the external load of amateur soccer players during four consecutive training microcycles in relation to the external load during the official match. Mot. Rev. Educ. Física 2019, 25, e101938. [Google Scholar] [CrossRef]
- Campos-Vazquez, M.A.; Toscano-Bendala, J.; Mora-Ferrera, J.C.; Suarez-Arrones, L.J. Relationship between internal load indicators and changes on intermittent performance after the preseason in professional soccer players. J. Strength. Cond. Res. 2017, 31, 1477–1485. [Google Scholar] [CrossRef]
- Bastida-Castillo, A.; Gómez-Carmona, C.D.; De la Cruz-Sánchez, E.; Pino-Ortega, J. Accuracy, intra- and inter-unit reliability, and comparison between GPS and UWB-based position-tracking systems used for time–motion analyses in soccer. Eur. J. Sport. Sci. 2018, 18, 450–457. [Google Scholar] [CrossRef] [PubMed]
- Lu, Y.X.; Clemente, F.M.; Bezerra, P.; Crowley-McHattan, Z.J.; Cheng, S.C.; Chien, C.H.; Kuo, C.D.; Chen, Y.S. Quantification of Respiratory and Muscular Perceived Exertions as Perceived Measures of Internal Loads During Domestic and Overseas Training Camps in Elite Futsal Players. Front. Psychol. 2022, 12, 751030. [Google Scholar] [CrossRef] [PubMed]
- Rhodes, J.; Mason, B.; Perrat, B.; Smith, M.; Goosey-Tolfrey, V. The validity and reliability of a novel indoor player tracking system for use within wheelchair court sports. J. Sports Sci. 2014, 32, 1639–1647. [Google Scholar] [CrossRef]
- McKay, A.K.; Stellingwerff, T.; Smith, E.S.; Martin, D.T.; Mujika, I.; Goosey-Tolfrey, V.L.; Sheppard, J.; Burke, L.M. Defining Training and Performance Caliber: A Participant Classification Framework. Int. J. Sports Physiol. Perform. 2022, 17, 317–331. [Google Scholar] [CrossRef]
- Peltonen, J.; Tuulari, E. Polar Team Pro—Portable player tracking system to increase team performance and prevent injuries. Polar Electro Oy 2017, 1, 1–7. [Google Scholar]
- Rodríguez-Fernández, A.; Suárez-Iglesias, D.; Vaquera, A.; Leicht, A.S.; Rodríguez-Marroyo, J.A. Inter-system and inter-unit reliability of Polar Team Pro and WIMU PRO devices during external load measurements indoors. Proc. Inst. Mech. Eng. Part P J. Sports Eng. Technol. 2023, in press. [Google Scholar] [CrossRef]
- Martín-García, A.; Gómez-Díaz, A.; Bradley, P.S.; Morera, F.; Casamichana, D. Quantification of a Professional Football Team’s External Load Using a Microcycle Structure. J. Strength. Cond. Res. 2018, 32, 3511–3518. [Google Scholar] [CrossRef]
- Malone, J.J.; Michele, R.; Morgans, R.; Burgess, D.; Morton, J.P.; Drust, B. Seasonal Training-Load Quantification in Elite English Premier League Soccer Players. Int. J. Sports Physiol. Perform. 2015, 10, 489–497. [Google Scholar] [CrossRef]
- Hopkins, W.G.; Marshall, S.W.; Batterham, A.M.; Hanin, J. Progressive statistics for studies in sports medicine and exercise science. Med. Sci. Sports Exerc. 2009, 41, 3–13. [Google Scholar] [CrossRef]
- Plisk, S.S.; Stone, M.H. Periodization Strategies. Strength. Cond. J. 2003, 25, 19–37. [Google Scholar] [CrossRef]
- Silva, J.R.; Brito, J.; Akenhead, R.; Nassis, G.P. The Transition Period in Soccer: A Window of Opportunity. Sports Med. 2016, 46, 305–313. [Google Scholar] [CrossRef]
- Rodriguez-Fernandez, A.; Sanchez-Sanchez, J.; Ramírez-Campillo, R.; Rodríguez-Marroyo, J.A.; Villa, J.G.; Nakamura, F.Y. Effects of short-term in-season break detraining on repeated-sprint ability and intermittent endurance according to initial performance of soccer player. PLoS ONE 2018, 13, e0201111. [Google Scholar] [CrossRef]
- Kraemer, W.J.; French, D.N.; Paxton, N.J.; Häkkinen, K.; Volek, J.S.; Sebastianelli, W.J.; Putukian, M.; Newton, R.U.; Rubin, M.R.; Gómez, A.L.; et al. Changes in exercise performance and hormonal concentrations over a big ten soccer season in starters and nonstarters. J. Strength. Cond. Res. 2004, 18, 121–128. [Google Scholar]
- Teixeira, A.; Nunes, R.; Yanci, J.; Izzicupo, P.; Forner-Flores, L.; Romano, J.; Guglielmo, L.; Nakamura, F.Y. Different Pathways Leading up to the Same Futsal Competition: Individual and Inter-Team Variability in Loading Patterns and Preseason Training Adaptations. Sports 2018, 7, 7. [Google Scholar] [CrossRef] [PubMed]
- Gabbett, T.J. Reductions in pre-season training loads reduce training injury rates in rugby league players. Br. J. Sports Med. 2004, 38, 743–749. [Google Scholar] [CrossRef]
- Moreira, A.; Ribeiro-de Moura, N.; Coutts, A.; Caldas-Costa, E.; Kempton, T.; Saldanha-Aoki, M. Monitoring internal training load and mucosal immune responses in futsal athletes. J. Strength. Cond. Res. 2013, 27, 1253–1259. [Google Scholar] [CrossRef] [PubMed]
- Clemente, F.M.; Martinho, R.; Calvete, F.; Mendes, B. Training load and well-being status variations of elite futsal players across a full season: Comparisons between normal and congested weeks. Physiol. Behav. 2019, 201, 123–129. [Google Scholar] [CrossRef] [PubMed]
- Kelly, V.G.; Coutts, A.J. Planning and Monitoring Training Loads During the Competition Phase in Team Sports. Strength. Cond. J. 2007, 29, 32. [Google Scholar] [CrossRef]
- Hernandez, D.; Sánchez, M.; Martin, V.; Beneítez, J.; Sanchez-Sanchez, J. Contextual variables and weekly external load in a semi-professional football team. Apunt. Educ. Física Esports 2021, 37, 61–67. [Google Scholar]
- de Moura, N.R.; Borges, L.S.; Santos, V.C.; Joel, G.B.; Bortolon, J.R.; Hirabara, S.M.; Cury-Boaventura, M.F.; Pithon-Curi, T.C.; Curi, R.; Hatanaka, E. Muscle lesions and inflammation in futsal players according to their tactical postions. J. Strength. Cond. Res. 2013, 27, 2612–2618. [Google Scholar] [CrossRef] [PubMed]
- Manzi, V.; D’Ottavio, S.; Impellizzeri, F.M.; Chaouachi, A.; Chamari, K.; Castagna, C. Profile of weekly training load in elite male professional basketball players. J. Strength. Cond. Res. 2010, 24, 1399–1406. [Google Scholar] [CrossRef] [PubMed]
- Anderson, L.; Orme, P.; Di Michele, R.; Close, G.L.; Morgans, R.; Drust, B.; Morton, J.P. Quantification of training load during one-, two- and three-game week schedules in professional soccer players from the English Premier League: Implications for carbohydrate periodization. J. Sports Sci. 2016, 34, 1250–1259. [Google Scholar] [CrossRef]
- Fessi, M.S.; Nouira, S.; Dellal, A.; Owen, A.; Elloumi, M.; Moalla, W. Changes of the psychophysical state and feeling of wellness of professional soccer players during pre-season and in-season periods. Res. Sports Med. 2016, 24, 375–386. [Google Scholar] [CrossRef]
- Jeong, T.S.; Reilly, T.; Morton, J.; Bae, S.W.; Drust, B. Quantification of the physiological loading of one week of “pre-season” and one week of “in-season” training in professional soccer players. J. Sports Sci. 2011, 29, 1161–1166. [Google Scholar] [CrossRef]
- Faude, O.; Kellmann, M.; Ammann, T.; Schnittker, R.; Meyer, T. Seasonal changes in stress indicators in high level football. Int. J. Sports Med. 2011, 32, 259–265. [Google Scholar] [CrossRef]
- Di Fronso, S.; Nakamura, F.Y.; Bortoli, L.; Robazza, C.; Bertollo, M. Stress and recovery balance in amateur basketball players: Differences by gender and preparation phase. Int. J. Sports Physiol. Perform. 2013, 8, 618–622. [Google Scholar] [CrossRef] [PubMed]
- Fox, J.L.; O’Grady, C.J.; Scanlan, A.T.; Sargent, C.; Stanton, R. Validity of the Polar Team Pro Sensor for measuring speed and distance indoors. J. Sci. Med. Sport. 2019, 22, 1260–1265. [Google Scholar] [CrossRef]
Disclaimer/Publisher’s Note: The statements, opinions and data contained in all publications are solely those of the individual author(s) and contributor(s) and not of MDPI and/or the editor(s). MDPI and/or the editor(s) disclaim responsibility for any injury to people or property resulting from any ideas, methods, instructions or products referred to in the content. |
© 2024 by the authors. Licensee MDPI, Basel, Switzerland. This article is an open access article distributed under the terms and conditions of the Creative Commons Attribution (CC BY) license (https://creativecommons.org/licenses/by/4.0/).