Article

Application of Ultrasonic Testing for Assessing the Elastic Properties of PLA Manufactured by Fused Deposition Modeling

1
Department of Mechanical Engineering, New Mexico Institute of Mining and Technology, 801 Leroy Pl., Socorro, NM 87801, USA
2
Department of Mechanical and Aerospace Engineering, New Mexico State University, 1040 S. Horseshoe Street, Las Cruces, NM 88003, USA
*
Author to whom correspondence should be addressed.
Appl. Sci. 2024, 14(17), 7639; https://doi.org/10.3390/app14177639
Submission received: 12 July 2024 / Revised: 8 August 2024 / Accepted: 9 August 2024 / Published: 29 August 2024
(This article belongs to the Special Issue Material Evaluation Methods of Additive-Manufactured Components)

Abstract

:

Featured Application

Real-time monitoring of the elastic properties of materials during the printing process.

Abstract

This study demonstrated the potential of a non-destructive evaluation (NDE) method to assess the elastic properties of materials printed under various parameters. A database was created documenting the relationship between the elastic properties (Young’s modulus, shear modulus, and Poisson’s ratio) of PLA (polylactic acid) materials and selected printing parameters such as temperature, speed, and layer height. PLA, which is widely used in additive manufacturing, offers convenient testing conditions due to its less demanding control compared to materials like metals. Ultrasonic testing was conducted on specimens printed under different nozzle temperatures, speeds, and layer heights. The results indicated that an increase in the printing temperature corresponded to an increase in material density and elastic properties of the material. In contrast, an increase in layer height led to a decrease in both density and the elastic properties of the material. Variations in the nozzle speed had a negligible effect on density and did not show a notable effect on the elastic moduli. This study demonstrated that ultrasonic testing is effective in measuring the elastic properties of PLA materials and shows the potential of real-time ultrasonic NDE.

1. Introduction

Fused Deposition Modeling (FDM) is a popular 3D printing technology, which is based on the extrusion of a melted material through a nozzle, layer by layer [1,2]. With the growth in popularity and advancements in FDM, it now enables the creation of objects with complex geometries [3,4]. This is a low cost technology, which is easy to operate and allows the use of a wide range of printing materials, such as polylactic acid (PLA) and acrylonitrile butadiene styrene (ABS) [4].
Despite its advantages, this process presents several challenges that need to be addressed. Among these challenges, the quality control of the printed part is one of the primary concerns. The final properties of the printed material are dependent on many factors, including the interrelationships between printing parameters. Layer height is one of the FDM parameters that influence the surface roughness, tensile, and shear strength of the printed material [5,6,7]. Along with layer height, the temperature of the nozzle affects the mechanical properties of FDM-produced parts, which was demonstrated by several researchers [8,9]. The contribution of the raw materials’ properties and filament color to the mechanical properties was shown in [10,11]. One of the reasons why the final properties of a material may differ from the expected ones is the presence of defects. Defects, such as voids, layer debonding, and surface roughness, can arise from various factors, such as the parameters of the process and their combinations, the properties of the raw material, environmental factors, etc. [12,13]. Defects could negatively affect the mechanical properties of the part [14,15]. Finally, the layer-by-layer deposition approach may result in possible anisotropy of the material. Given the broad range of variables affecting the quality of the fabricated part, it is important to explore the influence of process parameters on the mechanical properties of the printed material.
Nondestructive evaluation (NDE) methods are widely employed for material characterization and do not damage the material itself [16,17,18]. Some nondestructive techniques permit inspection during the printing process (in situ) [19]. One of the leading methods of quality assessment of additively manufactured parts is X-ray computed tomography (CT). This is an ex situ method used in defect characterization and classification after the manufacturing process is completed [20,21,22]. Although it permits the assessment of defect sizes and locations, it may not provide information on the elastic properties of the printed material. This nondestructive technique is also used for assessing the mechanical and thermo-mechanical properties of PLA-based composites [23,24].
Infrared imaging relies on analyzing thermal radiation variances, enabling the identification of defect shapes and contours within materials. This method can also be employed to capture thermal gradients across the surface of the printed part. Nevertheless, this method may not effectively detect small defects and does not provide information regarding the material’s properties [25].
Ultrasonic testing (UT) is one of the most robust NDE techniques. UT is capable of detecting both surface and sub-surface defects, and identifying their locations and sizes. Additionally, ultrasonic testing can be employed to measure material properties [26,27,28]. This NDE technique could be used for both ex situ and in situ measurements. In situ implementation of this method and subsequent signal acquisition enable a qualitative evaluation of residual stresses and porosity [29,30]. UT testing can be applied to objects with complex geometries, but the surface roughness significantly influences the signal detection and its quality. In cases involving rough surfaces, liquid couplants are used to improve the test results [28,31]. UT also demonstrates good performance in detecting cracks [32]. This NDE method is cost effective, simple to use, and capable of detecting internal defects within the printed material [27,31,32].
There are other methods of determining material parameters [33,34]. For example, elastic parameters could be obtained from 3- and 4-point bending tests. However, these tests typically proceed further to the destructive phase. To enable the assessment of the future assessment of the material in real time, the ultrasonic method was chosen.
Several studies were conducted on the effect of parameters of the printing process on the mechanical properties of the plastic parts. Kumar et al. [35] chose infill density, perimeters, and nozzle angle as the printing variables. Cwikla et al. [36], in their investigation, changed the following parameters: perimeters, solid layers, fill density, fill pattern, solid fill pattern, and extrusion multiplier. In the study of Samykano et al. [37], variable raster angles and infill densities were used. Doshi et al. [38] explored the influence of layer thickness, infill density and pattern, printing speed, build orientation, and raster angle on the mechanical properties of the FDM-printed parts. In general, researchers make their own selection of printing parameters based on the interest of the study and their vision. Therefore, in this work, nozzle speed, printing speed, and temperature were chosen as the variable parameters as we believe that changes in these parameters could result in different properties of the final material.
The use of NDE in the post-printing assessment of material quality is well established. In this work, the potential of an ultrasonic NDE method in evaluating the elastic properties of PLA printed with various parameters was explored. The effect of various variables in the printing process on the resultant material properties was studied. Such an opportunity may enable a real-time adjustment of printing parameters to enable certain material properties by utilizing NDE information in conjunction with the printer’s control and hardware settings. A multi-dimensional response surface that links various process settings to the measured elastic material properties could be utilized as a foundation for NDE-enabled real-time decision-making to obtain the desired outcome from the printing process. For this purpose, a database of the dependency of the elastic properties (including Young’s modulus, shear modulus, and Poisson’s ratio) of the PLA material on the parameters of the printing process such as printing temperature, printing speed, and layer height was established. PLA is one of the widely used filaments in additive manufacturing. Unlike other printing materials, e.g., metals, the printing controls and temperatures for PLA are not as demanding, making it a convenient choice for laboratory testing. Furthermore, PLA is a rather challenging material for ultrasonic testing (UT) due to its high attenuation since less attenuative materials are likely to provide broader opportunities for real-time ultrasonic NDE. The findings from this research offer valuable insights into how printing process parameters affect the elastic properties of the printed samples, benefiting a broad spectrum of users working with PLA materials.

2. Materials and Methods

2.1. Specimen Manufacturing

This study investigated the influence of the printing process parameters on the elastic material properties of a printed PLA material. For this purpose, 38 cubic PLA specimens with dimensions of 20 × 20 × 20 mm3 were printed using a Creality Ender 6 FDM 3D printer (Shenzhen, China) (Figure 1). Markforged PLA white filament with diameter of 1.75 mm was utilized. The initial process parameters chosen for printing the experimental specimens included a nozzle temperature of 220 °C, a nozzle speed of 50 mm/s, a build plate temperature of 50 °C, and a layer height of 0.2 mm. In order to analyze the influence of the nozzle temperature, nozzle speed, and layer height on the elastic properties of the printed material, three sets of cubic specimens were printed, changing the parameter under investigation with respect to the starting point (Table 1). The initial set of specimens, as shown in Figure 1, included a larger number of specimens. However, due to high ultrasonic wave attenuation in some specimens, which complicated the experiments and prevented accurate data collection, these specimens were excluded from the final analysis. Consequently, the final set of specimens reported in Table 1 represents those used in the research. To improve the poor quality of the ultrasonic signal due to surface roughness [39], all specimens were polished using P220 and P400 grade sandpaper. The results for the unpolished specimens are not presented because the ultrasonic wave attenuated very rapidly on these specimens. This high attenuation made it impractical to process and use such data for analysis. Therefore, polishing was necessary to ensure reliable and accurate ultrasonic measurements.

2.2. Density Measurements

The density of each specimen, which is required for elastic property estimation via ultrasonic testing, was measured using the Archimedes’ principle. First, the specimens were weighed using an AWS-100 electronic scale with an accuracy of ±0.01 g (Apotheca, Cornelius, NC, USA). Then, the PLA cubes were suspended in a water-filled tank placed on the electronic scale and the change in mass was recorded. The volume of the immersed body was calculated using Equation (1).
V = Δ m ρ ,
where Δ m is the change in mass and ρ is the density of water (1 g/cm3).
The density of the specimen was calculated using Equation (2):
ρ b o d y = m ρ m ,
where m is the mass of the cubic specimen.
Measurements were conducted five times for each specimen and the average was recorded for all calculations.

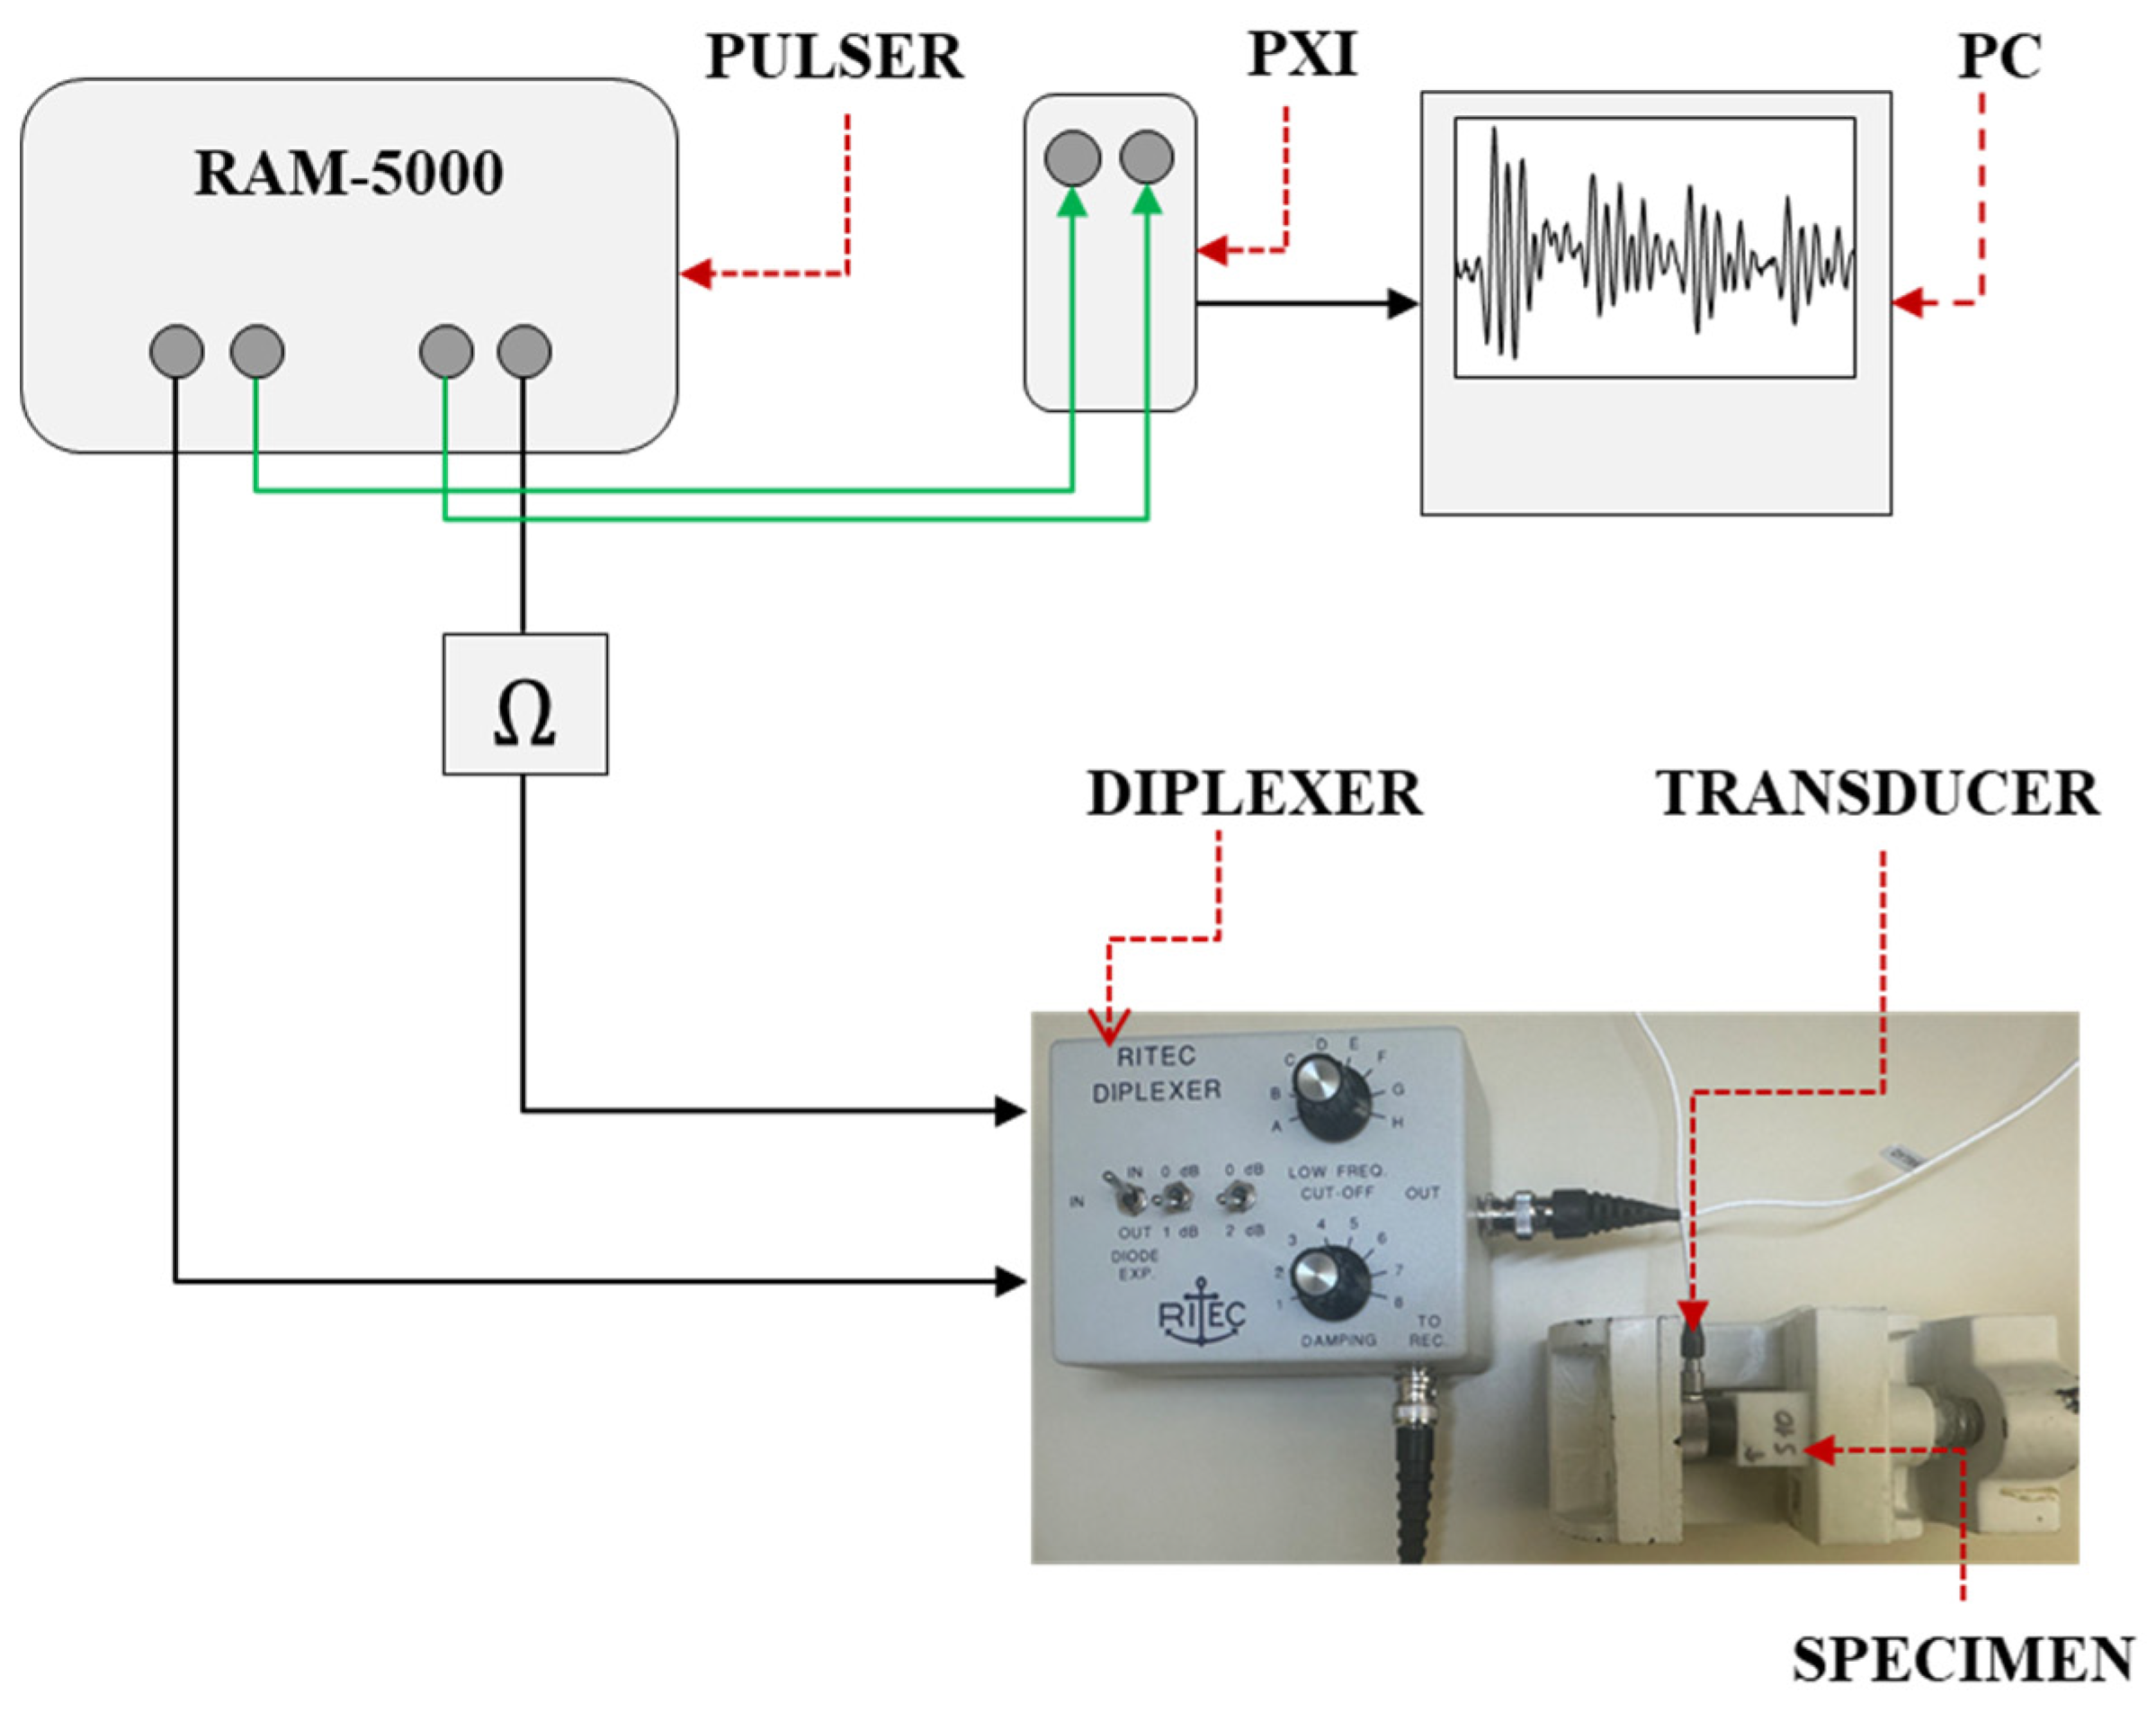
2.3. Ultrasonic Experimental Setup

Ultrasonic testing is a non-destructive technique that utilizes high-frequency sound waves to evaluate the internal structure, integrity, and physical properties of materials. In this work, the information about the longitudinal and shear velocities in the printed PLA specimens was collected using the UT technique. For this purpose, the experimental setup included a RITEC RAM-5000 high-power pulse generator, a RITEC Diplexer, a PXI chassis with an embedded digitizer, a PC for data visualization and recording, and UT transducers. UT signals were measured using an A103S-RM 1MHz longitudinal wave transducer and two V153-RM 1MHz shear wave transducers. A frequency of 1 MHz was chosen as the most suitable frequency for a specimen of the given dimensions and material. The schematic of the experimental setup is depicted in Figure 2.
PLA materials have a relatively high attenuation coefficient, which affects the intensity of the ultrasonic signal travelling through the material. Therefore, two different measurement approaches were utilized in this work: pulse echo and through transmission. The pulse-echo approach was used for measuring the longitudinal speed of sound. In this method, a transducer acts as both a transmitter and as a receiver. The through transmission approach was used for measuring the shear speed of sound. In this approach, one transducer is used as a transmitter and the second one as a receiver.
During the tests, specimens with transducers were placed in clamps (see Figrue 2 insert for details) to maintain tight and consistent contact. Consistency in the conducted experiments is essential, considering that various environmental factors such as contact pressure and the thickness of the couplant’s layer could significantly influence the test results. In order to resolve this, the signal consistency was maintained by controlling the ultrasonic signal levels. The ultrasonic intensity was adjusted by tuning the transducer contact pressure to yield the same level of horizontal cursors within the software interface. These cursors were adjusted up to the maximum and minimum amplitudes of the transmitted signal, which was the same for all measurements. The received signal was scaled in such a way that the maximum and minimum amplitudes of the first echo reached these cursors, as depicted in Figure 3. Ultrasonic measurements were taken three times for each specimen; a constant level of contact pressure was maintained during the experiment to maintain signal consistency, as described above.

2.4. Assessment of the Elastic Properties of PLA Material

The longitudinal and shear speeds of sound within a material are related to the material’s elastic properties. The time of flight was used to calculate the speeds of sound within the specimens. This approach is based on determining the distance between two ultrasound signal peaks, and then dividing the distance traveled by the signal by the measured time interval. The procedure for determining the time corresponding to the peaks of the ultrasonic signal is shown in Figure 4.
After estimating the longitudinal and shear speeds of sound within the specimens, Equation (3) was utilized to calculate the Poisson’s ratio [40]:
η = 1 2 ( V T V L ) 2 2 2 ( V T V L ) 2 ,
where V L is the longitudinal sound speed and V T is the shear (transverse) speed.
The Young’s and shear moduli were calculated using Equation (4) and Equation (5), respectively:
E = V L 2 ρ ( 1 + η ) ( 1 2 η ) ( 1 η ) ,
G = V T 2 ρ ,
where ρ is the material’s density.

2.5. Experimental Setup and Procedure for Porosity Measurements

Two specimens from each set (S, T, and TH; see Table 1), printed using the min and max values of the corresponding parameter, i.e., nozzle speed, nozzle temperature, and layer height, were selected for CT scanning. Samples with dimensions of approximately 3 × 3 × 10 mm3 were cut from the selected cubic specimens. The samples were mounted on a cylindrical acrylic rod and scanned using a Waygate Technologies Phoenix V|tome|x S scanner (Baker Hughes, Houston, TX, USA). The CT machine was configured to produce 30 watts at 50 kV of voltage and 60 µA of current. A total of 1500 projections were taken at 0.24-degree increments; each projection took 333 ms and was captured with a detector sensitivity of 2. During testing, the specimen was placed at a distance of 35.94 mm from the X-ray source, resulting in a voxel size of 8.9 µm.

3. Results and Discussion

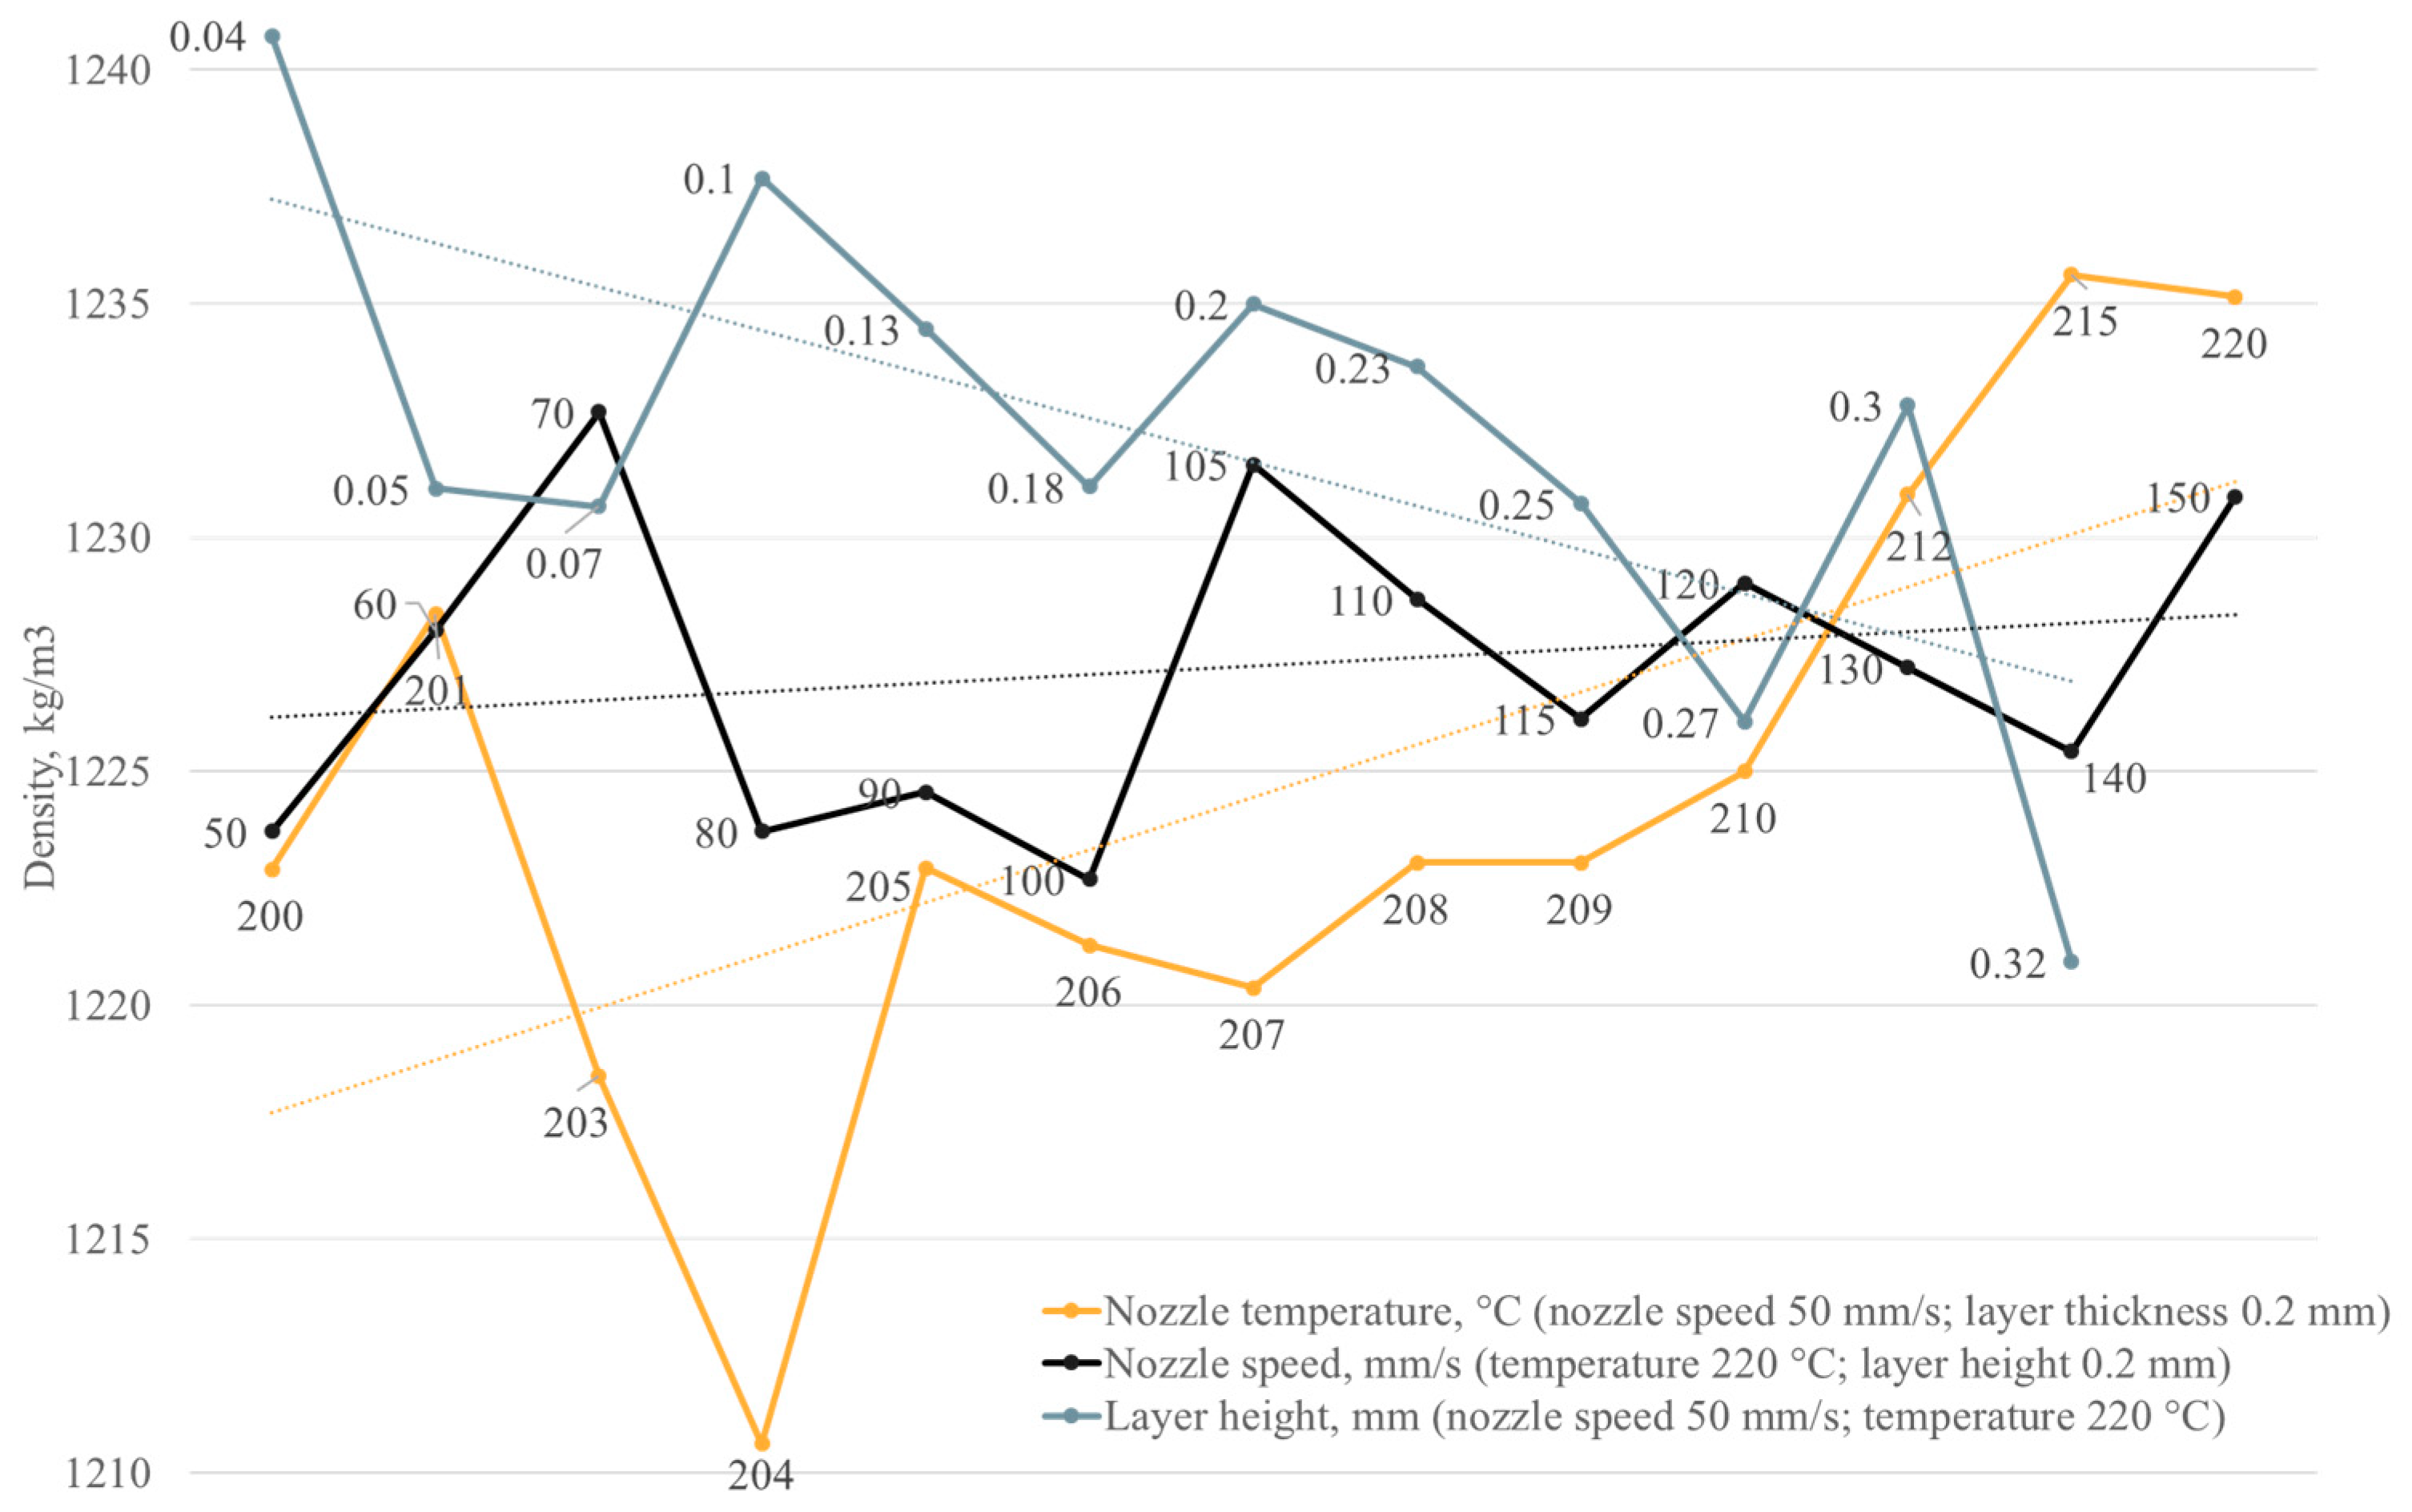
3.1. Density Measurements

The density measurements described in the previous section yielded the experimental data presented in Figure 5. The collected data show that an increase in printing temperature corresponded to an increase in the material’s density, while an increase in layer height, on the contrary, demonstrated an inverse dependence. At the same time, the nozzle speed fluctuations, according to the experimental data, had an insignificant effect on the density of the material. Fluctuations in the specimens’ density can be caused by various factors, such as fabrication defects, such as pores, delamination, etc.; as a consequence of selected printing parameters and their combinations; as well as inconsistency in the printing process itself. The observed peak in density at 201 °C, despite the general decreasing trend in density for specimens manufactured between 203 and 210 °C, could be attributed to a specific combination of parameters at this temperature that temporarily enhanced the material’s compaction or reduced the occurrence of defects.

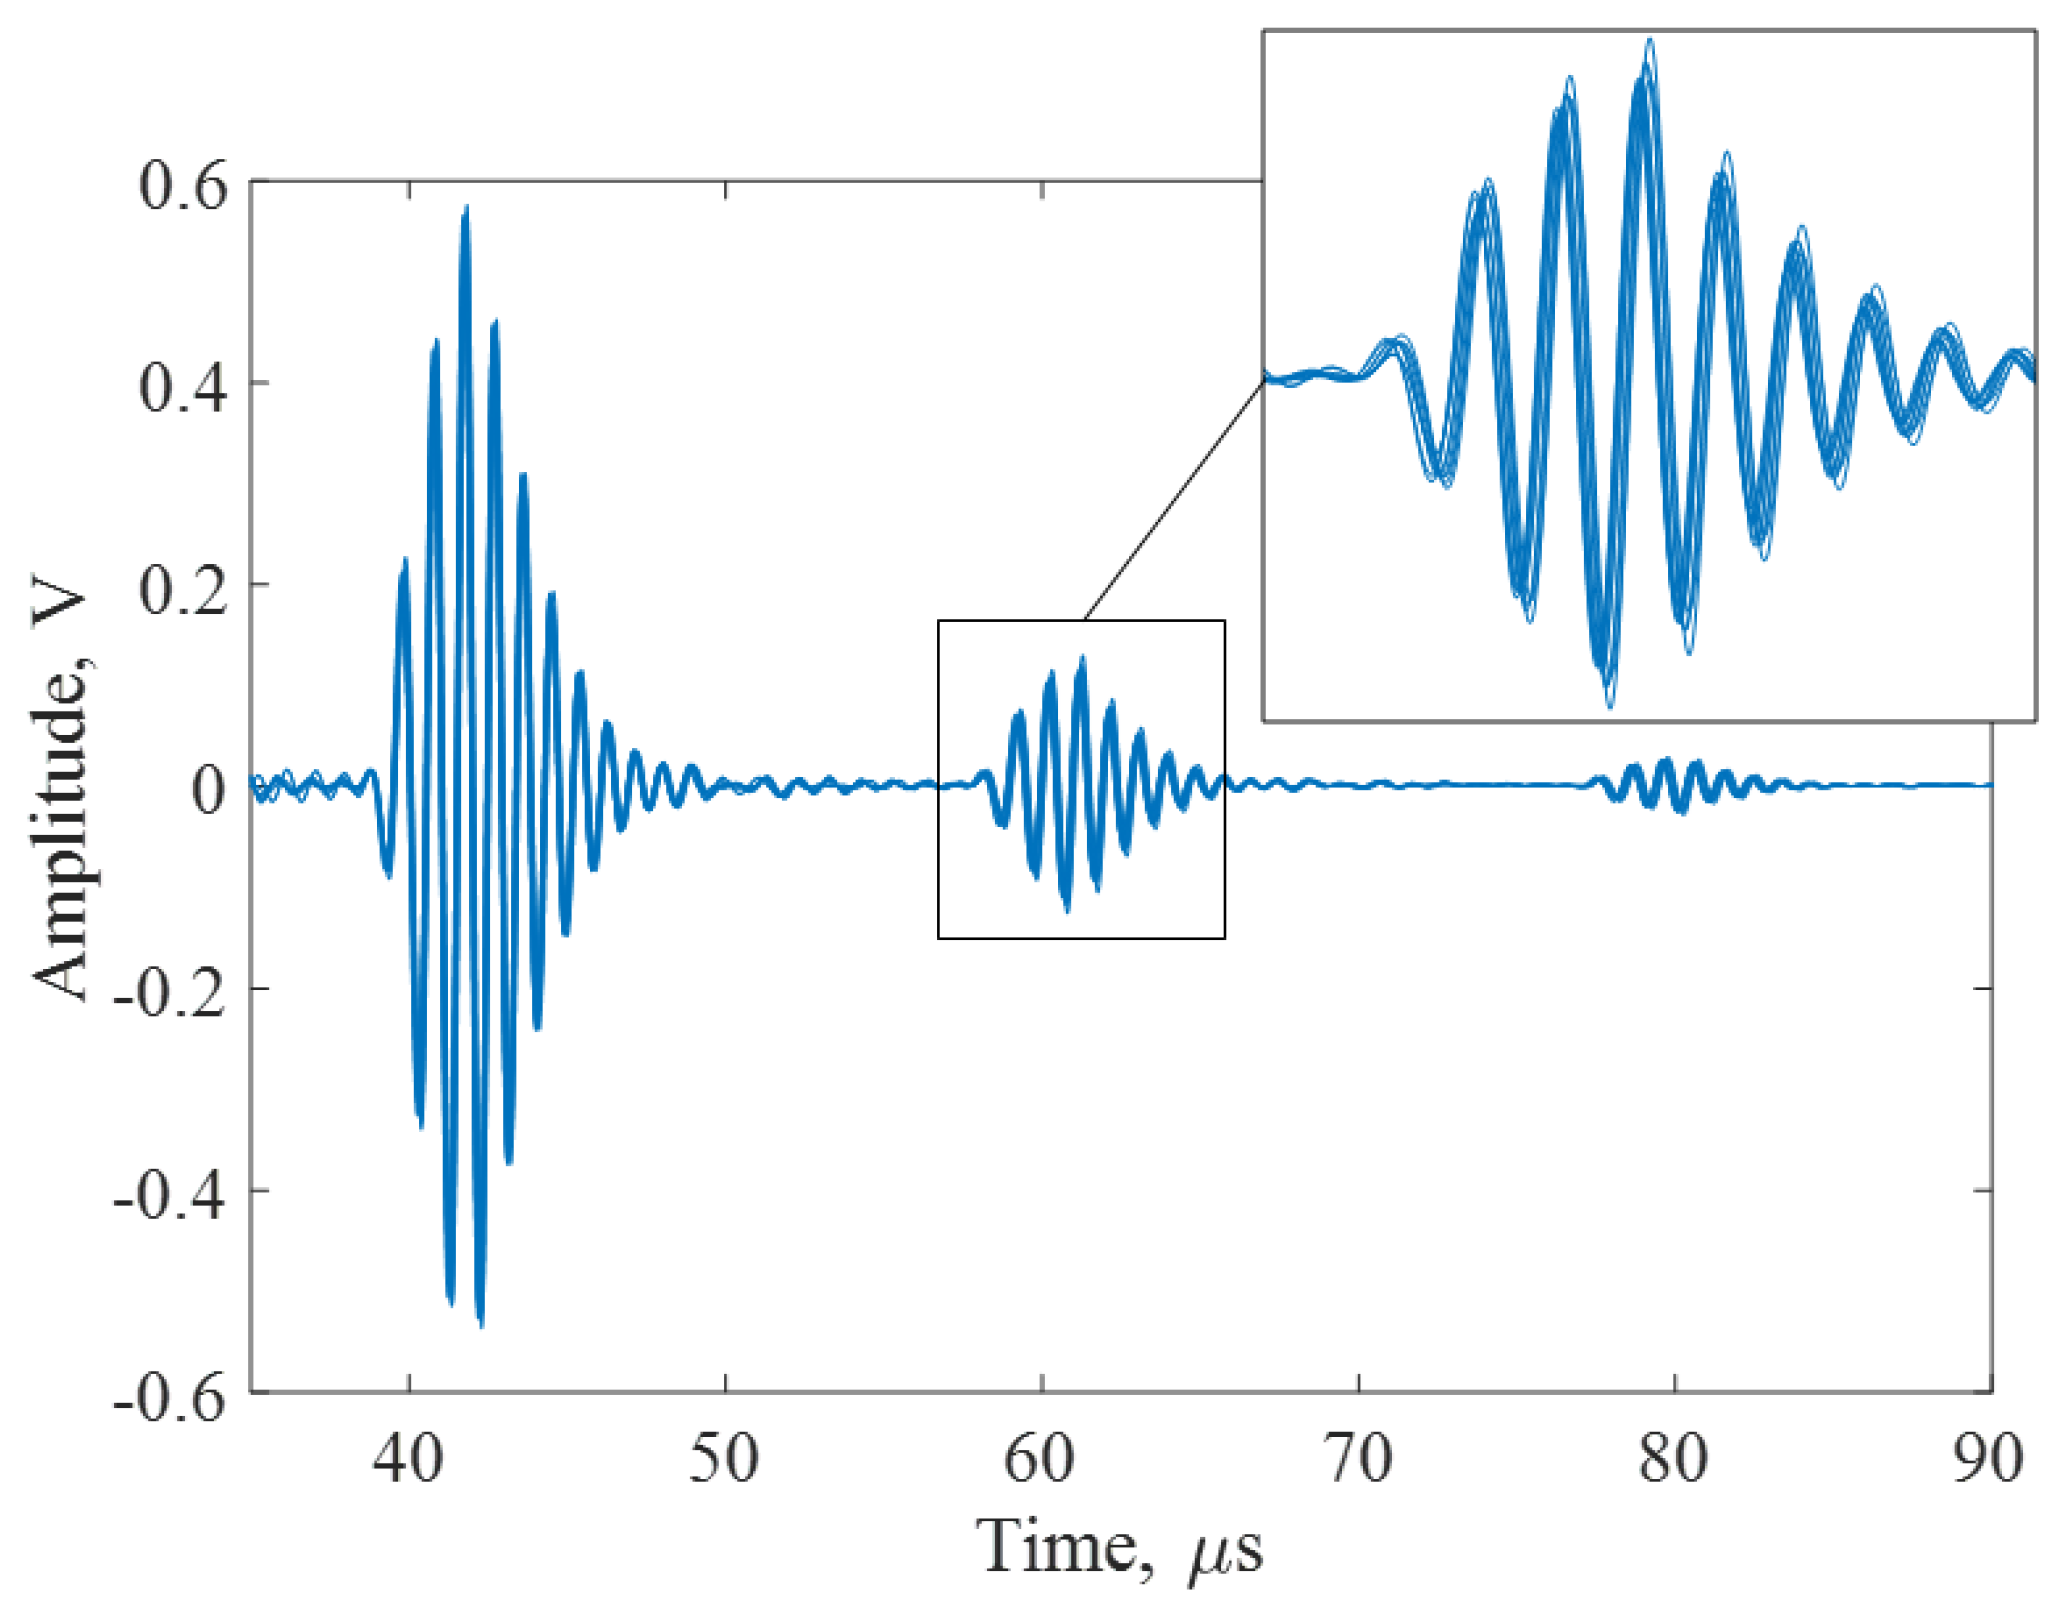
3.2. Repeatability Test

To ensure the consistency and reliability of the measurements, a repeatability study was performed for sound speed measurements using the previously described experimental setup. In this study, measurements were taken 10 times by placing the transducer in the same location on one of the printed PLA specimens. Tests were performed for both types of waves, longitudinal and shear, since both of these speeds are used for calculating the elastic properties. As a result, the mean value for longitudinal speed of sound was 2044.98 m/s with a standard deviation of 1.82, which is 0.09%. For the shear speed, the mean value was 1042.81 m/s with a standard deviation of 22.61 (2.16%). An example of a collected ultrasonic signal is illustrated in Figure 6. The variation in the received signals may be caused by the slight variability in contact pressure between the sensor and the specimen, which is difficult to control and maintain at the same level. The force with which the sensor is pressed against the specimen affects the thickness of the bonding medium, which is likely to cause variations in the signal.

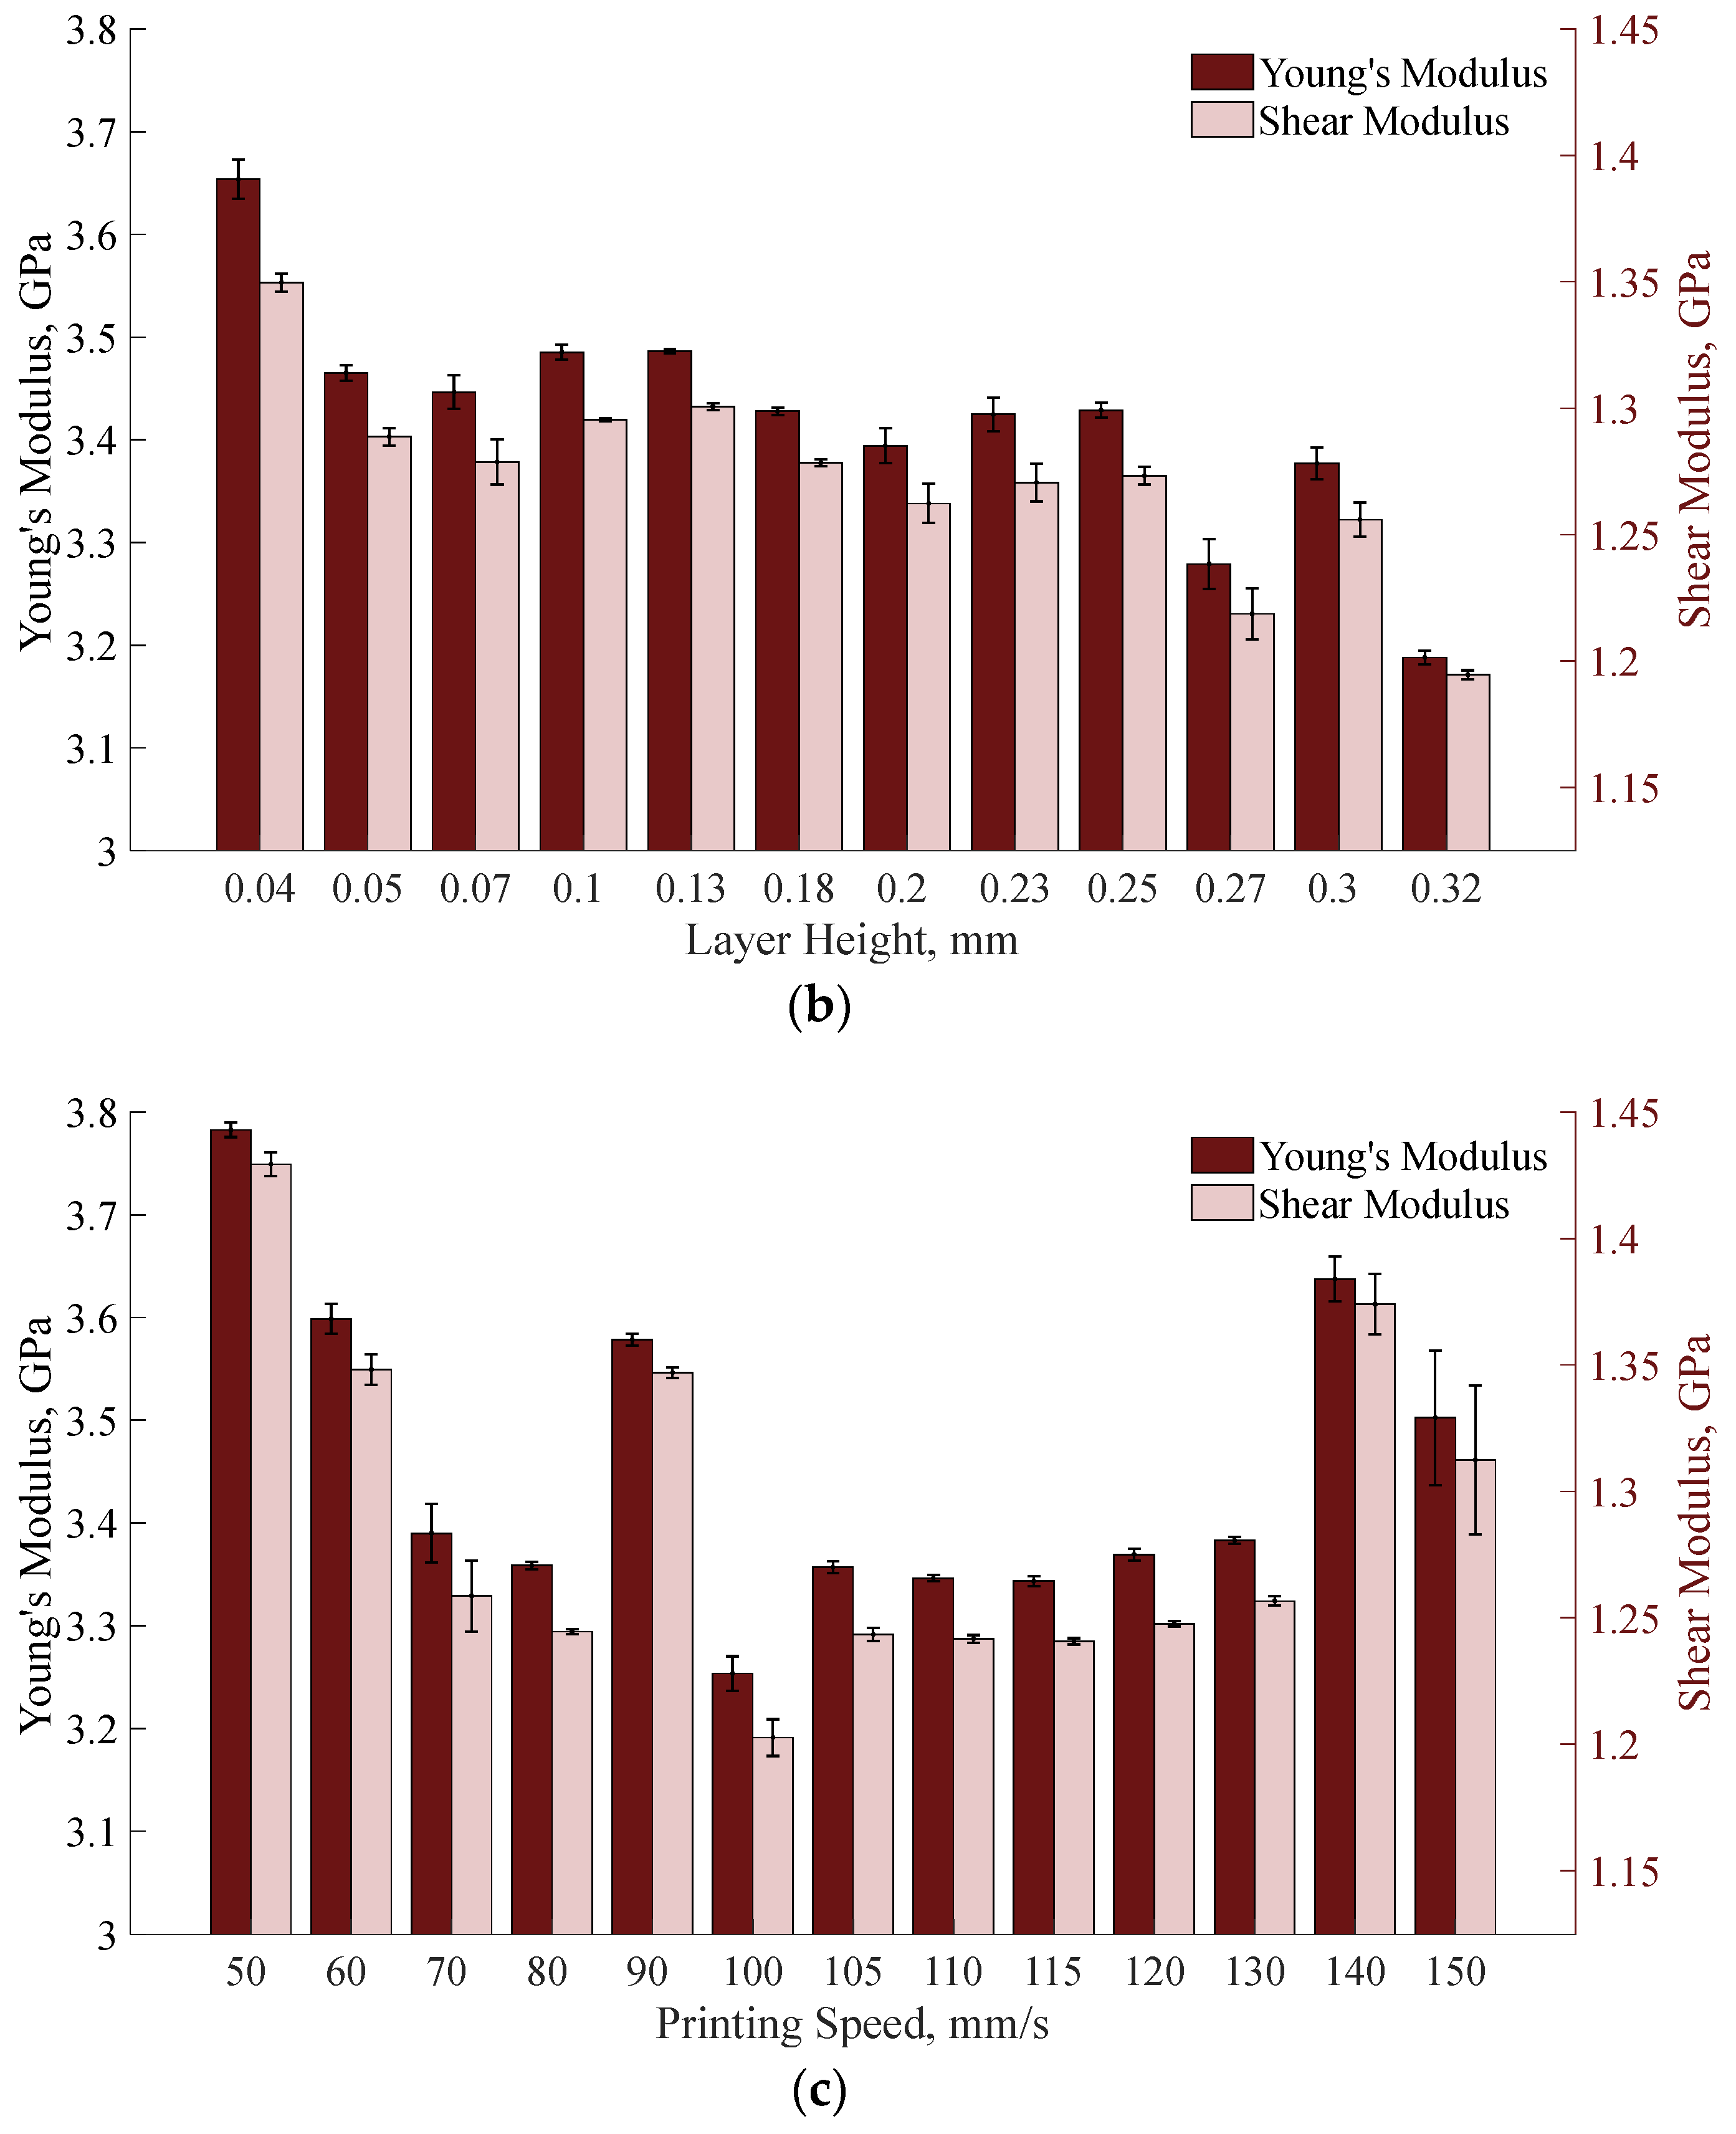
3.3. Speed of Sound as a Function of Printing Parameters

Bar charts showing the dependence of longitudinal and shear sounds speeds on nozzle temperature, layer height, and nozzle speed are shown in Figure 7. The error bars on the plots indicate the standard deviation of a single data set. While an increase in nozzle temperature seemed to result in a higher sound speed, the relationship between layer height and sound speed was inversely proportional. Meanwhile, there was no discernible trend in sound speed with increasing nozzle speed.
Bar charts illustrating the dependence of the calculated Young’s and shear moduli on the nozzle temperature, layer height, and nozzle speed are shown in Figure 8. Figure 8 suggests that increasing the nozzle temperature results in better specimen elastic properties, and increasing the layer height resulted in a lower PLA stiffness. This can be attributed to certain reasons. A higher nozzle temperature results in better melting and flow of the PLA filament, which leads to improved interlayer adhesion and reduced porosity, which in turn increases the overall stiffness of the printed specimens. Conversely, an increase in layer height leads to an increase in porosity in the printed structure. A greater layer thickness, as well as lower temperature, can lead to incomplete bonding of the layers, resulting in voids and weakened bonds. In addition, higher layer heights and lower nozzle temperatures lead to larger inhomogeneities and defects such as gaps and delamination, which reduces the stiffness of the material. Conversely, variations in nozzle speed did not present a clear pattern of changes in the elastic moduli.
Poisson’s ratios were calculated using Equation (3) and the results are provided in Table 2. Poisson’s ratio is a function of both longitudinal and shear speeds of sound. The interrelationship between these sound speeds defines the value of the Poisson’s ratio and, in the printed material, this interrelationship is contingent upon the internal structure of the material such as pores, defects, the quality of the bonding between the layers, etc. Provided that both longitudinal and shear sound speeds follow similar trends, the Poisson’s ratio yields comparable dependencies.
The experimental measurements of the specimens’ density and sound speed, although performed independently of each other, revealed similar trends in response to the varying printing parameters. The observed trends suggest a consistent relationship between the structural characteristics of the printed material and the parameters used in the printing process.
The longitudinal wave velocity is influenced by the Young’s modulus and density (Equation (4)). An increase in the velocity of longitudinal waves correlated with an increase in the Young’s modulus of the material. The shear wave velocity depends on the shear modulus and density of the material (Equation (5)). The experimental results confirm this by showing that the shear modulus increased with increasing shear wave velocity and vice versa.

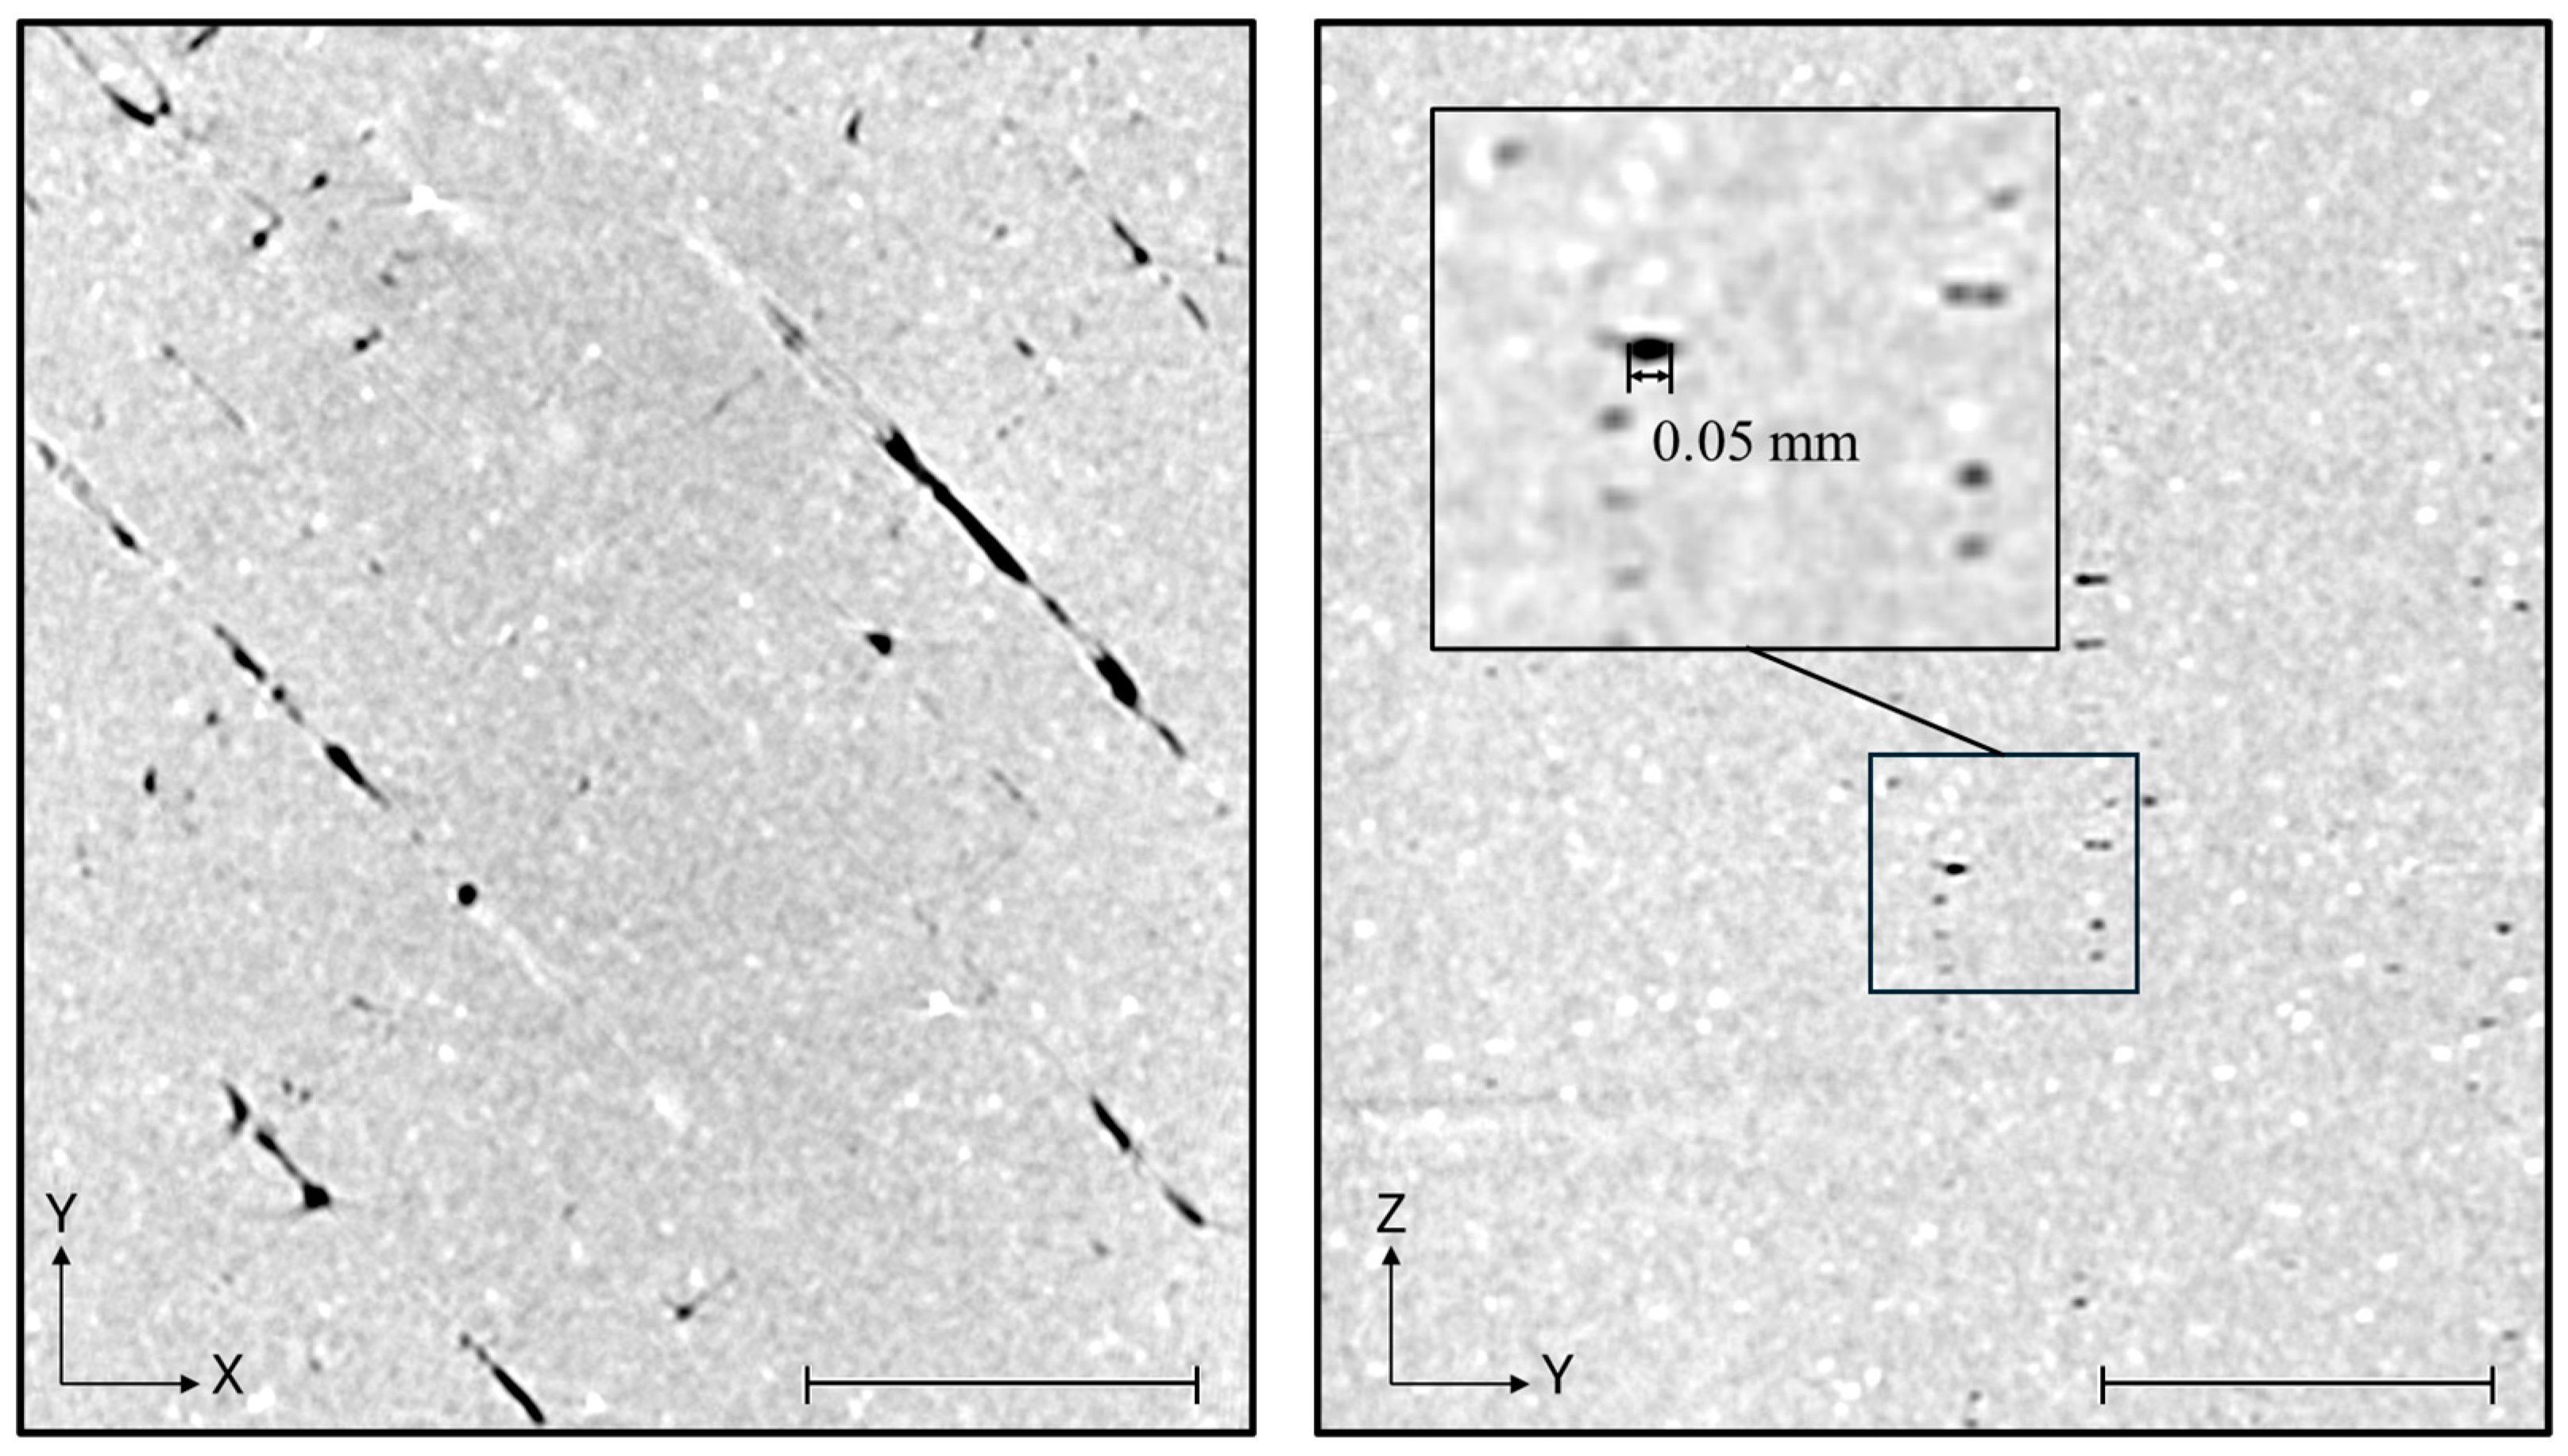
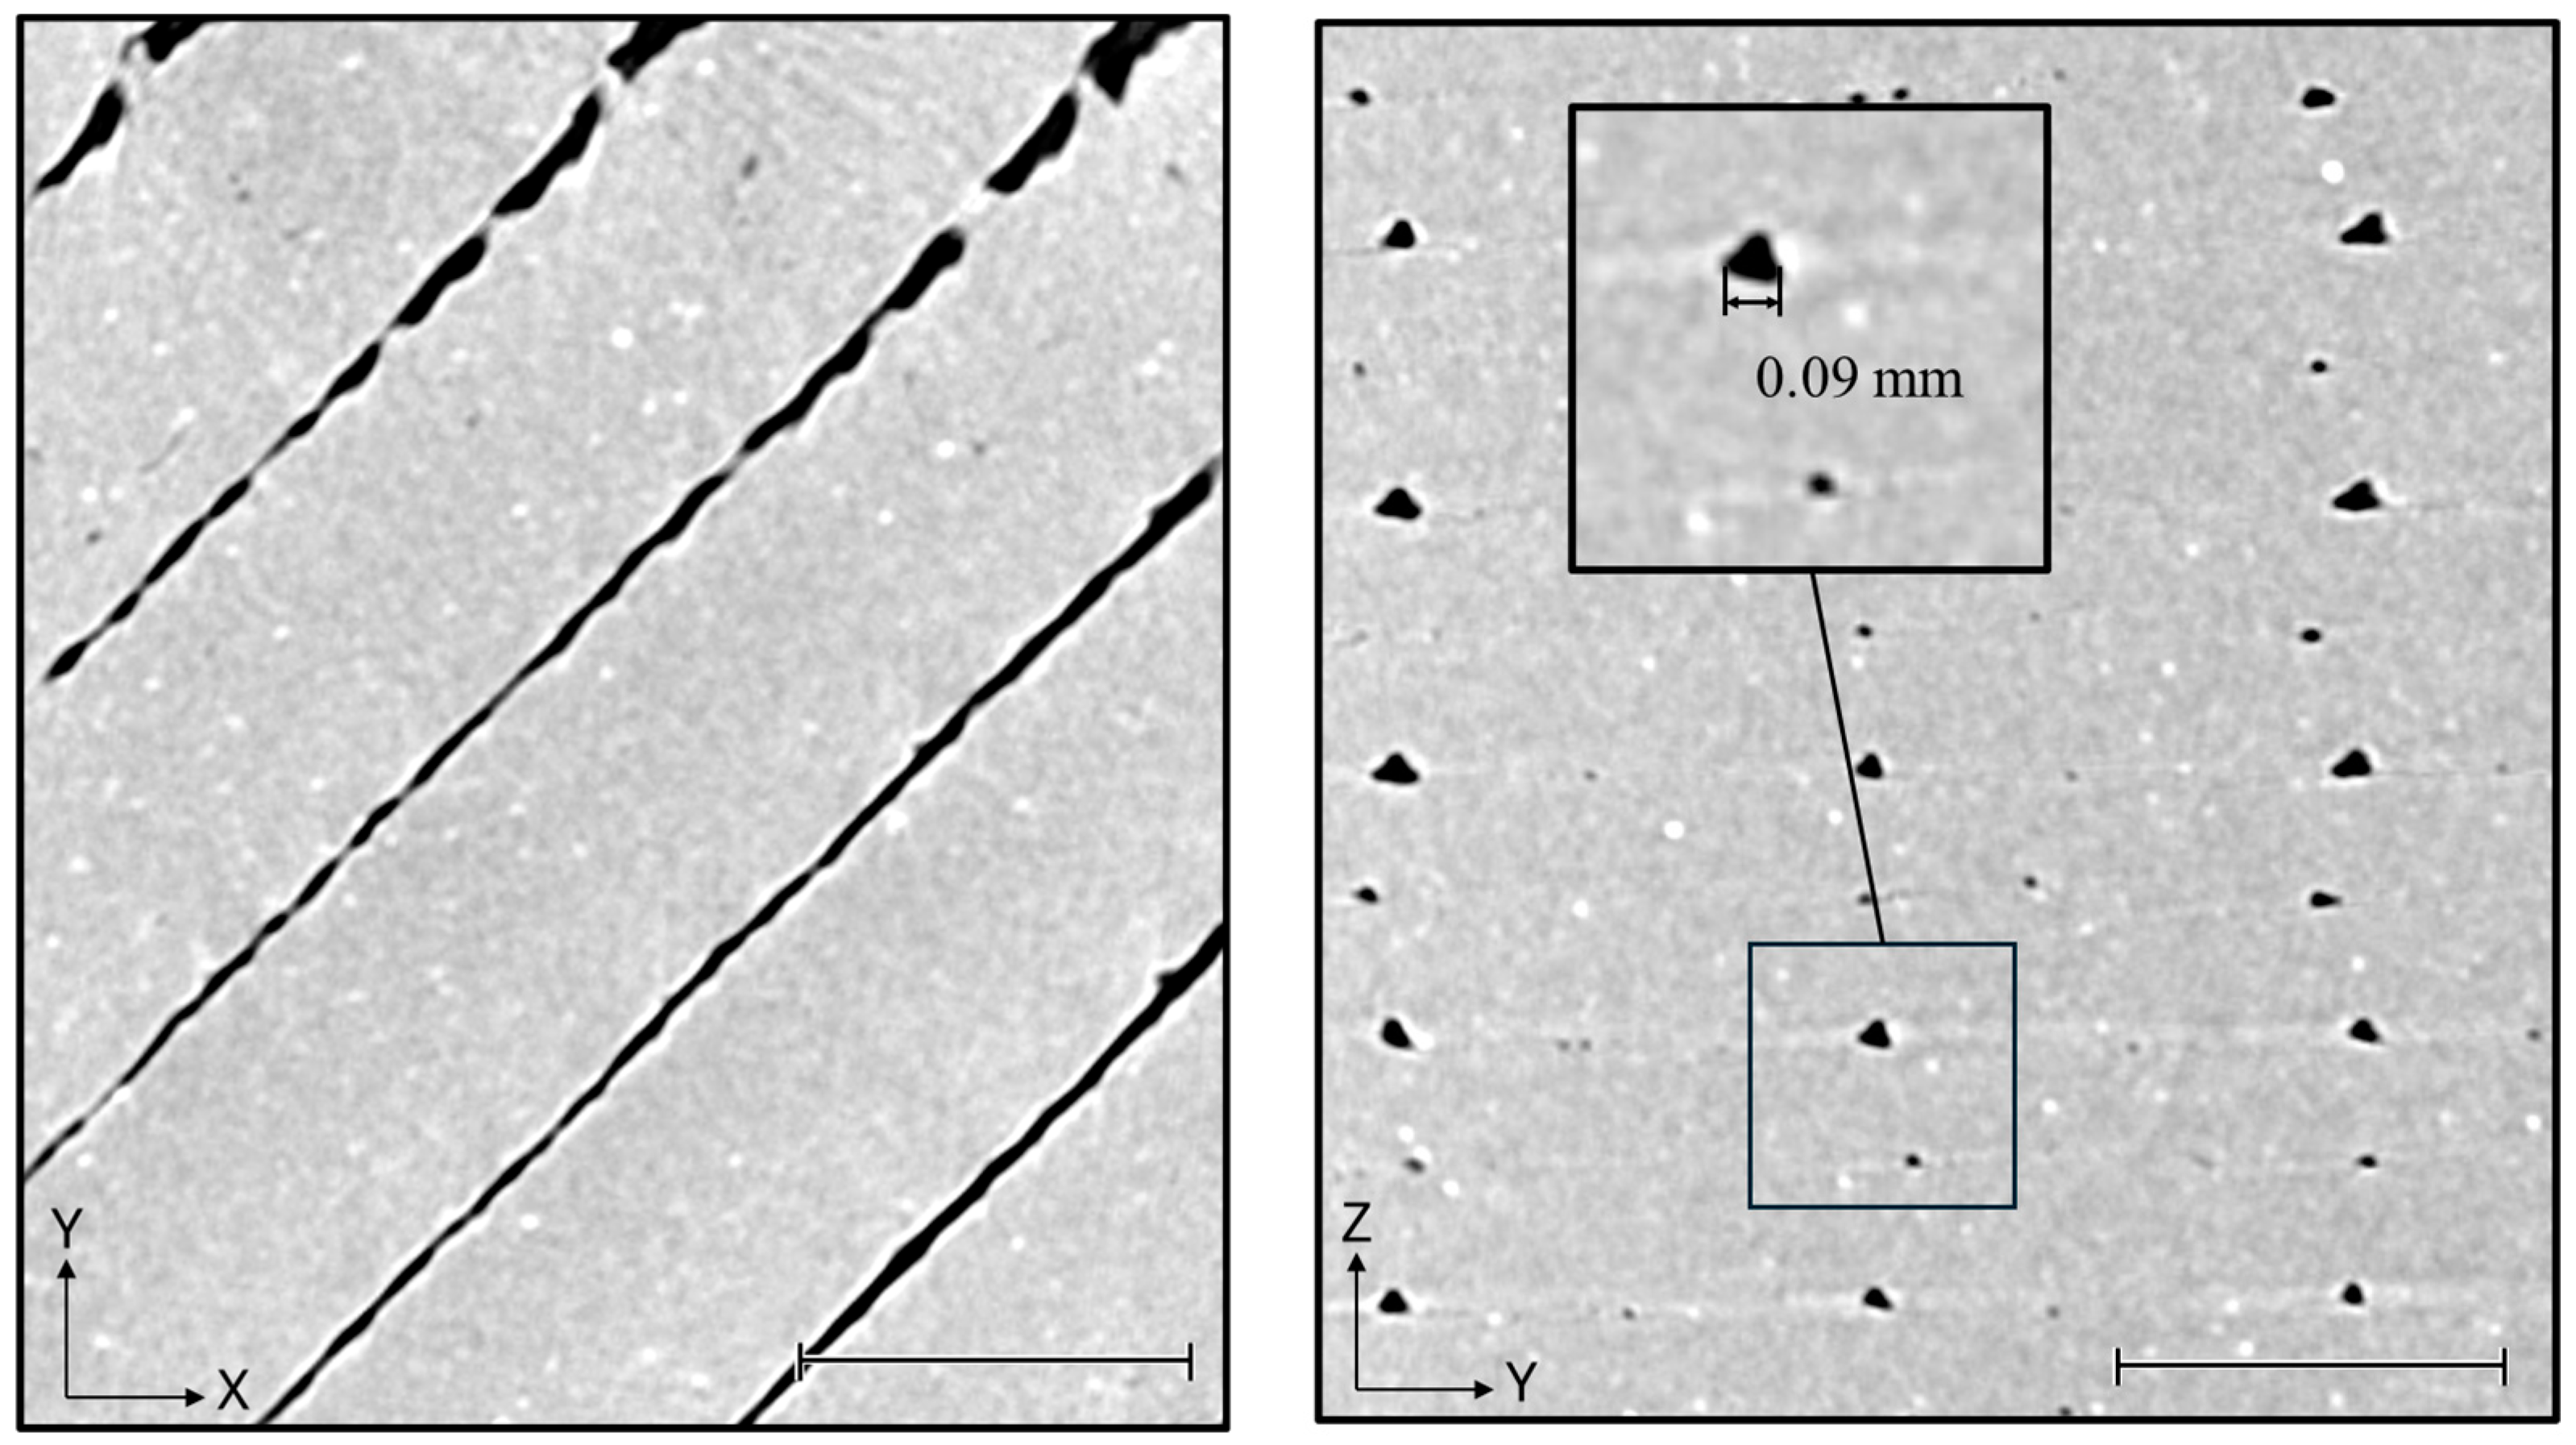
3.4. Investigation of the Internal Structure of Printed PLA Specimens

3.4.1. Porosity Measurements

The porosity fraction of the samples was calculated using ORS Dragonfly and are presented in Table 3. ORS Dragonfly computes the volume of the pores by segmenting the CT data to create two regions of interest. One region corresponds to the solid fraction, where all cavities are removed to retain a single solid block. The second region of interest corresponds to the pores, and the software counts the number of voxels in both regions of interest for comparison, as depicted in Figure 9. The lower gray value in between the peaks of the histogram was used as a threshold to separate pores from the bulk PLA material. The pore volume fraction was calculated as the ratio of the number of voxels below the threshold to the total number of voxels representing the scanned sample.

3.4.2. Establishing the Relationship between Printing Process Parameters and Internal Structure

Figure 10 and Figure 11 show cross-sections of specimens printed with a layer height of 0.04 mm and 0.32 mm, respectively. In both cases, pores are clearly visible as black dots and lines in Figure 10 and Figure 11. Pores were observed in both cases in between the printed layers. The pores between the layers had a channel shape and could be observed in the x-y views. In the sample printed with a layer height of 0.32 mm, these gaps had a triangular shape in the cross-section, which was previously described in the work [41]. The diameter of the circle describing the cross-section of these pores is approximately 0.09 mm. In the sample printed with a layer height of 0.04 mm, the pores mostly had a round-shaped cross-section with a diameter of 0.05 mm.
The total porosity of the specimens printed with a layer height of 0.04 mm and 0.32 mm was 0.38% and 0.65%, respectively.

4. Conclusions

This paper presented an investigation into the relationship between the printing process parameters and the elastic properties of PLA. The study offers insights into how printing parameters—printing temperature, speed, and layer height—influence the printed material’s characteristics such as Young’s modulus, shear modulus, and Poisson’s ratio. The experimental data showed that nozzle temperature, layer height, and nozzle speed had different effects on the density and stiffness of the PLA specimens. Increasing the printing temperature corresponded to an increase in material density and the elastic properties of the material. In contrast, increasing the layer height led to a decrease in both density and the elastic properties of the material, suggesting that thicker layers result in less dense and less stiff structures. However, the variations in nozzle speed had a negligible effect on density and did not show a notable effect on the elastic moduli.
Also, the examination of the correlation between the printing process parameters and internal structure was performed for two opposing cases of the minimum and maximum printing layer height. Through the analysis of the CT scans, pores were clearly visible in the samples, regardless of the height of the layer used in the printing process. However, the pore size was different for different layer heights.
The study demonstrated that ultrasonic testing is effective in measuring the elastic properties of PLA materials. One significant advantage of this method is its ability to be used in real time, which enhances the potential for quality control in additive manufacturing.

Author Contributions

Conceptualization, A.Z., B.D. and M.P.; methodology, M.P. and F.B.A.; software, M.P. and F.B.A.; validation, M.P. and F.B.A.; writing—original draft preparation, M.P., F.B.A., B.D. and A.Z. All authors have read and agreed to the published version of the manuscript.

Funding

This research is based upon work supported by the National Aeronautics and Space Administration under the NASA Cooperative Agreement No. NM-80NSSC20M0215 and the Army Research Office under grant No. W911NF2110138.

Institutional Review Board Statement

Not applicable.

Informed Consent Statement

Not applicable.

Data Availability Statement

The original contributions presented in the study are included in the article, further inquiries can be directed to the corresponding author.

Conflicts of Interest

The authors declare no conflicts of interest.

References

  1. Mazurchevici, A.D.; Nedelcu, D.; Popa, R.; Asachi, G. Additive manufacturing of composite materials by FDM technology: A review. Indian J. Eng. Mater. Sci. 2020, 27, 179–192. [Google Scholar]
  2. Bernard, A.; Fischer, A. New Trends in Rapid Product Development. CIPR Ann. 2002, 51, 635–652. [Google Scholar] [CrossRef]
  3. Kumaresan, R.; Mahendran, S.; Kumaran, K.; Harun, W.S.W.; Mustafizur, R. Fused deposition modeling: Process, materials, parameters, properties, and applications. Int. J. Adv. Manuf. Tech. 2022, 120, 1531–1570. [Google Scholar]
  4. Mohd Pu’ad, N.A.S.; Haq, R.A.; Noh, H.M.; Abdullah, H.Z.; Idris, M.I.; Lee, T.C. Review on the fabrication of fused deposition modelling (FDM) composite filament for biomedical applications. Mater. Today Proc. 2020, 29, 228–232. [Google Scholar] [CrossRef]
  5. Chacon, J.M.; Caminero, M.A.; Garcia-Plaza, E.; Nunez, P.J. Additive manufacturing of PLA structures using fused deposition modelling: Effect of process parameters on mechanical properties and their optimal selection. Mater. Des. 2017, 124, 143–157. [Google Scholar] [CrossRef]
  6. Liu, Y.; Bai, W.; Cheng, X.; Tian, J.; Wei, D.; Sun, Y.; Di, P. Effects of printing layer thickness on mechanical properties of 3D-printed custom trays. J. Prosthet. Dent. 2021, 126, 671.e1–671.e7. [Google Scholar] [CrossRef] [PubMed]
  7. Sood, A.K.; Ohdar, R.K.; Mahapatra, S.S. Parametric appraisal of mechanical property of fused deposition modelling processed parts. Mater. Des. 2010, 31, 287–295. [Google Scholar] [CrossRef]
  8. Coppola, B.; Cappetti, N.; Di Maio, L.; Scarfato, P.; Incarnato, L. 3D Printing of PLA/clay Nanocomposites: Influence of Printing Temperature on Printed Samples Properties. Materials 2018, 11, 1947. [Google Scholar] [CrossRef] [PubMed]
  9. Yang, C.; Tian, X.; Li, D.; Cao, Y.; Zhao, F.; Shi, C. Influence of thermal processing conditions in 3D printing on the crystallinity and mechanical properties of PEEK material. J. Mater. Process. Technol. 2017, 248, 1–7. [Google Scholar] [CrossRef]
  10. Pandzic, A.; Hodzic, D.; Milovanovic, A. Effect of Infill Type and Density on Tensile Properties of PLA Material for FDM Process. In Proceedings of the 30th DAAAM International Symposium, Zadar, Croatia, 23–26 October 2019; Volume 1, pp. 545–554. [Google Scholar]
  11. Valerga, A.P.; Batista, M.; Salguero, J.; Girot, F. Influence of PLA Filament Conditions on Characteristics of FDM Parts. Materials 2018, 11, 1322. [Google Scholar] [CrossRef] [PubMed]
  12. Khosravani, M.R.; Božić, Ž.; Zolfagharian, A.; Reinicke, T. Failure analysis of 3D-printed PLA components: Impact of manufacturing defects and thermal ageing. Eng. Fail. Anal. 2022, 136, 106214. [Google Scholar] [CrossRef]
  13. Wickramasinghe, S.; Do, T.; Tran, P. FDM-Based 3D Printing of Polymer and Associated Composite: A Review on Mechanical Properties, Defects and Treatments. Polymers 2020, 12, 1529. [Google Scholar] [CrossRef] [PubMed]
  14. Everton, S.K.; Dickens, P.; Tuck, C.; Dutton, B. Identification of sub-surface defects in parts produced by additive manufacturing, using laser generated ultrasound. Mater Sci. Technol. Conf. 2016, 1, 141–148. [Google Scholar]
  15. Stern, F.; Tenkamp, J.; Walther, F. Non-destructive characterization of process-induced defects and their effect on the fatigue behavior of austenitic steel 316L made by laser-powder bed fusion. Prog. Addit. Manuf. 2020, 5, 287–294. [Google Scholar] [CrossRef]
  16. Dobmann, G.; Kröning, M.; Theiner, W.; Willems, H.; Fiedler, U. Nondestructive characterization of materials (ultrasonic and micromagnetie techniques) for strength and toughness prediction and the detection of early creep damage. NDT E Int. 1995, 157, 137–158. [Google Scholar]
  17. Nadimpalli, V.K. Ultrasonic Nondestructive Evaluation of Metal Additive Manufacturing. Ph.D. Thesis, University of Louisville, Louisville, KY, USA, 2018. [Google Scholar]
  18. Stair, S.L.; Moore, D.G. Characterization and nondestructive inspection of additively manufactured materials. In Proceedings of the AIP Conference Proceedings, Burlington, VY, USA, 15–19 July 2018. [Google Scholar]
  19. Du Plessis, A.; Yadroitsev, I.; Yadroitsava, I.; Le Roux, S.G. X-Ray Microcomputed Tomography in Additive Manufacturing: A Review of the Current Technology and Applications. 3D Print. Addit. Manuf. 2018, 5, 227–247. [Google Scholar] [CrossRef]
  20. Du Plessis, A.; le Roux, S.G.; Waller, J.; Sperling, P.; Achilles, N.; Beerlink, A.; Métayer, J.F.; Sinico, M.; Probst, G.; Dewulf, W.; et al. Laboratory X-ray tomography for metal additive manufacturing: Round robin test. Addit. Manuf. 2019, 30, 100837. [Google Scholar] [CrossRef]
  21. Yang, T.; Jin, Y.; Squires, B.; Choi, T.Y.; Dahotre, N.B.; Neogi, A. In-situ monitoring and ex-situ elasticity mapping of laser induced metal melting pool using ultrasound: Numerical and experimental approaches. J. Manuf. Process. 2021, 71, 178–186. [Google Scholar] [CrossRef]
  22. Dewulf, W.; Pavan, M.; Craeghs, T.; Kruth, J.-P. Using X-ray computed tomography to improve the porosity level of polyamide-12 laser sintered parts. CIRP Ann. 2016, 65, 205–208. [Google Scholar] [CrossRef]
  23. Chadha, C.; Olaivar, G.; Mahrous, A.M.; Patterson, A.; Jasiuk, I. Exploring the Effect of Specimen Size on Elastic Properties of Fused-Filament-Fabrication-Printed Polycarbonate and Thermoplastic Polyurethane. Materials 2024, 17, 2677. [Google Scholar] [CrossRef] [PubMed]
  24. Sui, T.; Salvati, E.; Zhang, H.; Nyaza, K.; Senatov, F.; Salimon, A.; Korsunsky, A. Probing the complex thermo-mechanical properties of a 3D-printed polylactide-hydroxyapatite composite using in situ synchrotron X-ray scattering. J. Adv. Res. 2019, 16, 113–122. [Google Scholar] [CrossRef] [PubMed]
  25. Bartlett, J.L.; Heim, F.M.; Murty, Y.V.; Li, X. In situ defect detection in selective laser melting via full-field infrared thermography. Addit. Manuf. 2018, 24, 595–605. [Google Scholar] [CrossRef]
  26. Rieder, H.; Dillhoefer, A.; Spies, M.; Bamberg, J.; Heß, T. Online Monitoring of Additive Manufacturing Processes Using Ultrasound. In Proceedings of the 11th European Conference on Non-Destructive Testing, Prague, Czech Republic, 6–11 October 2014. [Google Scholar]
  27. Huang, N.; Cook, O.J.; Smithson, R.L.; Kube, C.M.; Argüelles, A.P.; Beese, A.M. Use of ultrasound to identify microstructure-property relationships in 316 stainless steel fabricated with binder jet additive manufacturing. Addit. Manuf. 2022, 51, 102591. [Google Scholar] [CrossRef]
  28. Yang, C.-H.; Jeyaprakash, N.; Chan, C.-K. Inhomogeneous mechanical properties in additively manufactured parts characterized by nondestructive laser ultrasound technique. NDT E Int. 2020, 116, 102340. [Google Scholar] [CrossRef]
  29. Czink, S.; Dietrich, S.; Schulze, V. Ultrasonic evaluation of elastic properties in laser powder bed fusion manufactured AlSi10Mg components. NDT E Int. 2022, 132, 102729. [Google Scholar] [CrossRef]
  30. Bento, J.B.; Lopez, A.; Pires, I.; Quintino, L.; Santos, T.G. Non-destructive testing for wire + arc additive manufacturing of aluminium parts. Addit. Manuf. 2019, 29, 100782. [Google Scholar] [CrossRef]
  31. Chen, Y.; Peng, X.; Kong, L.; Dong, G.; Remani, A.; Leach, R. Defect inspection technologies for additive manufacturing. Int. J. Extreme Manuf. 2021, 3, 022002. [Google Scholar] [CrossRef]
  32. Rieder, H.; Dillhöfer, A.; Spies, M.; Bamberg, J.; Hess, T. Ultrasonic online monitoring of additive manufacturing processes based on selective laser melting. In Proceedings of the 41st Annual Review of Progress in Quantitative Nondestructive Evaluation, Boise, ID, USA, 20–25 July 2015. [Google Scholar]
  33. ASTM Standard C1161-02; Standard Test Method for Flexural Strength of Advanced Ceramics at Ambient Temperature. ASTM International: West Conshohocken, PA, USA, 2017.
  34. ISO 178:2019; Plastics—Determination of Flexural Properties. International Organization for Standardization: Geneva, Switzerland, 2019.
  35. Kumar, R.S.; Sridhar, S.; Venkatraman, R.; Venkatesan, M. Polymer additive manufacturing of ASA structure: Influence of printing parameters on mechanical properties. Mater. Today 2021, 39, 1316–1319. [Google Scholar]
  36. Ćwikła, G.; Grabowik, C.; Kalinowski, K.; Paprocka, I.; Ociepka, P. The influence of printing parameters on selected mechanical properties of FDM/FFF 3D-printed parts. IOP Conf. Ser. Mater. Sci. Eng. 2017, 227, 012033. [Google Scholar] [CrossRef]
  37. Samykano, M.; Selvamani, K.; Kadirgama, K.; Ngui, W.K.; Kanagaraj, G.; Sudhakar, K. Mechanical property of FDM printed ABS: Influence of printing parameters. Int. J. Adv. Manuf. Technol. 2019, 102, 2779–2796. [Google Scholar] [CrossRef]
  38. Doshi, M.; Mahale, A.; Kumar Singh, S.; Deshmukh, S. Printing parameters and materials affecting mechanical properties of FDM-3D printed Parts: Perspective and prospects. Mater. Today 2022, 50, 2269–2275. [Google Scholar] [CrossRef]
  39. Yan, X.-L.; Dong, S.-Y.; Xu, B.-S.; Cao, Y. Progress and Challenges of Ultrasonic Testing for Stress in Remanufacturing Laser Cladding Coating. Materials 2018, 11, 293. [Google Scholar] [CrossRef] [PubMed]
  40. Ledbetter, H.M. Elastic Properties in Materials at Low Temperatures; Reed, R.P., Clark, A.F., Eds.; American Society for Metals: Metals Park, OH, USA, 1983; pp. 1–45. [Google Scholar]
  41. Liao, Y.; Liu, C.; Coppola, B.; Barra, G.; Di Maio, L.; Incarnato, L.; Lafdi, K. Effect of Porosity and Crystallinity on 3D Printed PLA Properties. Polymers 2019, 11, 1487. [Google Scholar] [CrossRef] [PubMed]
Figure 1. Printed specimens. Arrow shows the build direction.
Applsci 14 07639 g001
Figure 2. Experimental setup.
Applsci 14 07639 g002
Figure 3. The process of adjusting the signal.
Applsci 14 07639 g003
Figure 4. Example of the longitudinal signal and time of flight measurement approach. The envelope for the signal is shown by the blue dashed line.
Applsci 14 07639 g004
Figure 5. Effects of printing parameters on density of PLA specimens. The trend for each group of specimens is shown by the dotted line.
Applsci 14 07639 g005
Figure 6. Longitudinal signals collected during repeatability test.
Applsci 14 07639 g006
Figure 7. Longitudinal and shear speeds of sound within the PLA specimens as functions of (a) nozzle temperature, (b) layer height, and (c) nozzle speed.
Applsci 14 07639 g007aApplsci 14 07639 g007b
Figure 8. Calculated Young’s and shear moduli of PLA specimens as functions of (a) nozzle temperature, (b) layer height, and (c) nozzle speed.
Applsci 14 07639 g008aApplsci 14 07639 g008b
Figure 9. Three-dimensional visualization shows the location, shape, and size of pores within a specimen printed with a layer thickness of 0.32 mm. The color of the pores corresponds to the maximum length between two points within each pore.
Applsci 14 07639 g009
Figure 10. Cross-sections obtained via X-ray computed tomography showing PLA specimen printed with layer height of 0.04 mm. Z-axis is the build direction; the XY plane is the layer plane. Scale bar length is 1 mm.
Applsci 14 07639 g010
Figure 11. Cross-sections obtained via X-ray computed tomography showing PLA specimen printed with layer height of 0.32 mm. Z-axis is the build direction; the XY plane is the layer plane. Scale bar length is 1 mm.
Applsci 14 07639 g011
Table 1. Printing process parameters used for the specimen manufacturing.
ParameterS1S2S3S4S5S6S7S8S9S10S11S12S13
Nozzle speed, mm/s
(nozzle temperature: 220 °C; layer height: 0.2 mm)
5060708090100105110115120130140150
ParameterT1T2T3T4T5T6T7T8T9T10T11T12T13
Nozzle temperature, °C
(nozzle speed: 50 mm/s; layer height: 0.2 mm)
200201203204205206207208209210212215220
ParameterTH1TH2TH3TH4TH5TH6TH7TH8TH9TH10TH11TH12
Layer height, mm
(nozzle temperature: 220 °C; nozzle speed: 50 mm/s)
0.040.050.070.10.130.180.20.230.250.270.30.32
Table 2. Poisson’s ratios for indicated printing parameters, calculated using Equation (3).
Nozzle speed, mm/s
(nozzle temperature: 220 °C; layer height: 0.2 mm)
5060708090100105110115120130140150
Poisson’s ratio0.3230.3340.3460.3490.3270.3510.3510.3470.3470.3500.3460.3240.337
Nozzle temperature, °C
(nozzle speed: 50 mm/s; layer height: 0.2 mm)
200201203204205206207208209210212215220
Poisson’s ratio0.3460.3510.3430.3540.3510.3530.3510.3490.3490.3460.3600.3460.356
Layer height, mm
(nozzle temperature: 220 °C; nozzle speed: 50 mm/s)
0.040.050.070.10.130.180.20.230.250.270.30.32
Poisson’s ratio0.3540.3440.3480.3450.3400.3410.3440.3480.3460.3450.3440.334
Table 3. Porosity of the scanned PLA samples.
SpecimenPorosity, %
TH10.38
TH120.65
S11.63
S130.76
T10.98
T130.29
Disclaimer/Publisher’s Note: The statements, opinions and data contained in all publications are solely those of the individual author(s) and contributor(s) and not of MDPI and/or the editor(s). MDPI and/or the editor(s) disclaim responsibility for any injury to people or property resulting from any ideas, methods, instructions or products referred to in the content.

