Article

Effect of the Printing Scenario on the Dimensional Accuracy and the Tensile Strength of Different Colored PLA Specimens Produced by Fused Deposition Modeling

1
Department of Engineering Science, Babeș-Bolyai University, Traian Vuia Square 1–4, 320085 Reșița, Romania
2
Department of Business Administration Reșița, Babeș-Bolyai University, Traian Vuia Square 1–4, 320085 Reșița, Romania
3
Institute of Mechanical Engineering, Westphalian University of Applied Sciences Gelsenkirchen Bocholt Recklinghausen, Neidenburger str. 43, 45897 Gelsenkirchen, Germany
*
Authors to whom correspondence should be addressed.
Appl. Sci. 2024, 14(17), 7642; https://doi.org/10.3390/app14177642
Submission received: 26 July 2024 / Revised: 22 August 2024 / Accepted: 27 August 2024 / Published: 29 August 2024
(This article belongs to the Special Issue Recent Advances in 3D Printing and Additive Manufacturing Technology)

Abstract

:
Dimensional accuracy and mechanical properties of components printed by fused deposition modeling (FDM) are influenced by several process parameters. In this paper, the authors targeted the effect of the printing scenario and the PLA (polylactic acid) color on parts’ quality. Three scenarios were analyzed: individually printing, simultaneously printing of three, respective five specimens of natural (transparent), red, grey, and black PLA. The temperature variations of successive deposited layers were recorded for the black PLA. The dimensional accuracy of tensile specimens was evaluated, tensile tests were performed, and the results were correlated with the mesostructure of the prints. The effect of the independent variables on the measured parameters was analyzed by ANOVA. The experiments revealed differences for the same printing scenario regarding cross-section area (up to 5.71%) and tensile strength (up to 10.45%) determined by the material color. The number of specimens printed simultaneously and the position of the specimens on the build plate were found to influence too, but less than the color. Thus, increasing from one to five the number of specimens printed at a time altered both the dimensional accuracy (up to 3.93% increase of the cross-section area) and the tensile strength (up to 3.63% reduction).

1. Introduction

The transition of additive manufacturing (AM) from a prototyping tool to a rapid fabrication tool [1,2] implicitly brought to attention the necessity of ensuring the process repeatability in terms of mechanical properties, surface quality and dimensional accuracy of the printed products.
Being one of the most widely used AM technologies [3,4], the Fused Deposition Modeling (FDM) method presents, among others, the advantage of an impressive number of process variables that can be individually set by the users [5,6]. But on the other hand, one has to consider that finding the optimal combination of these numerous printing parameters, in order to meet the product requirements, is often a complex challenge.
Several studies have been carried out to characterize the influence of the FDM process parameters on the mechanical properties, dimensional accuracy and surface quality of 3D printed parts made of polymers. The most analyzed parameters are [5,7,8]:
-
layer thickness;
-
printing head temperature;
-
build plate temperature;
-
printing speed;
-
build orientation;
-
infill pattern and density;
-
raster angle.
The adhesion of successive layers deposited by the FDM method is influenced by the temperature variations of the deposited material [9]. These variations are related with the print head temperature and the build plate temperature, but are also influenced by the print speed, the layer thickness, the infill, the time interval between deposition of material on two successive layers and the air flow in the printing workspace [5].
Rudolph et al. [10] pointed out that the “weld” line between two successive filament depositions (within and between layers) has been identified as one of the major factors influencing the mechanical properties of FDM printed components.
Liparroti et al. [11] showed that the layers closest to the heated build plate have a denser structure with fewer pores (cooling of these layers occurs more slowly). Differences between the periphery and the central part of the pieces are also highlighted, with the central part having a higher level of crystallinity.
Corson et al. [12] analyzed the variation of the thermal field generated by the printhead and the cooling cycles, showing its influence on the previously deposited layer.
Vanaei et al. [13] measured the temperature of the deposited filament for 1 min after deposition, using an 80 µm thermocouple. Three printing cases were analyzed with the build plate temperature set to 50 °C, 70 °C and 100 °C. A cyclic variation of the temperature of the deposited filament was observed, with a tendency to stabilize after 1 min. It should be noted that the monitoring was carried out on a specimens built on the Z-axis with only one line per layer (vertical one-line wall part).
The printing speed influences the time interval between deposition of material on two successive layers in the same area of the part. This time interval is also dependent on factors less studied: the size of the printed part and the number of pieces printed simultaneously. To define this issue more clearly, we could imagine the following printing scenarios of cubic specimens with 100% infill, manufactured with the same values of the process parameters:
(a)
Individual printing of a cube with base area equal to A;
(b)
Individual printing of a cube with base area equal to 2A;
(c)
Simultaneous printing of two cubes, each with base area equal to A.
The time interval between the deposition of material in two successive layers in the same area of the part (or the time interval required to make a complete layer) will be double for the cases described in points (b) and (c), compared to the situation described in point (a). Increasing the area of the base of the cube by a factor of two has the same effect on time as a reduction of the printing speed by half. Thus, it is necessary to investigate the effect of the number of parts printed simultaneously (or size of printed part) on local temperature variations and on interlayer adhesion.
Askanian et al. [14] analyzed PLA tensile specimens (25 mm length, 4 mm width, 2 mm thickness) printed in two scenarios: individual printing of each specimen and simultaneously printing of 15 specimens with three build orientations (5 × YXZ, 5 × YZX and 5 specimens rotated with 45° degrees relative to YXZ). The specimens printed simultaneously have a lower weight (approx. −0.03 g) and the authors consider that the difference may be linked to intermolecular diffusion at the interlayer interface. The ultimate tensile strength (UTS) of individually printed specimens was significantly higher compared to the UTS obtained for simultaneously printed specimens (20% for XYZ specimens, 37% for YZX specimens, 26% for specimens rotated with 45° relative to YXZ). It should be noted that for the layout chosen by the authors for simultaneous printing, the YZX oriented specimens have more layers compared to the other two orientations. Thus, the time interval between deposition of material on two successive layers in the same area of the YZX specimens is higher for the first 10 layers (2 mm thickness = 10 layers × 0.2 mm) compared to the upper layers (printing speed was kept constant).
Schiavone et al. [15] analyzed comparatively the properties of ASTM D638-IV specimens printed simultaneously (batch of five) and individually, using two types of infill (line and gyroid) and two build orientations (rotated 45° relative to YXZ, respectively to YZX). Two types of PLA filament were used: 3D850 (clear) and 3D870 (white). Individually printed 3D850 PLA specimens showed an increase of UTS compared to simultaneously printed specimens. While for 3D850 PLA specimens rotated at 45° relative to YZX, the UTS values were about 20% higher for specimens printed individually, for 3D870 PLA specimens rotated at 45° relative to YXZ the UTS values were not influenced by the printing mode (simultaneous or individual).
The two above mentioned studies targeted only the influence of the printing scenario on the tensile strength, without revealing its influence on the specimens’ dimensions. No previous studies were found aiming to point out specifically the effect of simultaneous printing on the dimensional accuracy and the mechanical properties of the specimens produced in batches depending on their different positions on the build plate. But when printing finished parts in batches, the problem regarding the predictability of their quality and properties may not be ignored.
Although mostly neglected, the color of the PLA should be considered a significant influential variable of the FDM printing process [9,16]. Color-dependent printing behavior was reported by previous research, with direct influence on the dimensional accuracy [4,17] and the tensile strength [18,19] of FDM printed specimens, some of them highlighting particularly the effect of the carbon black in conductive PLA [20,21]. The reason for the differences determined by the PLA colors was found to be the influence of the coloring additives on the in-process crystallinity and the thermal properties of the PLA filaments [17,20]. Therefore, when printing different colored PLA filaments under the same conditions, different results in terms of the printed parts properties may be expected.
This paper aims to point out if and to what extent the mechanical properties and the dimensional accuracy of PLA tensile specimens are influenced by the printing scenario and if there are notable differences in this respect determined by the position of the specimen on the build plate. Also, considering that the printing scenario has effect on the thermal printing conditions of different specimens, the PLA color was chosen to be an independent parameter as well. Therefore, individual printing and simultaneous printing of tensile specimens (batches of 3 specimens and respectively batches of 5 specimens) was performed, using four different colored PLA filaments (natural, black, red, and grey). All other FDM process parameters were maintained constant for all specimens, intending to highlight only the influence of the variables mentioned above (printing scenario, position of the specimen on the build plate and filament color). To correlate the results with the thermal printing conditions, the temperature variations on the surface of successive deposited layers were recorded for the black PLA, that is known to be, due to its better thermal conductivity, more sensitive to temperature variations during printing [20,21].

2. Materials and Methods

The experimental investigations were carried out on ISO 527-2 [22] tensile specimens, type 1A, 3 mm thick. The test specimens were printed with polylactic acid, using four types of filaments with a diameter of 2.85 mm: PLA Natural (transparent), PLA Black, PLA Red and PLA Grey (manufacturer: Verbatim GmbH, Eschborn, Germany).
The specimens were produced on an Ultimaker 2+ Connect equipment (Ultimaker B.V., Utrecht, Netherlands) with air filter and closed workspace (the printer was equipped with top cover and front door). A glass build plate with 223 mm on X-axis and 220 mm on Y-axis was used. Three printing layouts were defined:
-
individual printing of a single tensile test specimen (codified 1.1), placed in the center of the build plate, with YXZ orientation [23] (Figure 1a);
-
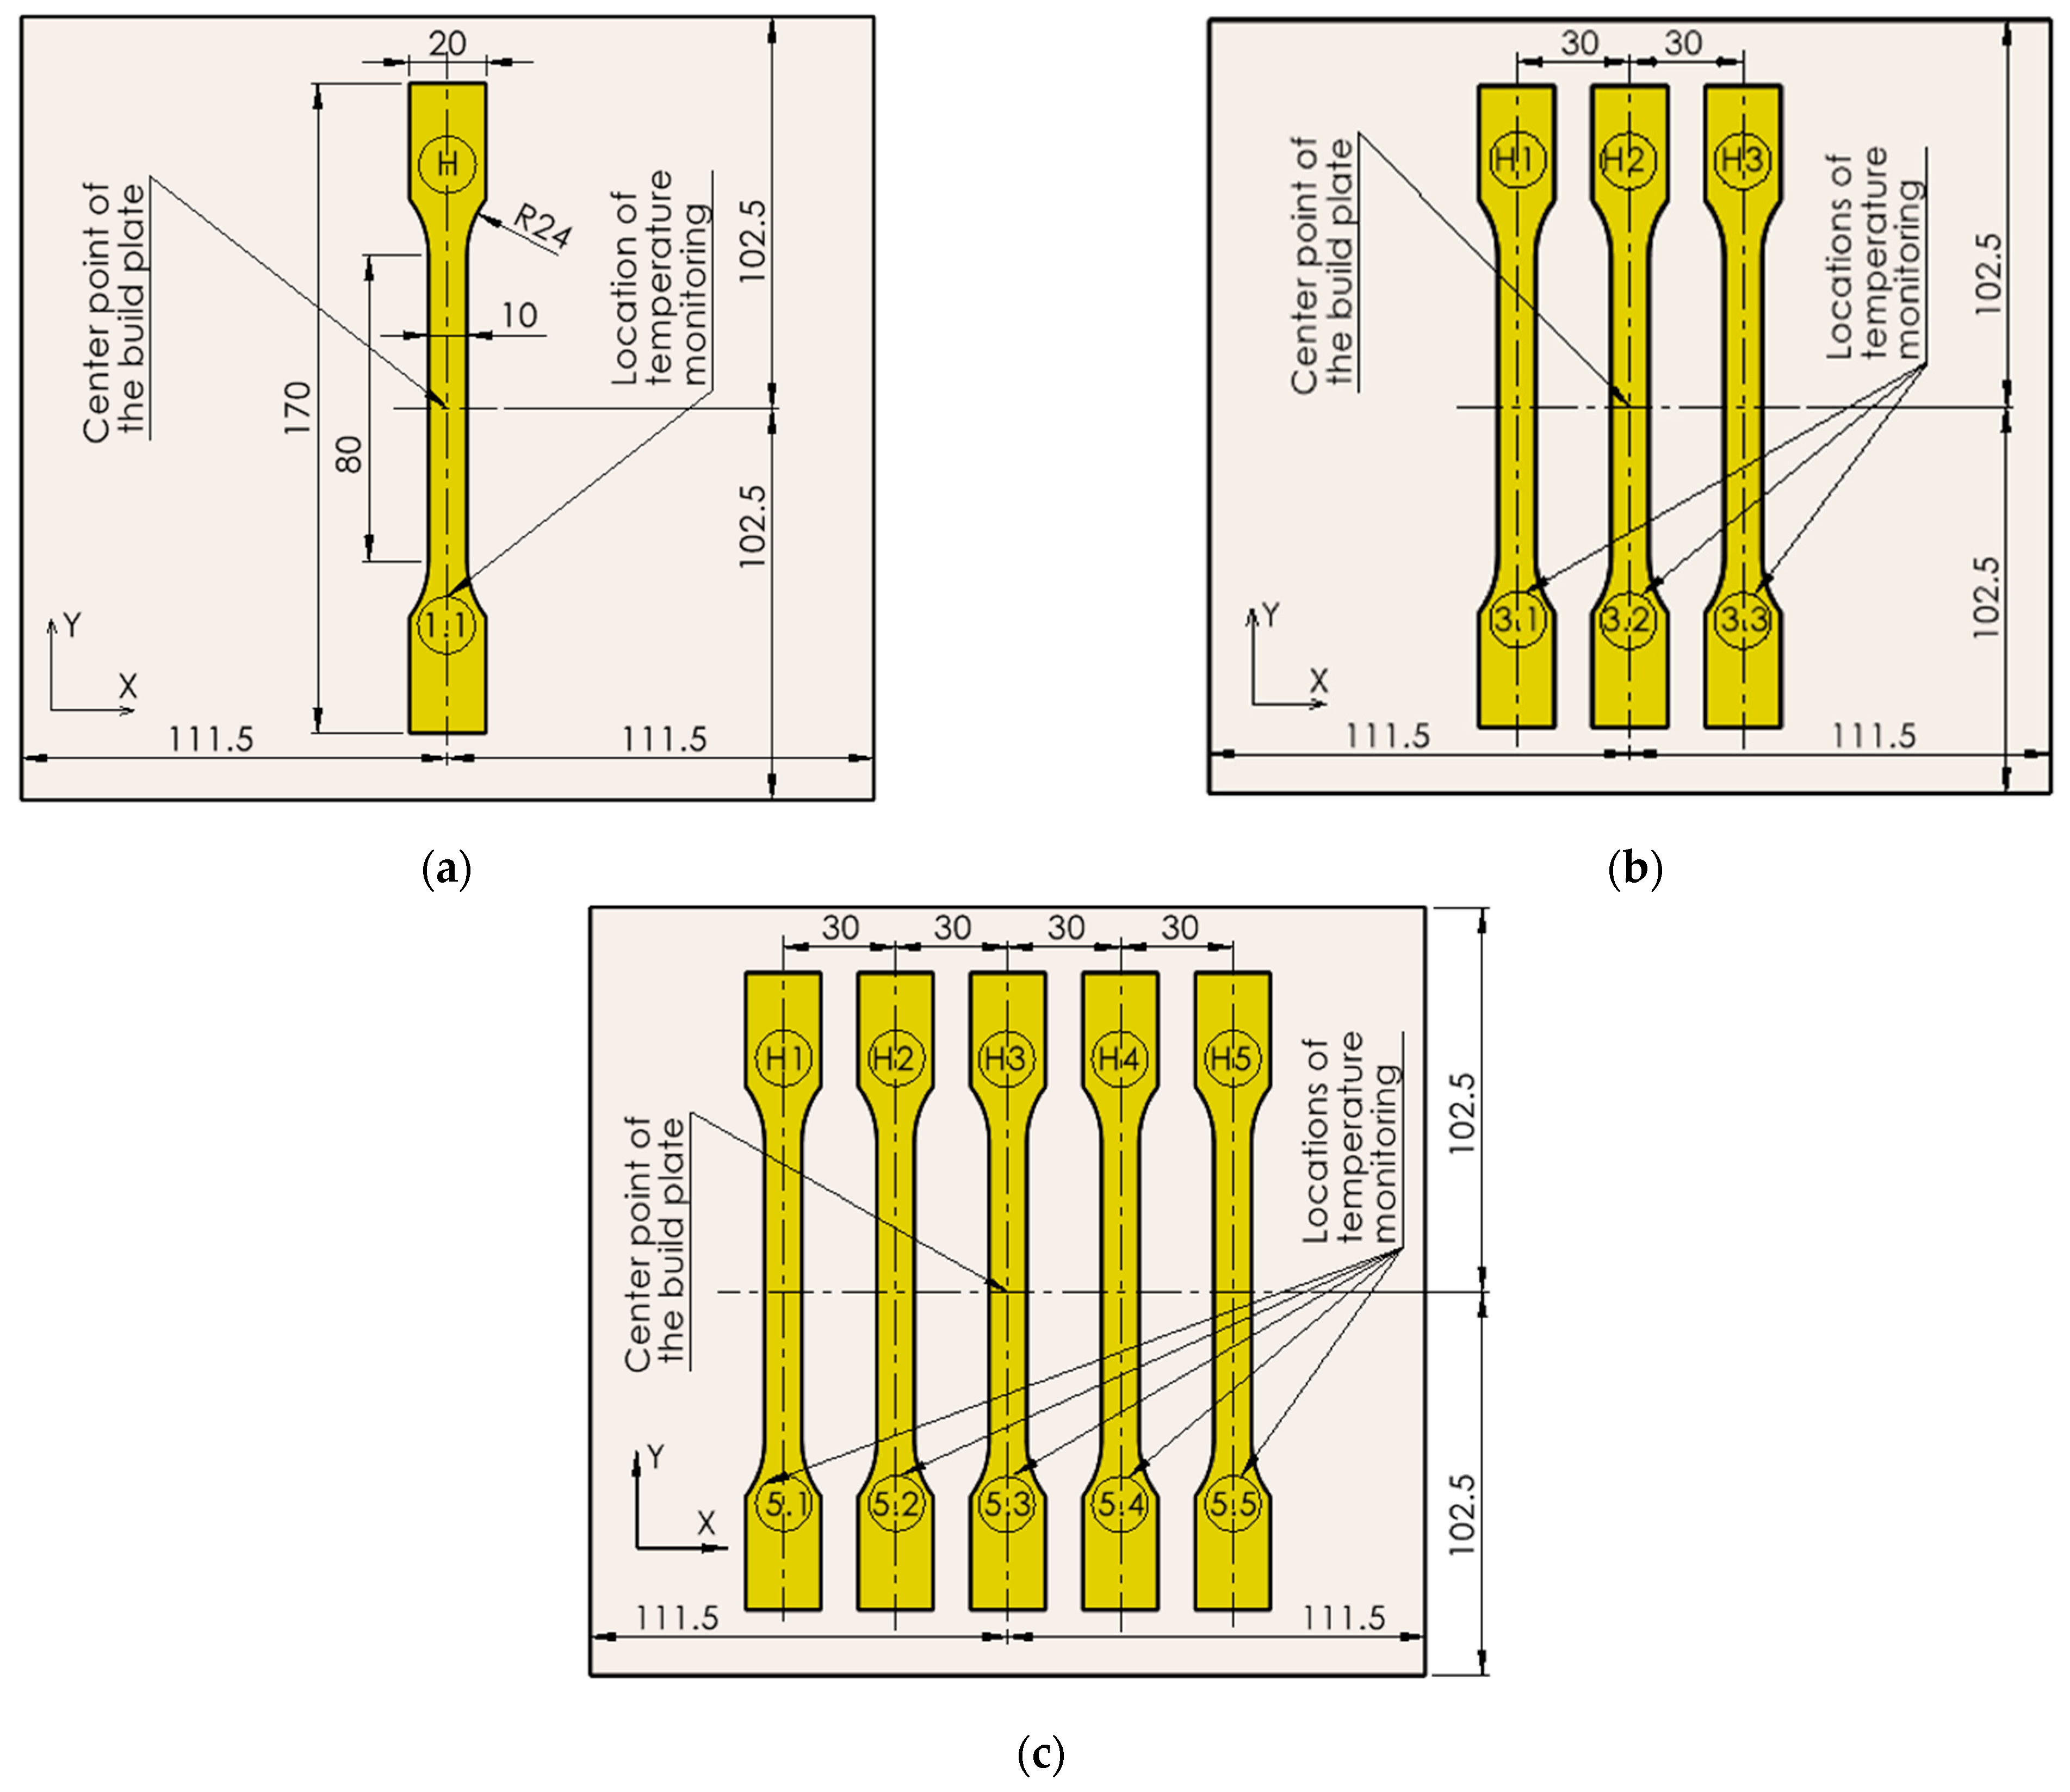
simultaneous printing of three tensile test specimens (codified: 3.1, 3.2 and 3.3), placed in the center of the build plate, with YXZ orientation and 30 mm distance between the specimens’ symmetry axes (Figure 1b). The order of deposition was: first layer of specimen 3.1, first layer of specimen 3.2, first layer of specimen 3.3, second layer of specimen 3.1, second layer of specimen 3.2, second layer of specimen 3.3 (similar for all layers);
-
simultaneous printing of five tensile test specimens (codified: 5.1, 5.2, 5.3, 5.4 and 5.5), placed in the center of the build plate, with YXZ orientation and 30 mm distance between the specimens’ symmetry axes (Figure 1c). The order of deposition was: first layer of specimen 5.1, first layer of specimen 5.2, first layer of specimen 5.3, first layer of specimen 5.4, first layer of specimen 5.5, second layer of specimen 5.1, second layer of specimen 5.2, second layer of specimen 5.3, second layer of specimen 5.4, second layer of specimen 5.5 (similar for all layers).
Using the layouts described above, specimens 1.1, 3.2 and 5.3 have the same position relative to the build plate origin. Similarly, specimen 3.1 has the same position as specimen 5.2, and specimen 3.3 has the same position as specimen 5.4.
Each of the configurations presented above was printed five times, with a total of 180 tensile test specimens (45 specimens per color: 5 × 1.1, 5 × 3.1, 5 × 3.2, 5 × 3.3, 5 × 5.1, 5 × 5.2, 5 × 5.3, 5 × 5.4, 5 × 5.5). The printing parameters were maintained constant for all specimens (Table 1) and were set at values resulting from previous research [5,9,16], considering also the recommendations of the filament manufacturer (Verbatim, [24]). Furthermore, all specimens of the same color were printed from the same filament spool. No pre-process or post-process treatments were applied.
For the ISO 527-2 1A tensile test specimens with 3 mm thickness, using 0.2 mm layer thickness, the total number of layers is 15 (YXZ build orientation). The time interval between the deposition of material in two successive layers, in the same area of the part (or the time interval to generate a full layer) was measured for each of the three layouts described in Figure 1. The following values were obtained:
-
5 min and 36 s per layer for individual printing of a test specimen.
-
16 min and 52 s per layer for simultaneous printing of 3 specimens.
-
25 min and 10 s per layer for simultaneous printing of 5 specimens.
Previous research has shown that black PLA filaments are more sensitive to thermal variations [16,21]. For this reason, in order to correlate the results of the experiments with the thermal printing conditions, temperature measurements were carried out on the upper surface of the black PLA specimens, using an Optris Laser Sight infrared thermometer (Optris GmbH, Berlin, Germany) with a resolution of 0.1 °C. The equipment was placed above the specimen (approx. 200 mm), with the printer cover removed. The measurements were performed using the following procedure:
-
one measurement for each layer of the individual printed specimen; the thermometer was placed above area 1.1 and the measurements were done when the print head applied the material to area H (Figure 1a). A total of 15 measurements were made for specimen 1.1;
-
three measurements for each layer of specimens 3.1, 3.2 and 3.3: the first measurements were done in areas 3.1, 3.2 and 3.3 from Figure 1b, when the print head deposited material on test area H1 of specimen 3.1; the following measurements were done in the same areas when the print head deposited material on areas H2, respectively H3 of specimens 3.2 and 3.3. A total number of 45 measurements were made for each specimen of this type;
-
five measurements for each layer deposited on specimens 5.1, 5.2, 5.3, 5.4 and 5.5 (the first measurements were done in areas 5.1, 5.2, 5.3, 5.4 and 5.5 from Figure 1c at the instant when the print head deposited material on area H1 of specimen 5.1; the following measurements were done in the same areas when the print head deposited material on areas H2, H3, H4, and respectively H5 of specimens 5.2, 5.3, 5.4 and 5.5). A total number of 75 measurements were made for each specimen of this type.
It should be noted that continuous temperature measurement was also attempted, but the interposition of the print head and printer guide rails between the specimen and the thermometer affected the measurements. For the same reason, it was not possible to measure the temperature in the first seconds after the deposition of the material, when the print head was above the measurement area.
A detailed analysis of the temperature variation on the deposited layer has been previously presented by the authors in [25]. In this paper, the charts of the temperature variation for the layers 3 to 15 are included (the first two layers have not been included in the graphs, to eliminate disturbances generated by the build plate).
Dimensional deviations were evaluated by measuring the width and thickness of the specimens in three sections of the calibrated area (theoretical width—10 mm, theoretical thickness—3 mm). A Mitutoyo 293-240-30 micrometer (Mitutoyo Romania SRL, Otopeni, Romania) with an accuracy of ±0.001 mm was used. Width deviations (%), thickness deviations (%), and cross-sectional areas of the specimens were calculated. Subsequently, means and standard deviations were determined for each color and type of specimen.
Tensile tests were carried out according to ISO 527-1 [26] and ISO 527-2 [22], using a Mecmesin Multitest 2.5 dV equipment (PPT Group UK Ltd., Slinfold, United Kingdom) with Vector ProMT 6.1.0.0 software for test setup, control, monitoring and data acquisition. Test speed was kept constant sp = 10 mm/min. Ultimate tensile stress, mean and standard deviation (according to ISO 2602:1980 [27]) were determined for batches of five tensile samples.
The structure of the FDM deposited material was analyzed using a Leica MZ 7.5 stereomicroscope (Leica Microsystems, Wetzlar, Germany). Representative images of the fractured section and the surface of the upper layer at 10× magnification were captured for each printing layout and color. Furthermore, to visualize the different color-dependent behavior of the PLA filaments produced with the same process parameters, one specimen printed individually from each PLA color was embrittled in liquid nitrogen, broken without any previous deformation and examined with a Zeiss Gemini Sigma 300 VP field emission scanning electron microscope (FE-SEM, ZEISS Microscopy, Jena, Germany).
Analysis of variance (ANOVA) was used to establish if the differences between the measured values are statistically significant and implicitly whether the independent variables (filament color, printing scenario and specimen position on the build plate) and their interaction influence the dependent variables (specimen width, specimen thickness, cross-sectional area, UTS). The confidence level set was 95%.

3. Results and Discussions

3.1. Variation of Temperature on the Specimen Surface

Figure 2 shows the variation charts of the temperature measured on the current layer surface (layers 3 to 15) for the three printing scenarios in case of the black PLA. The following observations can be made:
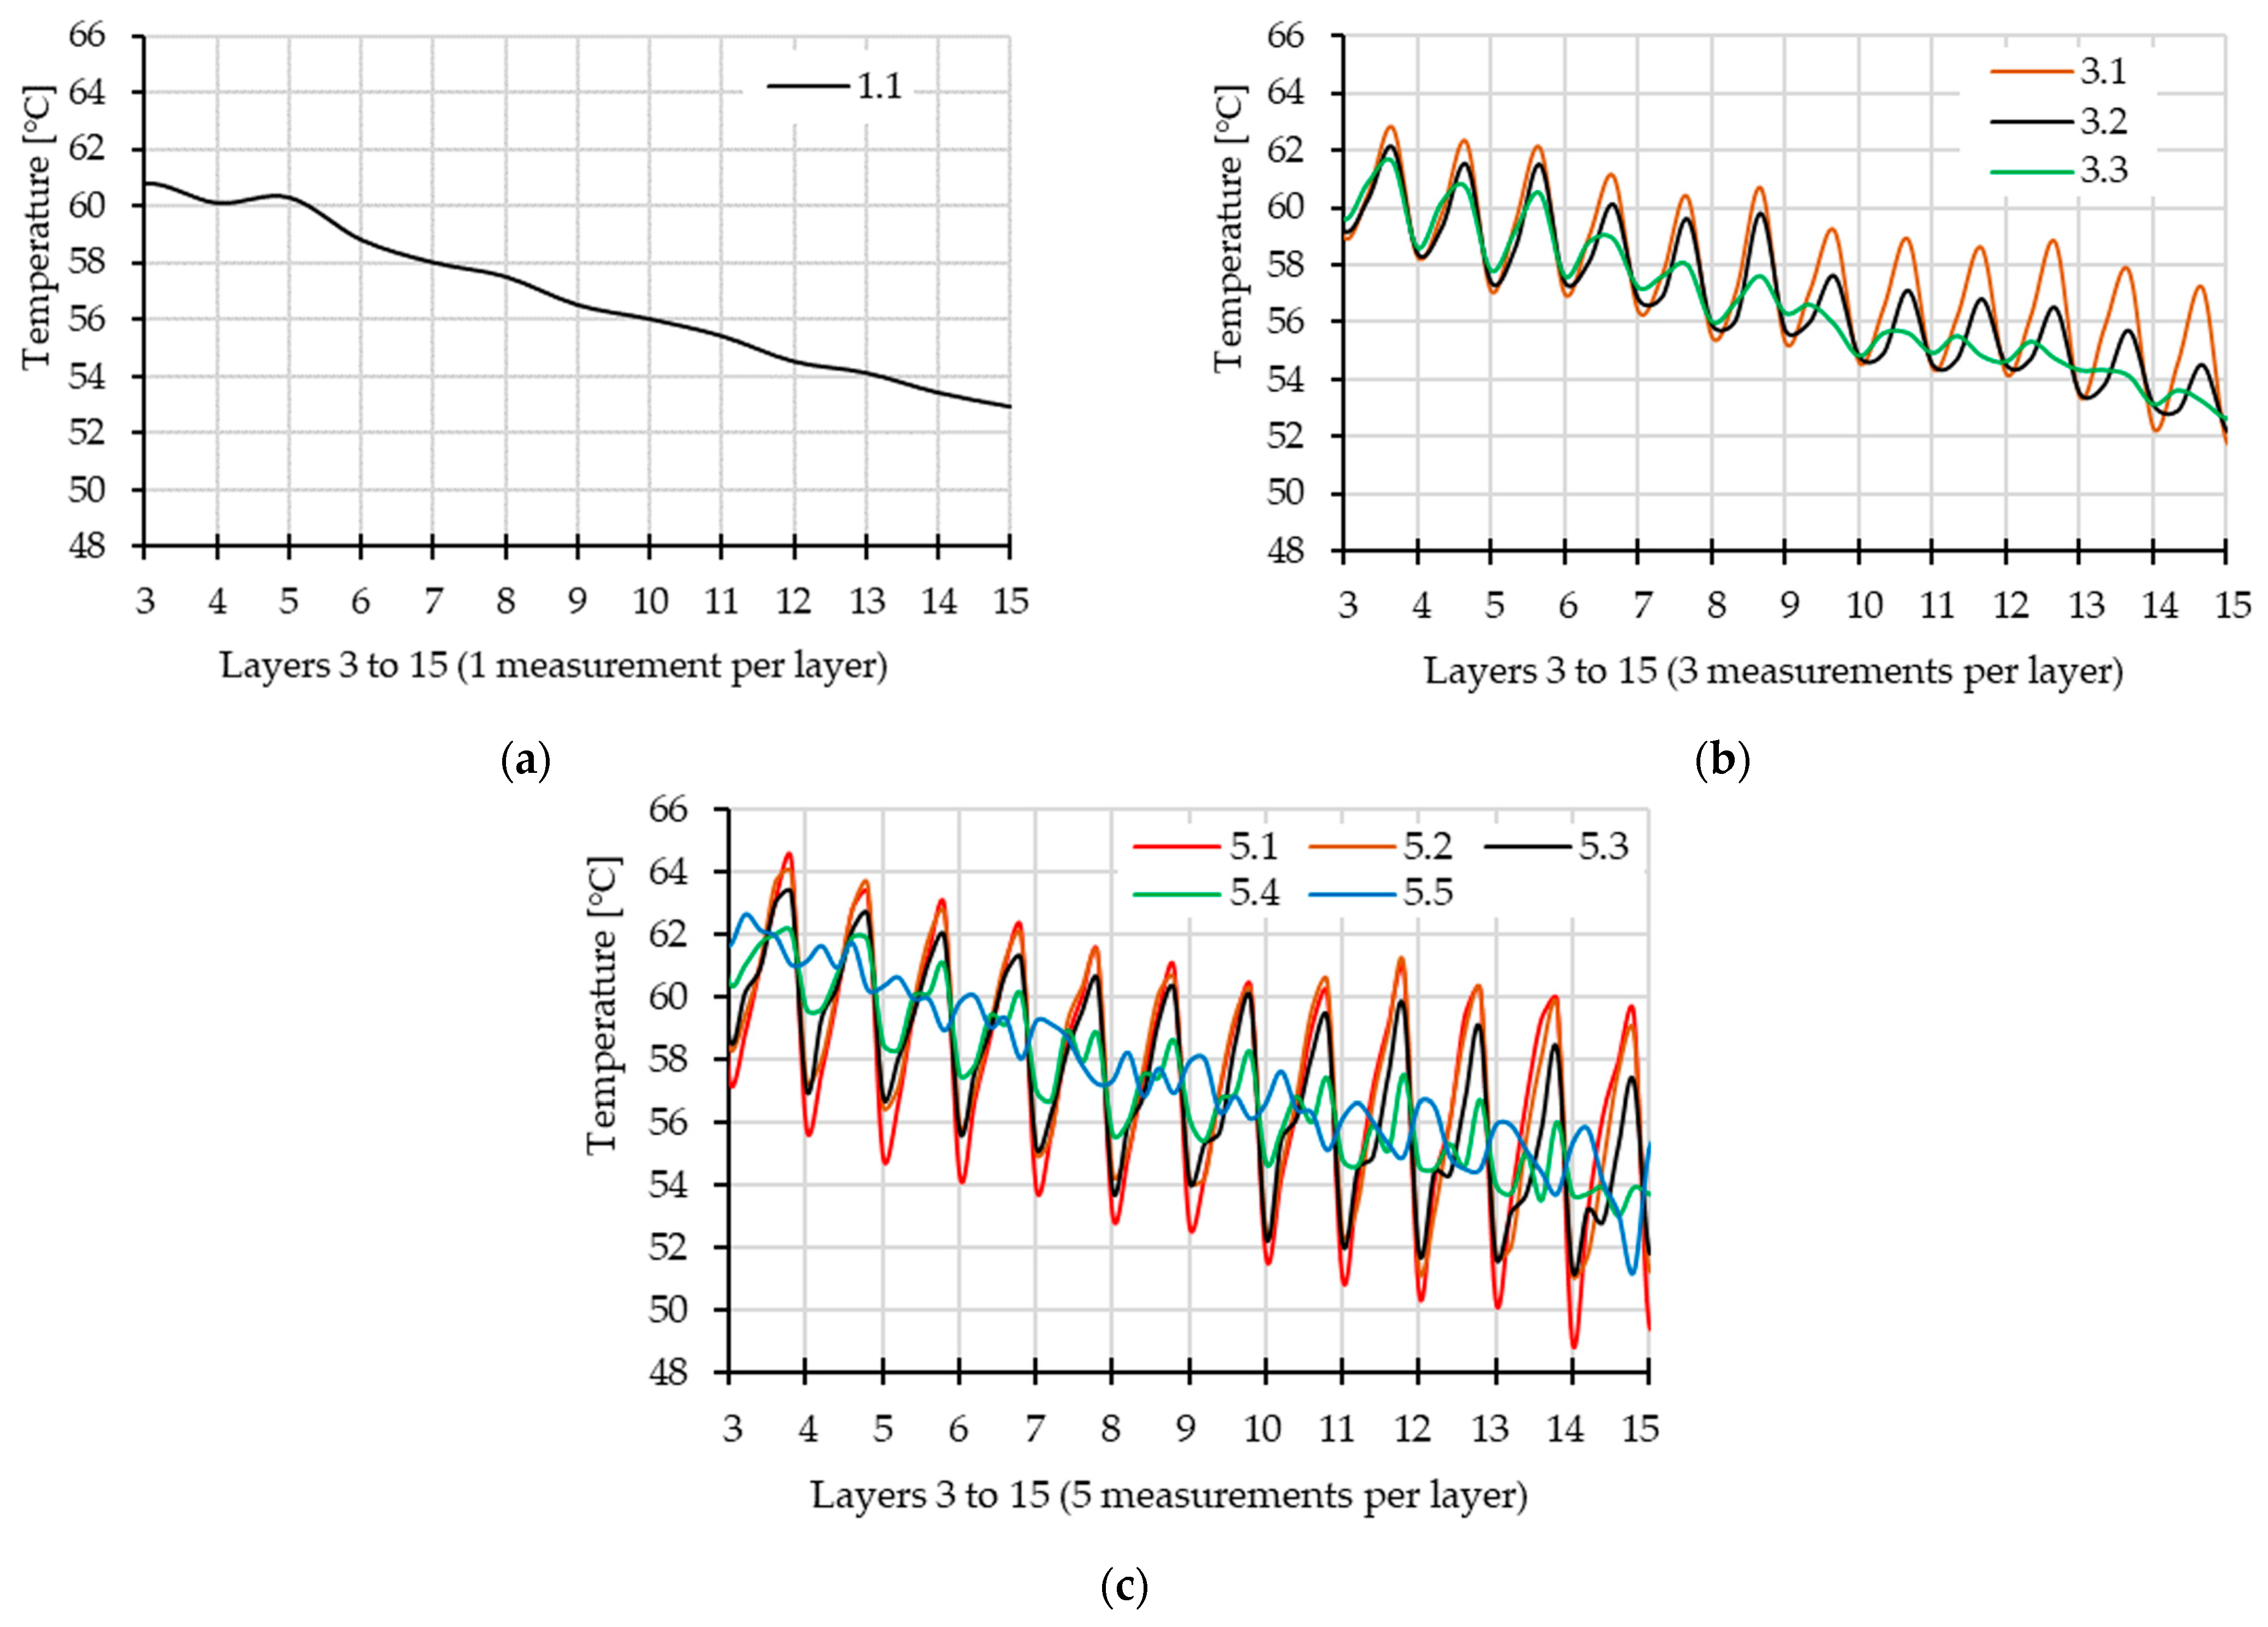
  • In case of the specimen printed individually (Figure 2a), the temperature of the deposited top layer continuously decreases, correlated with its distance to the build plate. The total variation from layers 3 to 15 is approx. 8 °C.
  • During the printing process, the temperature on the top layers has a cyclic variation, with average values located near the glass transition temperature of the PLA, indicated by the filament manufacturer to be equal 58 °C for all filament colors [24]. The amplitude of the temperature cycles increases with the number of specimens printed simultaneously, reaching maximum values, as follows: up to 1 °C for single printing (Figure 2a), up to 6 °C for simultaneous printing of three specimens (Figure 2b) and respectively up to 11 °C for simultaneous printing of five specimens (Figure 2c).
  • In case of simultaneous printing, the amplitude of the cycles increases slightly for the higher layers, which may be explained by the diminished influence of the build plate temperature.
  • The amplitude of the variation cycles is lower for the specimens positioned on the right side of the build plate, both in case of three simultaneously printed specimens (up to 3 °C for specimen 3.3, Figure 2b) and in case of five simultaneously printed specimens (up to 3.5 °C for specimens 5.4 and 5.5, Figure 2c), showing that the heat field is not evenly distributed, which may be caused by the air flow in the 3D printer workspace.
  • The differences between the temperatures on the top layers of the specimens during simultaneous printing are reaching up to 4 °C for three specimens and respectively up to 8 °C for five specimens printed simultaneous.
It should be mentioned that the results are in accordance with previous research [13], where the deposition of successive layers was found to determine “reheating peaks” of the material in very similar temperature intervals, even though the authors printed only one line layers. As shown in [28], these temperature cycles, occurring near the glass transition temperature of the PLA, may cause variations of the mechanical properties and dimensional accuracy of the specimens.
The analysis of the temperature variations should be correlated with the moments of measurements, defined by the position of the print head in relation to the position of the thermometer. As stated above, it was not possible to measure the temperature in the first seconds after deposition of the material.

3.2. Dimensional Accuracy

Width deviations (%), thickness deviations (%) and cross-sectional areas (mm2) were calculated for each color and position using experimental data. Subsequently, means and standard deviations were determined for all types of specimens (Table 2, Table 3 and Table 4).
The influences of the two independent variables (filament color and specimen position on the table) on width deviation, thickness deviation and cross section area deviations were statistical analyzed using the Two Way ANOVA test, in the following situations: (a) three specimens printed simultaneously; (b) five specimens printed simultaneously; (c) specimens printed in the center of the build plate (specimens 1.1, 3.2 and 5.3).
The Eta squared factor (η2) was used to measure the effect size (the proportion of the variation of the dependent variable that is correlated with the independent variable).
Three specimens printed simultaneously
The results of simple main effects test showed that there was a statistically significant difference in:
-
the effect of the filament color on the specimen area F01(3,60) = 130.917, p01 = 0.000;
-
the effect of the specimen position on its area F02(2,60) = 14.806, p02 = 0.000.
The strongest effect on the specimen area is exerted by the color of the material (η2 = 89.1%), followed by the position of the specimen on the build plate (η2 = 38.2%).
Pearson correlation coefficient analysis shows that there is no statistically significant correlation between width deviations and thickness deviations (p = 0.600).
Considering that the overall dimensional accuracy is reflected best by the resulted deviations of the cross-section area, the statistical validated dependencies between the two independent variables (the filament color and the specimen position on the build plate) and the cross-section area are visualized in Figure 3. The best dimensional accuracy was obtained, for this printing scenario, by the grey specimens (32.067 mm2 mean value of the cross-section area for the whole batch of specimens, representing 6.89% increase to the nominal value of 30 mm2) and the worst by the red ones (33.898 mm2, representing an increase of 12.99%). The black and the natural filaments led to intermediate values (area increases of 7.51% and respectively 10.10%).
Regarding the second independent variable, respectively the position of the specimen on the build plate, the largest differences between the cross-section areas of specimens of the same color, printed in positions 3.1, 3.2 and respectively 3.3, resulted in case of the red prints (2.30%), followed by the black (1.70%), the grey (1.56%) and the natural (0.31%) specimens. It should be noted that all these differences are very small.
An increasing trend of the dimensional deviations for the specimens printed on the right side of the build plate (specimens 3.3) can be observed for this printing scenario and all filament colors.
Five specimens printed simultaneously
The results of simple main effects test showed that there was a statistically signif-icant difference in:
-
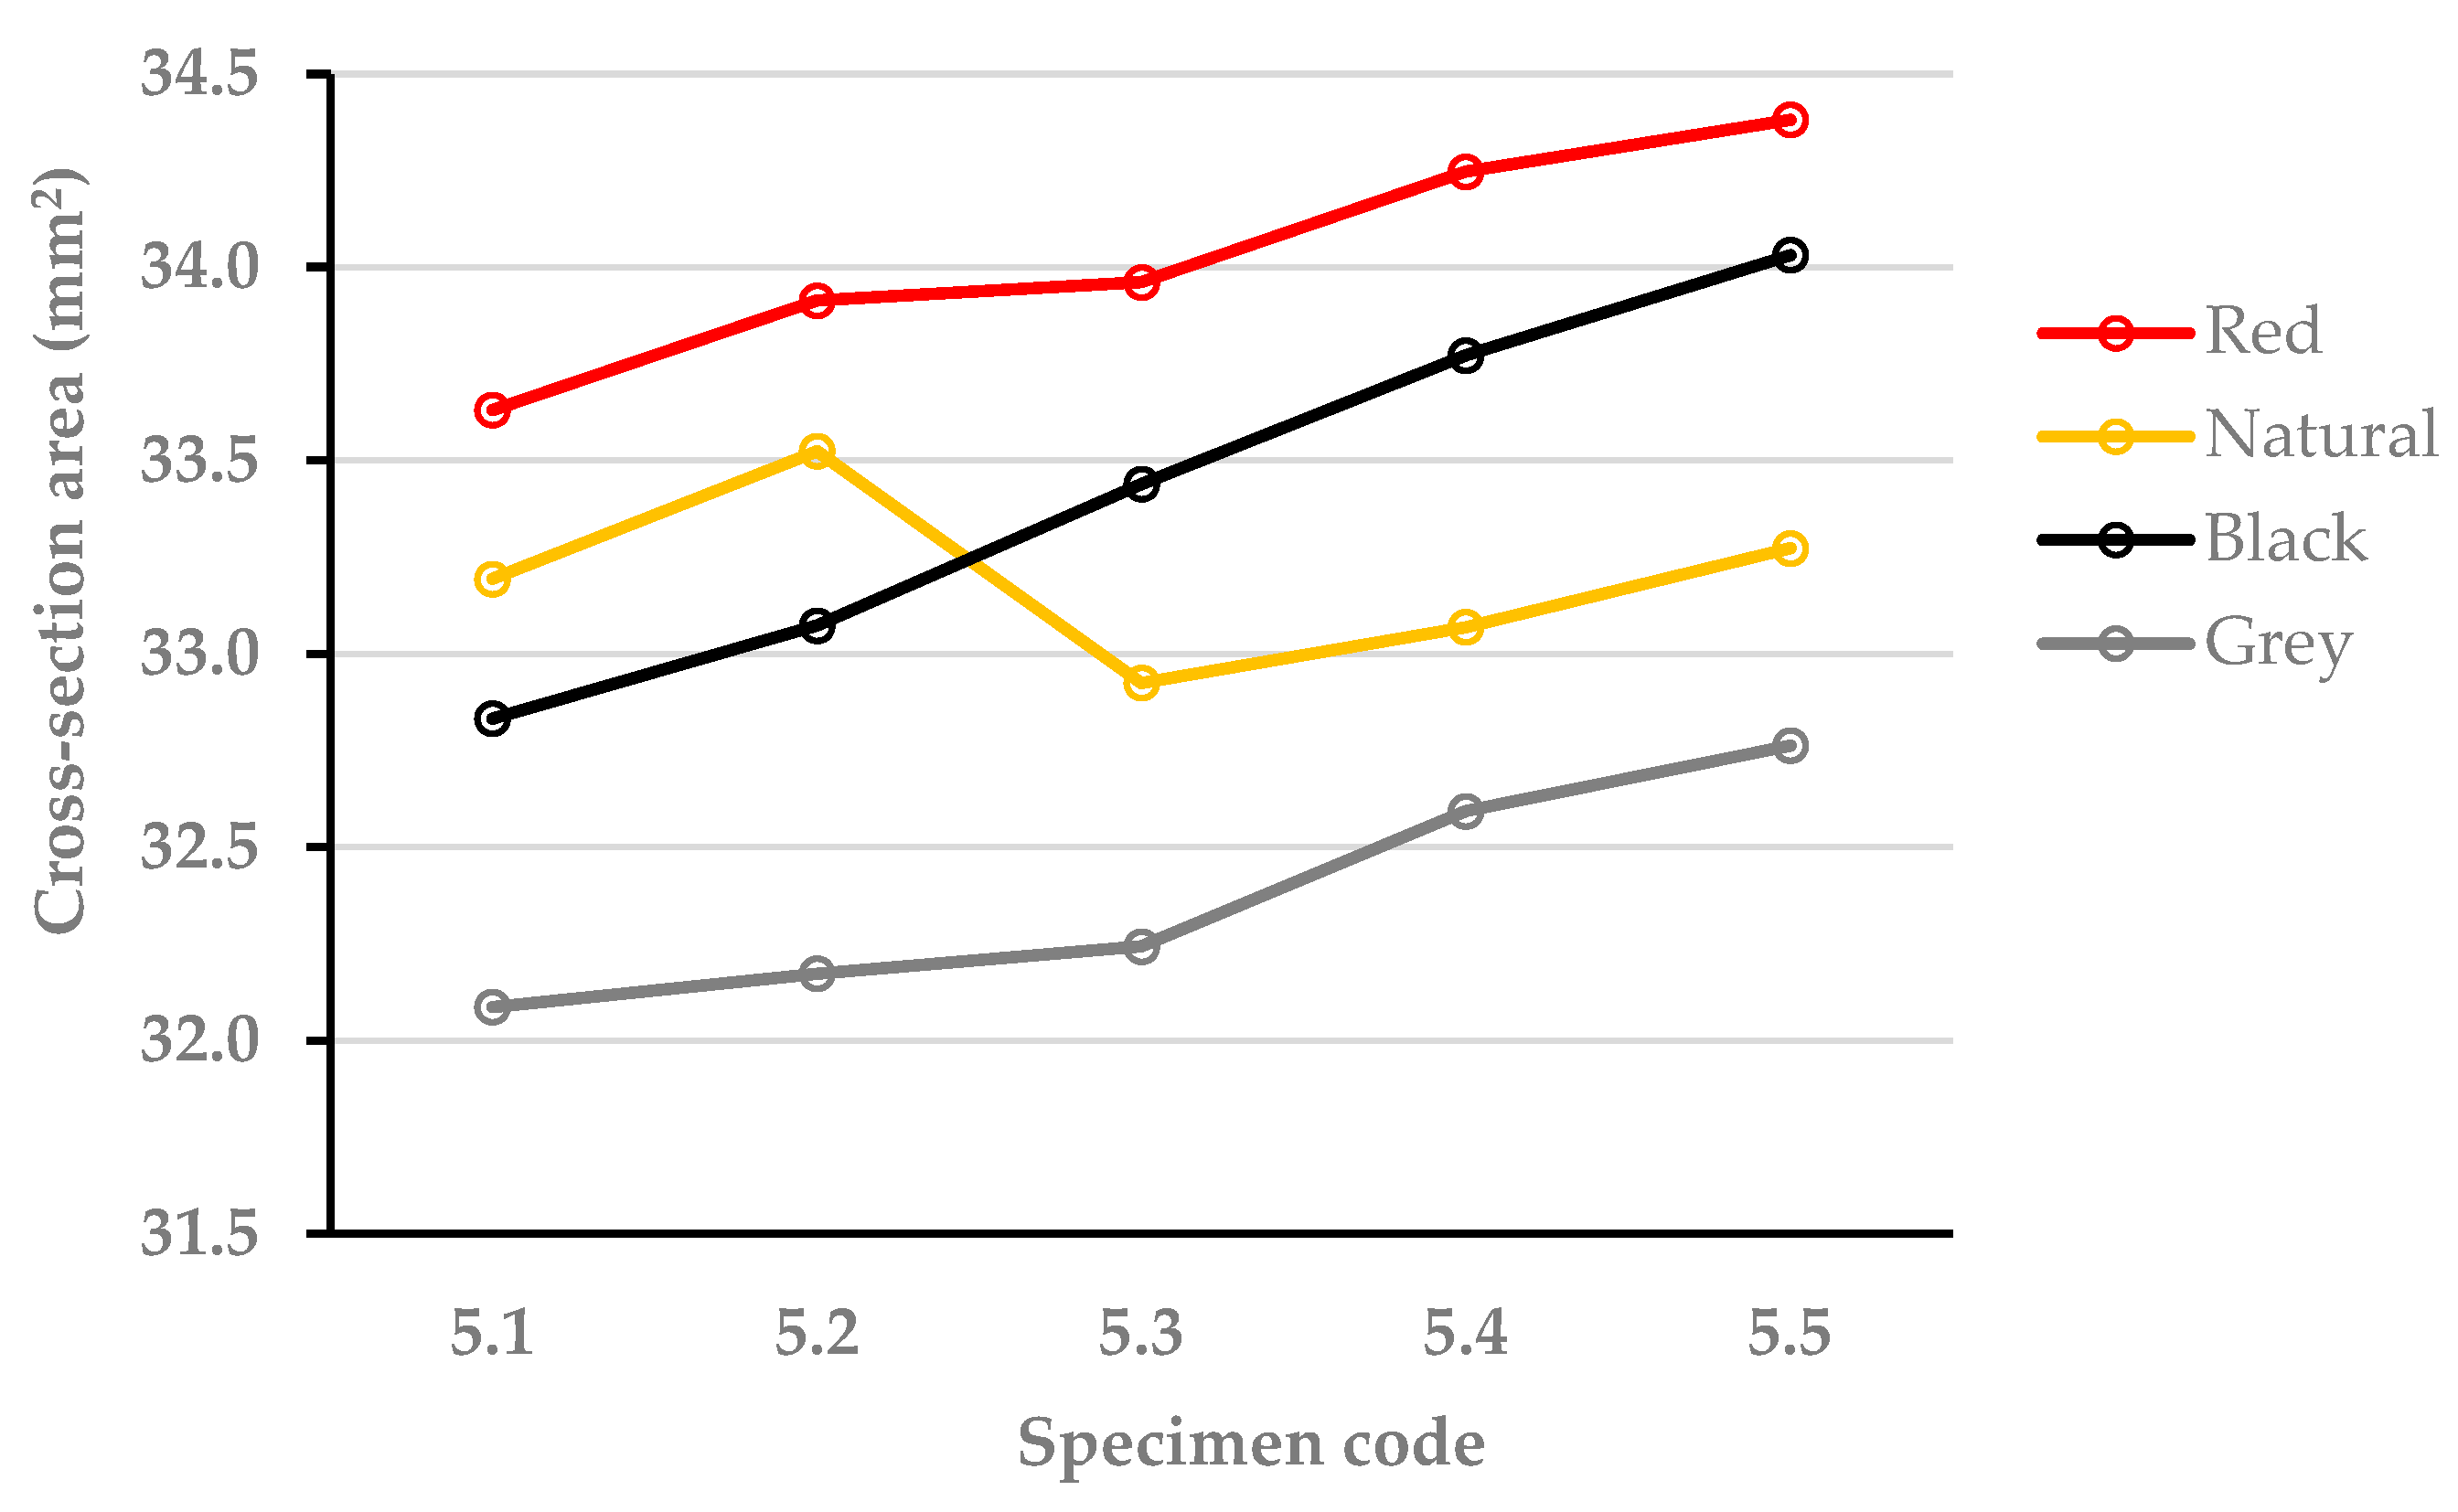
the effect of the filament color on the specimen area F01(3,100) = 43.250, p01 = 0.000;
-
the effect of the specimen position on its area F02(4,100) = 5.094, p02 = 0.001.
The strongest effect on the specimen area is exerted by the color of the material (η2 = 61.4%), followed by the position of the specimen on the build plate (η2 = 20.3%).
Pearson correlation coefficient analysis shows that there is no statistically significant correlation between width deviations and thickness deviations (p = 0.351).
The best dimensional accuracy, as shown by Figure 4, was obtained by the grey specimens (32.372 mm2 mean value of the cross-section area for the whole batch of specimens, representing 7.91% increase to the nominal value of 30 mm2) and the worst by the red ones (34.027 mm2, representing an increase of 13.42%). The natural and the black filaments led to intermediate values (increase of 10.66%, respectively 11.43%).
On the other hand, if considering the second independent variable, respectively the position of the specimen on the build plate, shown by the statistical analyze of the experimental results to influence less than the filament color, the largest differences between the cross-section areas of specimens of the same color, printed in positions 5.1, 5.2, 5.3, 5.4 and respectively 5.5, resulted in case of the black prints (3.65%), followed by the red (2.23%), the grey (2.11%) and the natural (1.82%) specimens. Also in this case, these differences are small.
At the same time, one can observe again increased cross-section deviations for the specimens positioned on the right side of the build plate (specimens 5.4 and 5.5), that have to be caused by the non-uniform temperature distribution inside the printing chamber. The measurements made for the specimens printed with natural PLA are the only ones that do not confirm this trend. This might be explained by different thermal properties of the material.
Specimens printed in the central position (1.1, 3.2 and 5.3)
In order to point out the influence of the number of simultaneous printed specimens on their dimensional accuracy, a comparative analysis of the cross-section area deviations of the specimens printed in the center of the build plate when applying the three printing scenarios was realized (specimens 1.1, 3.2. and 5.3).
Two-way ANOVA results showed that there was a statistically significant interaction between the effects of the filament color and the printing scenario on the specimen cross-section area F03(6,60) = 3.002, p03 = 0.014. The results of simple main effects test showed that there was a statistically significant difference in:
-
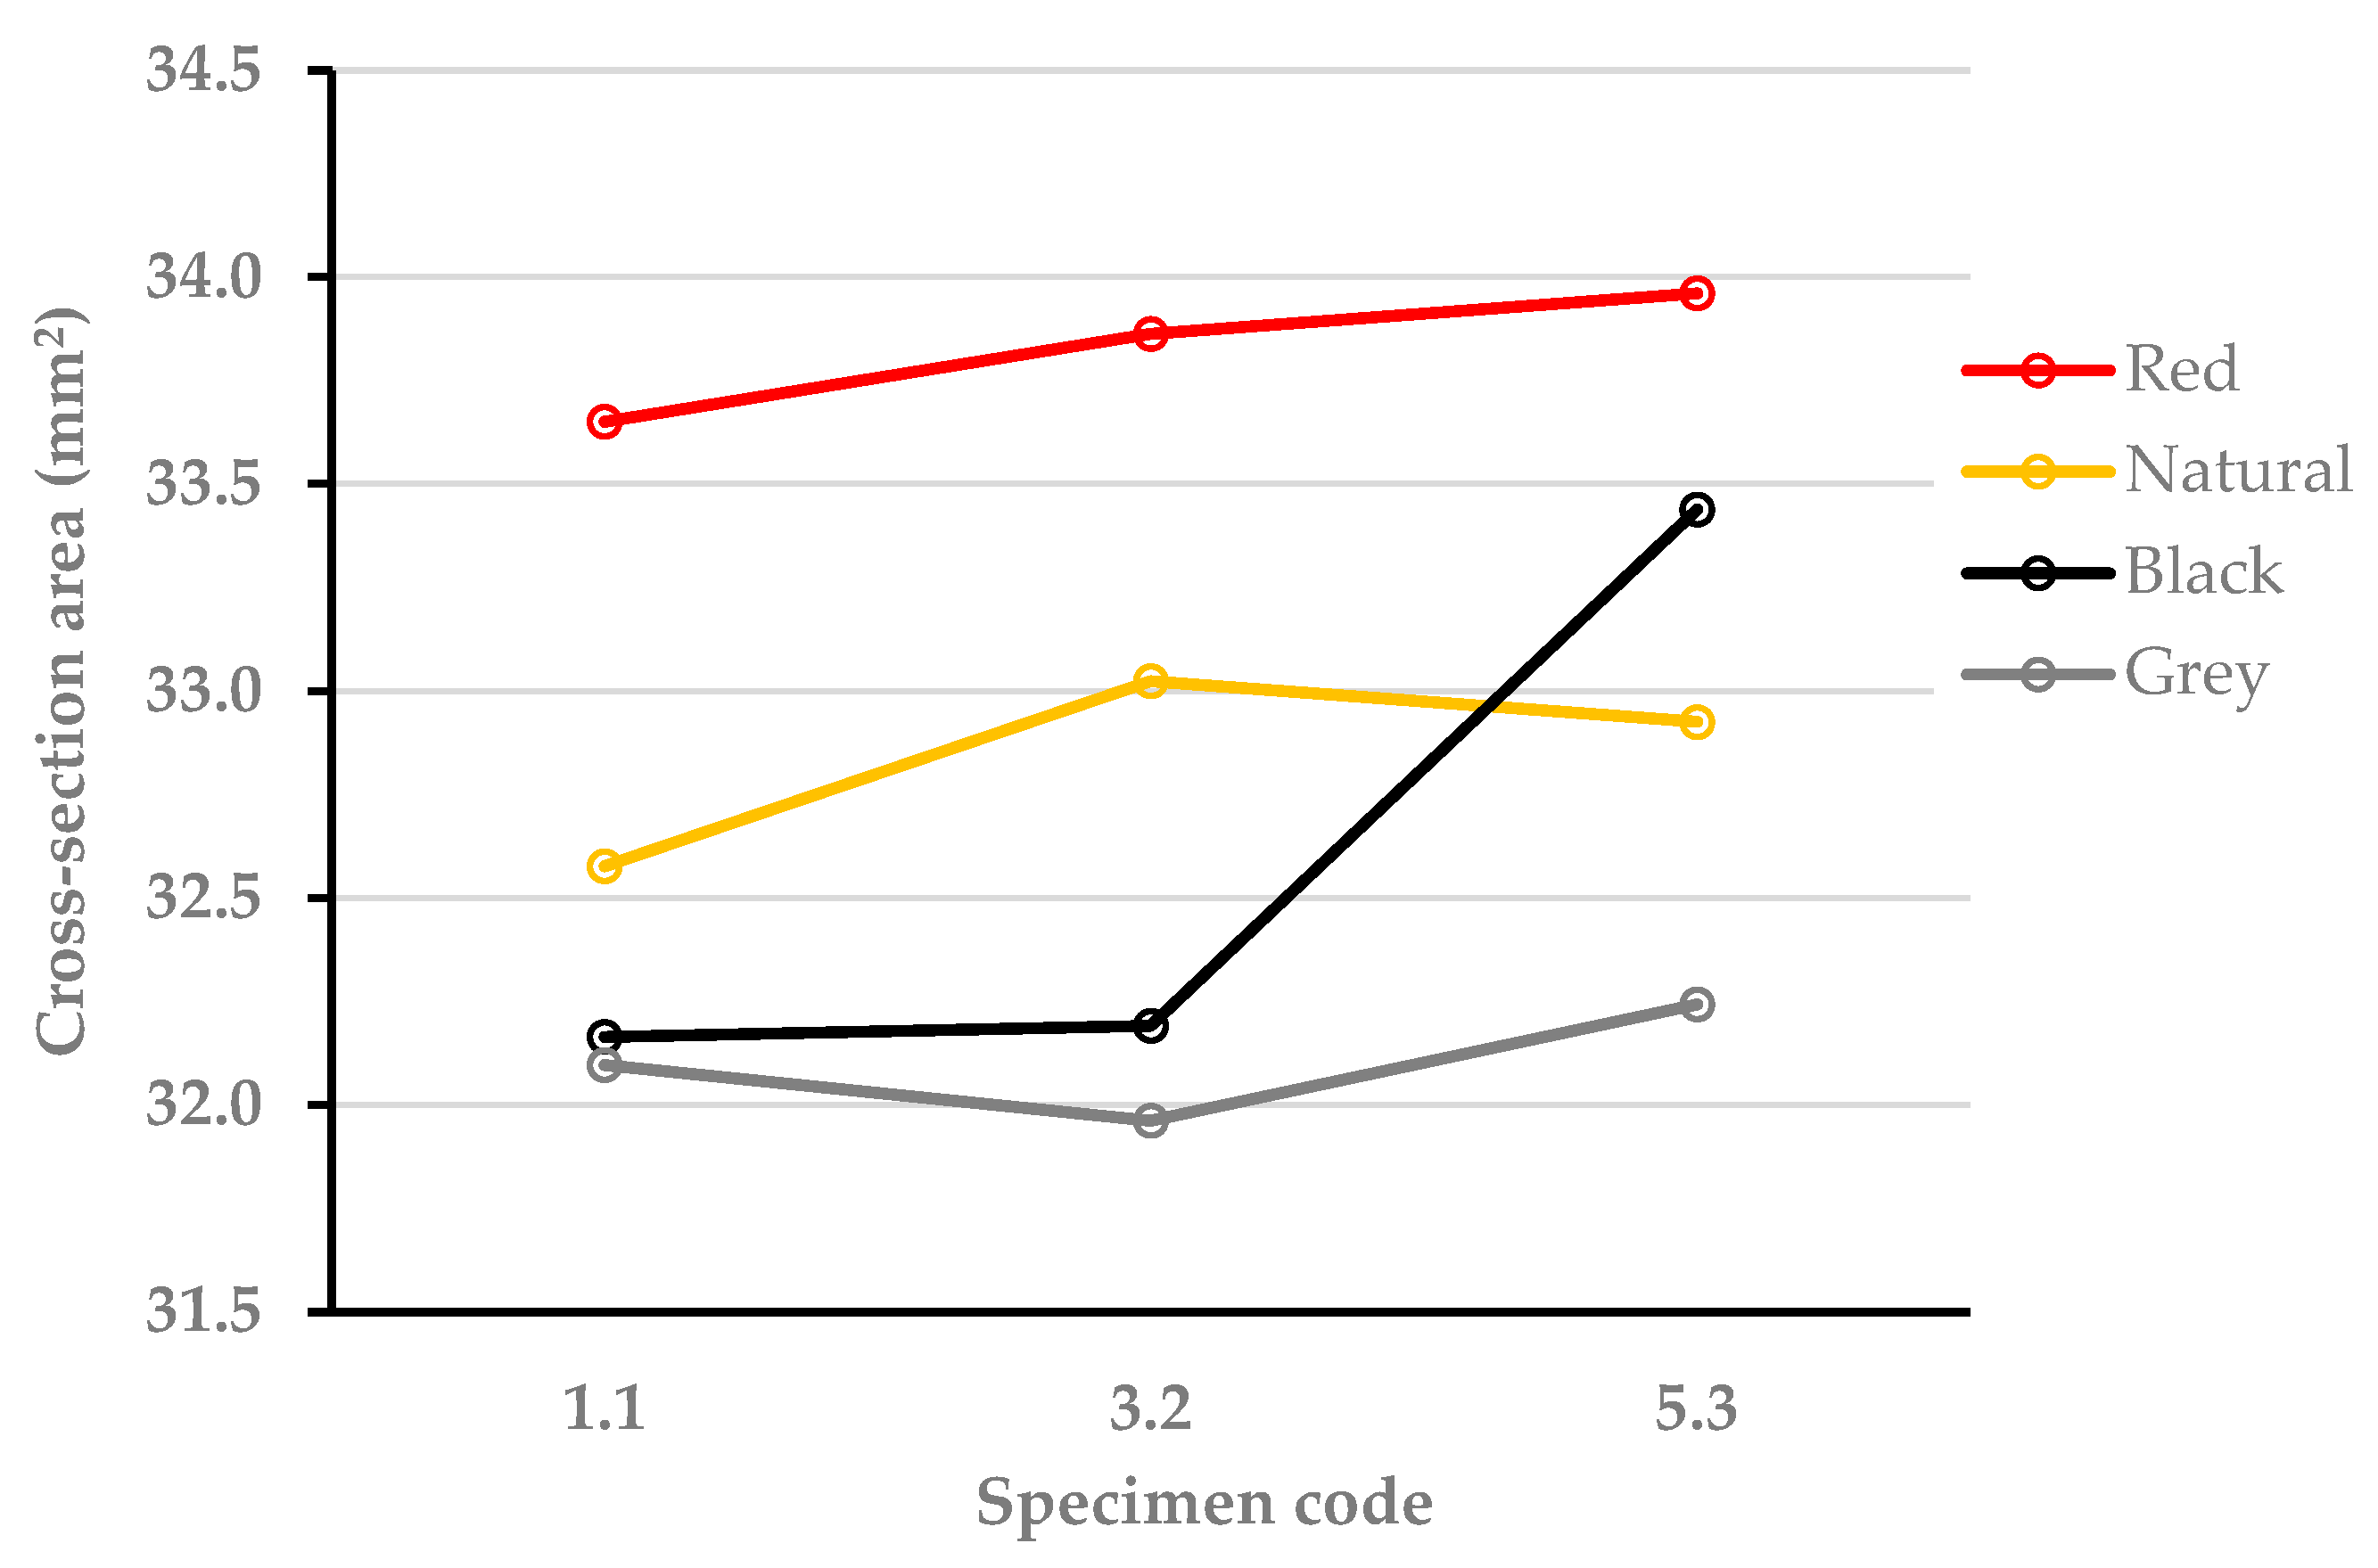
the effect of the filament color on the specimen area F01(3,60) = 41.677, p01 = 0.000;
-
the effect of the printing scenario on the specimen area F02(2,60) = 7.676, p02 = 0.001.
The strongest effect on the specimen cross-section area variations is exerted by the material color (η2 = 72.3%), followed by the color-printing scenario interaction (η2 = 27.3%) and the printing scenario (η2 = 24.2%).
After validation by two-way ANOVA of the dependencies between independent and dependent variables, the experimental results could be considered for interpretation.
The comparative analysis of the specimens printed in the center of the build plate regarding the deviations of the cross-section area, visualized in Figure 5, shows a low increase of the dimensional deviations between individually printed specimens and five specimens printed simultaneously. In numerical values, considering the increase of the cross-section area in relation to its nominal value (30 mm2), the strongest effect was recorded in case of the black prints (33.440 mm2, representing an increase of 3.96%) and the weakest for the grey prints (32.243 mm2, representing an increase of 0.46%). The influence of the printing scenario on the area of the natural and the red specimens was recorded to be situated between the two values mentioned before (increase of 1.07%, respectively 0.92%).
The results obtained for three specimens printed simultaneous showed very small differences in relation to individually printing (increase of the cross-section area situated between 0.08% for black PLA and 1.38% for natural PLA, respectively area reduction of −0.42% in case of grey PLA) and no evident tendency regarding the variations could be pointed out.

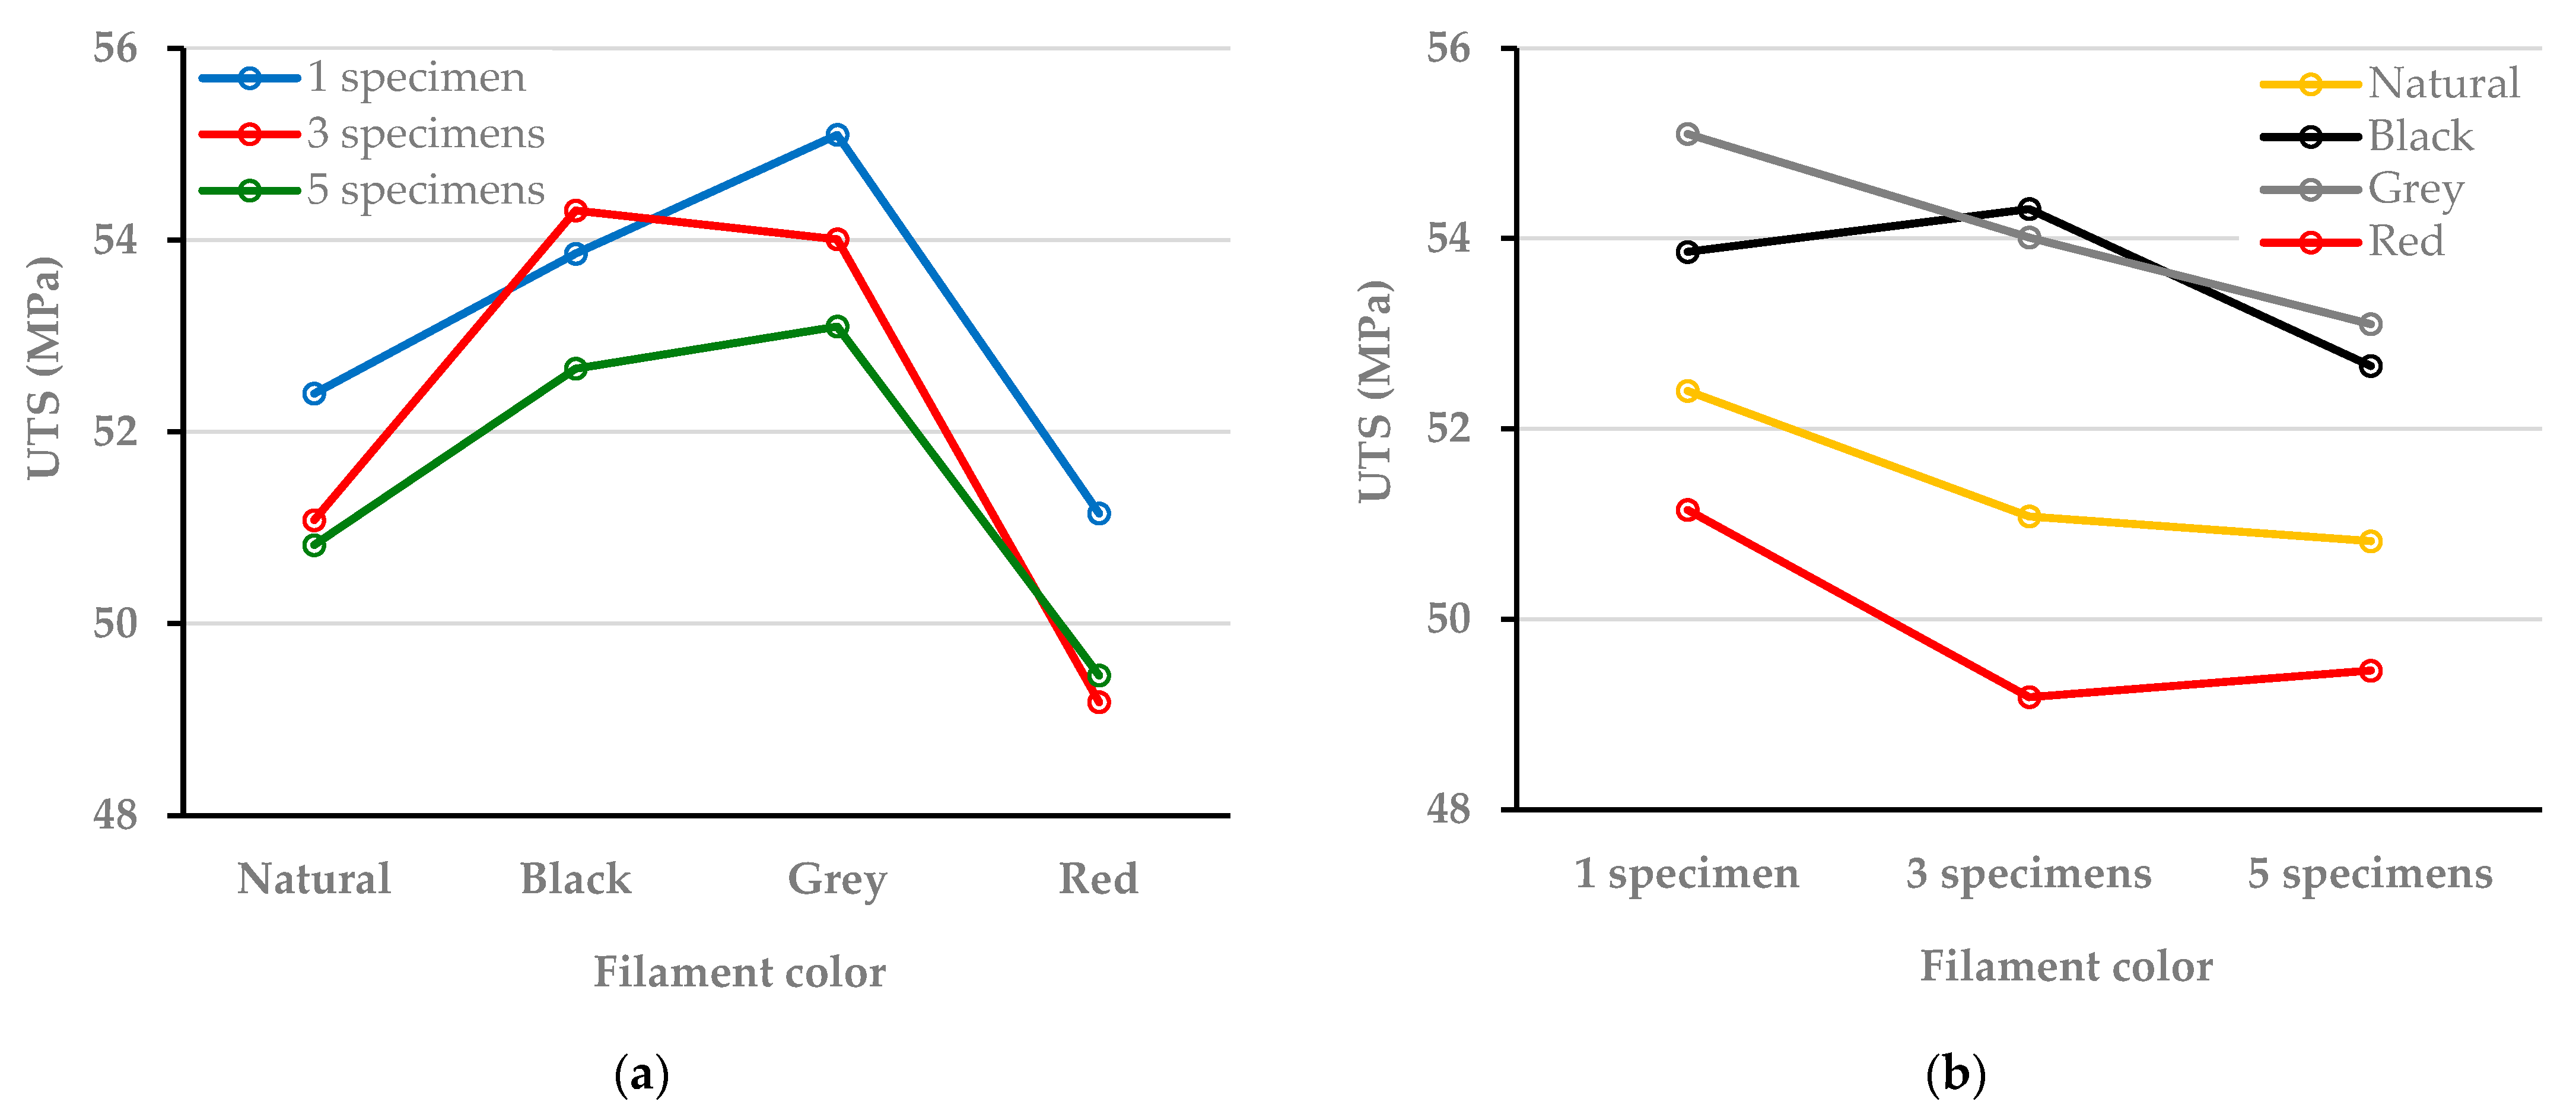
3.3. Tensile Behavior

Based on the UTS values, the means and standard deviations were determined for each color and specimen type (characterized by the printing scenario and by the position on the printing plate). The data presented in Table 5 were statistically analyzed using the Three Way ANOVA test.
As shown in Table 5, the maximal differences regarding the UTS values of three simultaneous printed PLA specimens in different positions on the build plate were, as follows: 0.87% for natural PLA; 1.25% for grey PLA; 2.98% for black PLA and respectively 4.97% for red PLA. Similar differences were found in case of five specimens printed simultaneous: 1.51% for red PLA; 2.97% for black PLA; 3.96% for grey PLA and respectively 5.31% for natural PLA. As one can observe, in case of the red and black PLA, increasing the number of simultaneous printed specimens from three to five led to smaller differences between the UTS values of different positioned specimens, while in case of the natural and grey PLA the differences grew up. This phenomenon may be explained as well by the different color-dependent properties of the different PLA types, that lead to different thermal printing conditions and subsequent over-extrusion, respectively under-extrusion, as described below in Section 3.4., when prolonging the time interval between two successive deposited filaments by simultaneous printing of three, respectively five specimens.
Using the Three Way ANOVA test, it was examined whether the differences between the means of the measurements were statistically significant and implicitly whether the independent variables (filament color, number of specimens printed simultaneously, position of the specimens on the printing plate) and their interaction had an effect on the dependent variable (UTS). The confidence level was set to 95%. The results of simple main effects test showed that there was a statistically significant difference in:
-
the effect of the filament color on the UTS: F01(3,180) = 138.773, p01 = 0.000;
-
the effect of the specimen position on build plate and the UTS: F03(8,180) = 4.989, p01 = 0.000.
The strongest effect on UTS is exerted by filament color (η2 = 74.3%), followed by specimen position (η2 = 17.2%).
After validation of the experimental results regarding their significance by the Three Way ANOVA test, the dependencies between independent variables (filament color, printing scenario) and dependent variable (UTS) were visualized by the graphical representations shown in Figure 6.
As reflected by Figure 6a, the printing scenario with five specimens produced simultaneous led, for all filament colors, to smaller UTS values than those obtained in case of individual printing. The differences are color-dependent and situated between 2.23% for black PLA and 3.63% for grey PLA, the other two colors leading to intermediate reductions, respectively 3.03% for natural PLA and 3.30% for red PLA.
The printing scenario with three simultaneous realized specimens determined also a decrease of the UTS compared to the values obtained by individual printing in case of the grey (1.96%), the natural (2.52%) and the red (3.87%) filaments, while the black prints conduced to a very small increase of the UTS (0.85%). The latter and the fact that the value of the UTS of the red specimens was smaller than that resulted for five red specimens printed simultaneous have to be phenomena caused by the color-dependent thermal properties and in-process crystallinity of the PLA prints, as explained in previous research [18].
Regarding the influence of the first independent variable discussed above (the printing scenario) it may be concluded that, increasing the number of specimens printed simultaneously from 1 to 5, certainly one has to expect diminished values of the UTS, but the differences are situated under 4%. This conclusion of the present study is not in accordance with the results obtained by other authors [14,15] in terms of percentage of the recorded differences. Thus, Askanian et al. [14] reported 25% smaller values of the UTS measured for grey PLA specimens printed five at a time than those obtained by individual printing, while the experiments carried out by Schiavone et al. [15] revealed for natural 3D850 PLA specimens printed individually 20% higher UTS values than those obtained by simultaneous printing of five specimens and for white 3D870 PLA no influence of the printing scenario on the UTS values of the prints. These dissimilarities may be explained by the differences regarding the printing parameters and the materials used for the investigations.
As for the influence on the UTS values of the second independent variable considered by the authors, respectively the filament color (see Figure 6b), one can observe that the UTS values for specimens made of grey, respectively black filaments are higher than those of the other two colors for all printing scenarios analyzed, while those of the red specimens are lower than all others. The UTS values of the natural PLA are situated between the values determined for grey/black and red PLA. The maximal color-dependent differences, considered for each printing scenario are: 7.70% for individual printing (between the UTS of the grey and red specimens); 10.45% for three simultaneous printed specimens (between the UTS of the black and red specimens) and respectively 7.34% for five simultaneous printed specimens (between the UTS of the grey and red specimens).

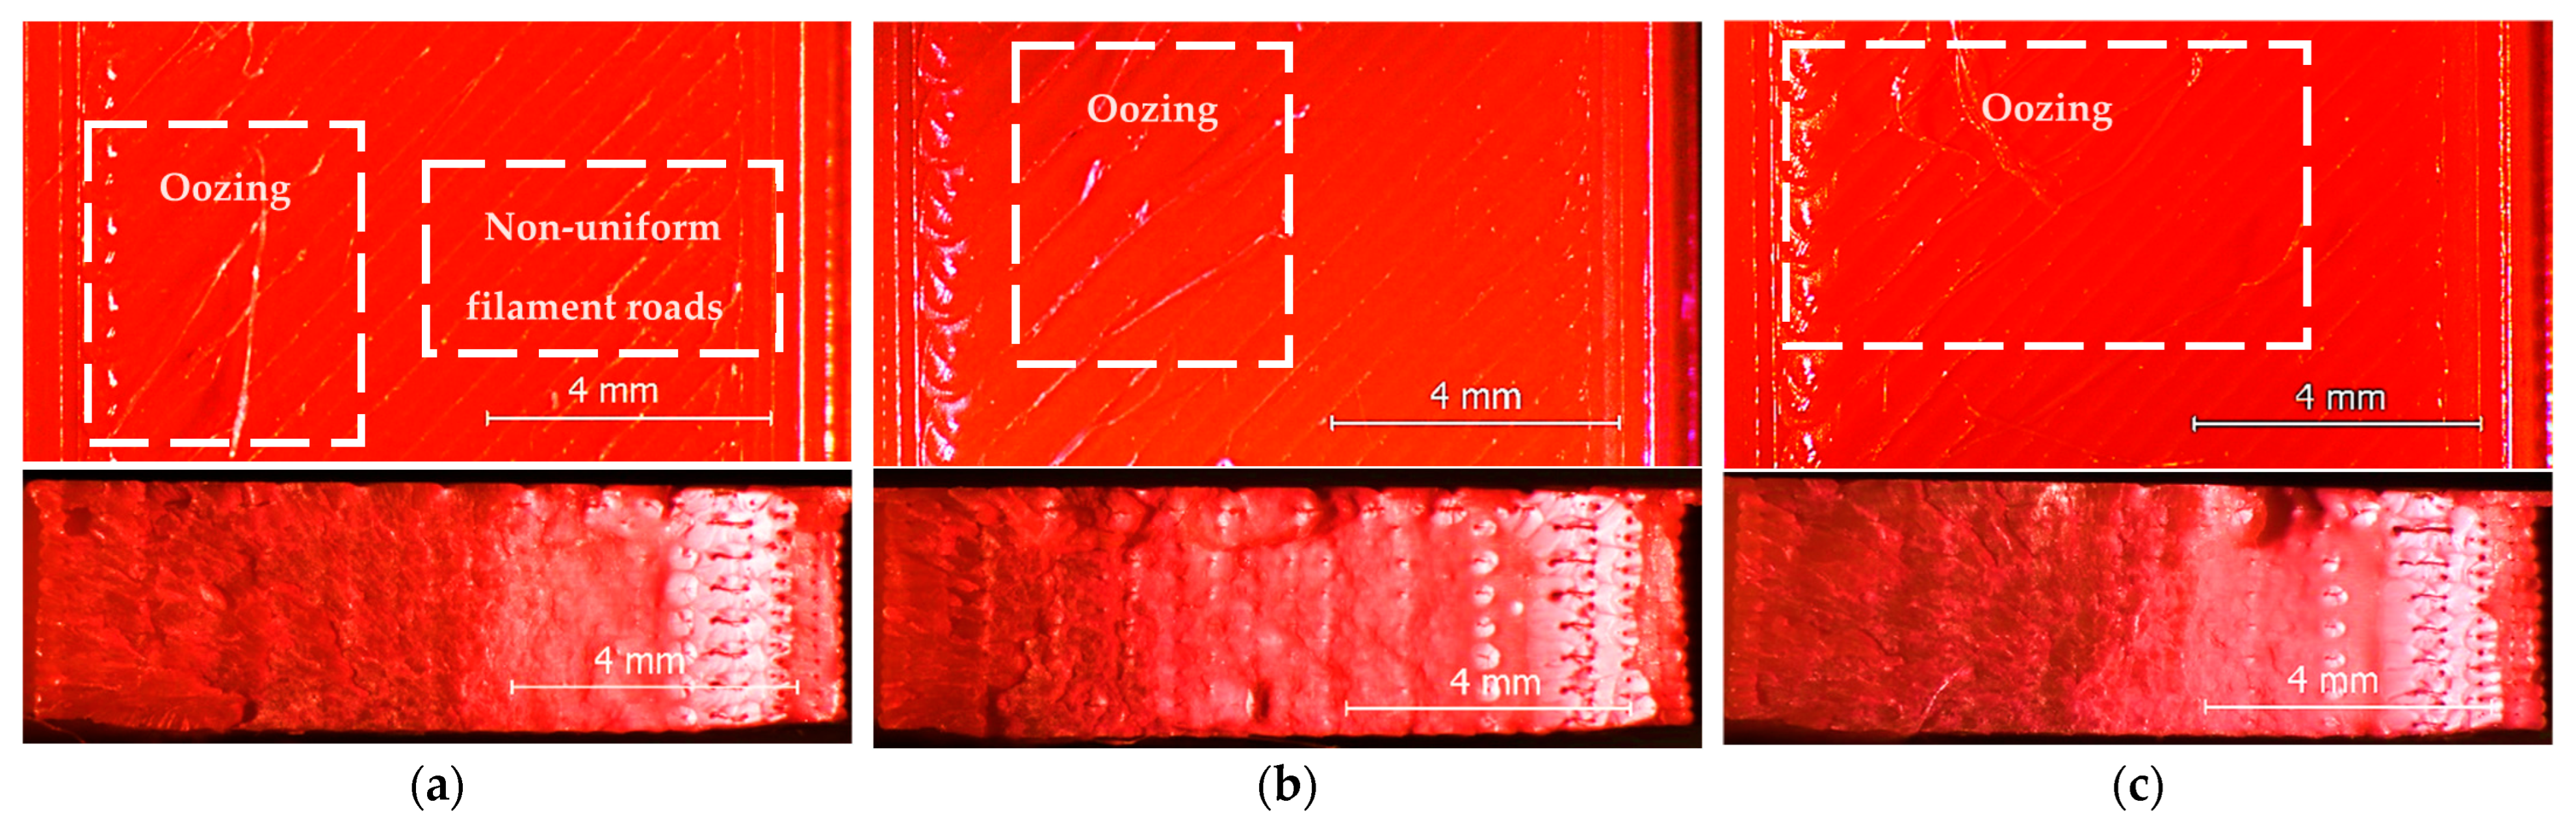
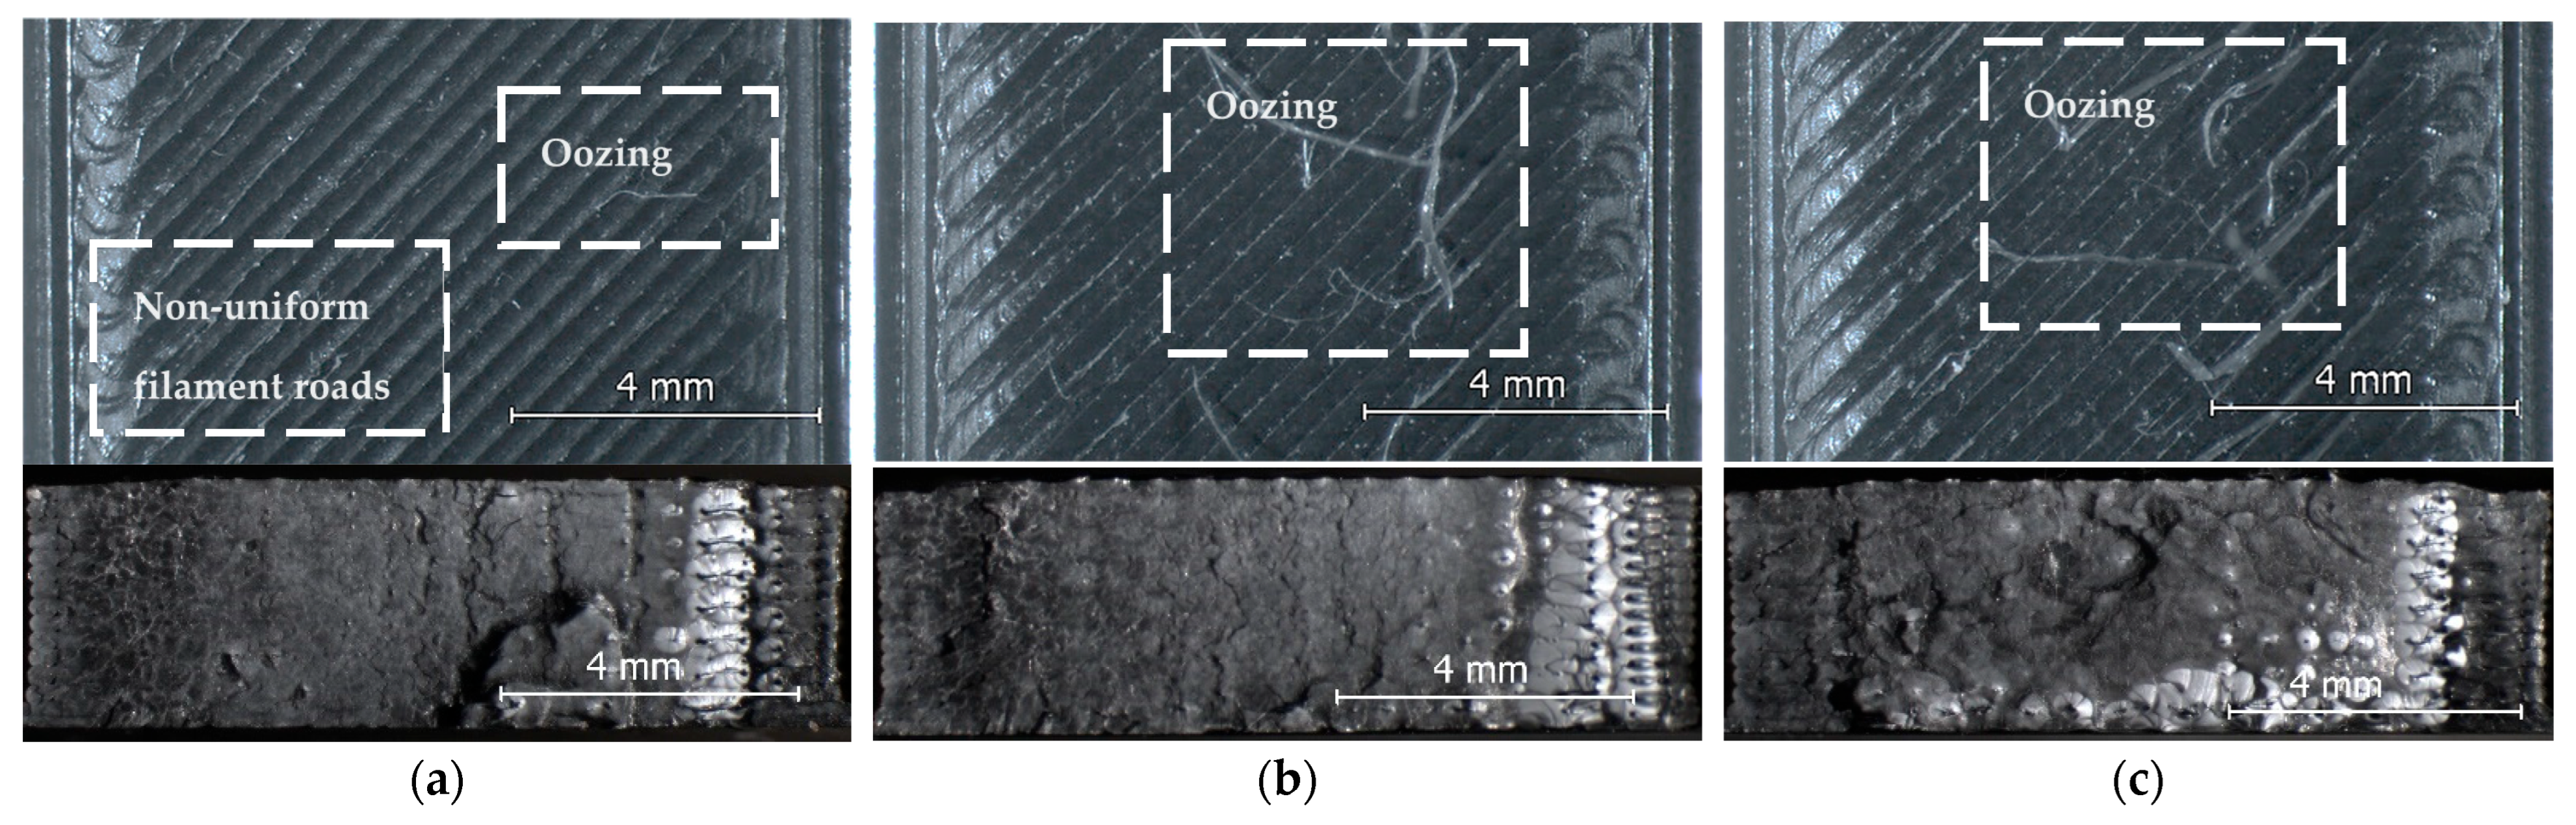
3.4. Structure of the Specimens

To explain the dependencies described above, the surface and the fractured section of the tensile specimens were examined by light microscopy, as described in Section 2.
Representative images for the three printing scenarios are presented in Figure 7, Figure 8, Figure 9 and Figure 10. No significant differences regarding the mesostructure of the specimens could be revealed related to the different positions on the build plate after simultaneously printing.
As one can observe in Figure 7, Figure 8, Figure 9 and Figure 10, the color-dependent behavior of the specimens, regarding both the dimensional accuracy and the tensile strength is directly related to their mesostructure, where aspects ranging from over-extrusion (Figure 7a–c, red PLA and Figure 8a–c, black PLA) to under-extrusion (Figure 9b,c, grey PLA and Figure 10a–c, natural PLA) can be observed.
The above presented structural differences are obviously caused by the distinctive thermal behavior of the different colored polymers, although printed with the same process parameters. As shown in previous research [17], the glass transition temperatures of colored PLA filaments are significantly influenced by the addition of coloring agents (the Tg values for natural, green and black PLA filaments, manufactured by 2M3D® Company (Novo Hamburgo, Brazil) were found to be equal to: 61.13 °C, 67.83 °C and respectively 70.29 °C, that means that up to 9.16 °C color-dependent differences were recorded). On the other hand, as shown by the results presented in Section 3.1Variation of temperature on the specimen surface” of the present work, the temperature of the upper layers during deposition of the black PLA varied between 49 °C and 64.4 °C (in dependence of the printing scenario and the specimen position on the printing plate), that means very close around the glass transition temperature indicated by the filament producer to be equal to 58 °C [24] for all filament colors. Therefore, it can be assumed that the same deposition temperature, for different filament colors might have been situated closed below or closed above their glass transition temperatures during the printing process.
Aiming to point out the differences regarding the thermal behavior of the four PLA filaments, printed with the same process parameters, also the breaking surface of one individually printed and in liquid nitrogen embrittled PLA-specimen for each color was analyzed by means of a field emission scanning electron microscope (FE-SEM). Representative images are presented in Figure 11.
As one can observe, the FE-SEM-images clearly demonstrate that, although the same printing parameters were applied for the printing of the different colored specimens, their mesostructures show characteristic aspects ranging from pronounced over-extrusion (Figure 11a, red PLA) to evident under-extrusion (Figure 11d, natural PLA).
Regarding the overall dimensional accuracy, evaluated by means of the specimens’ cross-sectional area, as presented in Figure 3, Figure 4 and Figure 5, regardless of the printing scenario and position on the build plate, the red specimens exhibited the largest dimensional deviations, whereas the best dimensional precision was obtained in case of the grey PLA filament. As visualized by the images presented in Figure 7, the selected process parameters have conduced, for all printing scenarios (individually or simultaneously printing of three, respectively five specimens) to over-extrusion for the red PLA filament and by this to specific voids, such as non-uniform filament roads and oozing. In case of the grey PLA filament, the same process parameters ensured proper conditions for individual printing (Figure 9a), but increasing the number of simultaneously printed specimens conduced to the appearance of under-extrusion defects (larger gaps between the filament roads and delamination of successive layers, especially in the vicinity of the wall lines, Figure 9b,c).
The black and the natural PLA exhibited values of the dimensional deviations situated between those of the red and the grey PLA. In case of the black conductive PLA [20,21], increasing the number of simultaneously printed specimens accentuated the over-extrusion aspects on the print’s surface (oozing, Figure 8a–c), while in case of the natural PLA the same action increased the under-extrusion structural defects (intra- and interlayer adhesion loss, Figure 10a–c).
Regarding the values of the UTS (Figure 6), one can observe that also in terms of print’s properties, the red PLA filament conduced to the lowest values for all printing scenarios and positions of simultaneously printed specimens, whereas the gray PLA assured the best results, closely followed by the black filament and between by the natural PLA. Looking at the specimens’ mesostructures (Figure 7, Figure 8, Figure 9 and Figure 10), these results were to be expected, as it is unanimously accepted that there is a direct and strong correlation between the compactness of the PLA specimens printed by FDM and their tensile strength [6,29,30,31].
Also influencing the values of the UTS is the in-process crystallinity of the semi-crystalline PLA, as demonstrated in previous research [17,20]. This may explain the slightly improved values of the UTS for black PLA in case of the three specimens printing scenario and respectively for red PLA for simultaneous printing of five specimens, as shown in Figure 6b. In these two situations, the decrease of the UTS determined by lower compactness of the PLA specimens might be compensated by the increase of the polymers strength due to proper percentage of crystalline structure.

4. Conclusions

The transition of 3D-printing from rapid prototyping to rapid fabrication has brought into attention the requirements regarding the dimensional accuracy and the properties of the prints and, moreover, the productivity of the additive manufacturing processes.
In case of the FDM method, the printing speed is a widely analyzed process parameter, that can lead to shorter production times. Simultaneous printing of identical parts could be as well a solution in this regard, if the reproducibility of the process in respect to the dimensions and the properties of all simultaneous printed products is ensured.
The obtained results led to the conclusion that the dimensional accuracy of PLA prints is significantly influenced by the printing scenario, the position of the specimens on the build plate and the filament color, as proven by ANOVA statistical analyses. The effect of the printing scenario and the specimens’ positions is less important than that of the filament color.
Thus, simultaneous printing of three and respectively five specimens slightly enhanced the dimensional deviations (increase of the cross-section area by up to 3.93% compared to the cross-section area of the individual printed specimen) and led to some differences (up to 3.65%, depending on the filament color) between the cross-section area of the specimens printed simultaneous in different positions of the build plate.
Regarding the effect of the PLA color on the dimensional accuracy of the specimens, the experiments revealed the existence of differences up to 5.71%, for the same printing scenario, regarding the cross-section area of different colored specimens (red and grey, batch of 3 specimens).
The tensile strength of FDM printed PLA specimens is influenced by the printing scenario, the position of the specimen on the build plate and the filament color, too. Also regarding the prints’ strength, the effect of the printing scenario and the specimens position is less important than that of the filament color.
Thus, when increasing the number of simultaneous printed specimens up to five, the mean value of the tensile strength of same colored specimens, printed with the same scenario, decreased slightly by up to 3.63% in relation to the UTS of the individually printed specimen (grey PLA), under the condition of up to 5.31% non-uniformity of the UTS values of different positioned prints of the same color (natural PLA).
On the other hand, the maximum differences between the mean values of the tensile strength of different colored specimens, printed with the same scenario, were found to be equal to: 7.70% for individual printing (between the UTS of the grey and red specimens), 10.45% for three specimens printed simultaneous (between the UTS of the black and red specimens) and respectively 7.34% for five specimens printed simultaneous (between the UTS of the grey and red specimens).
As an overall conclusion, one may summarize that simultaneously printed specimens could be produced only if a variation up to 4% in respect to the dimensional accuracy, respectively up to 5.5%, considering the UTS, are acceptable for later application. The filament color has to be taken into account as a possible influencing factor, as well.

Author Contributions

Conceptualization and methodology: D.F., V.C. and G.M.; data curation and investigation: V.C., R.R.T., G.T., D.F. and N.B.; writing—original draft preparation: V.C. and R.R.T.; writing—review and editing: D.F., V.C., G.T. and G.M.; visualization: V.C.; supervision: V.C. and D.F. All authors have read and agreed to the published version of the manuscript.

Funding

This research received no external funding.

Institutional Review Board Statement

Not applicable.

Informed Consent Statement

Not applicable.

Data Availability Statement

The data presented in this study are available on request from the corresponding author.

Acknowledgments

The activities of the two students, Nicoleta Bacescu and Raul Rusalin Turiac, carried out within this research were supported by the Babes-Bolyai University through Special Scholarships for Scientific Activity.

Conflicts of Interest

The authors declare no conflict of interest.

References

  1. Godec, D.; Gonzalez-Gutierrez, J.; Nordin, A.; Pei, E.; Ureña Alcázar, J. (Eds.) A Guide to Additive Manufacturing. Springer Tracts in Additive Manufacturing; Springer International Publishing: Cham, Switzerland, 2022. [Google Scholar] [CrossRef]
  2. Roscoe, S.; Cousins, P.D.; Handfield, R. Transitioning Additive Manufacturing from Rapid Prototyping to High-Volume Production: A Case Study of Complex Final Products. J. Prod. Innov. Manag. 2023, 40, 554–576. [Google Scholar] [CrossRef]
  3. Cuan-Urquizo, E.; Barocio, E.; Tejada-Ortigoza, V.; Pipes, R.; Rodriguez, C.; Roman-Flores, A. Characterization of the Mechanical Properties of FFF Structures and Materials: A Review on the Experimental, Computational and Theoretical Approaches. Materials 2019, 12, 895. [Google Scholar] [CrossRef]
  4. Valerga, A.P.; Batista, M.; Puyana, R.; Sambruno, A.; Wendt, C.; Marcos, M. Preliminary study of PLA wire colour effects on geometric characteristics of parts manufactured by FDM. Procedia Manuf. 2017, 13, 924–931. [Google Scholar] [CrossRef]
  5. Cojocaru, V.; Frunzaverde, D.; Miclosina, C.-O.; Marginean, G. The influence of the process parameters on the mechanical properties of PLA specimens produced by fused filament fabrication—A review. Polymers 2022, 14, 886. [Google Scholar] [CrossRef] [PubMed]
  6. Vanaei, H.; Shirinbayan, M.; Deligant, M.; Raissi, K.; Fitoussi, J.; Khelladi, S.; Tcharkhtchi, A. Influence of process parameters on thermal and mechanical properties of polylactic acid fabricated by fused filament fabrication. Polym. Eng. Sci. 2020, 60, 1822–1831. [Google Scholar] [CrossRef]
  7. Goh, G.D.; Yap, Y.L.; Tan, H.K.J.; Sing, S.L.; Goh, G.L.; Yeong, W.Y. Process–Structure–Properties in Polymer Additive Manufacturing via Material Extrusion: A Review. Crit. Rev. Solid State Mater. Sci. 2019, 45, 113–133. [Google Scholar] [CrossRef]
  8. Popescu, D.; Zapciu, A.; Amza, C.; Baciu, F.; Marinescu, R. FDM process parameters influence over the mechanical properties of polymer specimens: A review. Polym. Test. 2018, 69, 157–166. [Google Scholar] [CrossRef]
  9. Frunzaverde, D.; Cojocaru, V.; Ciubotariu, C.-R.; Miclosina, C.-O.; Ardeljan, D.D.; Ignat, E.F.; Marginean, G. The Influence of the Printing Temperature and the Filament Color on the Dimensional Accuracy, Tensile Strength, and Friction Performance of FFF-Printed PLA Specimens. Polymers 2022, 14, 1978. [Google Scholar] [CrossRef]
  10. Rudolph, N.; Chen, J.; Dick, T. Understanding the temperature field in fused filament fabrication for enhanced mechanical part performance. In AIP Conference Proceedings; AIP Publishing: Melville, NY, USA, 2019; Volume 2055, p. 140003. [Google Scholar] [CrossRef]
  11. Liparoti, S.; Sofia, D.; Romano, A.; Marra, F.; Pantani, R. Fused Filament Deposition of PLA: The Role of Interlayer Adhesion in the Mechanical Performances. Polymers 2021, 13, 399. [Google Scholar] [CrossRef]
  12. Corson, B.; Asseko, A.C.A. Effect of the Nozzle Radiation on the Fused Filament Fabrication Process: Three-Dimensional Numerical Simulations and Experimental Investigation. J. Heat Transf. 2019, 141, 082102-1. [Google Scholar] [CrossRef]
  13. Vanaei, H.R.; Shirinbayan, M.; Costa, S.F.; Duarte, F.M.; Covas, J.A.; Deligant, M.; Khelladi, S.; Tcharkhtchi, A. Experimental Study of PLA Thermal Behavior during Fused Filament Fabrication. J. Appl. Polym. Sci. 2020, 138, 49747. [Google Scholar] [CrossRef]
  14. Askanian, H.; Muranaka de Lima, D.; Commereuc, S.; Verney, V. Toward a Better Understanding of the Fused Deposition Modeling Process: Comparison with Injection Molding. 3D Print. Addit. Manuf. 2018, 5, 319–327. [Google Scholar] [CrossRef]
  15. Schiavone, N.; Verney, V.; Askanian, H. Effect of 3D Printing Temperature Profile on Polymer Materials Behavior. 3D Print. Addit. Manuf. 2020, 7, 311–325. [Google Scholar] [CrossRef]
  16. Frunzaverde, D.; Cojocaru, V.; Bacescu, N.; Ciubotariu, C.-R.; Miclosina, C.-O.; Turiac, R.R.; Marginean, G. The Influence of the Layer Height and the Filament Color on the Dimensional Accuracy and the Tensile Strength of FDM-Printed PLA Specimens. Polymers 2023, 15, 2377. [Google Scholar] [CrossRef] [PubMed]
  17. Soares, J.B.; Finamor, J.; Silva, F.P.; Roldo, L.; Candido, L.H. Analysis of the influence of polylactic acid (PLA) colour on FDM 3D printing temperature and part finishing. Rapid Prototyp. J. 2018, 24, 1305–1316. [Google Scholar] [CrossRef]
  18. Wittbrodt, B.; Pearce, J.M. The effects of PLA color on material properties of 3-D printed components. Addit. Manuf. 2015, 8, 110–116. [Google Scholar] [CrossRef]
  19. Sedlak, J.; Hrusecka, D.; Jurickova, E.; Hrbackova, l.; Spisak, L.; Joska, Z. Analysis of test plastic samples printed by the additive method fused filament fabrication. MM Sci. J. 2021, 1, 4283–4290. [Google Scholar] [CrossRef]
  20. Beniak, J.; Šooš, Ľ.; Križan, P.; Matúš, M.; Ruprich, V. Resistance and Strength of Conductive PLA Processed by FDM Additive Manufacturing. Polymers 2022, 14, 678. [Google Scholar] [CrossRef]
  21. Zheng, Y.; Huang, X.; Chen, J.; Wu, K.; Wang, J.; Zhang, X. A Review of Conductive Carbon Materials for 3D Printing: Materials, Technologies, Properties, and Applications. Materials 2021, 14, 3911. [Google Scholar] [CrossRef]
  22. ISO 527-2:2012; Plastics—Determination of Tensile Properties—Part 2: Test Conditions for Molding and Extrusion Plastics. International Organization for Standardization: Geneva, Switzerland, 2012.
  23. ISO/ASTM 52921:2013; Standard Terminology for Additive Manufacturing—Coordinate Systems and Test Methodologies. International Organization for Standardization: Geneva, Switzerland, 2013.
  24. Available online: https://www.verbatim.ro/ro/prod/verbatim-pla-filament-2-85mm-1kg-black-55327 (accessed on 10 July 2023).
  25. Turiac, R.R.; Cojocaru, V.; Bacescu, N.; Frunzaverde, D.; Miclosina, C.O.; Marginean, G. Dependence of the Temperature Field on the Number of Simultaneously FDM—Printed PLA Samples. In Proceedings of the 16th International Conference on Accomplishments in Mechanical and Industrial Engineering DEMI 2023, Banja Luka, Republika Srpska, 1–2 June 2023. [Google Scholar]
  26. ISO 527-1:2019; Plastics—Determination of Tensile Properties—Part 1: General Principles. International Organization for Standardization: Geneva, Switzerland, 2019.
  27. ISO 2602:1980; Statistical Interpretation of Test Results–Estimation of the Mean—Confidence Interval. International Organization for Standardization: Geneva, Switzerland, 1980.
  28. Bakar, A.A.B.A.; Zainuddin, M.Z.B.; Adam, A.N.B.; Noor, I.S.B.M.; Tamchek, N.B.; Alauddin, M.S.B.; Ghazali, M.I.B.M. The Study of Mechanical Properties of Poly(Lactic) Acid PLA-Based 3D Printed Filament under Temperature and Environmental Conditions. Mater. Today Proc. 2022, 67, 652–658. [Google Scholar] [CrossRef]
  29. Kuznetsov, V.E.; Solonin, A.N.; Tavitov, A.; Urzhumtsev, O.; Vakulik, A. Increasing strength of FFF three-dimensional printed parts by influencing on temperature-related parameters of the process. Rapid Prototyp. J. 2020, 26, 107–121. [Google Scholar] [CrossRef]
  30. Vanaei, H.R.; Shirinbayan, M.; Deligant, M.; Khelladi, S.; Tcharkhtchi, A. In-Process Monitoring of Temperature Evolution during Fused Filament Fabrication: A Journey from Numerical to Experimental Approaches. Thermo 2021, 1, 332–360. [Google Scholar] [CrossRef]
  31. Altan, M.; Eryildiz, M.; Gumus, B.; Kahraman, Y. Effects of process parameters on the quality of PLA products fabricated by fused deposition modeling (FDM): Surface roughness and tensile strength. Mater. Test. 2018, 60, 471–477. [Google Scholar] [CrossRef]
Figure 1. The layouts for 3D printing: (a) individual printing, (b) three specimens printed simultaneous, (c) five specimens printed simultaneous.
Applsci 14 07642 g001
Figure 2. The variation of the temperature on the top surface of layers 3–15, black PLA: (a) individually printed specimens, (b) three specimens printed simultaneous, (c) five specimens printed simultaneous (after [25]).
Applsci 14 07642 g002
Figure 3. The variation of the cross-section area (mm2) for three specimens printed simultaneous.
Applsci 14 07642 g003
Figure 4. The variation of the cross-section area (mm2) for five specimens printed simultaneous.
Applsci 14 07642 g004
Figure 5. The variation of the cross-section area (mm2) for specimens printed in the central position (1.1, 3.2 and 5.3).
Applsci 14 07642 g005
Figure 6. The variation of the UTS [MPa]: (a) UTS vs. color, (b) UTS vs. printing scenarios.
Applsci 14 07642 g006
Figure 7. Top view (up) and fractured section (down) of red PLA tensile specimens printed: (a) individual, (b) three specimens simultaneous, (c) five specimens simultaneous.
Applsci 14 07642 g007
Figure 8. Top view (up) and fractured section (down) of black PLA tensile specimens printed: (a) individual, (b) three specimens simultaneous, (c) five specimens simultaneous.
Applsci 14 07642 g008
Figure 9. Top view (up) and fractured section (down) of grey PLA tensile specimens printed: (a) individual, (b) three specimens simultaneous, (c) five specimens simultaneous.
Applsci 14 07642 g009
Figure 10. Top view (up) and fractured section (down) of natural PLA tensile specimens printed: (a) individual, (b) three specimens simultaneous, (c) five specimens simultaneous.
Applsci 14 07642 g010
Figure 11. Fractured section of the individually printed: (a) red PLA specimen, (b) black PLA specimen; (c) grey PLA specimen; (d) natural PLA specimen. FE-SEM images.
Applsci 14 07642 g011
Table 1. 3D-printing parameters.
ParametersValues
Fixed process parametersLayer thickness, t0.2 mm
Printing head temperature, TH210 °C
Build plate temperature, TB60 °C
Printing speed, sp50 mm/s
Nozzle diameter, dn0.40 mm
Filament diameter, df2.85 mm
Build orientation (acc. to [23])YX
Raster angle, θ45°/−45°
Infill density100%
Number of wall lines, WL (-)2
Variable parametersNumber of simultaneously printed specimens1 specimen/build plate
3 specimens/build plate
5 specimens/build plate
Material/Filament colorPLA Black; PLA Natural; PLA Grey; PLA Red
Table 2. Dimensional accuracy data. Specimens individually printed.
ColorCodeWidth (mm)Thickness (mm)Cross-Section Area (mm2)
MeanMean Dev.Std. Dev.MeanMean Dev.Std. Dev.MeanMean Dev.Std. Dev.
Natural1.110.1310.1310.1283.2160.2160.01532.5772.5770.263
Black1.110.0860.0860.0133.1890.1890.02932.1642.1640.329
Grey1.110.0590.0590.0183.1910.1910.02632.0962.0960.295
Red1.110.1280.1280.0143.3220.3220.06033.6513.6510.650
Table 3. Dimensional accuracy data. Three specimens simultaneous printed.
ColorCodeWidth (mm)Thickness (mm)Cross-Section Area (mm2)
MeanMean Dev.Std. Dev.MeanMean Dev.Std. Dev.MeanMean Dev.Std. Dev.
Natural3.110.3170.3170.1233.1970.1970.01832.9822.9820.214
3.210.2700.2700.1223.2160.2160.01433.0243.0240.296
3.310.1730.1730.0893.2520.2520.01633.0853.0850.132
Black3.110.1280.1280.0093.1600.1600.02332.0092.0090.259
3.210.1160.1160.0073.1820.1820.03132.1912.1910.314
3.310.1250.1250.0093.2150.2150.02732.5542.5540.278
Grey3.110.1000.1000.0133.1560.1560.02031.8701.8700.199
3.210.0690.0690.0103.1740.1740.02031.9621.9620.205
3.310.1000.1000.0093.2050.2050.02332.3672.3670.252
Red3.110.1590.1590.0183.3010.3010.03633.5303.5300.415
3.210.1490.1490.0213.3370.3370.03533.8633.8630.385
3.310.1580.1580.0183.3770.3770.02734.3004.3000.314
Table 4. Dimensional accuracy data. Five specimens simultaneous printed.
ColorCodeWidth (mm)Thickness (mm)Cross-Section Area (mm2)
MeanMean Dev.Std. Dev.MeanMean Dev.Std. Dev.MeanMean Dev.Std. Dev.
Natural5.110.3430.3430.0653.2090.2090.01733.1943.1940.353
5.210.4060.4060.0633.2220.2220.02333.5243.5240.334
5.310.1890.1890.1383.2310.2310.01832.9252.9250.494
5.410.1470.1470.0493.2590.2590.01333.0693.0690.266
5.510.1160.1160.0163.2890.2890.02133.2733.2730.231
Black5.110.1470.1460.0273.2360.2360.07732.8332.8330.855
5.210.1800.1800.0203.2490.2490.08633.0733.0730.939
5.310.1450.1450.0253.2960.2960.07833.4393.4390.866
5.410.1680.1680.0193.3220.3220.07433.7723.7720.811
5.510.1850.1850.0173.3410.3410.07434.0324.0320.809
Grey5.110.1060.1060.0213.1750.1750.01932.0872.0870.230
5.210.1190.1190.0193.1800.1800.02032.1732.1730.247
5.310.0980.0980.0173.1930.1930.01932.2432.2430.216
5.410.1200.1200.0133.2210.2210.02832.5932.5930.305
5.510.1400.1400.0163.2310.2310.01732.7632.7630.198
Red5.110.1560.1560.0113.3110.3110.03833.6313.6310.418
5.210.1870.1870.0143.3290.3290.05133.9143.9140.563
5.310.1590.1590.0153.3430.3430.03533.9613.9610.400
5.410.1820.1820.0133.3630.3630.03434.2474.2470.374
5.510.2050.2050.0113.3690.3690.02134.3814.3810.244
Table 5. Tensile tests data.
CodeUTS (MPa)
MeanStd. Dev.MeanStd. Dev.MeanStd. Dev.MeanStd. Dev.
NaturalBlackGreyRed
1.152.400.2853.861.3855.100.9751.150.55
3.151.100.3855.031.8254.130.4950.251.10
3.251.290.8654.470.6054.290.1249.421.28
3.350.850.9253.441.2353.620.9047.871.01
5.151.090.9653.331.1653.820.8349.290.54
5.250.480.4353.281.4153.290.7049.680.75
5.352.160.9752.211.9253.601.0549.431.79
5.450.820.8552.670.9353.001.3649.091.44
5.549.530.6351.791.5251.770.6249.830.99
Disclaimer/Publisher’s Note: The statements, opinions and data contained in all publications are solely those of the individual author(s) and contributor(s) and not of MDPI and/or the editor(s). MDPI and/or the editor(s) disclaim responsibility for any injury to people or property resulting from any ideas, methods, instructions or products referred to in the content.

