
Dense Small Object Detection Based on an Improved YOLOv7 Model

Abstract
1. Introduction
2. Related Work
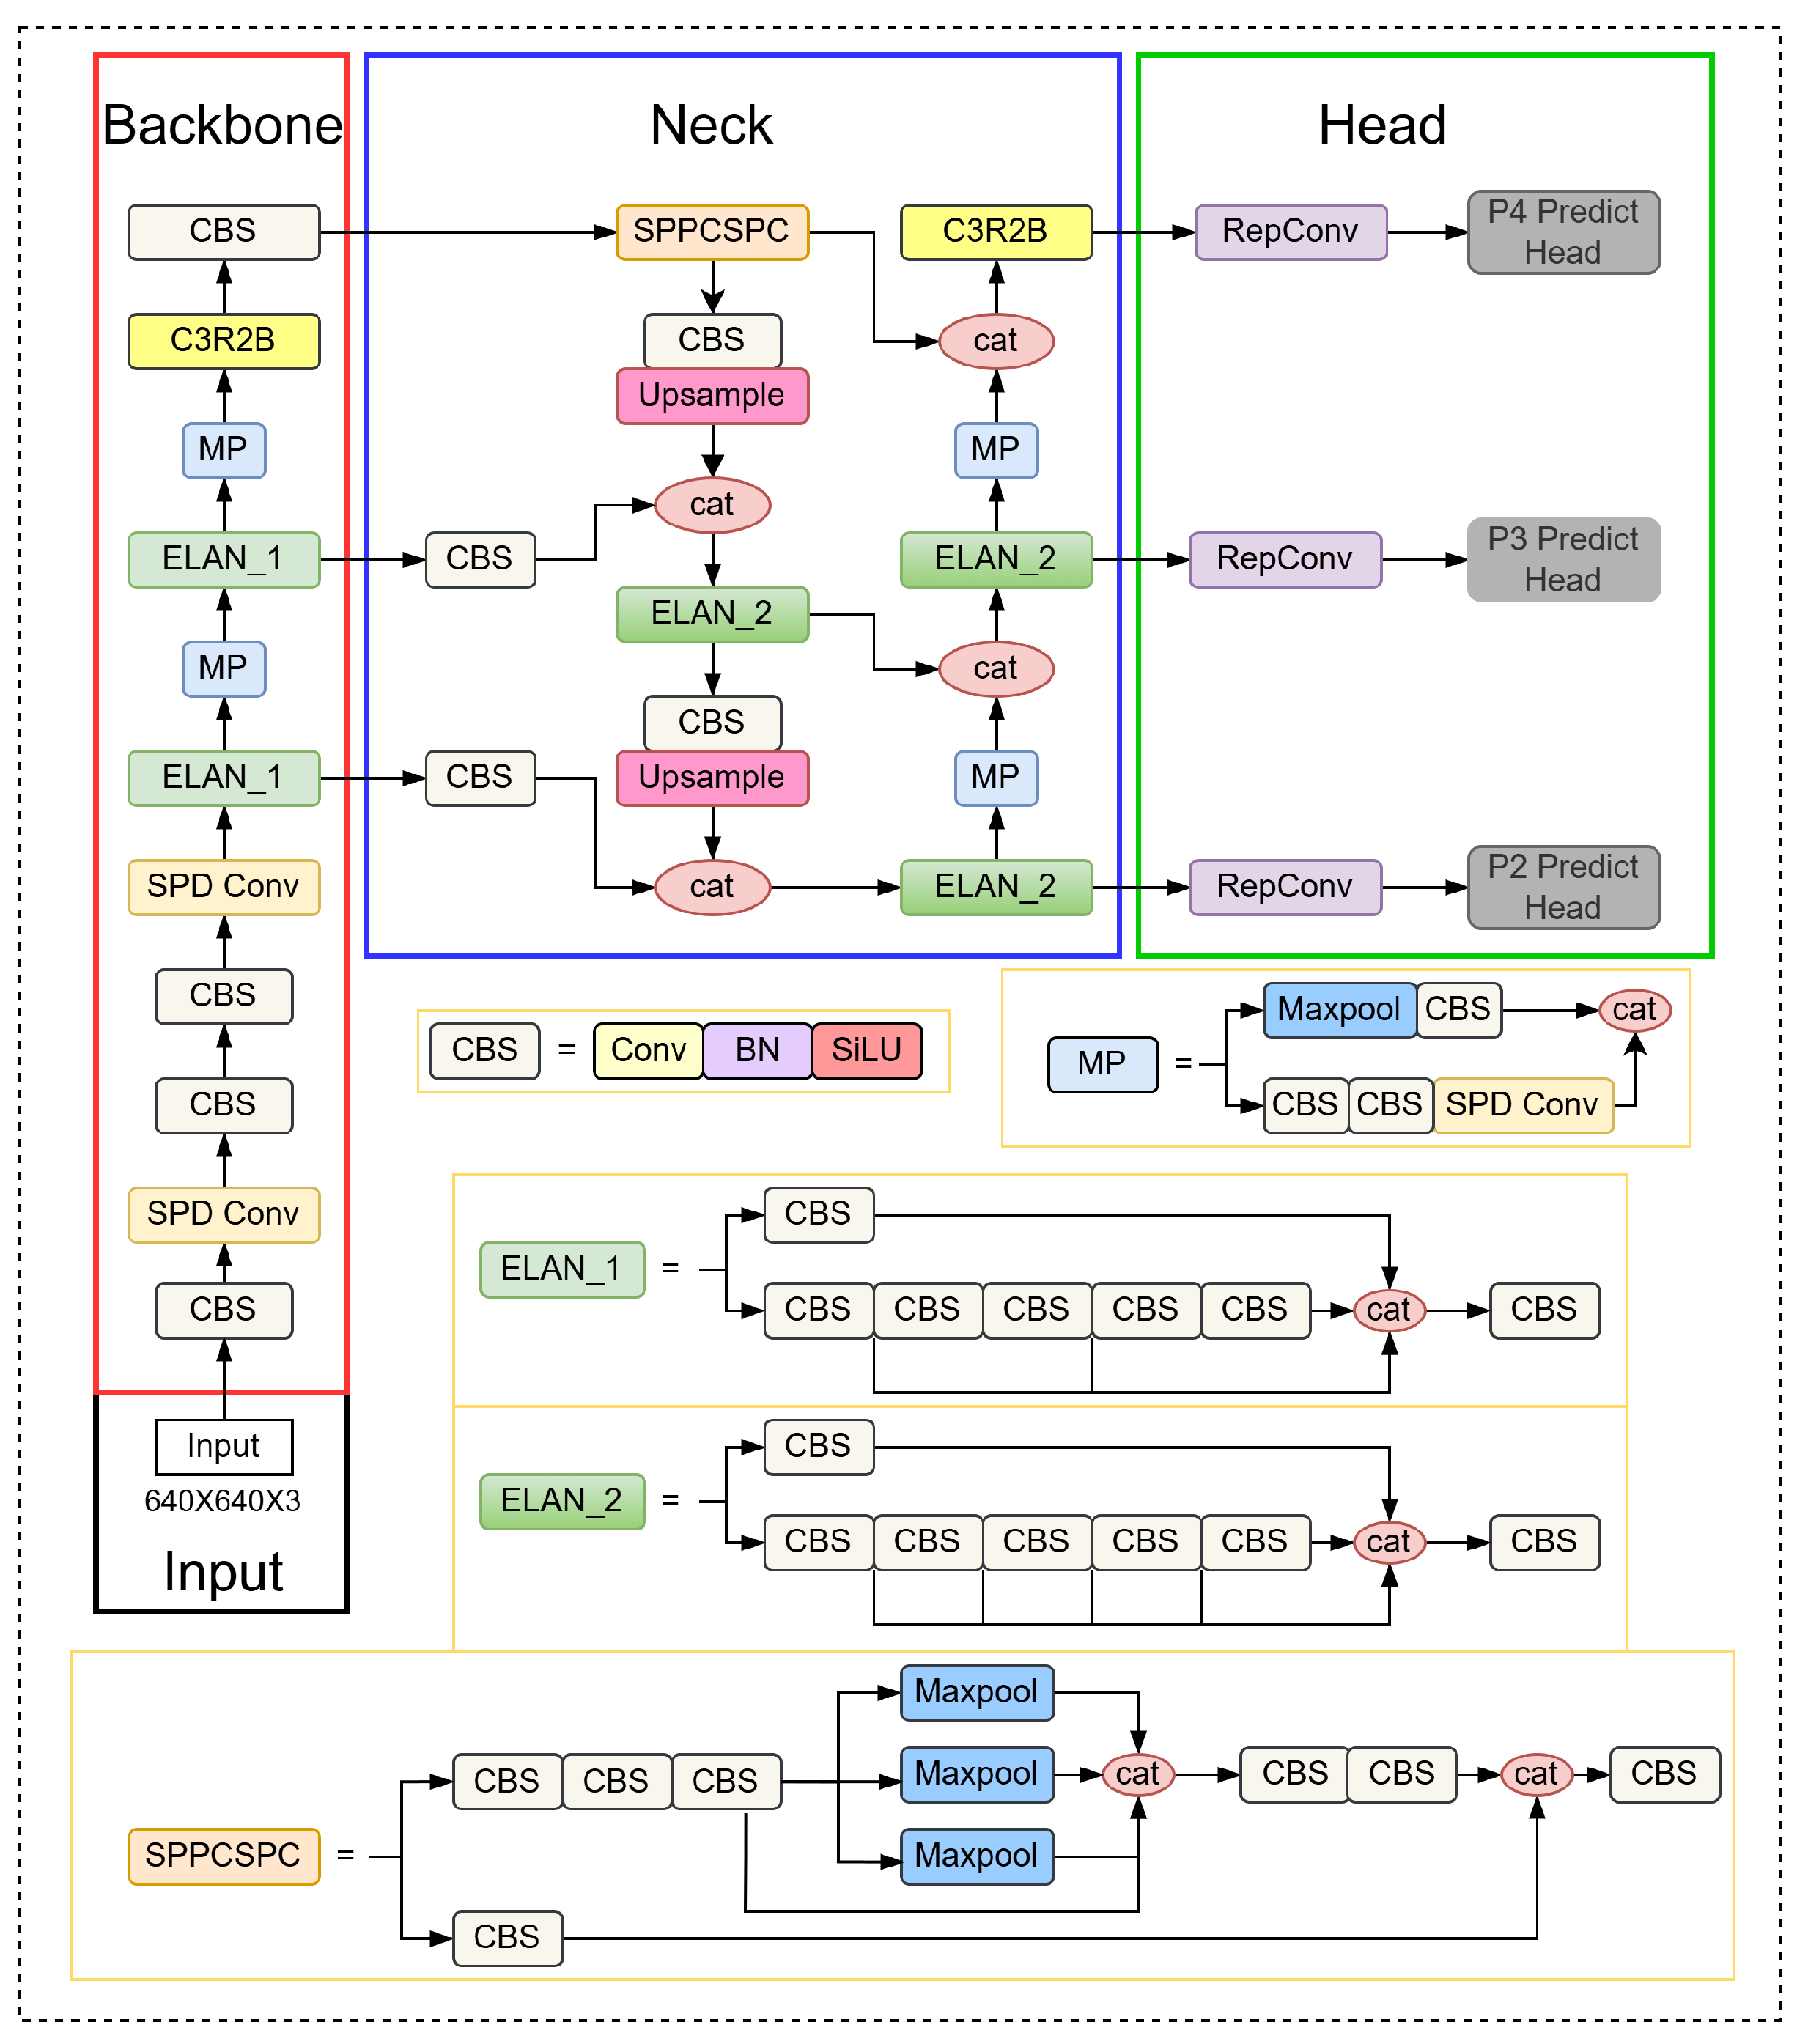
3. Proposed Method
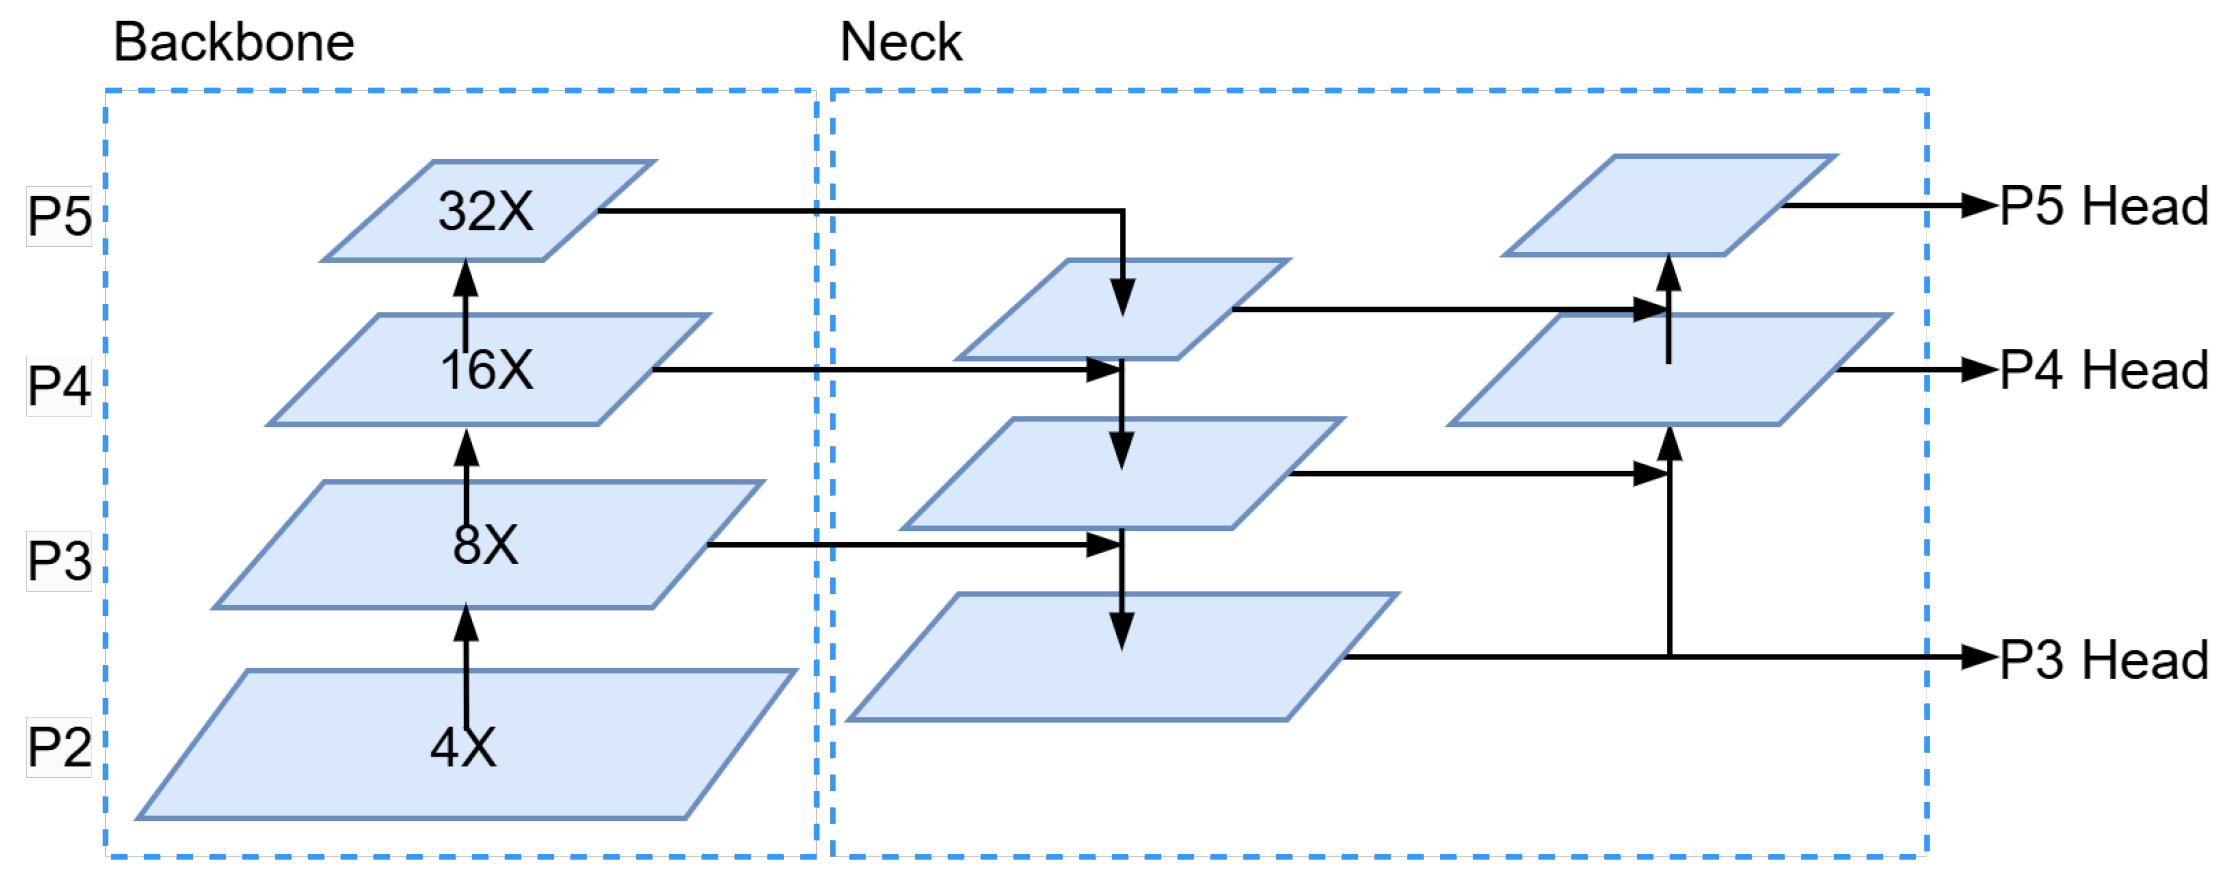
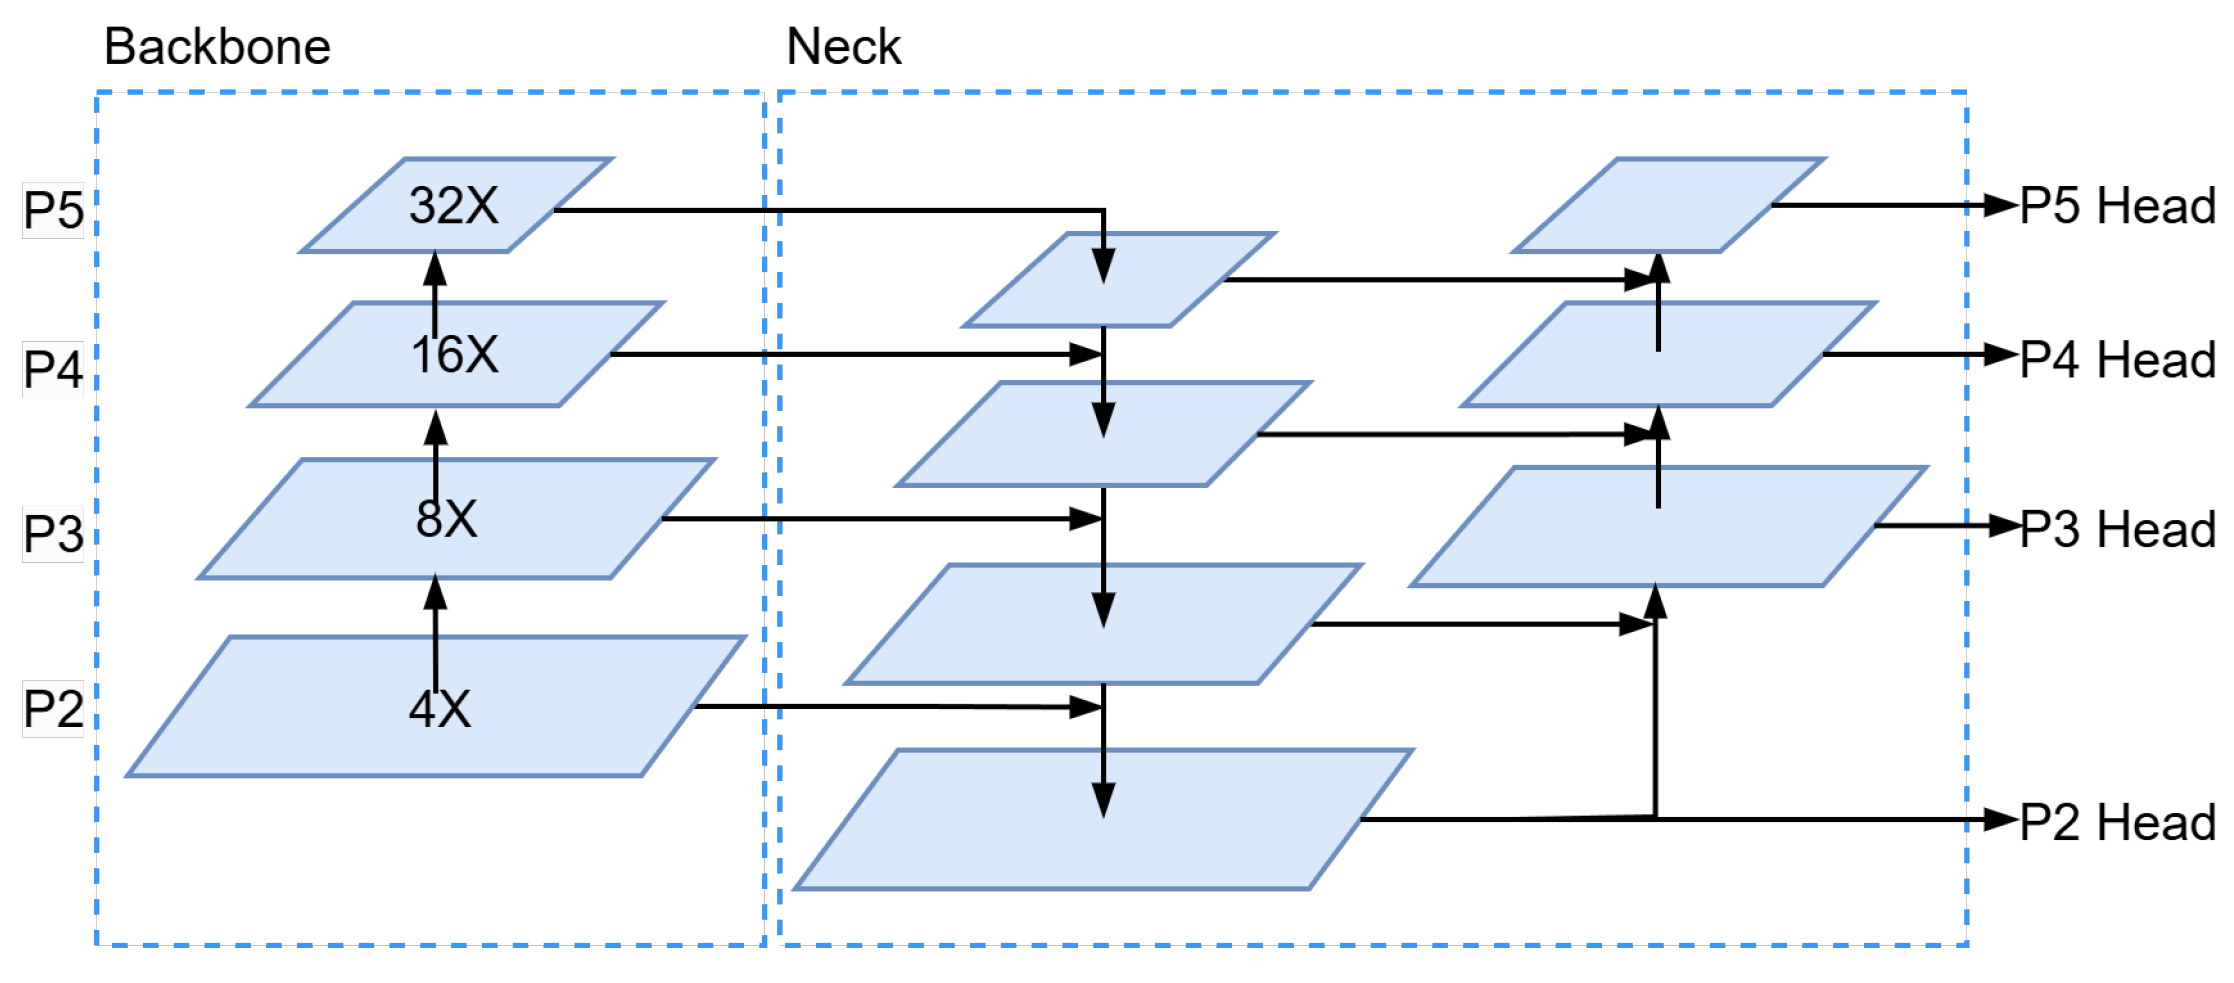
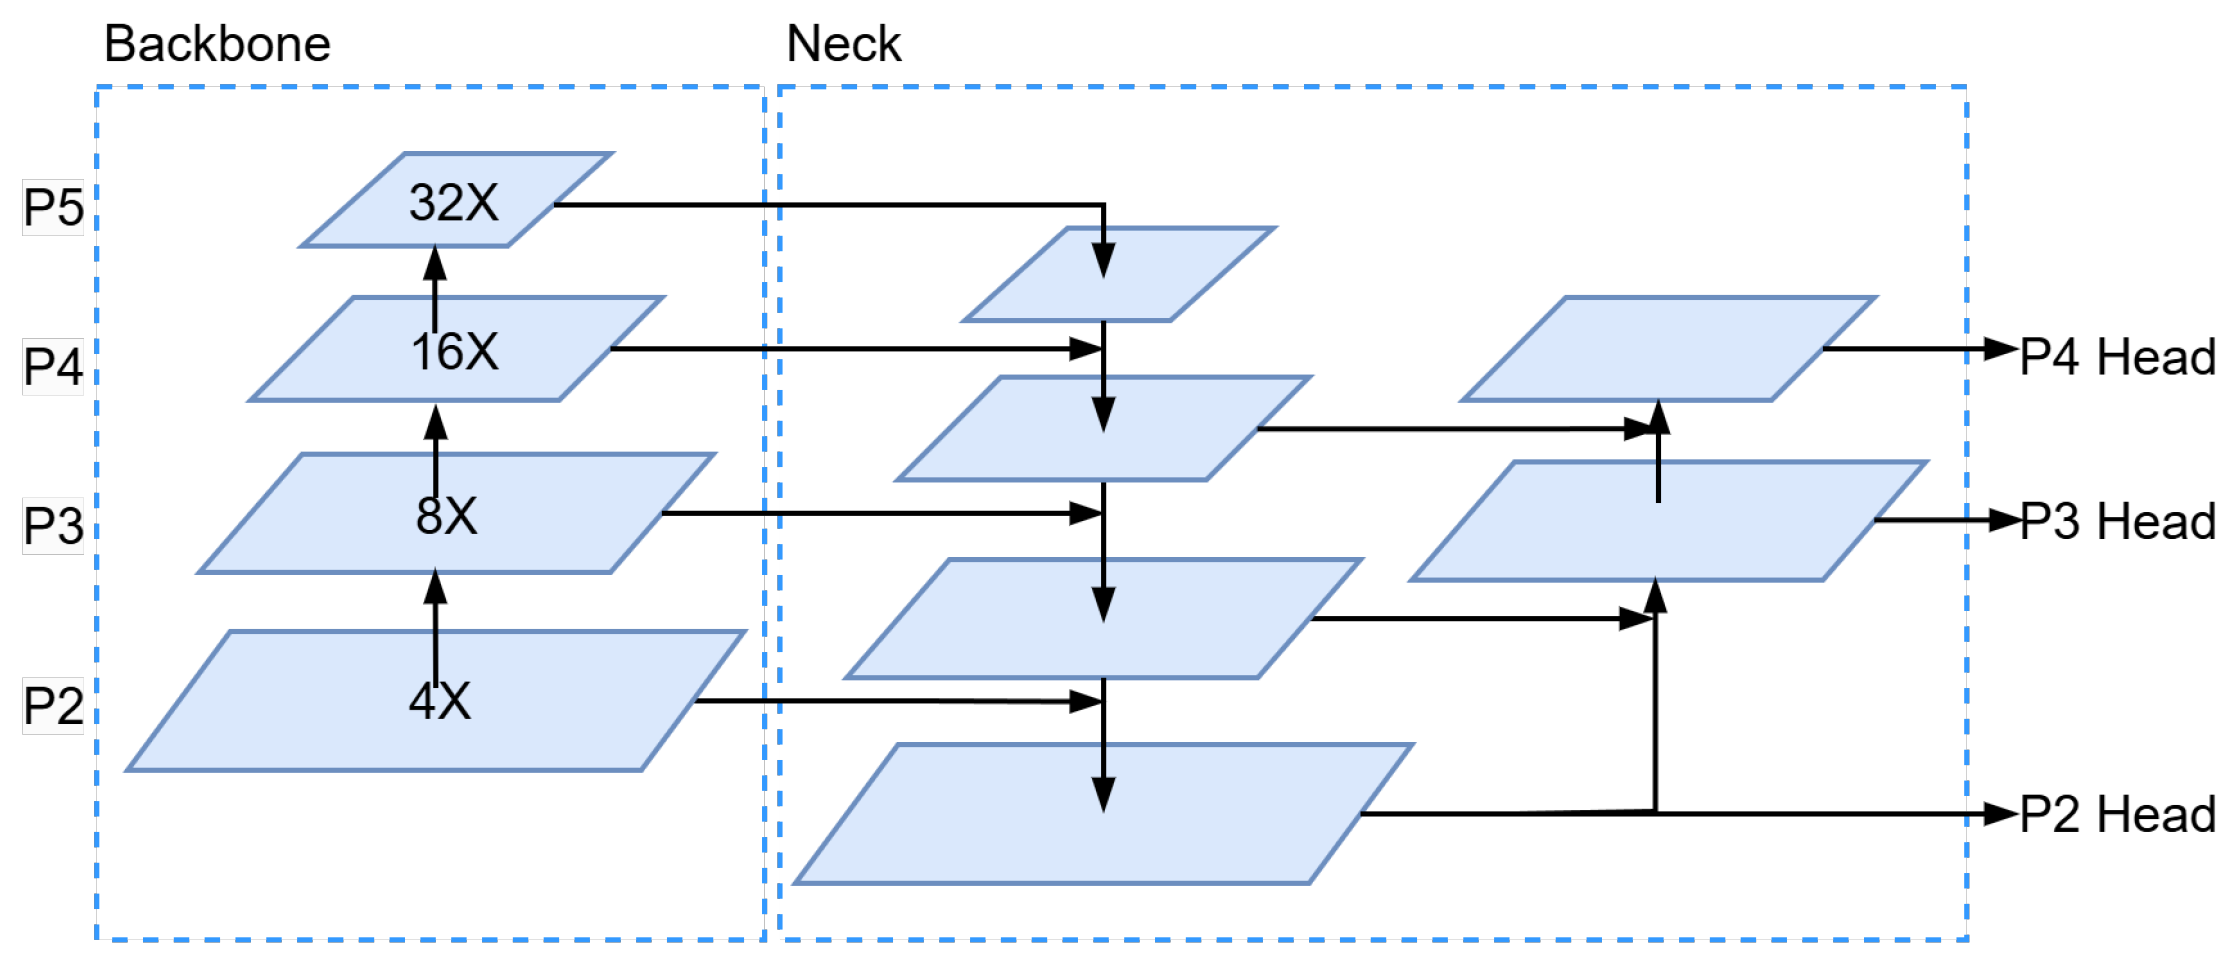
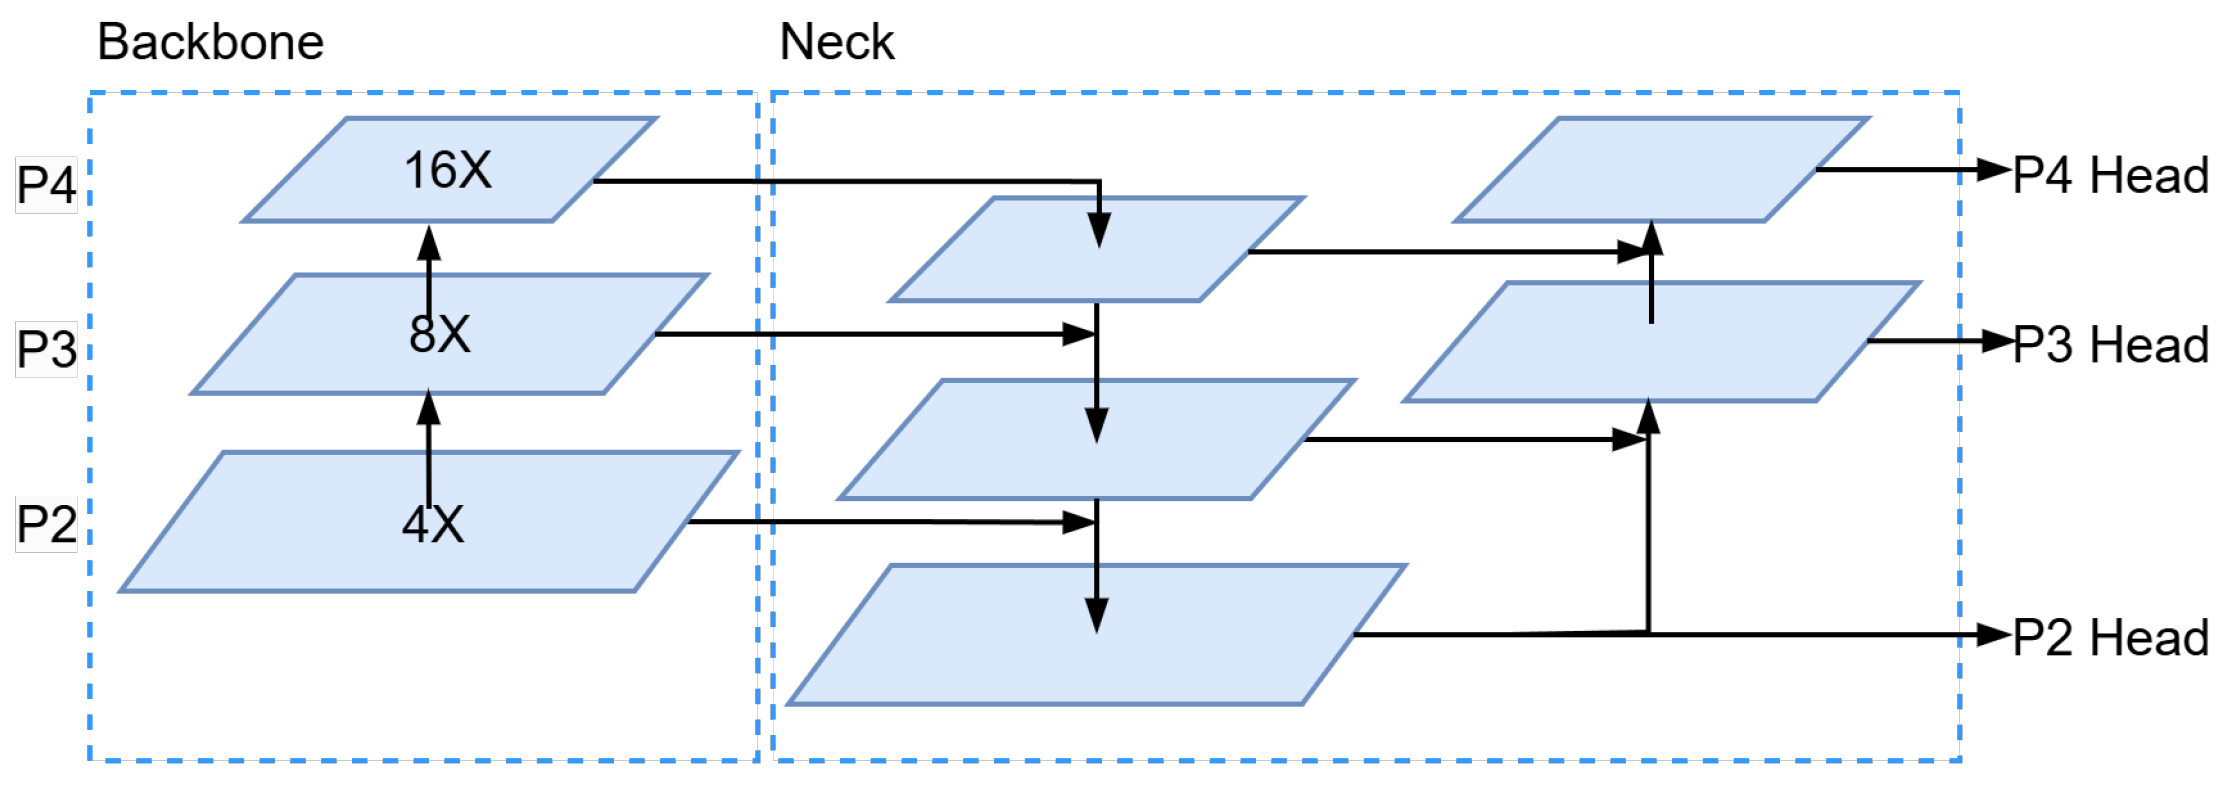
3.1. More Focus on Small Object Detection Head
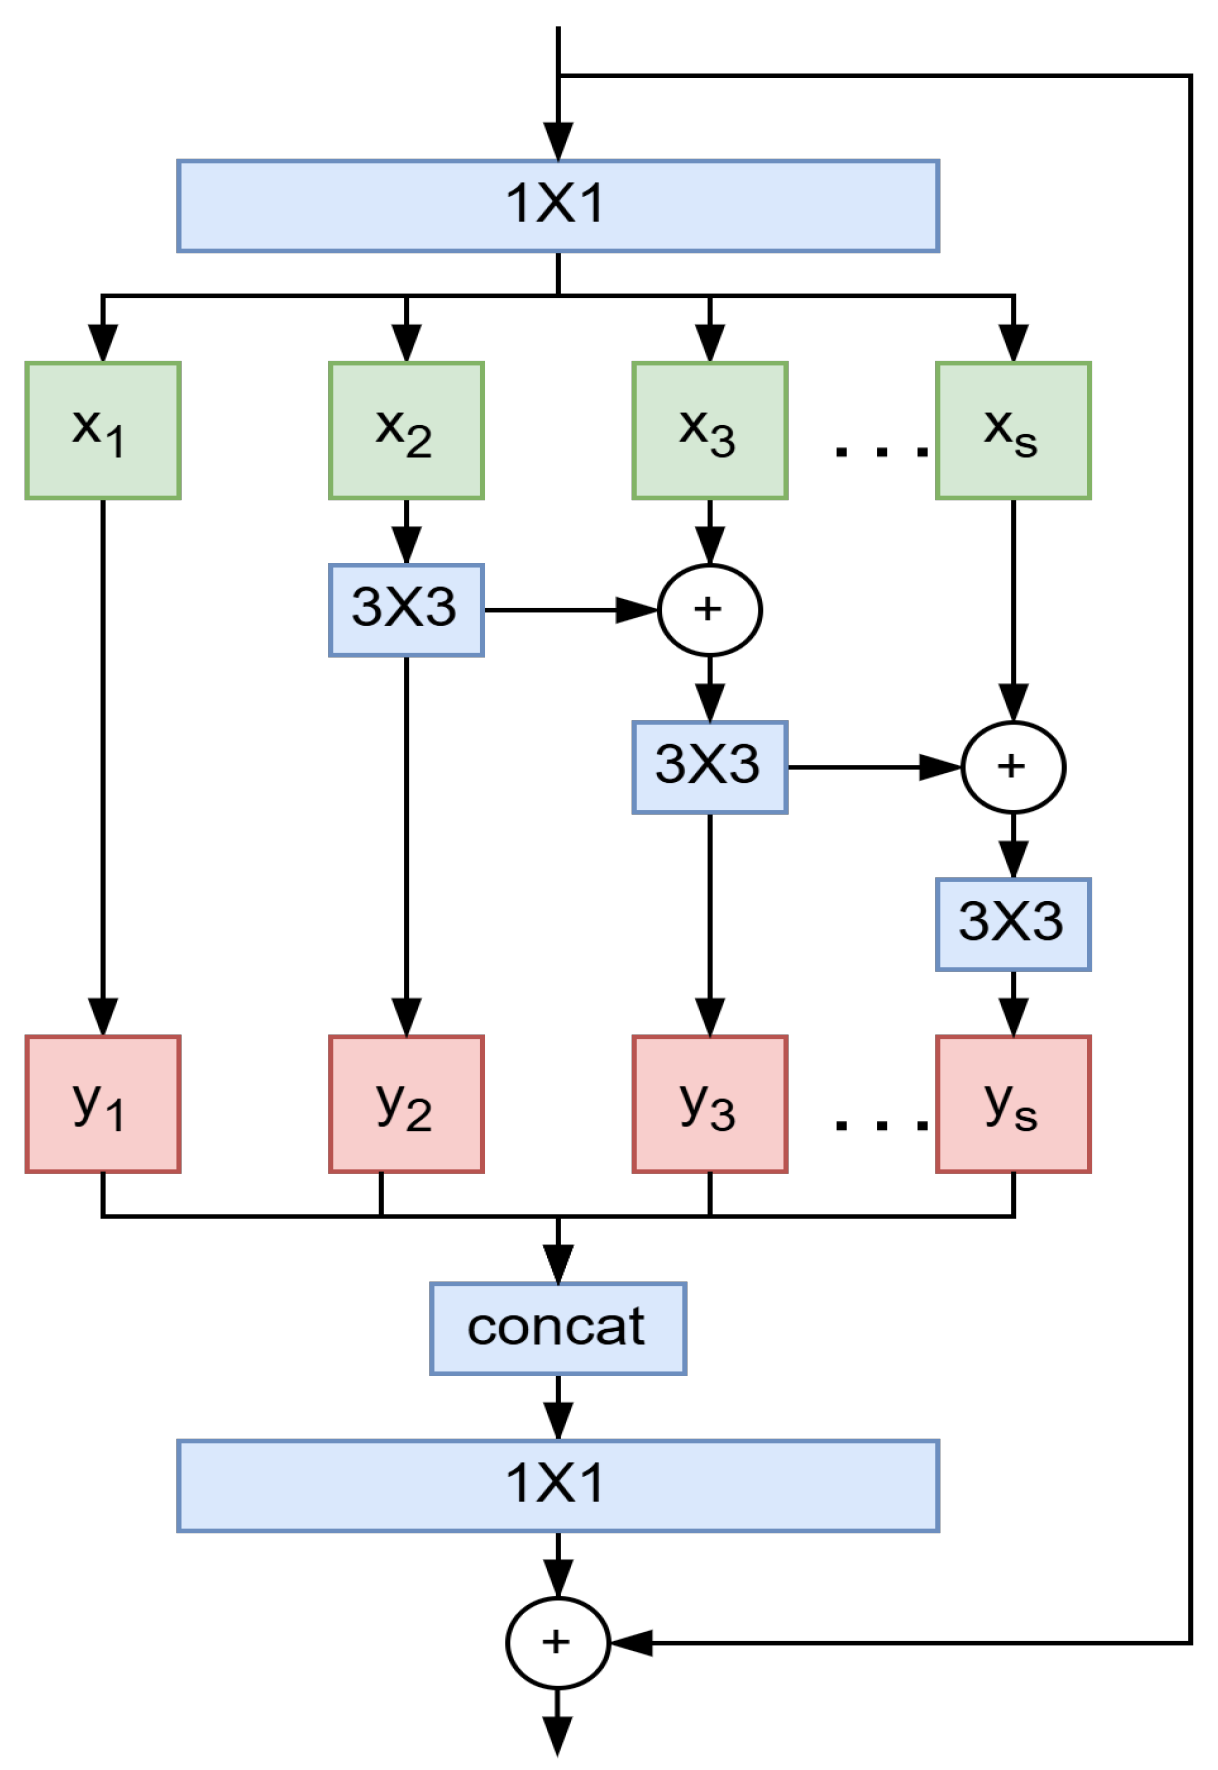
3.2. Multi-Scale Feature Extraction Module
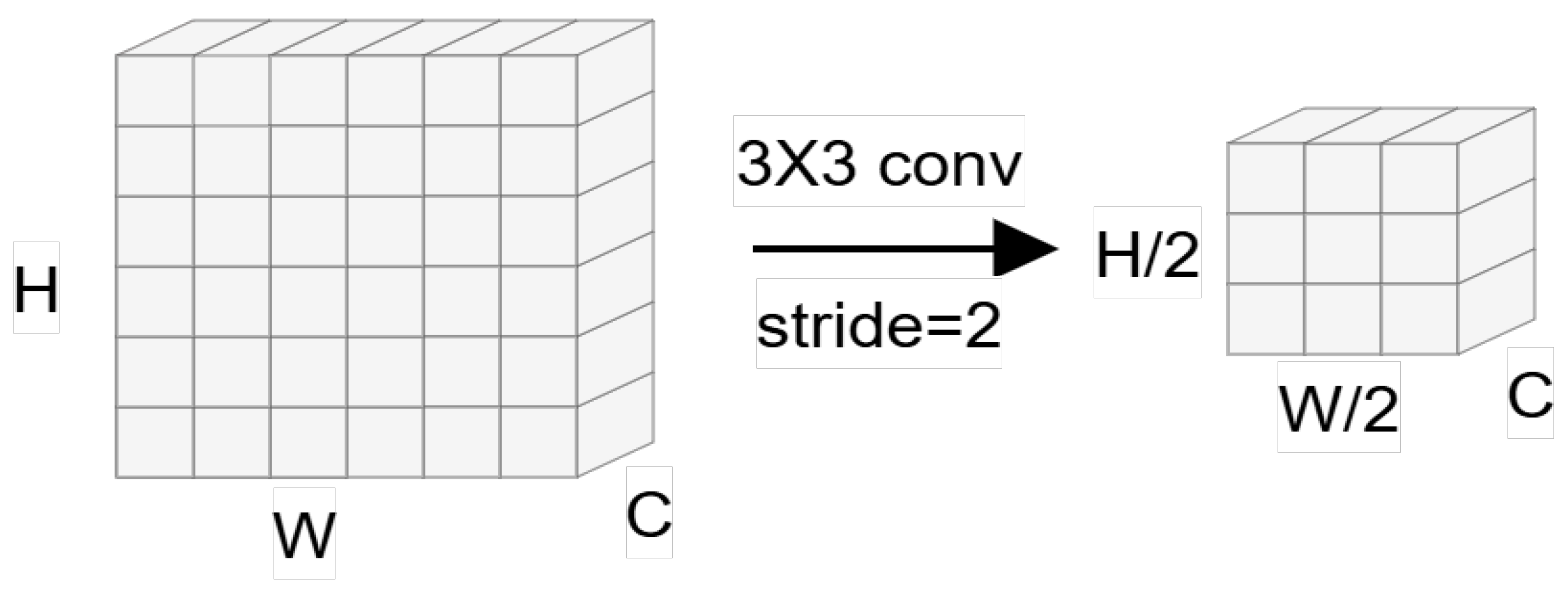
3.3. SPD Conv Downsampling
3.4. ELAN Model Optimization
4. Experiments and Analysis of Results
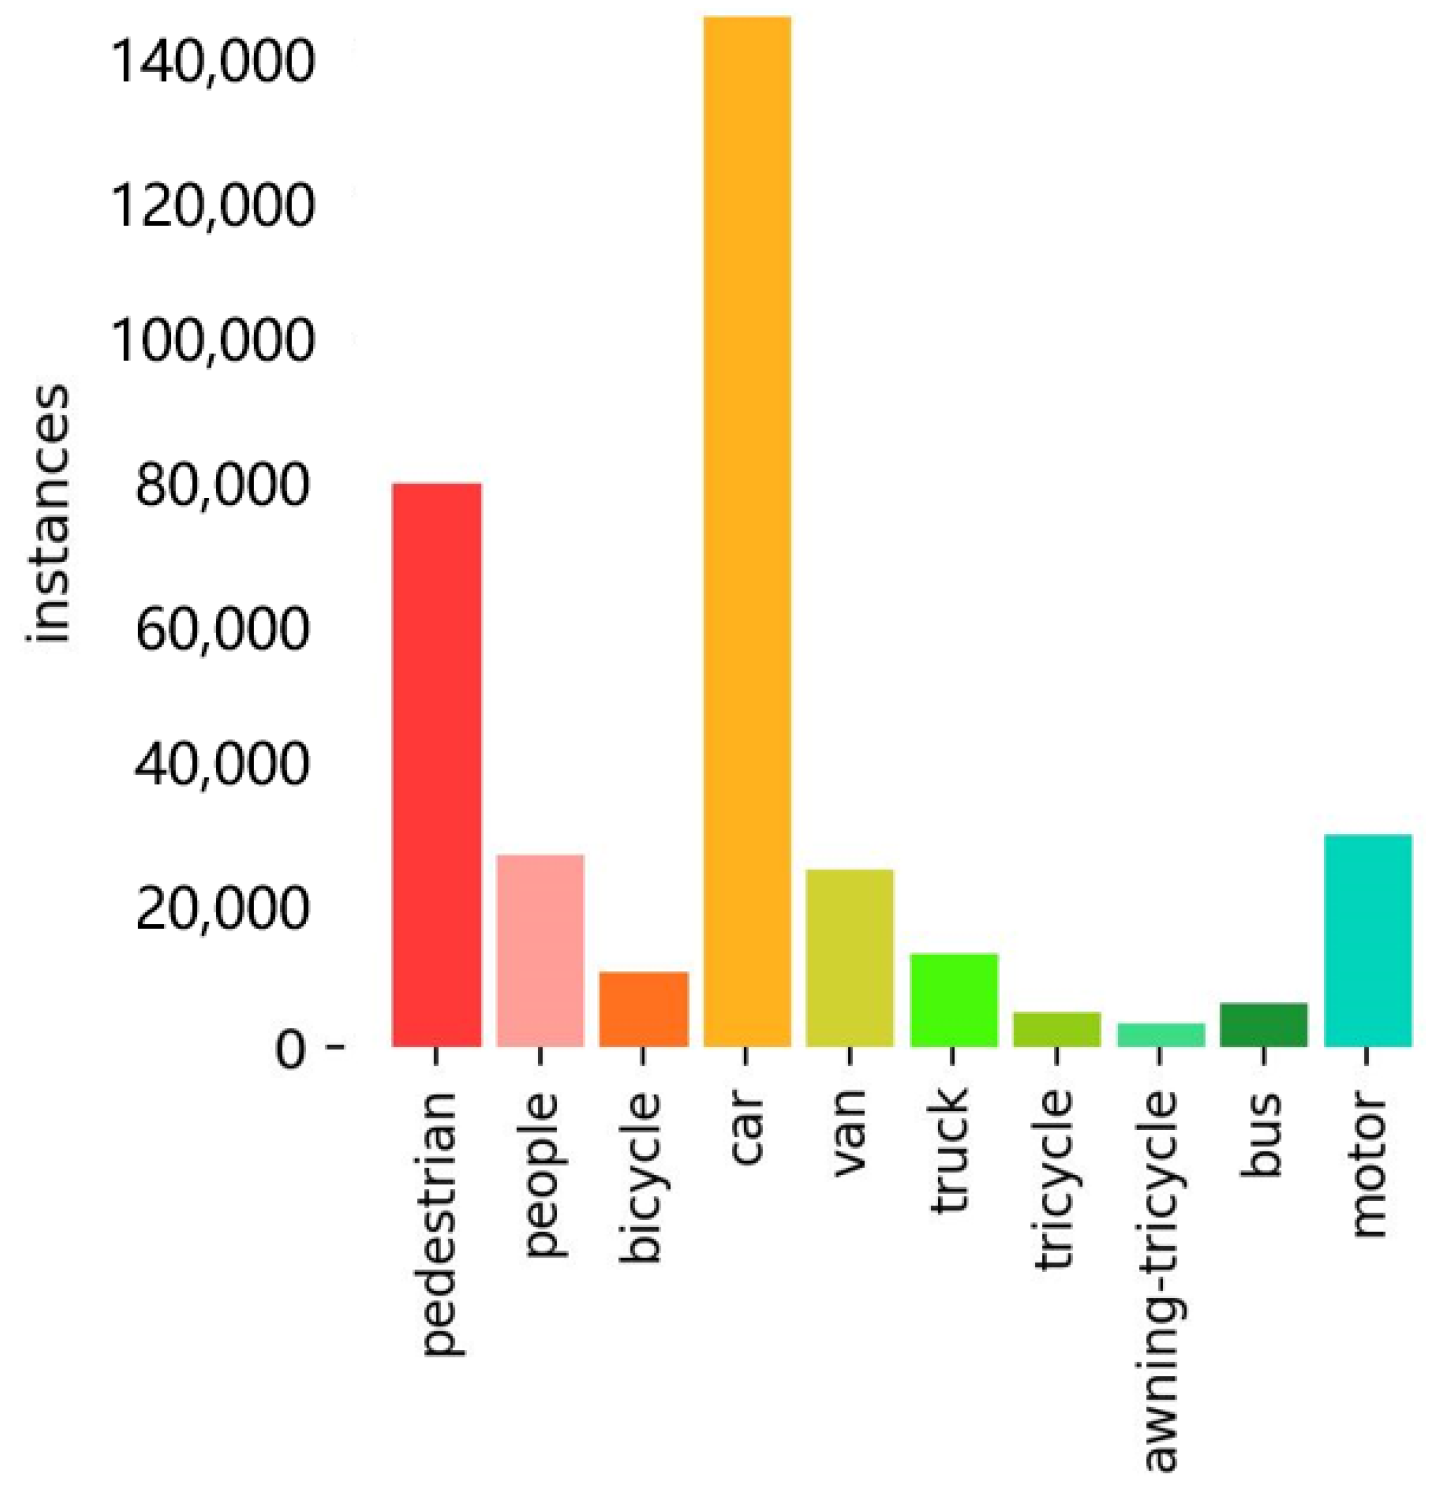
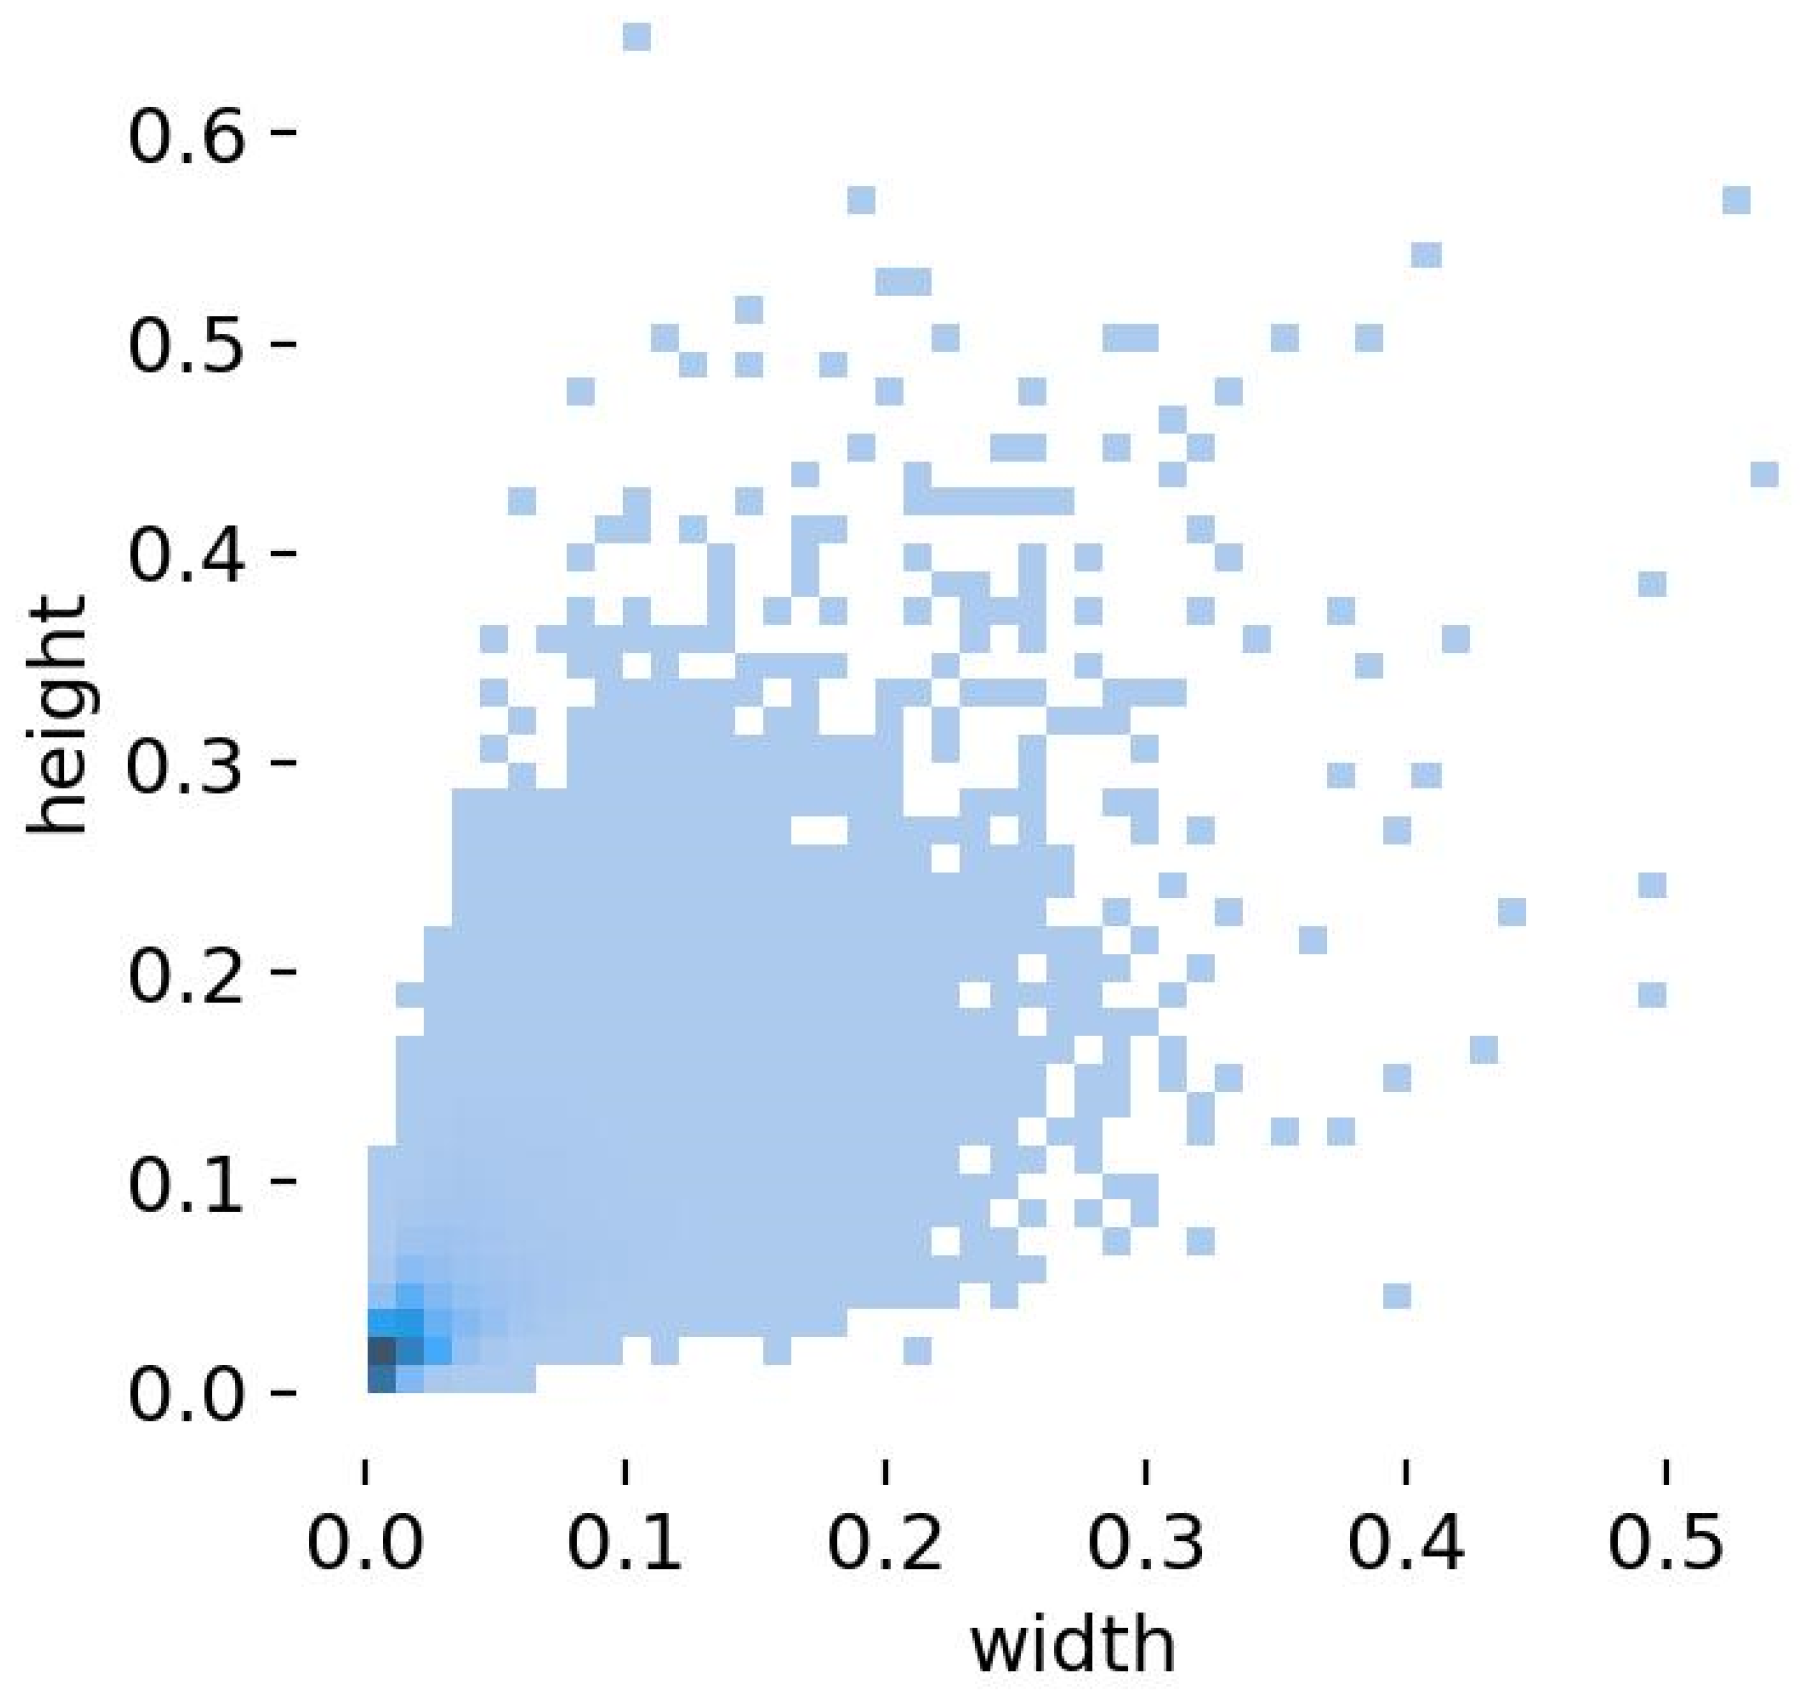
4.1. Data Set
4.2. Experimental Settings
4.3. Evaluation Metrics
4.4. Experimental Analysis of Different Improvement Points
4.4.1. Improved Detection Head for YOLOv7
4.4.2. C3R2N Multi-Scale Feature Extraction Module
4.4.3. Introduce SPD Conv Downsampling Module
4.4.4. Adjusting the Number of Channels of the Feature Fusion Module
4.5. Ablation Experiments
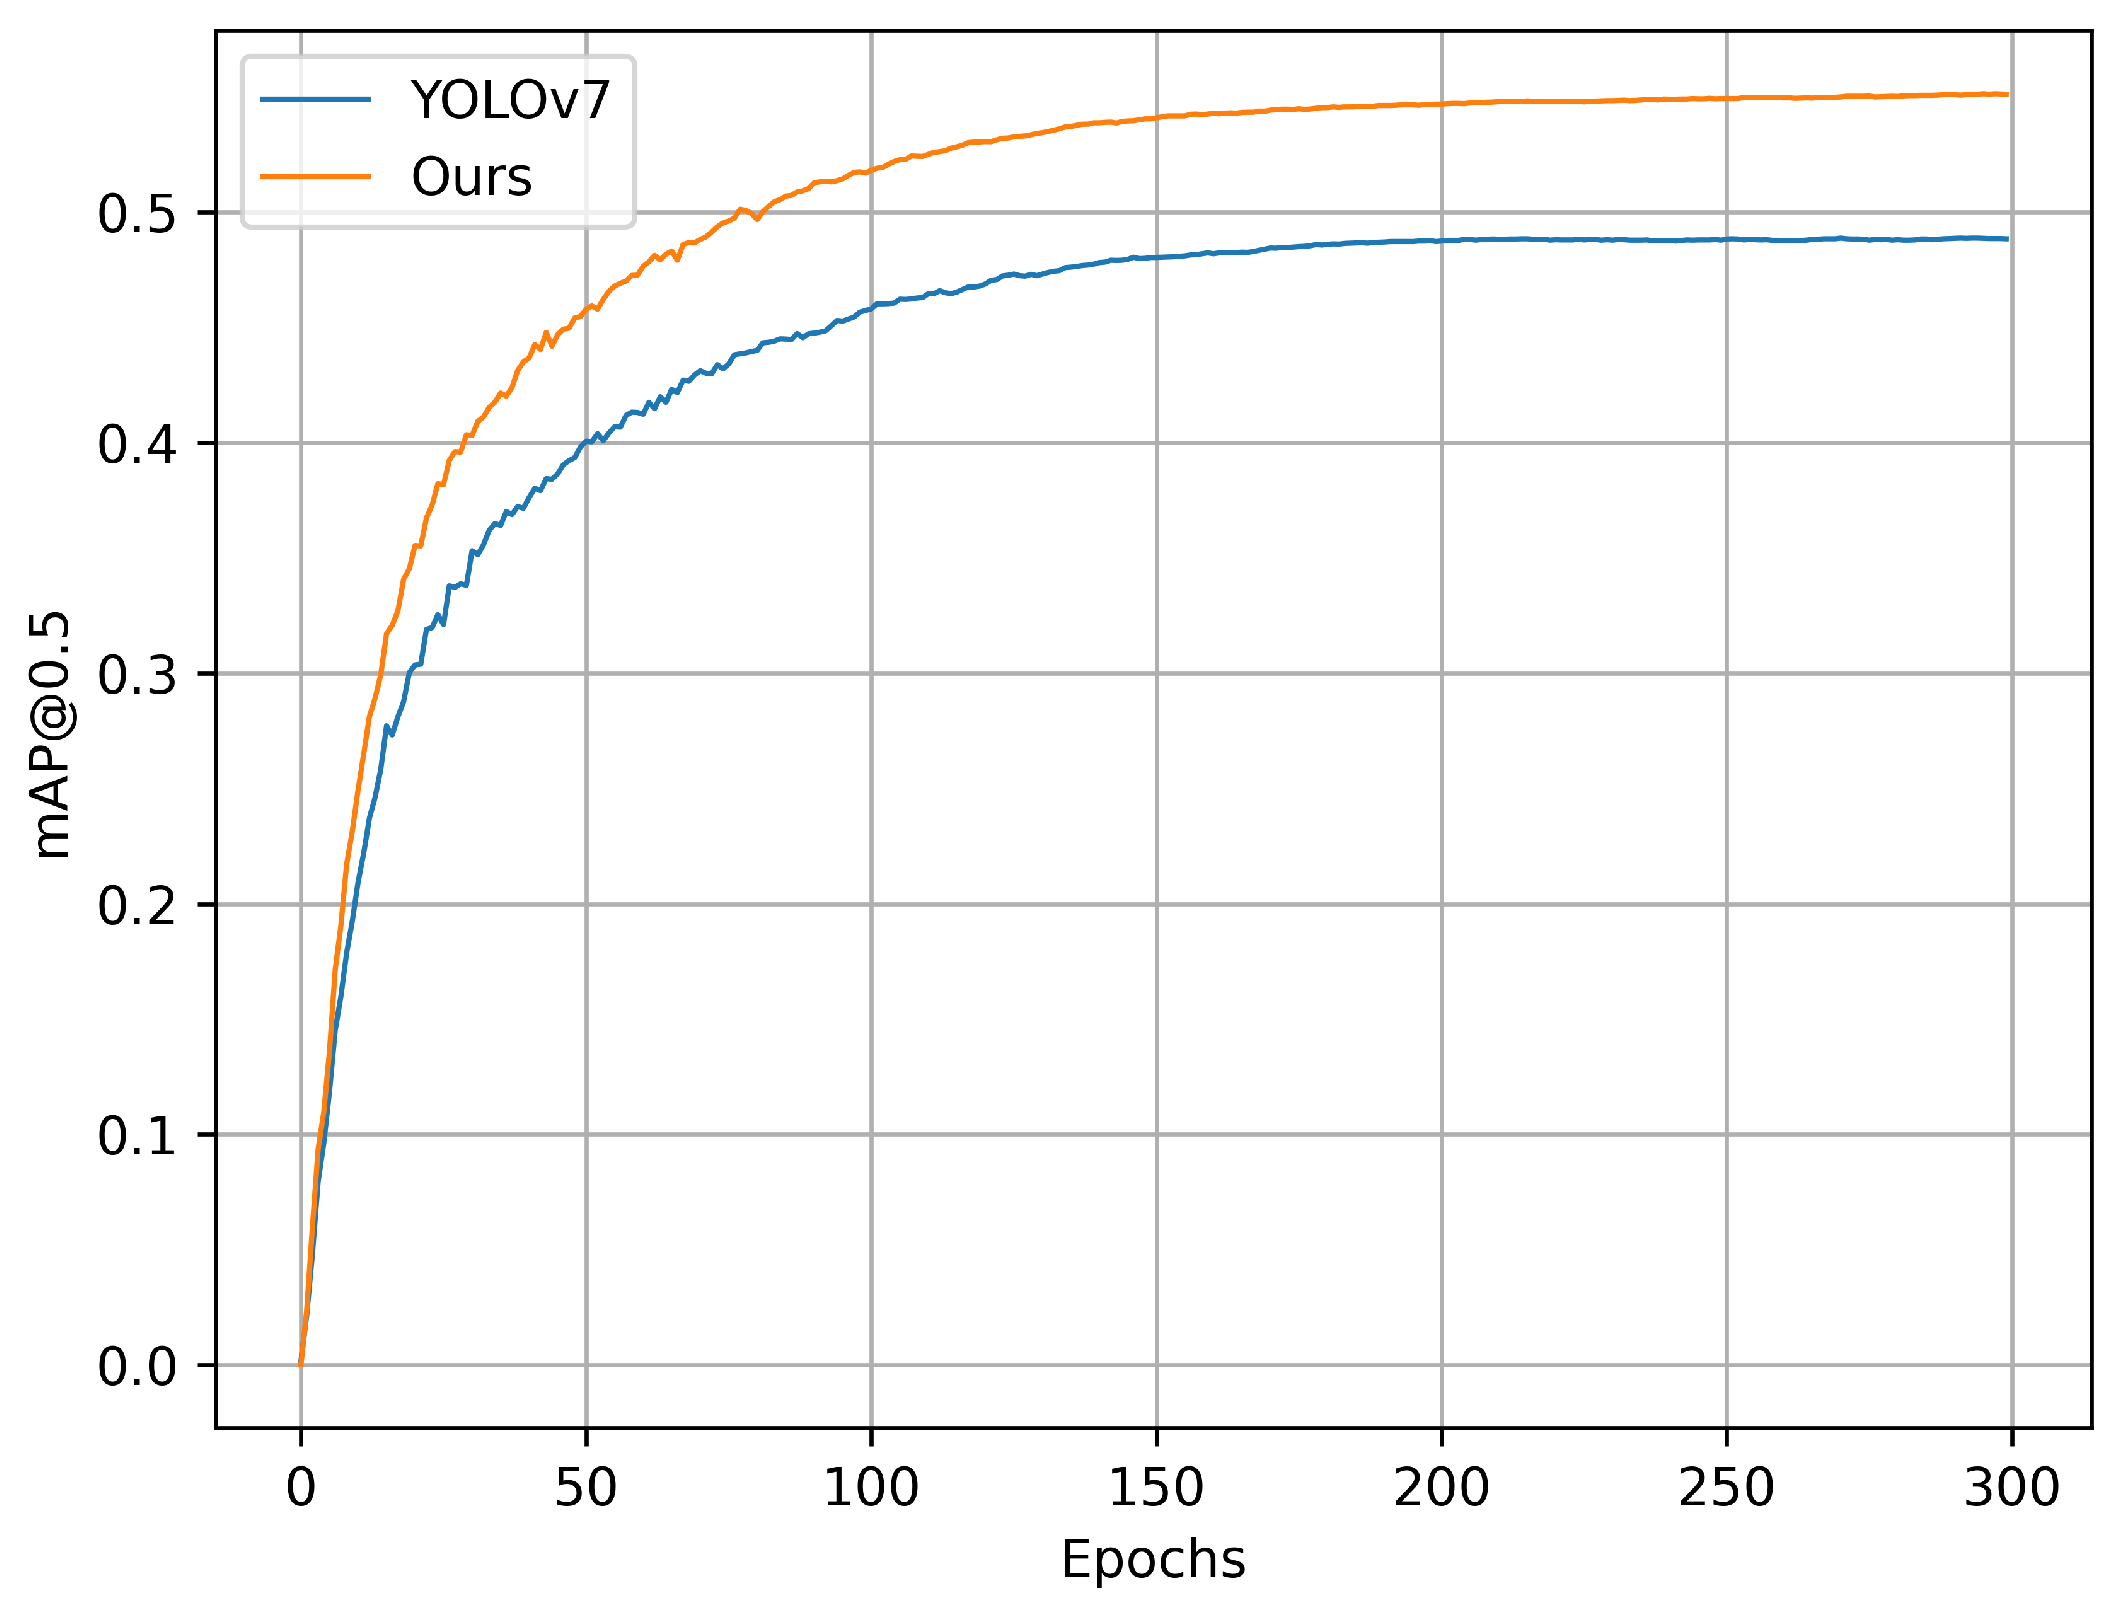
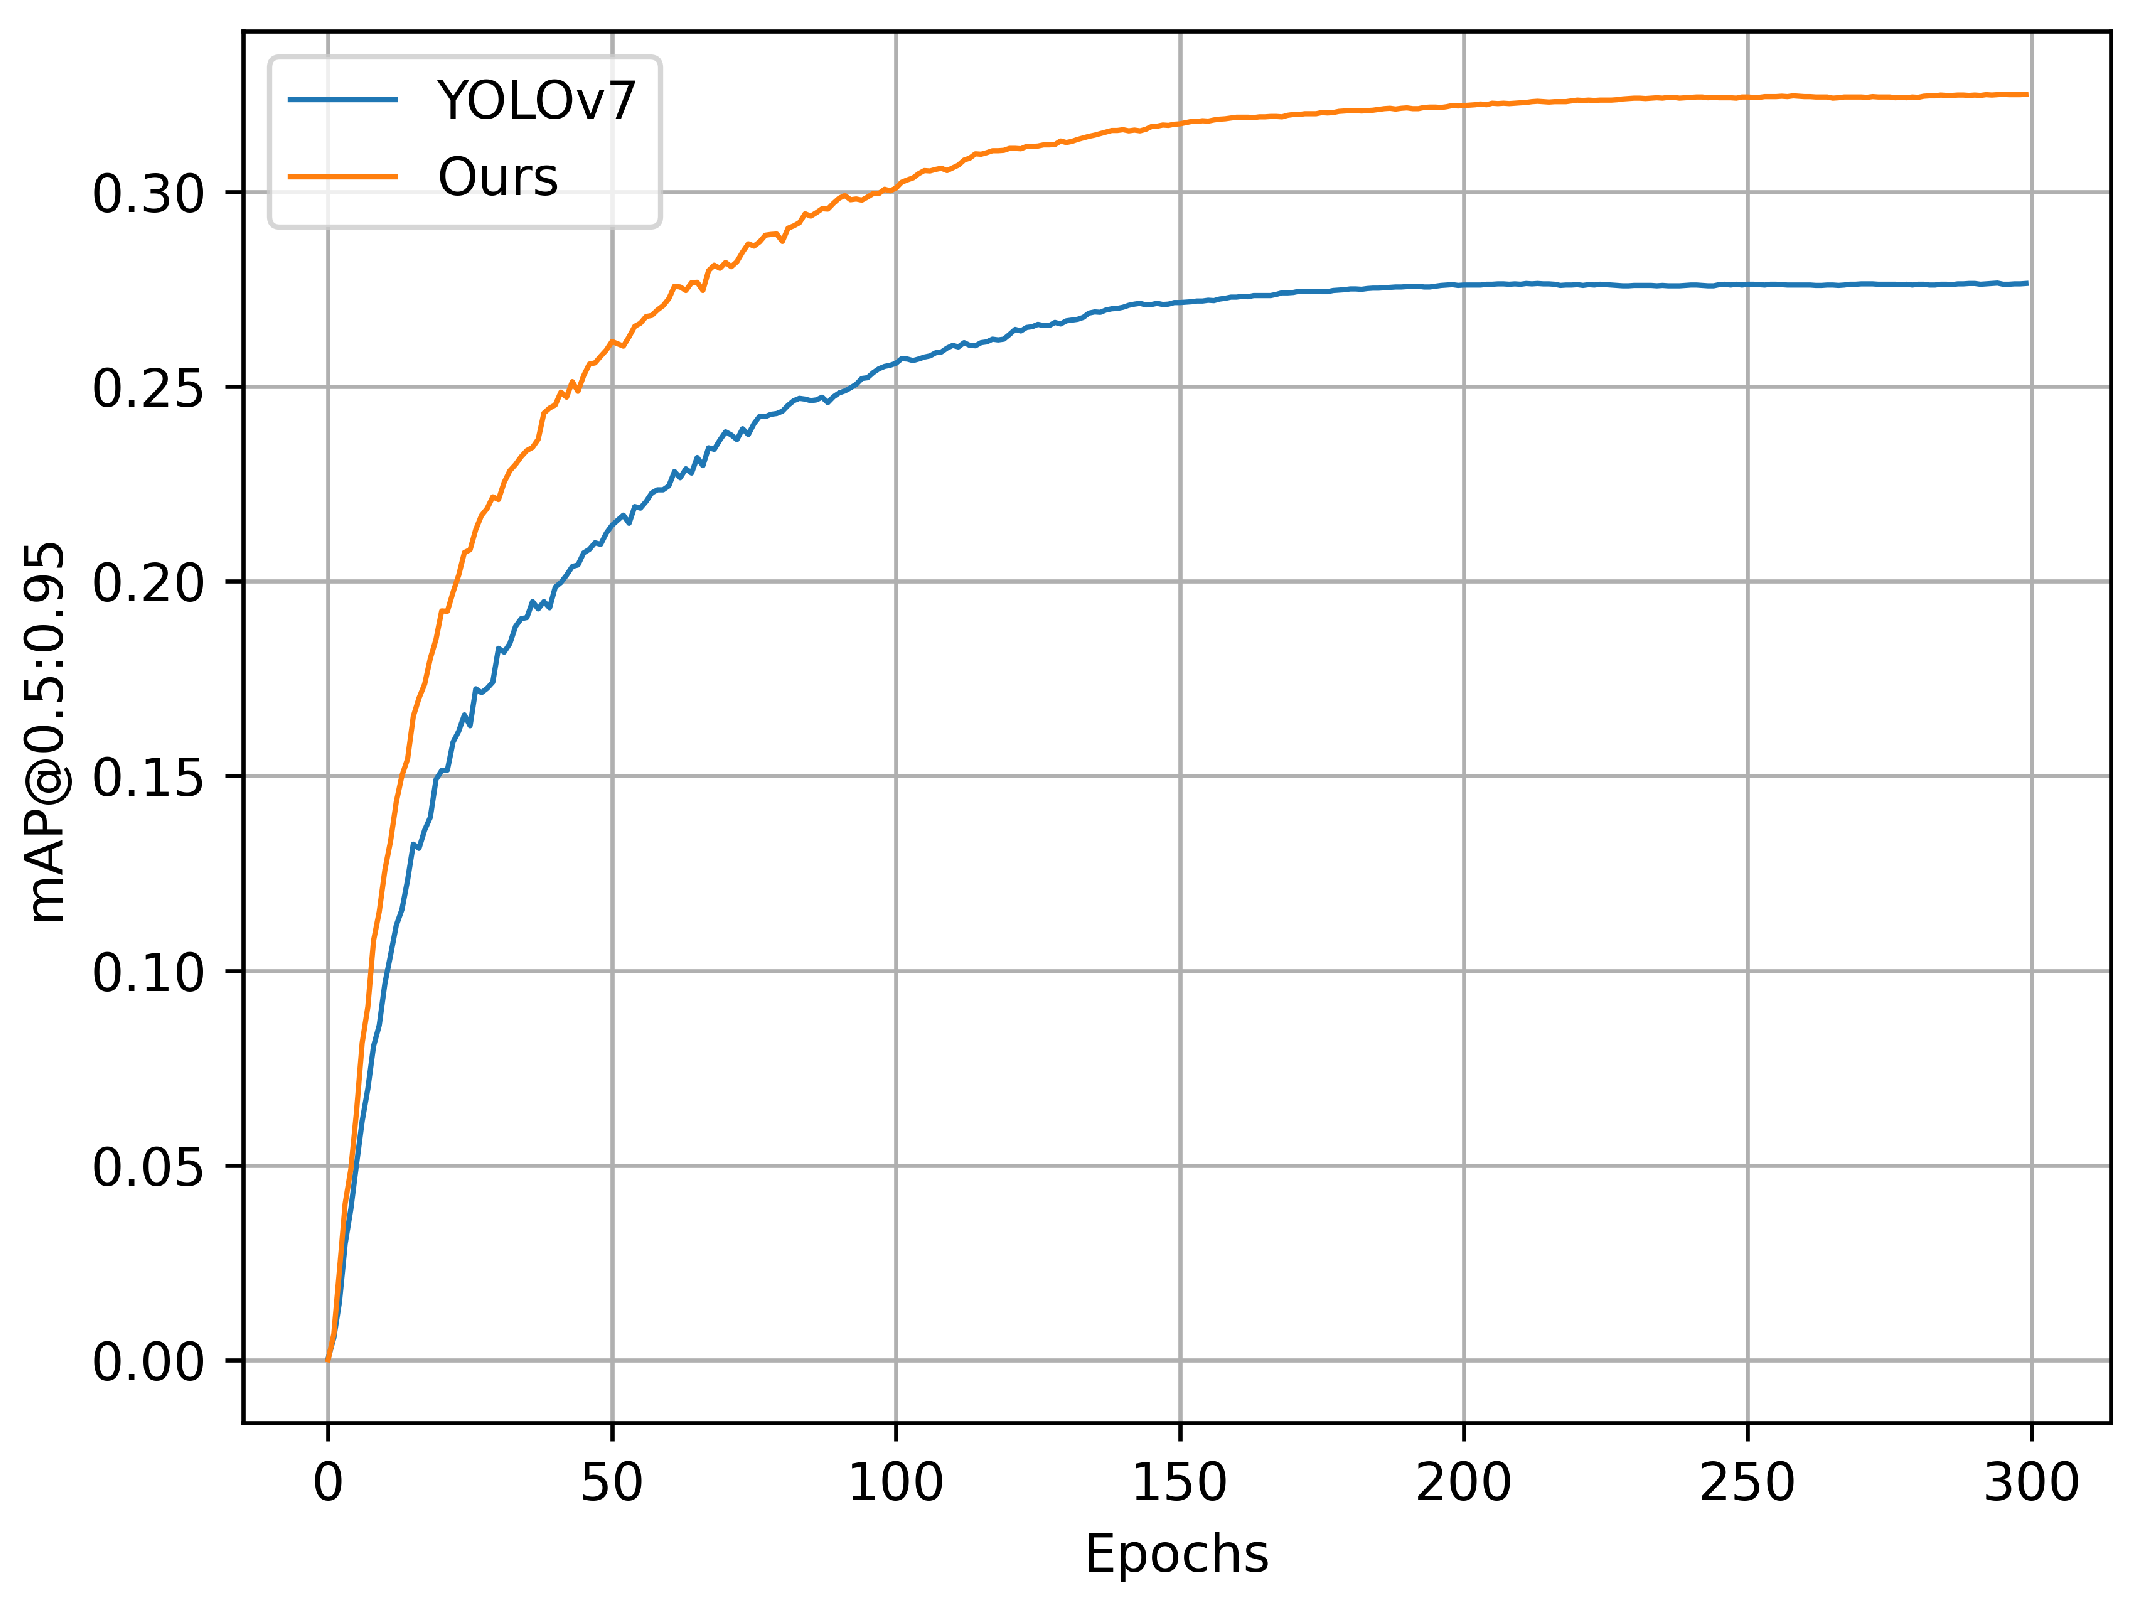
4.6. Comparative Experiments
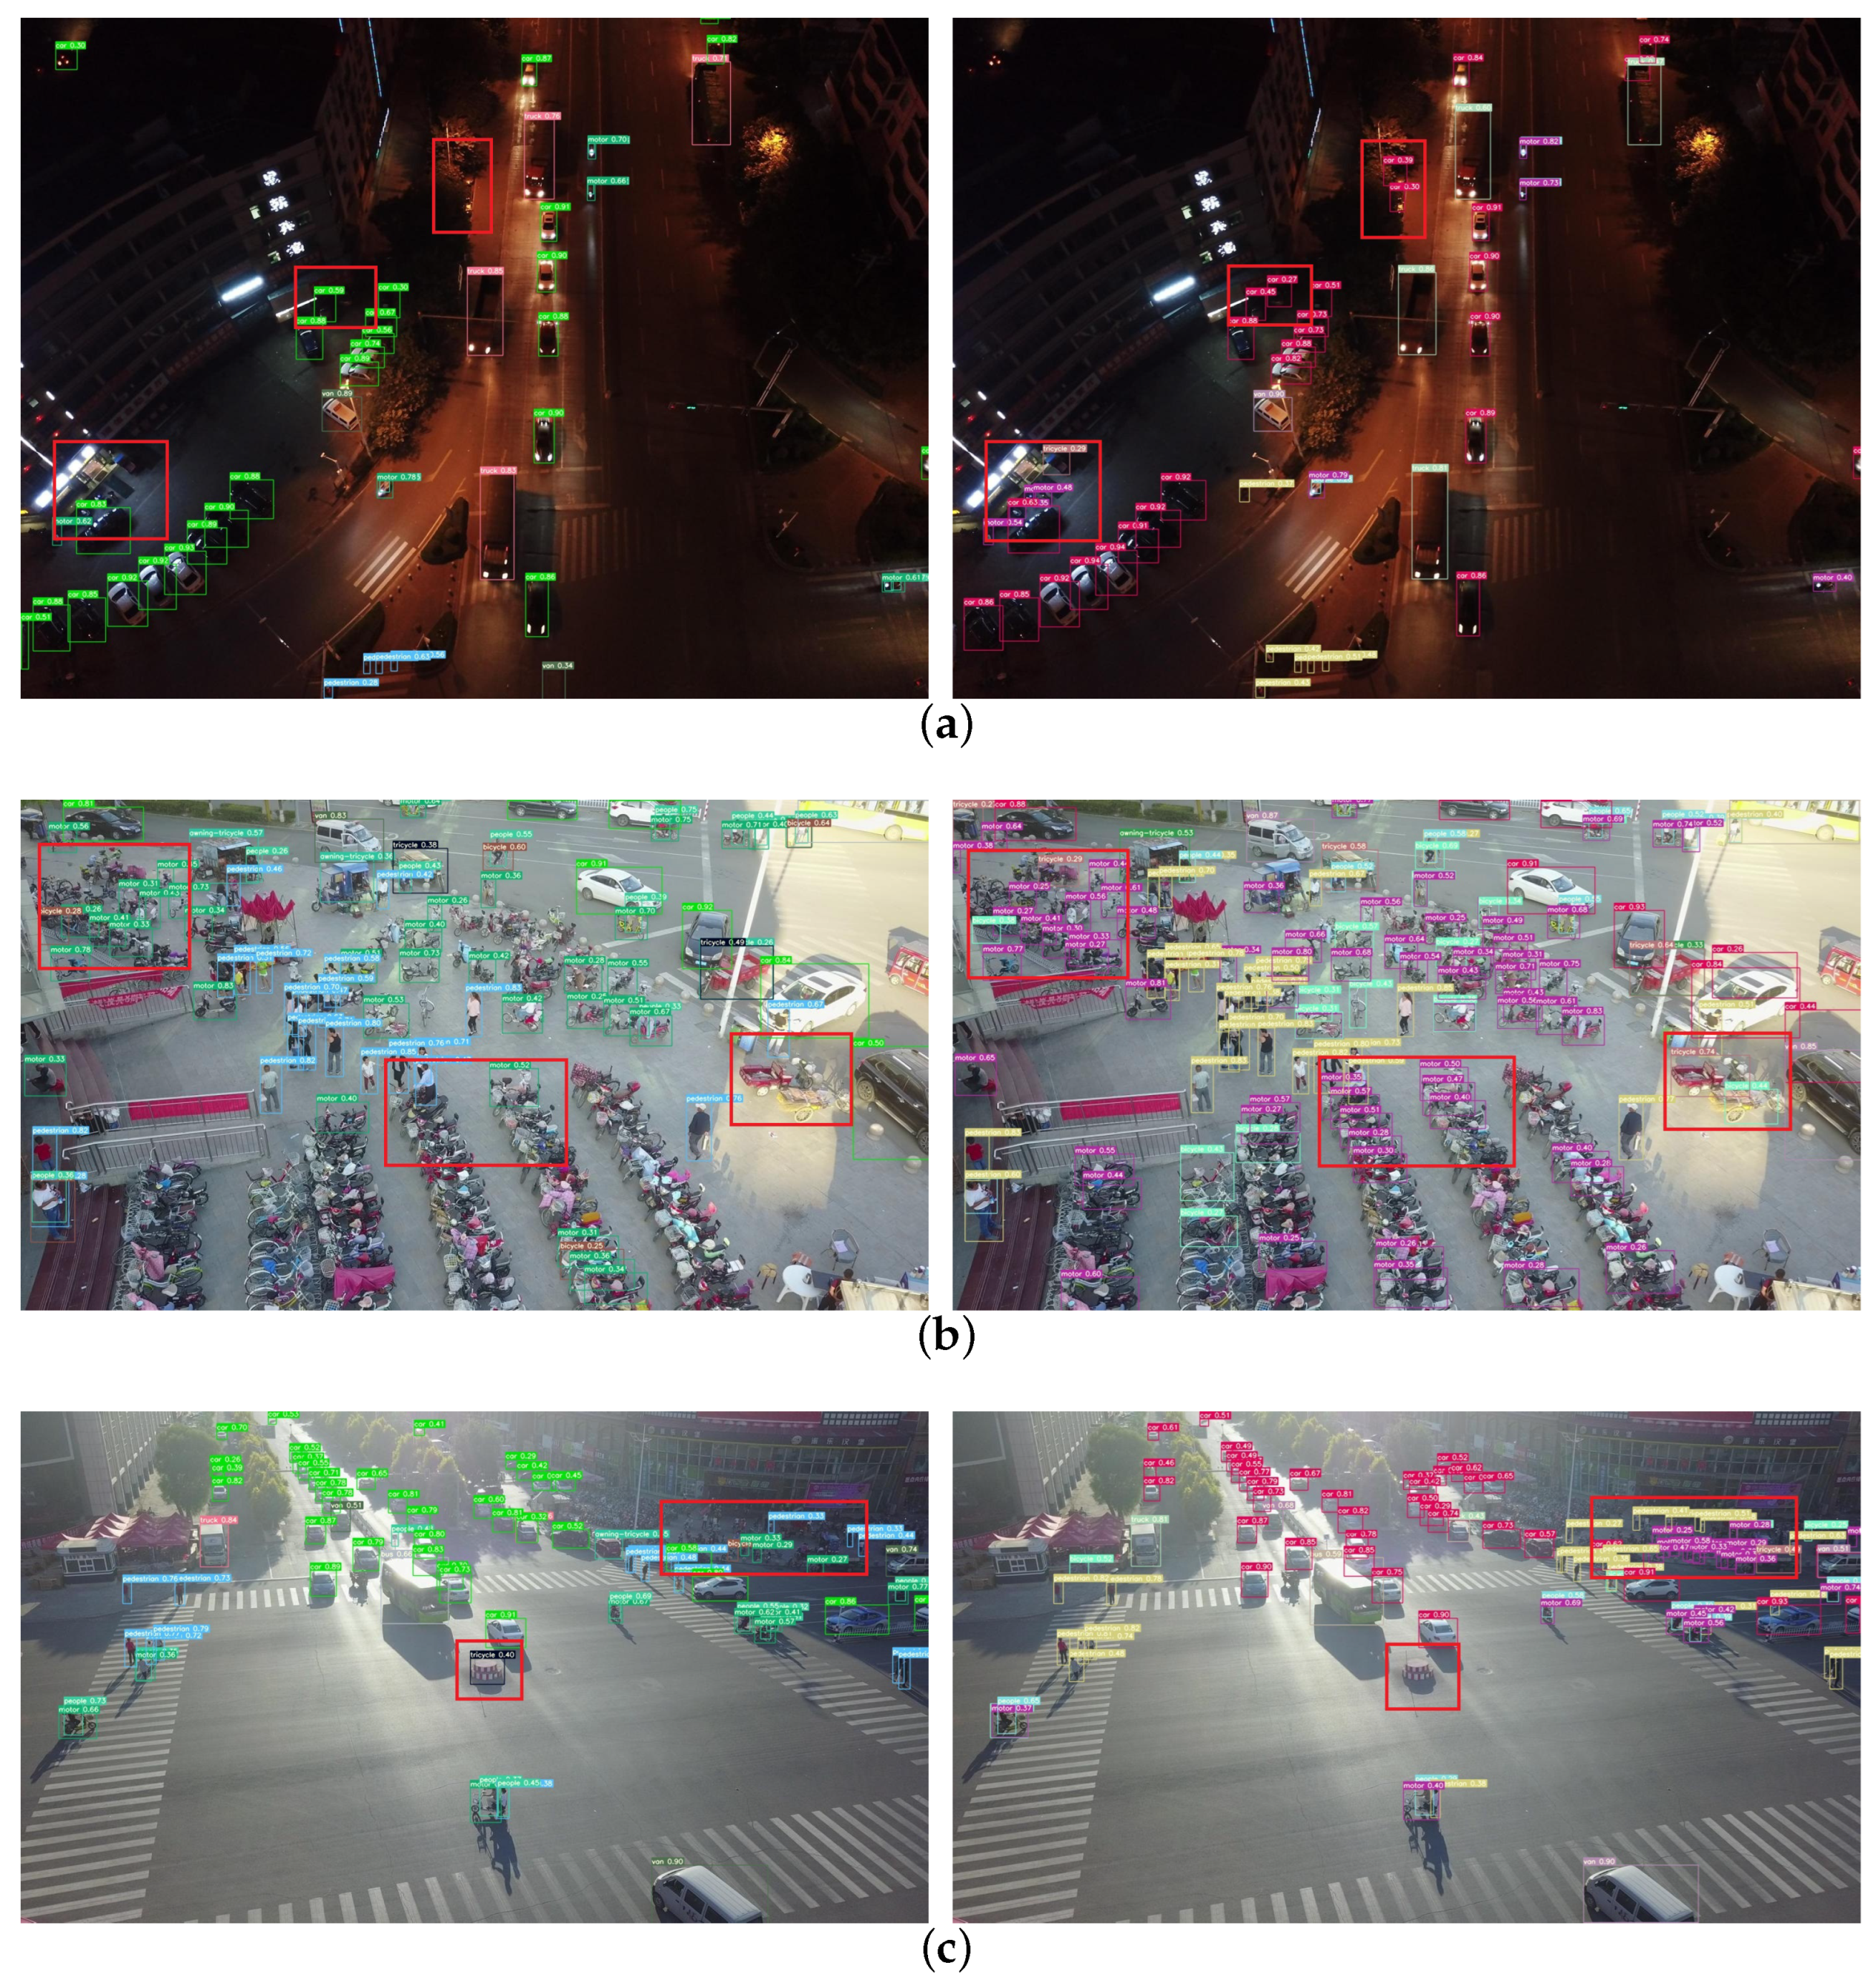
4.7. Visual Analysis
5. Conclusions
Author Contributions
Funding
Data Availability Statement
Acknowledgments
Conflicts of Interest
References
- Amit, Y.; Felzenszwalb, P.; Girshick, R. Object detection. In Computer Vision: A Reference Guide; Springer: New York, NY, USA, 2021; pp. 875–883. [Google Scholar]
- Al Shibli, A.H.N.; Al-Harthi, R.A.A.; Palanisamy, R. Accurate Movement Detection of Artificially Intelligent Security Objects. Eur. J. Electr. Eng. Comput. Sci. 2023, 7, 49–53. [Google Scholar] [CrossRef]
- Altaher, A.W.; Hussein, A.H. Intelligent security system detects the hidden objects in the smart grid. Indones. J. Electr. Eng. Comput. Sci. (IJEECS) 2020, 19, 188–195. [Google Scholar] [CrossRef]
- Usamentiaga, R.; Lema, D.G.; Pedrayes, O.D.; Garcia, D.F. Automated surface defect detection in metals: A comparative review of object detection and semantic segmentation using deep learning. IEEE Trans. Ind. Appl. 2022, 58, 4203–4213. [Google Scholar] [CrossRef]
- Wang, X.; Jia, X.; Jiang, C.; Jiang, S. A wafer surface defect detection method built on generic object detection network. Digit. Signal Process. 2022, 130, 103718. [Google Scholar] [CrossRef]
- Feng, D.; Harakeh, A.; Waslander, S.L.; Dietmayer, K. A review and comparative study on probabilistic object detection in autonomous driving. IEEE Trans. Intell. Transp. Syst. 2021, 23, 9961–9980. [Google Scholar] [CrossRef]
- Chen, X.; Kundu, K.; Zhang, Z.; Ma, H.; Fidler, S.; Urtasun, R. Monocular 3d object detection for autonomous driving. In Proceedings of the IEEE Conference on Computer Vision and Pattern Recognition, Las Vegas, NV, USA, 27–30 June 2016; pp. 2147–2156. [Google Scholar]
- Cheng, G.; Han, J. A survey on object detection in optical remote sensing images. ISPRS J. Photogramm. Remote. Sens. 2016, 117, 11–28. [Google Scholar] [CrossRef]
- Li, K.; Wan, G.; Cheng, G.; Meng, L.; Han, J. Object detection in optical remote sensing images: A survey and a new benchmark. ISPRS J. Photogramm. Remote. Sens. 2020, 159, 296–307. [Google Scholar] [CrossRef]
- Redmon, J.; Divvala, S.; Girshick, R.; Farhadi, A. You only look once: Unified, real-time object detection. In Proceedings of the IEEE Conference on Computer Vision and Pattern Recognition, Las Vegas, NV, USA, 27–30 June 2016; pp. 779–788. [Google Scholar]
- Redmon, J.; Farhadi, A. YOLO9000: Better, faster, stronger. In Proceedings of the IEEE Conference on Computer Vision and Pattern Recognition, Honolulu, HI, USA, 21–26 July 2017; pp. 7263–7271. [Google Scholar]
- Redmon, J.; Farhadi, A. Yolov3: An incremental improvement. arXiv 2018, arXiv:1804.02767. [Google Scholar]
- Bochkovskiy, A.; Wang, C.Y.; Liao, H.Y.M. Yolov4: Optimal speed and accuracy of object detection. arXiv 2020, arXiv:2004.10934. [Google Scholar]
- Jocher, G. YOLOv5 by Ultralytics. 2020. Available online: https://github.com/ultralytics/yolov5 (accessed on 25 August 2024).
- Li, C.; Li, L.; Jiang, H.; Weng, K.; Geng, Y.; Li, L.; Ke, Z.; Li, Q.; Cheng, M.; Nie, W.; et al. YOLOv6: A single-stage object detection framework for industrial applications. arXiv 2022, arXiv:2209.02976. [Google Scholar]
- Wang, C.Y.; Bochkovskiy, A.; Liao, H.Y.M. YOLOv7: Trainable bag-of-freebies sets new state-of-the-art for real-time object detectors. In Proceedings of the IEEE/CVF Conference on Computer Vision and Pattern Recognition, Vancouver, BC, Canada, 17–24 June 2023; pp. 7464–7475. [Google Scholar]
- Jocher, G.; Chaurasia, A.; Qiu, J. Ultralytics YOLO. 2023. Available online: https://github.com/ultralytics/ultralytics (accessed on 25 August 2024).
- Wang, C.Y.; Yeh, I.H.; Liao, H.Y.M. Yolov9: Learning what you want to learn using programmable gradient information. arXiv 2024, arXiv:2402.13616. [Google Scholar]
- Wang, A.; Chen, H.; Liu, L.; Chen, K.; Lin, Z.; Han, J.; Ding, G. Yolov10: Real-time end-to-end object detection. arXiv 2024, arXiv:2405.14458. [Google Scholar]
- Zhang, M.; Pang, K.; Gao, C.; Xin, M. Multi-scale aerial target detection based on densely connected inception ResNet. IEEE Access 2020, 8, 84867–84878. [Google Scholar] [CrossRef]
- Du, D.; Zhu, P.; Wen, L.; Bian, X.; Lin, H.; Hu, Q.; Peng, T.; Zheng, J.; Wang, X.; Zhang, Y.; et al. VisDrone-DET2019: The vision meets drone object detection in image challenge results. In Proceedings of the IEEE/CVF International Conference on Computer Vision Workshops, Seoul, Republic of Korea, 27–28 October 2019. [Google Scholar]
- Xu, Q.; Lin, R.; Yue, H.; Huang, H.; Yang, Y.; Yao, Z. Research on small target detection in driving scenarios based on improved yolo network. IEEE Access 2020, 8, 27574–27583. [Google Scholar] [CrossRef]
- Xu, D.; Wu, Y. Improved YOLO-V3 with DenseNet for multi-scale remote sensing target detection. Sensors 2020, 20, 4276. [Google Scholar] [CrossRef]
- Zhu, X.; Lyu, S.; Wang, X.; Zhao, Q. TPH-YOLOv5: Improved YOLOv5 based on transformer prediction head for object detection on drone-captured scenarios. In Proceedings of the IEEE/CVF International Conference on Computer Vision, Montreal, BC, Canada, 11–17 October 2021; pp. 2778–2788. [Google Scholar]
- Wang, Z.Z.; Xie, K.; Zhang, X.Y.; Chen, H.Q.; Wen, C.; He, J.B. Small-object detection based on yolo and dense block via image super-resolution. IEEE Access 2021, 9, 56416–56429. [Google Scholar] [CrossRef]
- Zhang, X.; Feng, Y.; Zhang, S.; Wang, N.; Mei, S. Finding nonrigid tiny person with densely cropped and local attention object detector networks in low-altitude aerial images. IEEE J. Sel. Top. Appl. Earth Obs. Remote. Sens. 2022, 15, 4371–4385. [Google Scholar] [CrossRef]
- Huang, M.; Zhang, Y.; Chen, Y. Small target detection model in aerial images based on TCA-YOLOv5m. IEEE Access 2022, 11, 3352–3366. [Google Scholar] [CrossRef]
- Zhao, H.; Zhang, H.; Zhao, Y. Yolov7-sea: Object detection of maritime uav images based on improved yolov7. In Proceedings of the IEEE/CVF Winter Conference on Applications of Computer Vision, Waikoloa, HI, USA, 2–7 February 2023; pp. 233–238. [Google Scholar]
- Bao, W. Remote-sensing Small-target Detection Based on Feature-dense Connection. J. Phys. Conf. Ser. 2023, 2640, 012009. [Google Scholar] [CrossRef]
- Sui, J.; Chen, D.; Zheng, X.; Wang, H. A new algorithm for small target detection from the perspective of unmanned aerial vehicles. IEEE Access 2024, 12, 29690–29697. [Google Scholar] [CrossRef]
- Gao, S.H.; Cheng, M.M.; Zhao, K.; Zhang, X.Y.; Yang, M.H.; Torr, P. Res2net: A new multi-scale backbone architecture. IEEE Trans. Pattern Anal. Mach. Intell. 2019, 43, 652–662. [Google Scholar] [CrossRef] [PubMed]
- Sunkara, R.; Luo, T. No more strided convolutions or pooling: A new CNN building block for low-resolution images and small objects. In Proceedings of the Joint European Conference on Machine Learning and Knowledge Discovery in Databases, Grenoble, France, 19–23 September 2022; Springer: Cham, Swizterland, 2023; pp. 443–459. [Google Scholar]
- Zhang, Z. Drone-YOLO: An efficient neural network method for target detection in drone images. Drones 2023, 7, 526. [Google Scholar] [CrossRef]
- Zhao, L.; Zhu, M. MS-YOLOv7: YOLOv7 based on multi-scale for object detection on UAV aerial photography. Drones 2023, 7, 188. [Google Scholar] [CrossRef]


| Parameters | Value |
|---|---|
| image size | 640 × 640 |
| epochs | 300 |
| warmup | 3 |
| batch size | 16 |
| optimizer | Adam |
| learning rate | 0.01 |
| momentum | 0.937 |
| weight decay | 0.0005 |
| Experiment | mAP(s)% | mAP(m)% | mAP(l)% | mAP@0.5% | Parameters/M |
|---|---|---|---|---|---|
| 1 | 18.6 | 38.7 | 48.8 | 48.8 | 36.53 |
| 2 | 21.0 | 40.7 | 47.8 | 50.5 | 37.10 |
| 3 | 21.3 | 40.8 | 47.2 | 50.9 | 15.49 |
| 4 | 21.6 | 40.7 | 49.0 | 51.4 | 11.31 |
| Experiment | mAP@0.5% | mAP@0.5:0.95% | Parameters/M |
|---|---|---|---|
| 1 | 52.1 | 30.4 | 10.24 |
| 2 | 51.8 | 30.4 | 10.22 |
| 3 | 51.7 | 30.3 | 10.22 |
| 4 | 51.2 | 29.7 | 10.37 |
| 5 | 51.9 | 30.4 | 9.30 |
| 6 | 51.3 | 29.8 | 9.08 |
| 7 | 50.7 | 29.6 | 9.01 |
| Baseline | 51.4 | 30.0 | 11.31 |
| Experiment | mAP(s)% | mAP(m)% | mAP(l)% | mAP@0.5% | Parameters/M |
|---|---|---|---|---|---|
| 1 | 23.0 | 43.3 | 46.8 | 53.8 | 10.10 |
| 2 | 22.9 | 42.3 | 46.5 | 53.4 | 10.65 |
| Baseline | 21.7 | 41.5 | 46.1 | 51.9 | 9.30 |
| Experiment | mAP(s)% | mAP(m)% | mAP(l)% | mAP@0.5% | Parameters/M |
|---|---|---|---|---|---|
| Baseline | 23.0 | 43.3 | 46.8 | 53.8 | 10.10 |
| 1 | 24.2 | 43.3 | 49.6 | 55.1 | 10.89 |
| Method | mAP@0.5% | mAP@0.5:0.95% | Parameters/M | |
|---|---|---|---|---|
| A | YOLOv7 | 48.8 | 27.6 | 36.53 |
| B | A+P2 | 50.5 | 29.9 | 37.10 |
| C | B-P5 | 51.4 | 30.0 | 11.31 |
| D | C+C3R2N | 51.9 | 30.3 | 9.30 |
| E | D+SPD Conv | 53.8 | 31.8 | 10.10 |
| F | E+Channel(Ours) | 55.1 | 32.5 | 10.89 |
| Method | mAP@0.5% | mAP@0.5:0.95% | Parameters/M |
|---|---|---|---|
| YOLOv5s | 33.1 | 17.9 | 7.04 |
| YOLOv5x | 39.9 | 23.5 | 86.23 |
| YOLOv6s | 37.1 | 22.0 | 16.30 |
| YOLOv6l | 41.0 | 25.0 | 51.98 |
| YOLOv7m | 48.8 | 27.6 | 36.53 |
| YOLOv7x | 50.0 | 28.5 | 70.84 |
| YOLOv8s | 39.5 | 23.5 | 11.13 |
| YOLOv8x | 45.4 | 27.9 | 68.13 |
| YOLOv9s | 41.0 | 24.8 | 9.60 |
| YOLOv9e | 47.5 | 29.1 | 57.72 |
| YOLOv10s | 39.0 | 23.3 | 8.07 |
| YOLOv10x | 45.7 | 28.2 | 31.67 |
| Drone-YOLOs | 44.3 | 27.0 | 10.9 |
| Drone-YOLOl | 51.3 | 31.9 | 76.2 |
| MS-YOLO | 53.1 | 31.3 | 79.7 |
| Ours | 55.1 | 32.5 | 10.89 |
Disclaimer/Publisher’s Note: The statements, opinions and data contained in all publications are solely those of the individual author(s) and contributor(s) and not of MDPI and/or the editor(s). MDPI and/or the editor(s) disclaim responsibility for any injury to people or property resulting from any ideas, methods, instructions or products referred to in the content. |
© 2024 by the authors. Licensee MDPI, Basel, Switzerland. This article is an open access article distributed under the terms and conditions of the Creative Commons Attribution (CC BY) license (https://creativecommons.org/licenses/by/4.0/).
Share and Cite
Chen, X.; Deng, L.; Hu, C.; Xie, T.; Wang, C. Dense Small Object Detection Based on an Improved YOLOv7 Model. Appl. Sci. 2024, 14, 7665. https://doi.org/10.3390/app14177665
Chen X, Deng L, Hu C, Xie T, Wang C. Dense Small Object Detection Based on an Improved YOLOv7 Model. Applied Sciences. 2024; 14(17):7665. https://doi.org/10.3390/app14177665
Chicago/Turabian StyleChen, Xun, Linyi Deng, Chao Hu, Tianyi Xie, and Chengqi Wang. 2024. "Dense Small Object Detection Based on an Improved YOLOv7 Model" Applied Sciences 14, no. 17: 7665. https://doi.org/10.3390/app14177665
APA StyleChen, X., Deng, L., Hu, C., Xie, T., & Wang, C. (2024). Dense Small Object Detection Based on an Improved YOLOv7 Model. Applied Sciences, 14(17), 7665. https://doi.org/10.3390/app14177665