
Development and Usability Evaluation of Augmented Reality Content for Light Maintenance Training of Air Spring for Electric Multiple Unit


Abstract
:1. Introduction
1.1. Related Work
1.1.1. AR-Based Maintenance Content
1.1.2. AR Content Evaluation
1.2. Research Objectives
2. Implementation Devices
2.1. Industrial AR
2.2. AR Implementation Device
3. AR Content Development Process of the Air Spring
3.1. Air Spring 3D Modeling
3.2. Storyboard
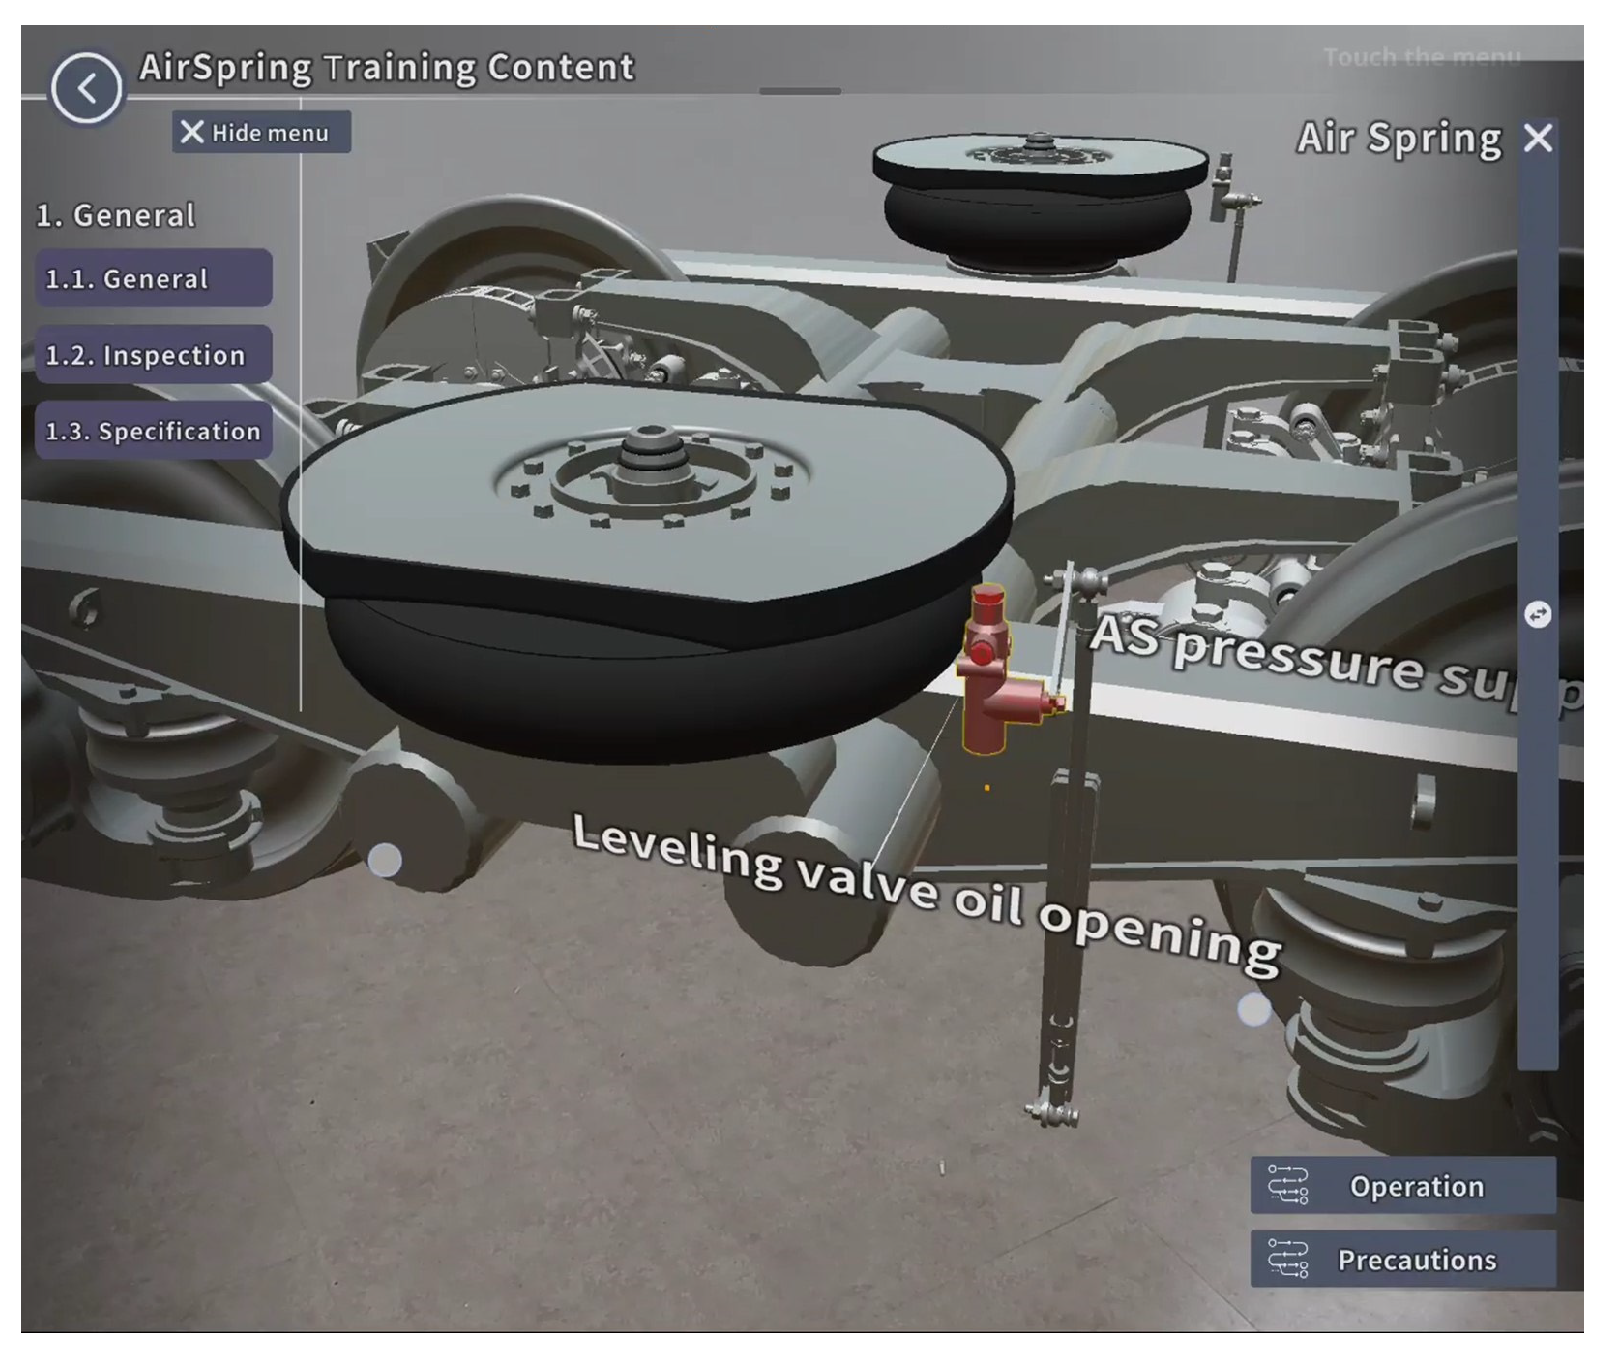
3.3. User Interface
4. Development of the Algorithm and Implementation Process
4.1. Fluid Diffusion Generation Algorithm
4.2. Object Auto-Rotation Algorithm
5. Training Support Air Spring Assembly AR Contents
5.1. General
Operation Principal
5.2. Structure
5.3. Maintenance
5.4. Pilot Test
6. AR Content Usability Evaluation and Results
6.1. Survey Tool
6.1.1. UMUX
- For positively framed questions, subtract 1 from the response number.
- For negatively framed questions, subtract the response number from 7.
- Sum up the scores for all questions.
- Multiply the sum by 4.1667 (or 100/24).
6.1.2. CSUQ
- Add up the scores from 1 to 7 for all questions 1–19.
- Divide the total score of the 19 questions by 19 to calculate the average, then subtract 1 to determine the score based on the 0-point scale.
- Convert the value you subtracted in step 2 to 100 by multiplying it by 16.6667 (or 100/6).
- Since a score of 1 represents a strongly agree value, subtract the value of step 3 from 100.
6.2. Evaluation Condition
6.3. Result
7. Discussion
8. Conclusions
- For practical training, a document-based maintenance procedure for an air spring, which is not easily disassembled and maintained, was developed into highly detailed and immersive content on mobile devices using the general-purpose Unity program. This content was designed to be easily implemented offline, closely resembling actual maintenance work. The content was created to allow feedback on the maintenance process and evaluation. It was also designed with an MAR system considering the maintenance work environment, ensuring that there are no restrictions in the railway vehicle maintenance setting.
- To simulate the rubber air spring’s operation driven by compressed air, the previously developed SLMVC and CEPC algorithms were supplemented with the newly added FDG and OAR algorithms. The FDG algorithm is used to implement the effects of air spring damage and leakage inspection, while the OAR algorithm is employed to enhance visibility for maintenance tasks, such as visual inspection of damaged areas.
- After subdividing the air spring maintenance work by creating a mind map, a storyboard was created, and based on this scenario, an external condition inspection, air spring height inspection, and leakage test were produced. First, the maintenance tools required for maintenance work were displayed through images, and each maintenance step was implemented as an animation, with highlights applied to areas that required inspection or were for worker safety. In addition, standard dimensions or contents for maintenance explanations were visualized and delivered in text.
- To analyze the effectiveness of the content incorporating these algorithms, two surveys were conducted targeting railway vehicle maintenance personnel. As a result, the UMUX survey received an average score of 81.56 across four items, with the most positive response being for U1, “This AR content’s capabilities meet my requirements” (85.00). This indicates that not only the touchscreen gesture method but also the OAR algorithm improved the ease of object manipulation.
- Additionally, the CSUQ received an average score of 80.83 across the 19 items in the four categories, corresponding to a grade of A. Among the categories, “System Usefulness” had the highest score of 84.95. This reflects that the combined use of the newly added FDG and OAR algorithms with the existing SLMVC and CEPC algorithms provides an efficient, comfortable, and quick way to enhance productivity during tasks.
- The UMUX and CSUQ survey results indicate that the AR content significantly improves learning efficiency and usability compared to the traditional document manual. Group B, using the AR content, showed a 10% improvement in learning efficiency and a 16% enhancement in overall usability. However, while the AR system demonstrated clear advantages in ease of use, system usefulness, and information quality, there are areas needing improvement, particularly in information recovery and interface functionality. These findings suggest that the AR content is highly effective, though further refinement is needed to fully meet user expectations.
Author Contributions
Funding
Institutional Review Board Statement
Informed Consent Statement
Data Availability Statement
Acknowledgments
Conflicts of Interest
References
- Park, K.J.; Jung, J.D. A study for the development of the reliability/availability management system of the urban transit vehicles (I). J. Korean Soc. Railw. 2013, 16, 163–168. [Google Scholar] [CrossRef]
- Quatrini, E.; Costantino, F.; Gravio, G.D.; Patriarca, R. Condition-based maintenance an extensive literature review. Machines 2020, 8, 31. [Google Scholar] [CrossRef]
- Jardine, A.K.S.; Lin, D.; Banjevic, D. A review on machinery diagnostics and prognostics implementing condition-based maintenance. Mech. Syst. Signal Process. 2006, 20, 1483–1510. [Google Scholar] [CrossRef]
- Campos, J. Development in the application of ICT in condition monitoring and maintenance. Comput. Ind. 2009, 60, 1–20. [Google Scholar] [CrossRef]
- Chiang, F.K.; Shang, X.; Qiao, L. Augmented reality in vocational training: A systematic review of research and applications. Comput. Hum. Behav. 2022, 129, 107125. [Google Scholar] [CrossRef]
- Kim, K.S.; Kim, C.S. Conceptual design of miniature model of personal type simulator for electric multiple unit. J. Korean Soc. Railw. 2021, 24, 981–988. [Google Scholar] [CrossRef]
- Yazdi, M. Augmented Reality (AR) and Virtual Reality (VR) in Maintenance Training. Adv. Comput. Math. Ind. Syst. Reliab. Maintainab. 2024, 2024, 169–183. [Google Scholar] [CrossRef]
- Artem, S.A.; Kostiantyn, Z.; Oleksandr, M.Z.; Eugence, V.C.; Angela, S. Computer training tools for students and graduates of railway universities in the development of practical skills. Int. J. Mech. Eng. Educ. 2024; online first. [Google Scholar] [CrossRef]
- Zhong, M.H.; YePing, Z. Virtual-reality system for elevator maintenance education: Design, implementation and evaluation. Eng. Rep. 2024, 6, e12873. [Google Scholar] [CrossRef]
- Siddiq, D.; Mumu, K. Application of Augmented Reality (AR) In Vocational Education: A Systematic Literature Review. J. Mech. Eng. Educ. 2023, 8, 110–120. [Google Scholar] [CrossRef]
- Brown, C.; Jamison, S.H.; Christina, R.; Reuben, B. The use of augmented reality and virtual reality in ergonomic applications for education, aviation, and maintenance. Ergon. Des. 2023, 31, 23–31. [Google Scholar] [CrossRef]
- Garcia, C.; Mario, O.P.; Eugenio, I.; Manuel, C.; Pau, M.; Mariano, L.A. Holorailway: An augmented reality system to support assembly operations in the railway industry. Adv. Manuf. 2024, 1–20. [Google Scholar] [CrossRef]
- Soma, P.; Kayaroganam, P.; Ponshanmugakumar, A.; Rakesh, K. Application of augmented reality and virtual reality technologies for maintenance and repair of automobile and mechanical equipment. In Machine Intelligence in Mechanical Engineering; Academic Press: Cambridge, MA, USA, 2024; pp. 63–89. [Google Scholar]
- Kwon, H.J.; Kim, K.S.; Kim, C.S. Development and Evaluation of Augmented Reality Learning Content for Pneumatic Flow: Case Study on Brake Operating Unit of Railway Vehicle. IEEE Access 2023, 11, 9090. [Google Scholar] [CrossRef]
- Dhir, A.; Al-kahtani, M. A Case Study on User Experience (UX) Evaluation of Mobile Augmented Reality Prototypes. J. Univers. Comput. Sci. 2013, 19, 1175–1196. [Google Scholar]
- Anabel, M.G.; Angel, C.P.; Victor, U.C. Usability evaluation of an augmented reality system for teaching Euclidean vectors. Innov. Educ. Teach. Int. 2016, 53, 627–636. [Google Scholar] [CrossRef]
- Wang, C.H.; Wei-Jen, L.; Mao-Jiun, J.W. Usability evaluation of augmented reality-based maintenance instruction system. Hum. Factors Ergon. Manuf. Serv. Ind. 2022, 32, 239–255. [Google Scholar] [CrossRef]
- Luisa, L.; Kristin, A.; Sarah, M.; Michael, B.; Roland, B.; Daniel, S.; Markus, P. Investigating the usability of a head-mounted display augmented reality device in elementary school children. Sensors 2021, 21, 6623. [Google Scholar] [CrossRef] [PubMed]
- Dutta, R.; Mantri, A.; Singh, G. Evaluating system usability of mobile augmented reality application for teaching Karnaugh-Maps. Smart Learn. Environ. 2022, 9, 6. [Google Scholar] [CrossRef]
- De Boer, T.A.; de Winter, J.C.; Eisma, Y.B. Augmented reality-based telepresence in a robotic manipulation take: An experimental evaluation. IET Collab. Intell. Manuf. 2023, 5, e12085. [Google Scholar] [CrossRef]
- Mitaritonna, A.; Abasolo, M.J.; Montero, F. An augmented reality-based software architecture to support military situational awareness. In Proceedings of the 2020 International Conference on Eletrical, Communication, and Computer Engineering, Istanbul, Turkey, 12–13 June 2020. [Google Scholar]
- Criollo, C.S.; Abad, V.D.; Martic, N.M.; Velasques, G.F.A.; Perez, J.L.; Lujan, N.S. Towards a new learning experience through a mobile application with augmented reality in engineering education. Appl. Sci. 2021, 11, 4921. [Google Scholar] [CrossRef]
- Caria, M.; Todde, G.; Sara, G.; Piras, M.; Pazzona, A. Performance and usability of smartglasses for augmented reality in precision livestock farming operations. Appl. Sci. 2020, 10, 2318. [Google Scholar] [CrossRef]
- Bustos, A.; Rubio, H.; Soriano, H.E.; Castejon, C. Methodology for the integration of a high-speed train in maintenance 4.0. J. Comput. Des. Eng. 2021, 8, 1605–1621. [Google Scholar] [CrossRef]
- Nelson, S.X.; Khumbulani, M.; Innocent, R.B.; Aziz, C.; Thabiso, M.; Sinenhlanhla, N.; Thierry, Y. Development of a 3D interactive training platform for assembly of bogie unit in the railcar learning factory. Procedia Manuf. 2020, 45, 386–391. [Google Scholar] [CrossRef]
- Brooke, J. SUS: A retrospective. J. Usability Stud. 2013, 8, 29–40. [Google Scholar]
- James, R.L. IBM Computer Usability Satisfaction Questionnaires: Psychometric Evaluation and Instructions for Use. Int. J. Hum.-Comput. Interact. 1995, 7, 57–78. [Google Scholar] [CrossRef]
- Kraig, F. The usability metric for user experience. Interact. Comput. 2010, 22, 323–327. [Google Scholar] [CrossRef]
- Raymund, D.; Gali, M.A.; Llavore, D. Usability Test of Moodle LMS Using Empirical Data and Questionnaire for User Interface Satisfaction. In Proceedings of the 2022 11th International Conference on Software and Computer Applications, Melaka, Malaysia, 24–26 February 2022. [Google Scholar]
- de Souza Cardoso, L.F.; Flávia, C.M.Q.M.; Ezequiel, R.Z. A survey of industrial augmented reality. Comput. Ind. Eng. 2020, 139, 106159. [Google Scholar] [CrossRef]
- Bangor, A.; Philip, K.; James, M. Determining what individual SUS scores mean: Adding an adjective rating scale. J. Usability Stud. 2009, 4, 114–123. [Google Scholar]
- De Crescenzio, F.; Fantini, M.; Persiani, F.; Di Stefano, L.; Azzari, P.; Salti, S. Augmented reality for aircraft maintenance training and operations support. IEEE Comput. Graph. Appl. 2011, 31, 96–101. [Google Scholar] [CrossRef] [PubMed]
- Zhu, J.S.; Ong, K.; Nee, A.Y.C. A context-aware augmented reality assisted maintenance system. J. Comput. Integr. Manuf. 2014, 28, 213–225. [Google Scholar] [CrossRef]
- Jeon, J.H.; Lee, S.Y. Standardizations for mobile augmented reality technology. Electron. Telecommun. Trends 2011, 26, 61–74. [Google Scholar] [CrossRef]
- Salimi, N.T.; Ezbarami, Z.T.; Tabari-Khomeiran, R.; Roushan, Z.A.; Hashemian, H.; Astaneh, H.K. Comparing the effects of mobile-based education and booklet-based education on Iranian mothers’ perception on antibiotics: A quasi-experimental study. J. Pediatr. Nurs. 2021, 61, 122–129. [Google Scholar] [CrossRef] [PubMed]
- Yang, X.; Qiu, W.; Zhang, H.; Tang, L. An efficient alternating direction implicit finite difference scheme for the three-dimensional time-fractional telegraph equation. Comput. Math. Appl. 2021, 102, 233–247. [Google Scholar] [CrossRef]
- Yang, X.; Qiu, W.; Chen, H.; Zhang, H. Second-order BDF ADI Galerkin finite element method for the evolutionary equation with a nonlocal term in three-dimensional space. Appl. Numer. Math. 2022, 172, 497–513. [Google Scholar] [CrossRef]
- Design X Introductory Tutorial Start Page. Available online: https://softwaresupport.oqton.com/s/article/Design-X-Introductory-Tutorial-Start-Page?language=en_US (accessed on 9 July 2024).
- CATIA Documentation. Available online: http://catiadoc.free.fr/online/CATIA_P3_default.htm (accessed on 9 July 2024).
- Kim, C.S.; Park, S.J. The optimal design of a conical anti-vibration device for sensitive cargo container. J. Korean Soc. Railw. 2020, 23, 1142–1150. [Google Scholar] [CrossRef]
- AR Foundation Package. Available online: https://docs.unity3d.com/Packages/[email protected]/manual/index.html?q=ar%20founda (accessed on 9 July 2024).
- Kim, C.S. Training Apparatus with Streamline Matching Function and Method for Providing Thereof; KIPO Paper RM 5211206; KIPO: Seoul, Republic of Korea, 2021. [Google Scholar]
- Berkman, M.I.; Karahoca, D. Re-Assessing the Usability Metric for User Experience (UMUX) Scale. J. Usability Stud. 2016, 11, 89–109. [Google Scholar]
- James, R.L.; Jeff, S. Can I leave this one out? The effect of dropping an item from the SUS. J. Usability Stud. 2017, 13, 38–46. [Google Scholar]
- Sauro, J.; Lewis, J.R. Standardized usability questionnaires. In Quantifying the User Experience: Practical Statistics for User Research, 2nd ed.; Green, T., Lawrence, L., Eds.; Morgan Kaufamann: Burlington, MA, USA, 2016; p. 204. [Google Scholar]
- James, R.L. Measuring perceived usability: The CSUQ, SUS, and UMUX. Int. J. Hum.-Comput. Interact. 2018, 34, 1148–1156. [Google Scholar] [CrossRef]
- Yang, X.; Zhang, H.; Zhang, Q.; Yuan, G. Simple positivity-preserving nonlinear finite volume scheme for subdiffusion equations on general non-conforming distorted meshes. Nonlinear Dyn. 2022, 108, 3859–3886. [Google Scholar] [CrossRef]
- Yang, X.; Zhang, H.; Zhang, Q.; Yuan, G.; Sheng, Z. The finite volume scheme preserving maximum principle for two-dimensional time-fractional Fokker–Planck equations on distorted meshes. Appl. Math. 2019, 97, 99–106. [Google Scholar] [CrossRef]


| Division | Mobile Device | HMD Device |
|---|---|---|
| Interaction | Touch gesture and button-based interaction. | Hand tracking-based interaction. |
| Point of view | Experience with perspective applied like an actual camera. | Experience with perspective provided like actual glasses. |
| Usability | Adjustable display brightness, no restriction on field of view. | Low display brightness, narrow field of view. |
| Deployment environment | Easy distribution on personal smartphones and tablets. | Difficult distribution due to high cost. |
| Component | Mobile Device |
|---|---|
| Text | Explains long and complex maintenance details in small amounts of text. |
| Color | Maintains color unity and promotes visual perception. |
| Icon | Provides visual unity so that even beginners can easily understand. |
| Typography | Balanced and intuitive design that saves as much interface space as possible. |
| Image | Photos and language information are provided in real-life situations. |
| Item | Questions |
|---|---|
| U1 | This content’s capabilities meet my requirements |
| U2 | Using this content is a frustrating experience |
| U3 | This content is easy to use |
| U4 | I have to spend too much time correcting things with this system |
| Category | No | Questions |
|---|---|---|
| System Usefulness | 1 | Overall, I am satisfied with how easy it is to use this system |
| 2 | It was simple to use this system | |
| 3 | I can effectively complete my work using this system | |
| 4 | I am able to complete my work quickly using this system | |
| 5 | I am able to efficiently complete my work using this system | |
| 6 | I feel comfortable using this system | |
| 7 | It was easy to learn to use this system | |
| 8 | I believe I became productive quickly using this system | |
| Information Quality | 9 | This system gives error messages that clearly tell me how to fix problems |
| 10 | Whenever I make a mistake using this system, I recover easily and quickly | |
| 11 | The information (such as online help, on-screen messages, and other documentation) provided with this system is clear | |
| 12 | It is easy to find the information I needed | |
| 13 | The information provided for this system is easy to understand | |
| 14 | The information is effective in helping me complete the tasks and scenarios | |
| 15 | The organization of information on this system screens is clear | |
| Interface Quality | 16 | The interface of this system is pleasant |
| 17 | I like using the interface of this system | |
| 18 | This AR system has all the functions and capabilities I expect it to have | |
| Overall Usability | 19 | Overall, I am satisfied with this system |
| Classification | Detailed Values | Remarks | |
|---|---|---|---|
| Total participants | 80 | ||
| Average age | 39.9 | Standard deviation: 11.7 | |
| Average years of employment | 14.8 | Standard deviation: 10.6 | |
| Age distribution | 20–29 Years | 21 people | |
| 30–39 Years | 18 people | ||
| 40–49 Years | 20 people | ||
| 50–59 Years | 21 people | ||
| Gender | Male | 65 people | |
| Female | 15 people | ||
| Rail vehicle classification | High-speed rail | 57 people | |
| General rail | 23 people | ||
| Maintenance part | Light | 41 people | |
| Heavy | 39 people | ||
| Category | No | Document Manual | AR Content | ||
| Average | Standard Deviation | Average | Standard Deviation | ||
| System Usefulness | 1 | 79.58 | 19.42 | 86.25 | 13.55 |
| 2 | 77.08 | 16.32 | 82.50 | 14.10 | |
| 3 | 77.08 | 18.75 | 85.83 | 14.40 | |
| 4 | 73.75 | 19.20 | 85.83 | 13.89 | |
| 5 | 69.58 | 24.43 | 81.25 | 12.62 | |
| 6 | 73.33 | 19.90 | 87.08 | 13.86 | |
| 7 | 75.42 | 23.57 | 85.00 | 12.96 | |
| 8 | 75.83 | 22.31 | 85.83 | 12.83 | |
| Information Quality | 9 | 77.92 | 20.46 | 80.83 | 16.69 |
| 10 | 75.83 | 20.31 | 73.33 | 15.92 | |
| 11 | 73.75 | 20.63 | 86.25 | 9.16 | |
| 12 | 71.25 | 21.01 | 83.33 | 9.99 | |
| 13 | 74.58 | 21.01 | 83.33 | 8.44 | |
| 14 | 70.83 | 20.93 | 76.25 | 14.07 | |
| 15 | 73.33 | 20.95 | 80.00 | 16.96 | |
| Interface Quality | 16 | 67.50 | 21.00 | 69.17 | 22.50 |
| 17 | 68.75 | 18.94 | 67.92 | 21.81 | |
| 18 | 66.67 | 24.17 | 74.17 | 21.67 | |
| Overall Usability | 19 | 70.42 | 18.29 | 81.67 | 13.50 |
| Score Range | Grade | Percentile Range |
|---|---|---|
| 84.1–100.0 | A+ | 96–100 |
| 80.8–84.0 | A | 90–95 |
| 78.9–80.7 | A− | 85–89 |
| 77.2–78.8 | B+ | 80–84 |
| 74.1–77.1 | B | 70–79 |
| 72.6–74.0 | B− | 65–69 |
| 71.1–72.5 | C+ | 60–64 |
| 65.0–71.0 | C | 41–59 |
| 62.7–64.9 | C− | 35–40 |
| 51.7–62.6 | D | 15–34 |
| 0–51.6 | F | 0–14 |
| Item | Detail |
|---|---|
| Feature documentation | In using the UI, the functions are not explicitly described. |
| touch gestures | Interaction is not smooth when controlling position, size, and rotation simultaneously. |
Disclaimer/Publisher’s Note: The statements, opinions and data contained in all publications are solely those of the individual author(s) and contributor(s) and not of MDPI and/or the editor(s). MDPI and/or the editor(s) disclaim responsibility for any injury to people or property resulting from any ideas, methods, instructions or products referred to in the content. |
© 2024 by the authors. Licensee MDPI, Basel, Switzerland. This article is an open access article distributed under the terms and conditions of the Creative Commons Attribution (CC BY) license (https://creativecommons.org/licenses/by/4.0/).
Share and Cite
Kim, K.-S.; Kim, C.-S. Development and Usability Evaluation of Augmented Reality Content for Light Maintenance Training of Air Spring for Electric Multiple Unit. Appl. Sci. 2024, 14, 7702. https://doi.org/10.3390/app14177702
Kim K-S, Kim C-S. Development and Usability Evaluation of Augmented Reality Content for Light Maintenance Training of Air Spring for Electric Multiple Unit. Applied Sciences. 2024; 14(17):7702. https://doi.org/10.3390/app14177702
Chicago/Turabian StyleKim, Kyung-Sik, and Chul-Su Kim. 2024. "Development and Usability Evaluation of Augmented Reality Content for Light Maintenance Training of Air Spring for Electric Multiple Unit" Applied Sciences 14, no. 17: 7702. https://doi.org/10.3390/app14177702