
Integrated Platform for Determining Solderability Parameters: Module for Measuring the Surface Tension of Liquid Solders


Abstract
:1. Introduction
2. Maximum Bubble Pressure Method
2.1. Analysis of Surface Tension Using the Maximum Bubble Pressure Method
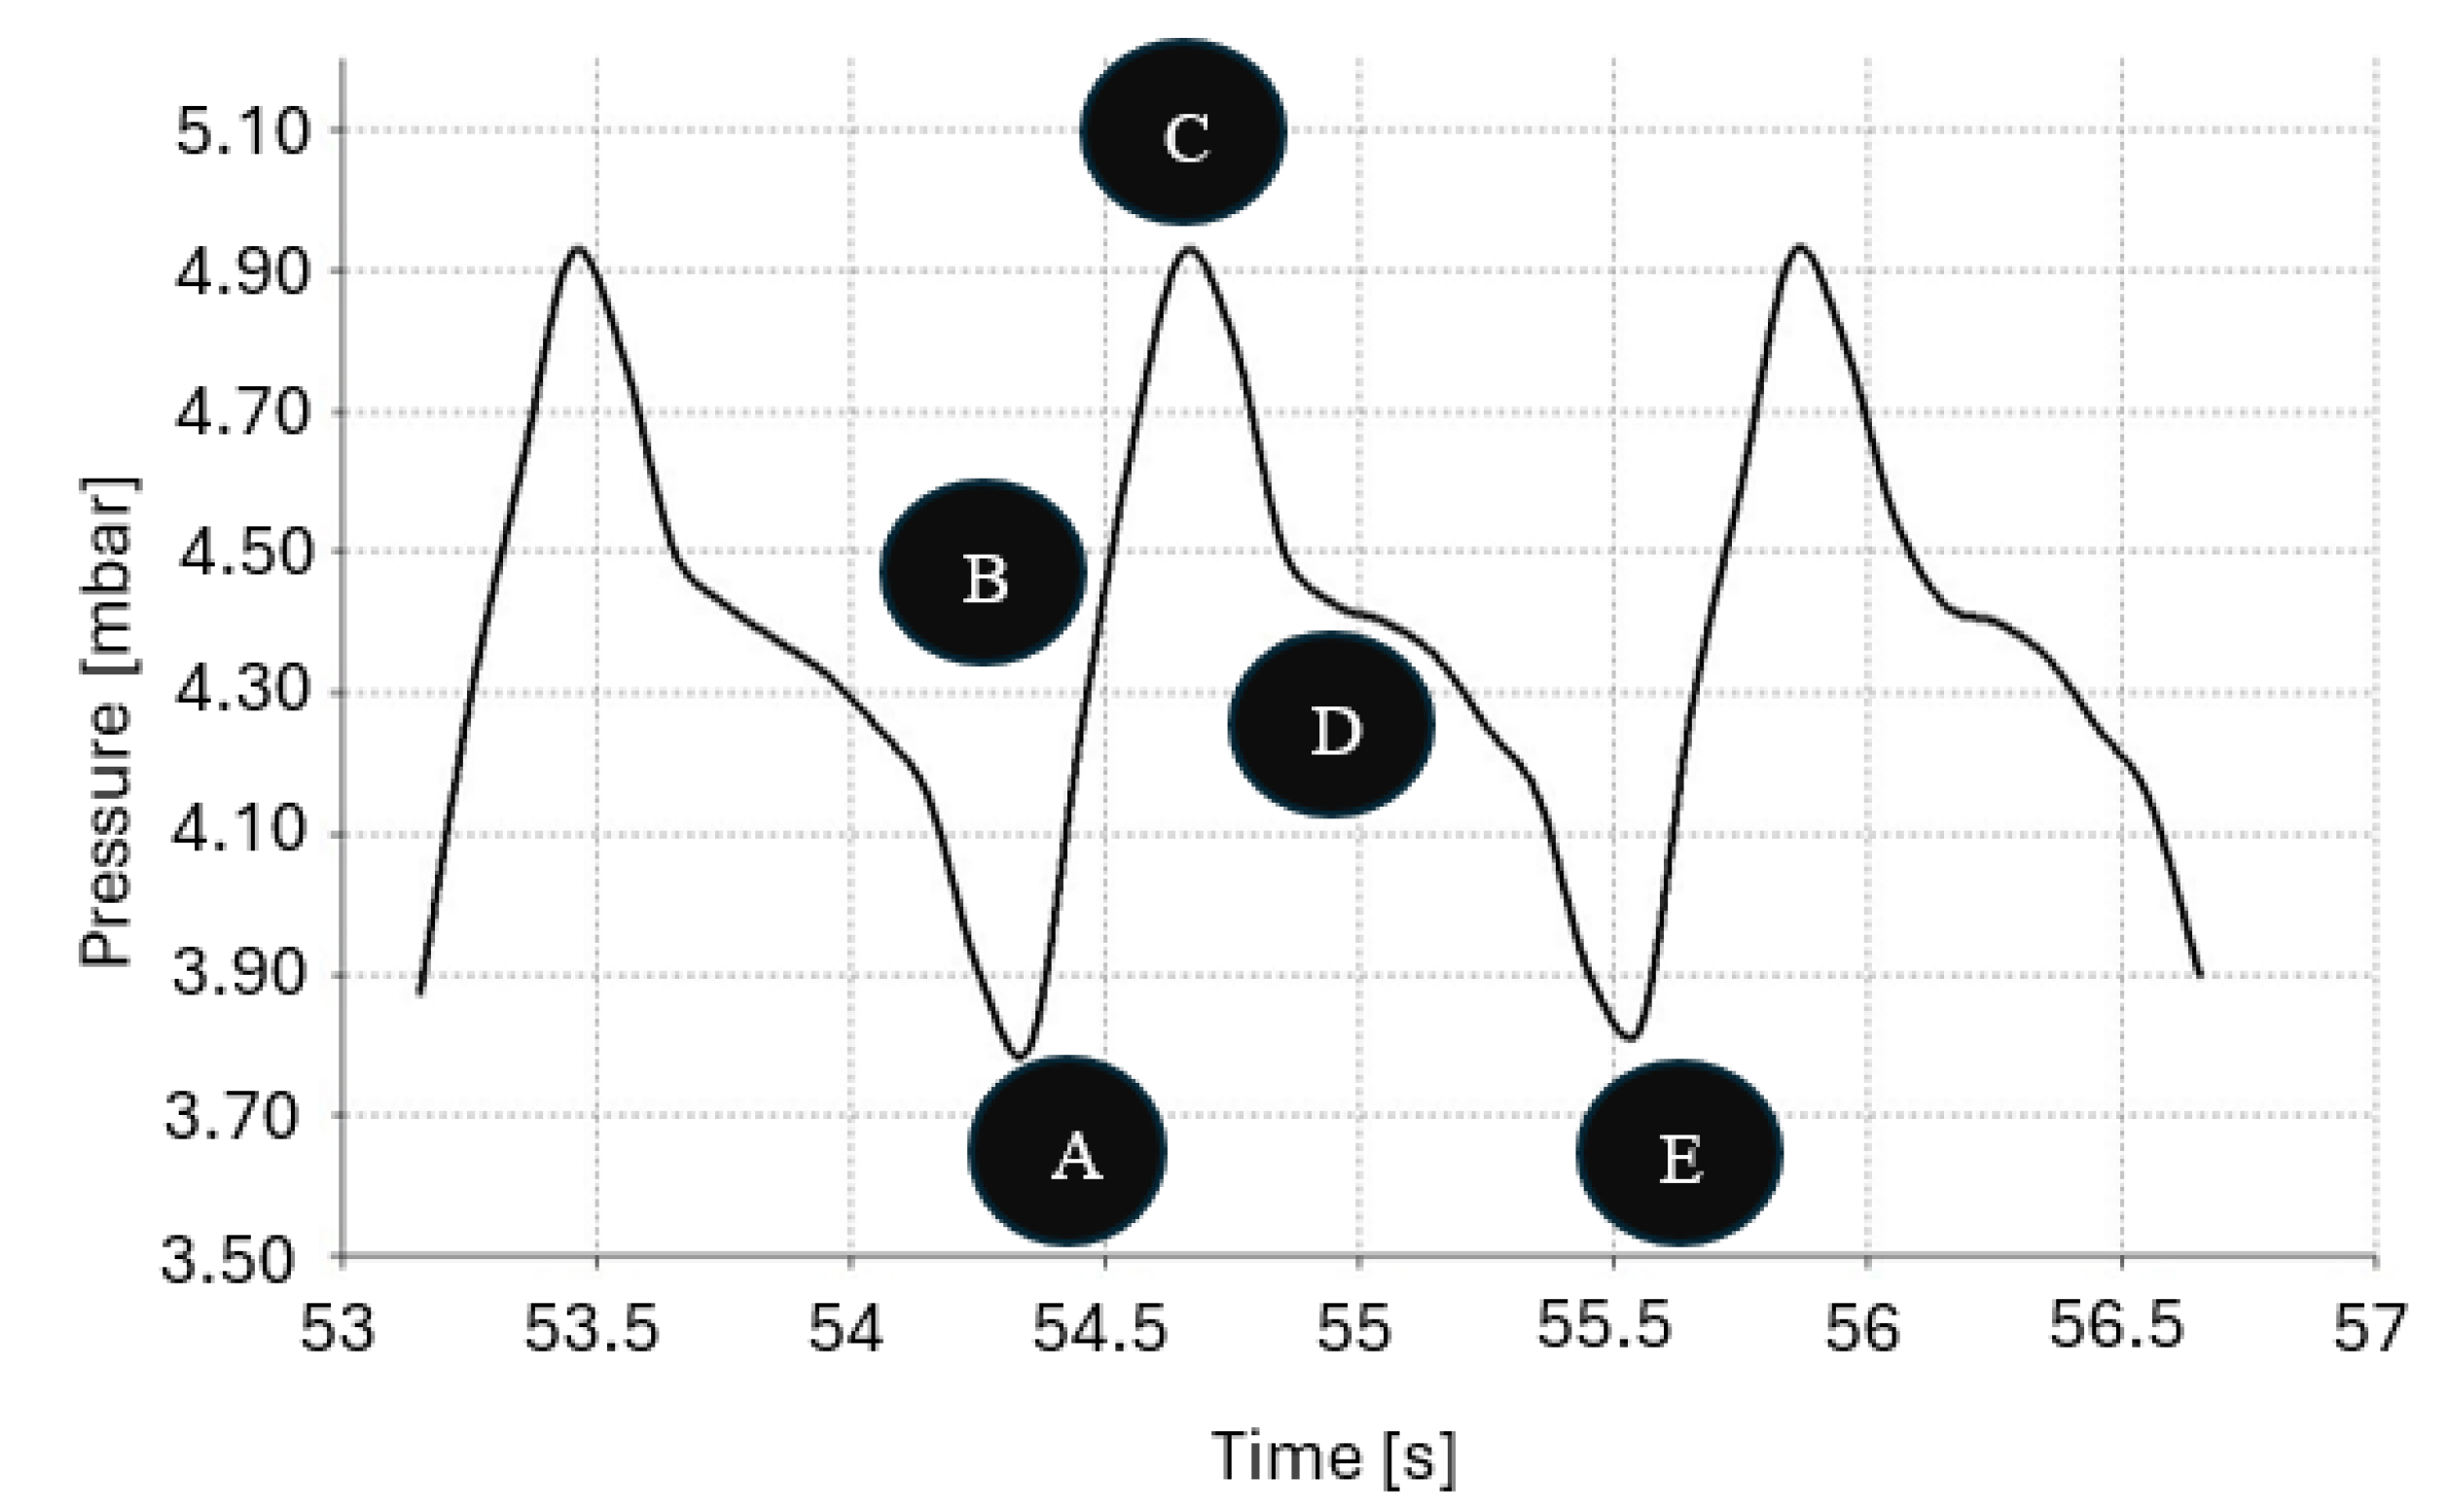
- —Pressure in the bubble (for practical purposes, this does not depend on point A).
- —Pressure in the retort above the bath surface (does not depend on point A).
- —Hydrostatic pressure (a function of the depth h relative to the bath surface).
- —Density of the bath material.
- g—Acceleration due to gravity.
- —Depth of immersion of point A in the bath.
- h—Capillary immersion depth.
- r—Capillary radius.
2.2. Introduction of Measurement Correction
- —The value of surface tension determined from (9).
- —The adjusted value.
3. Construction Concept and Construction of the Measuring Platform
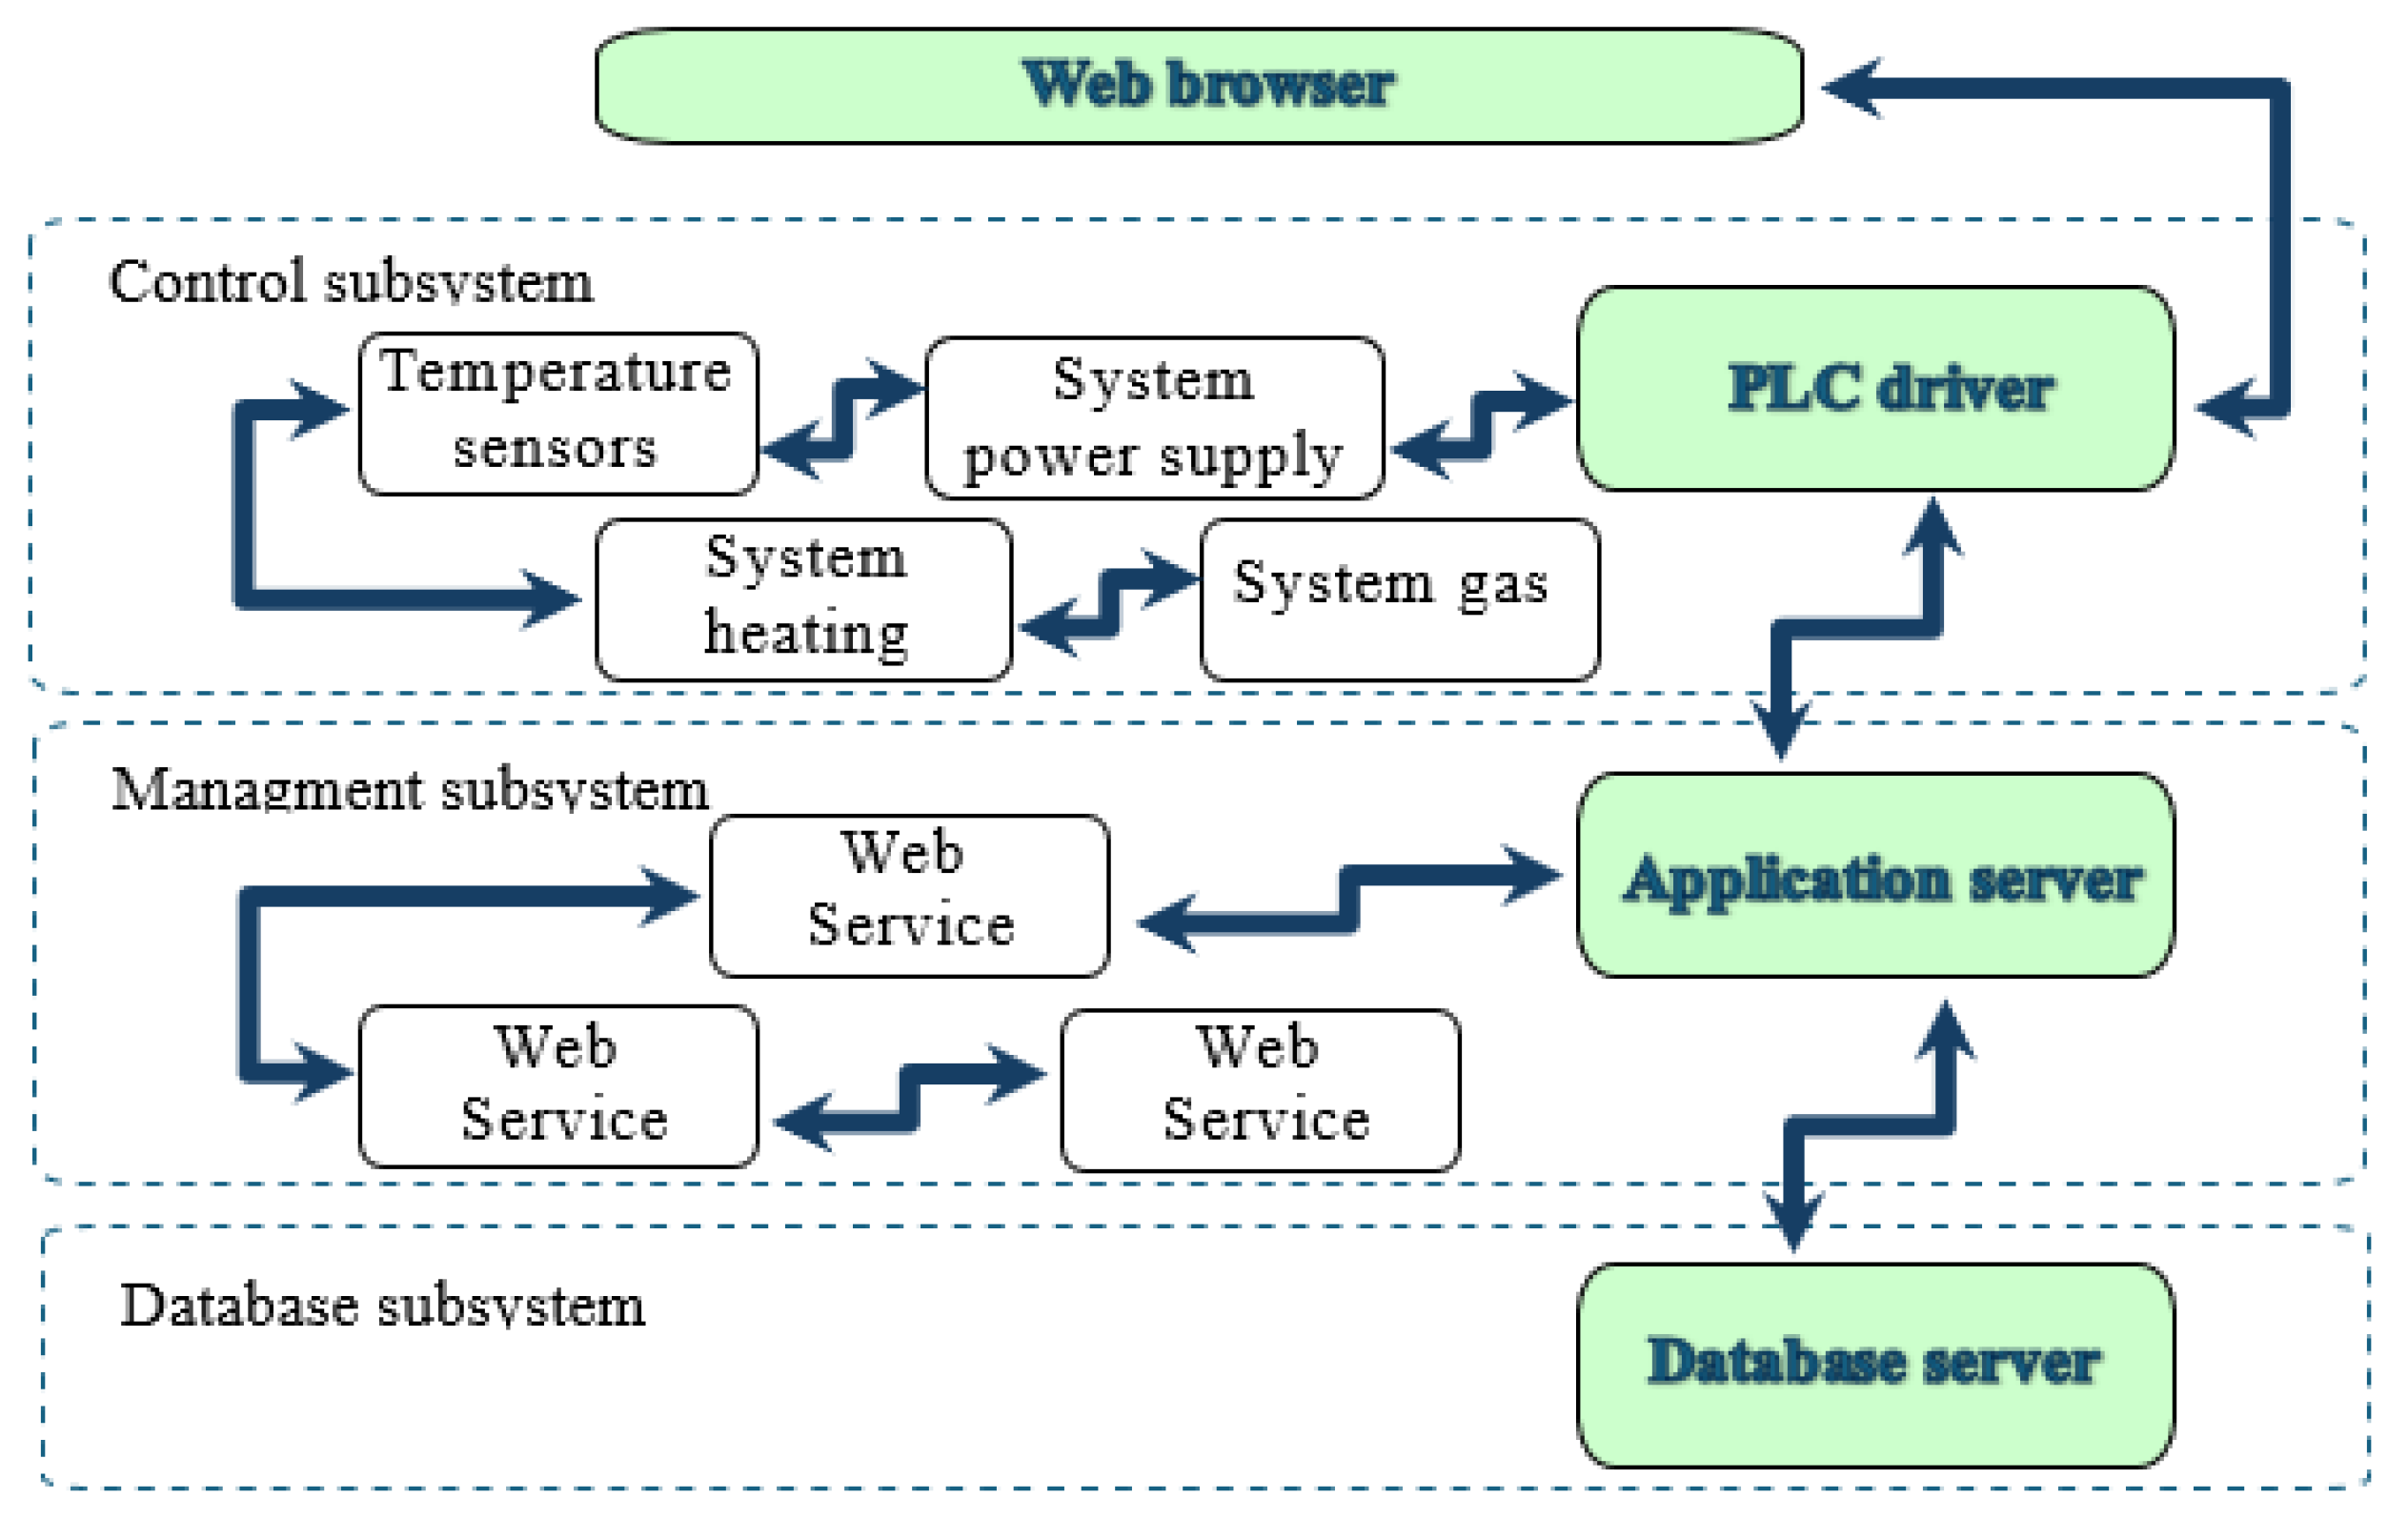
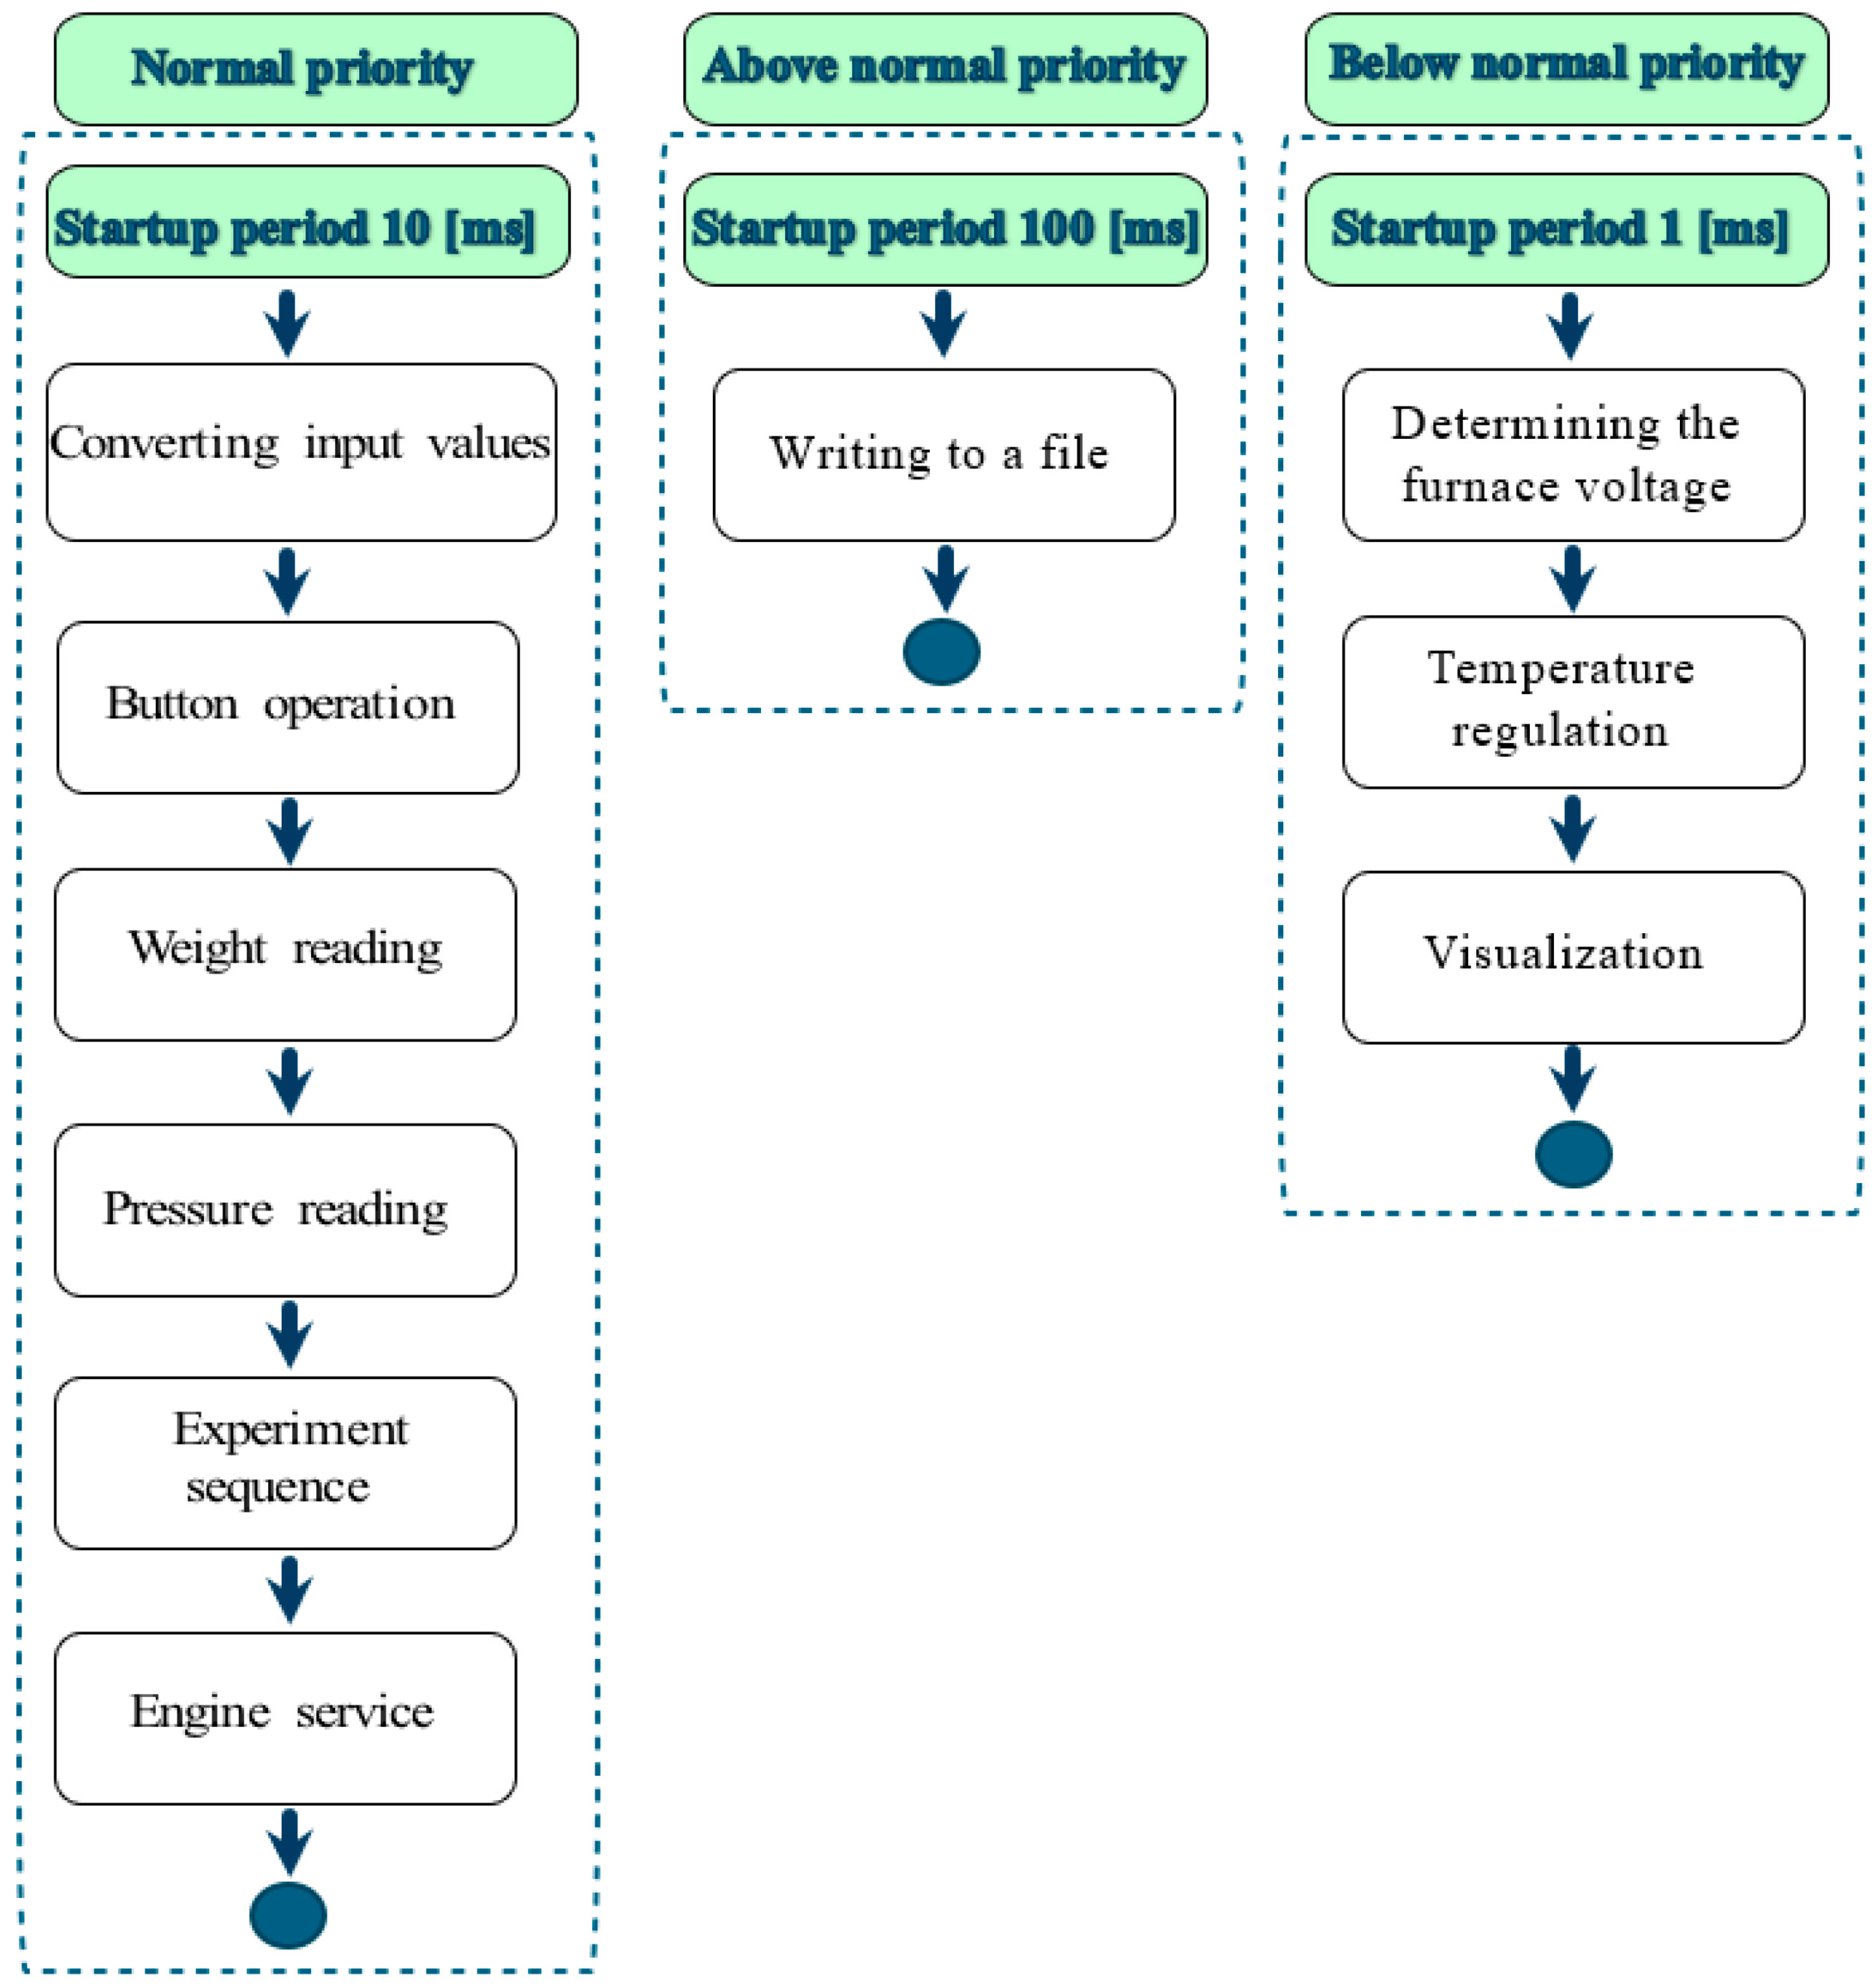
3.1. IT System Architecture
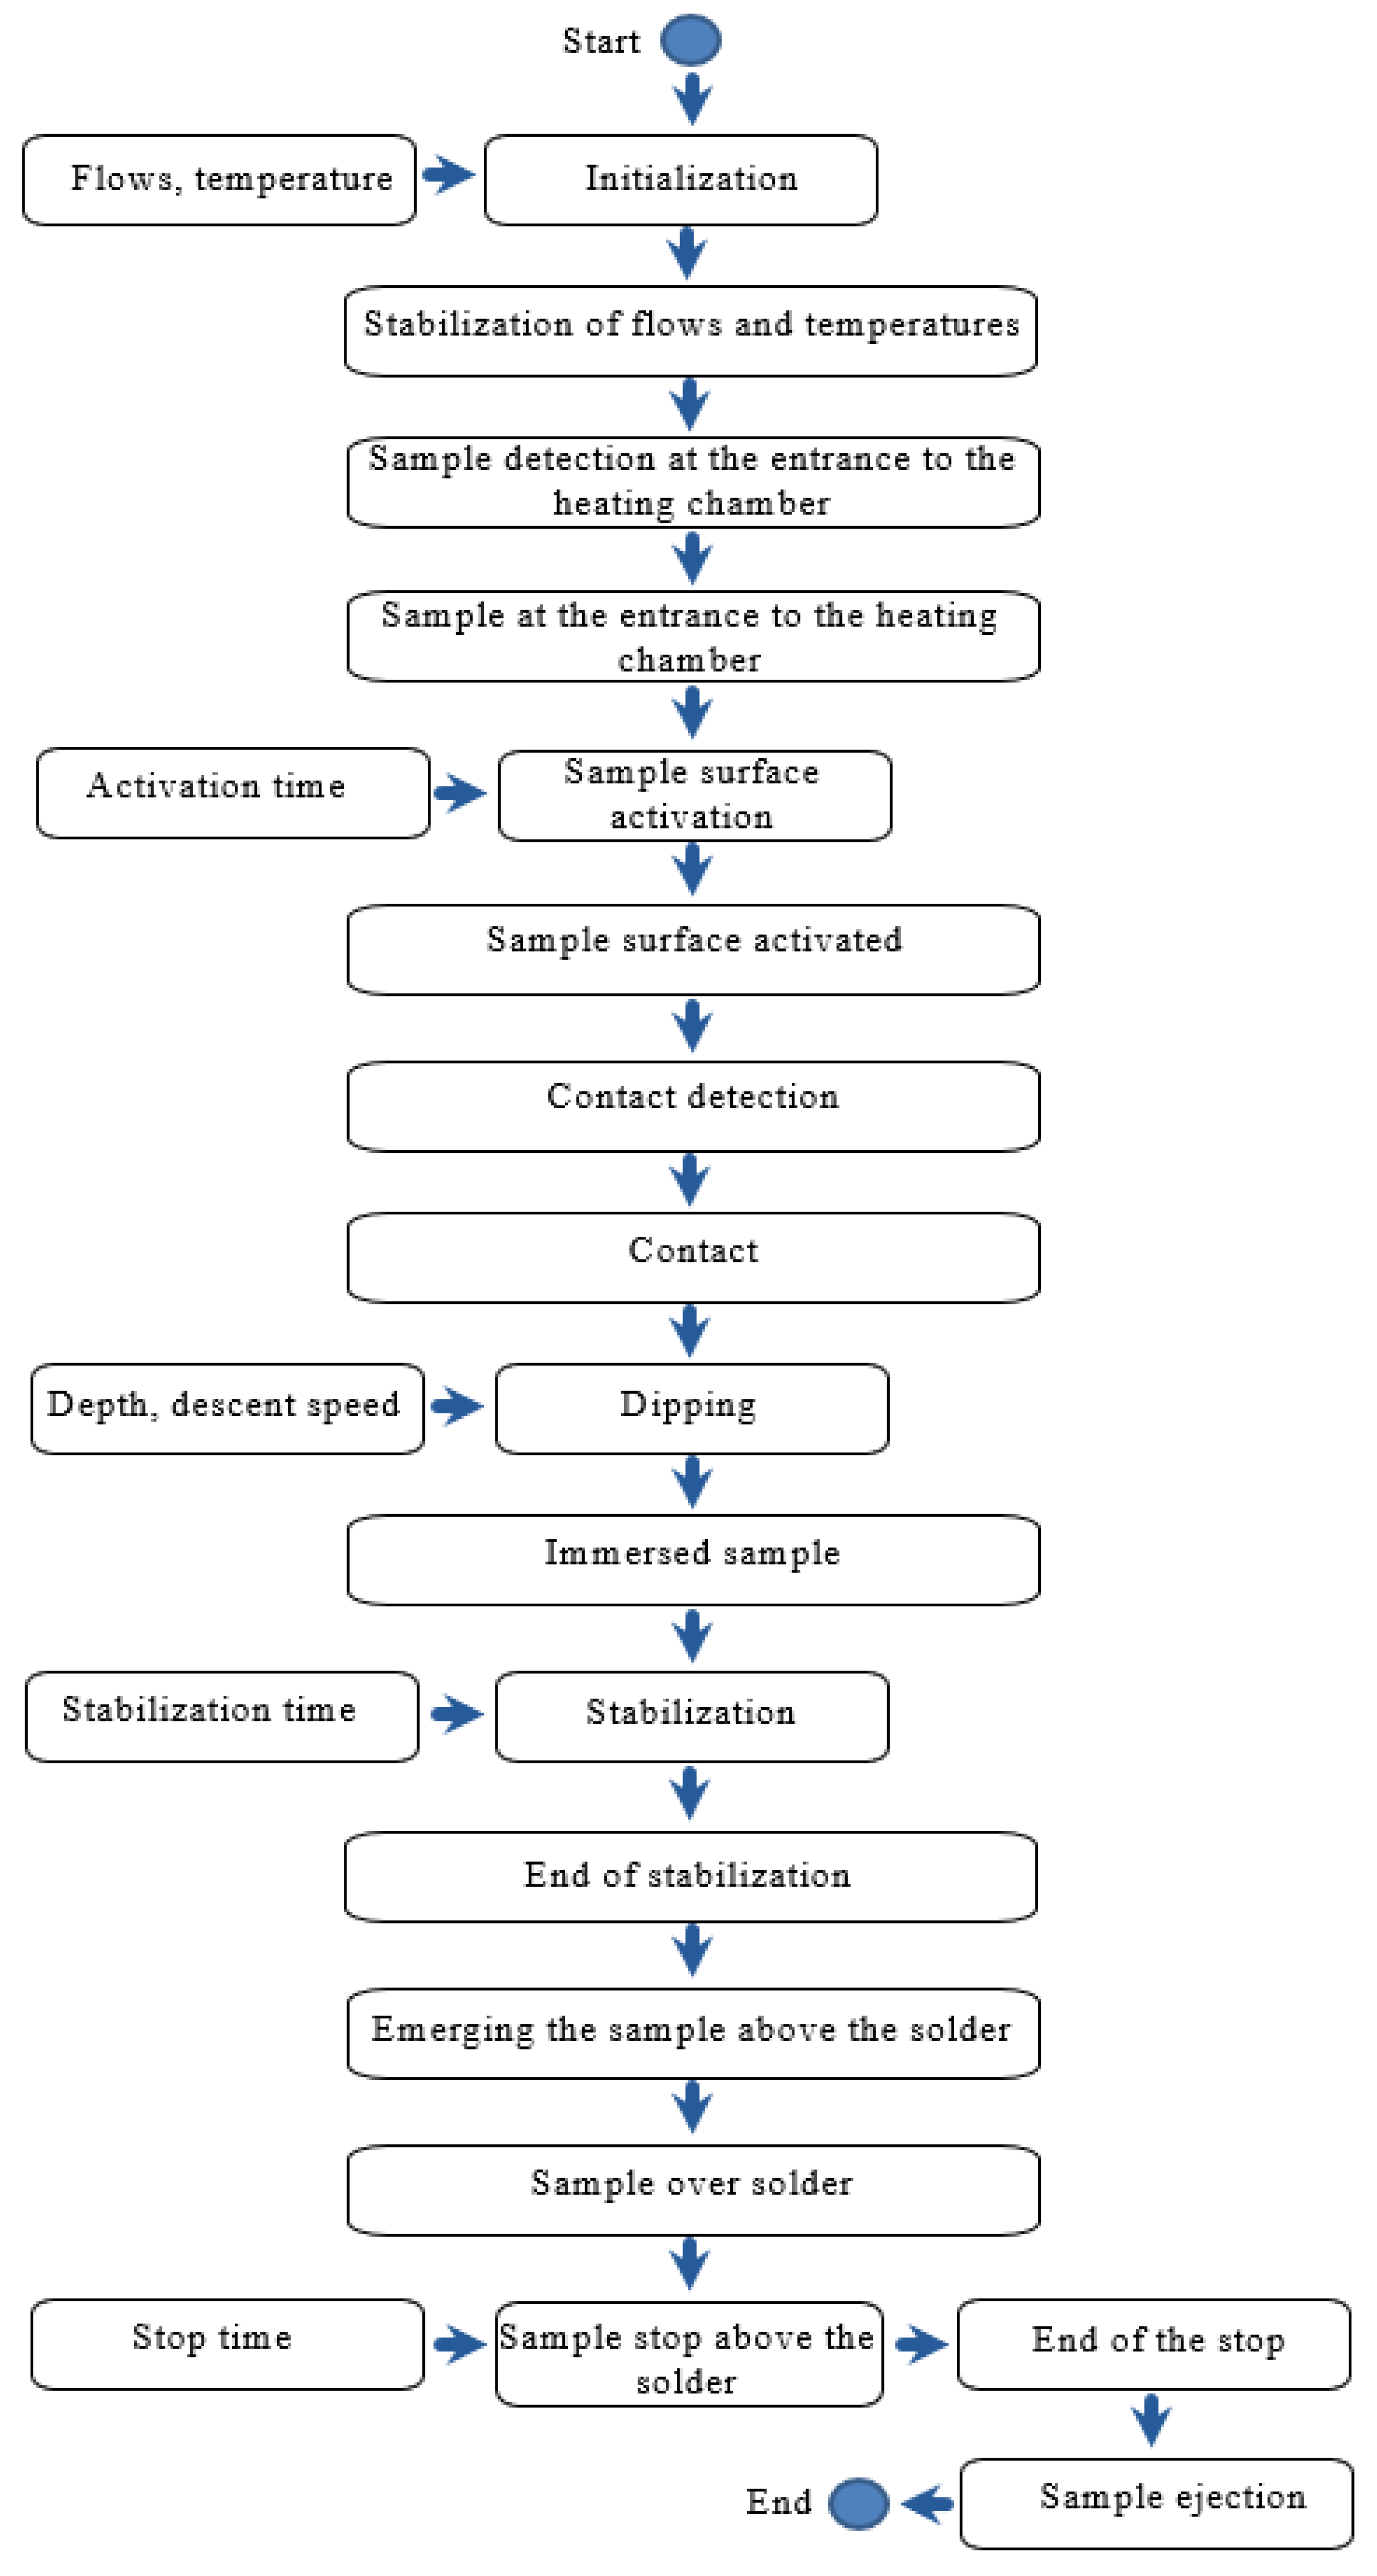
3.2. Experimental Scheme
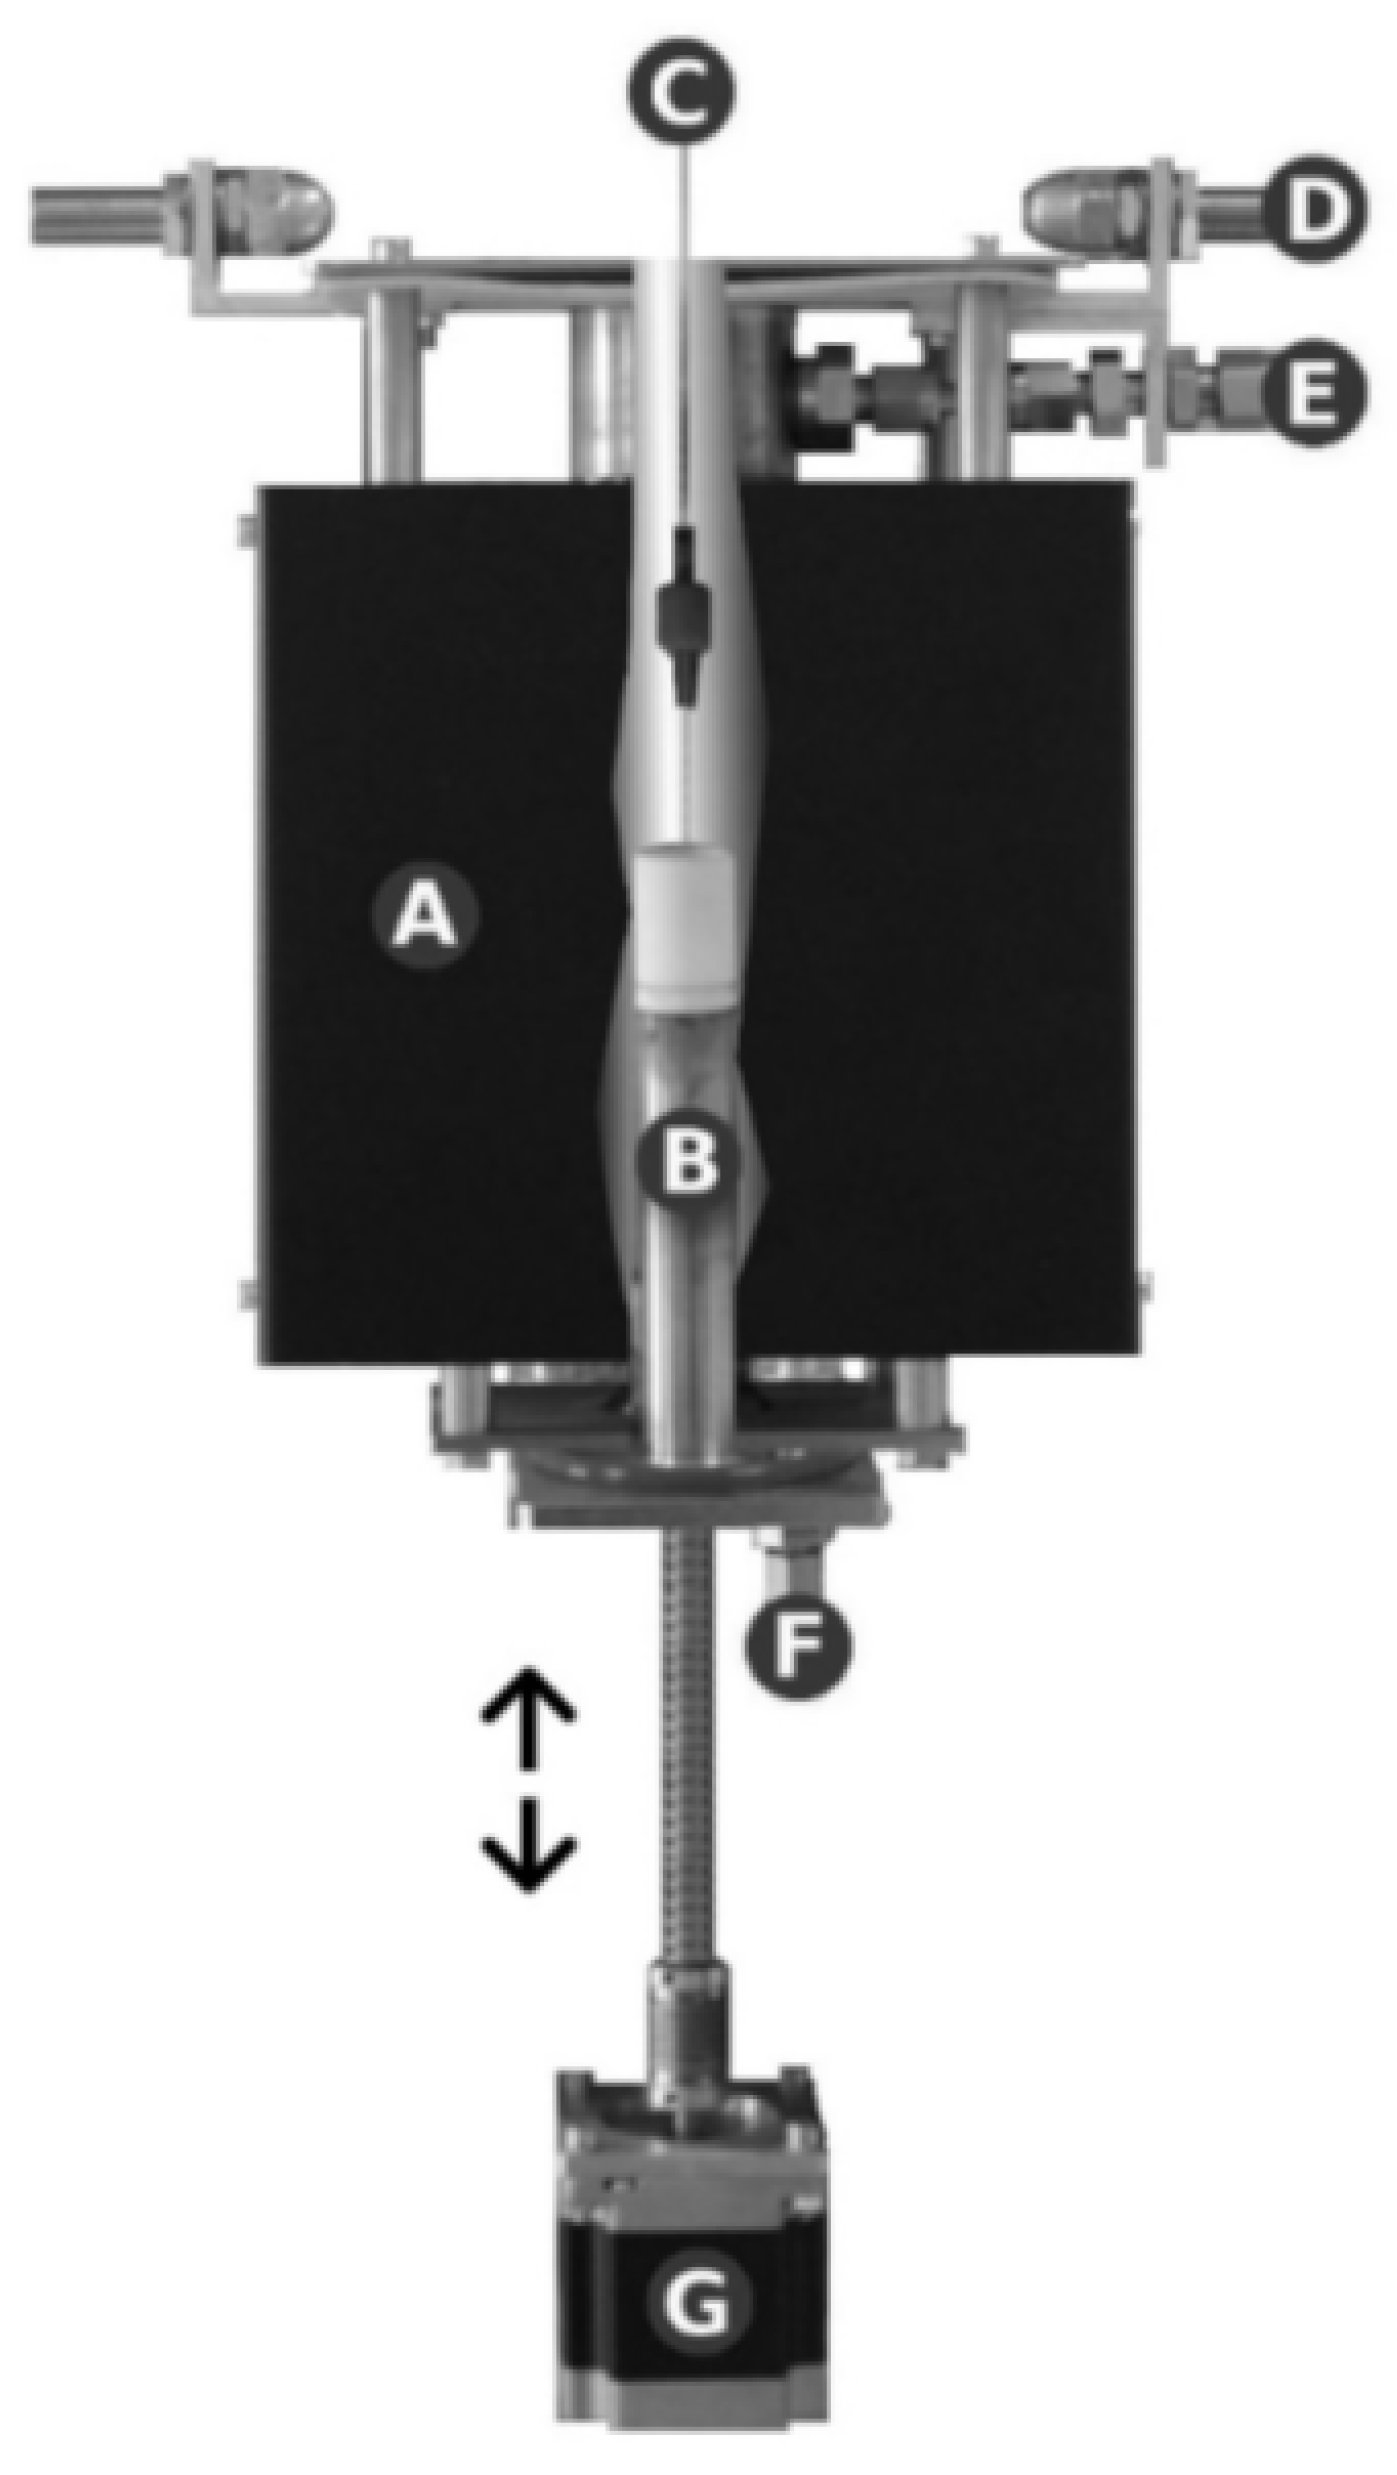
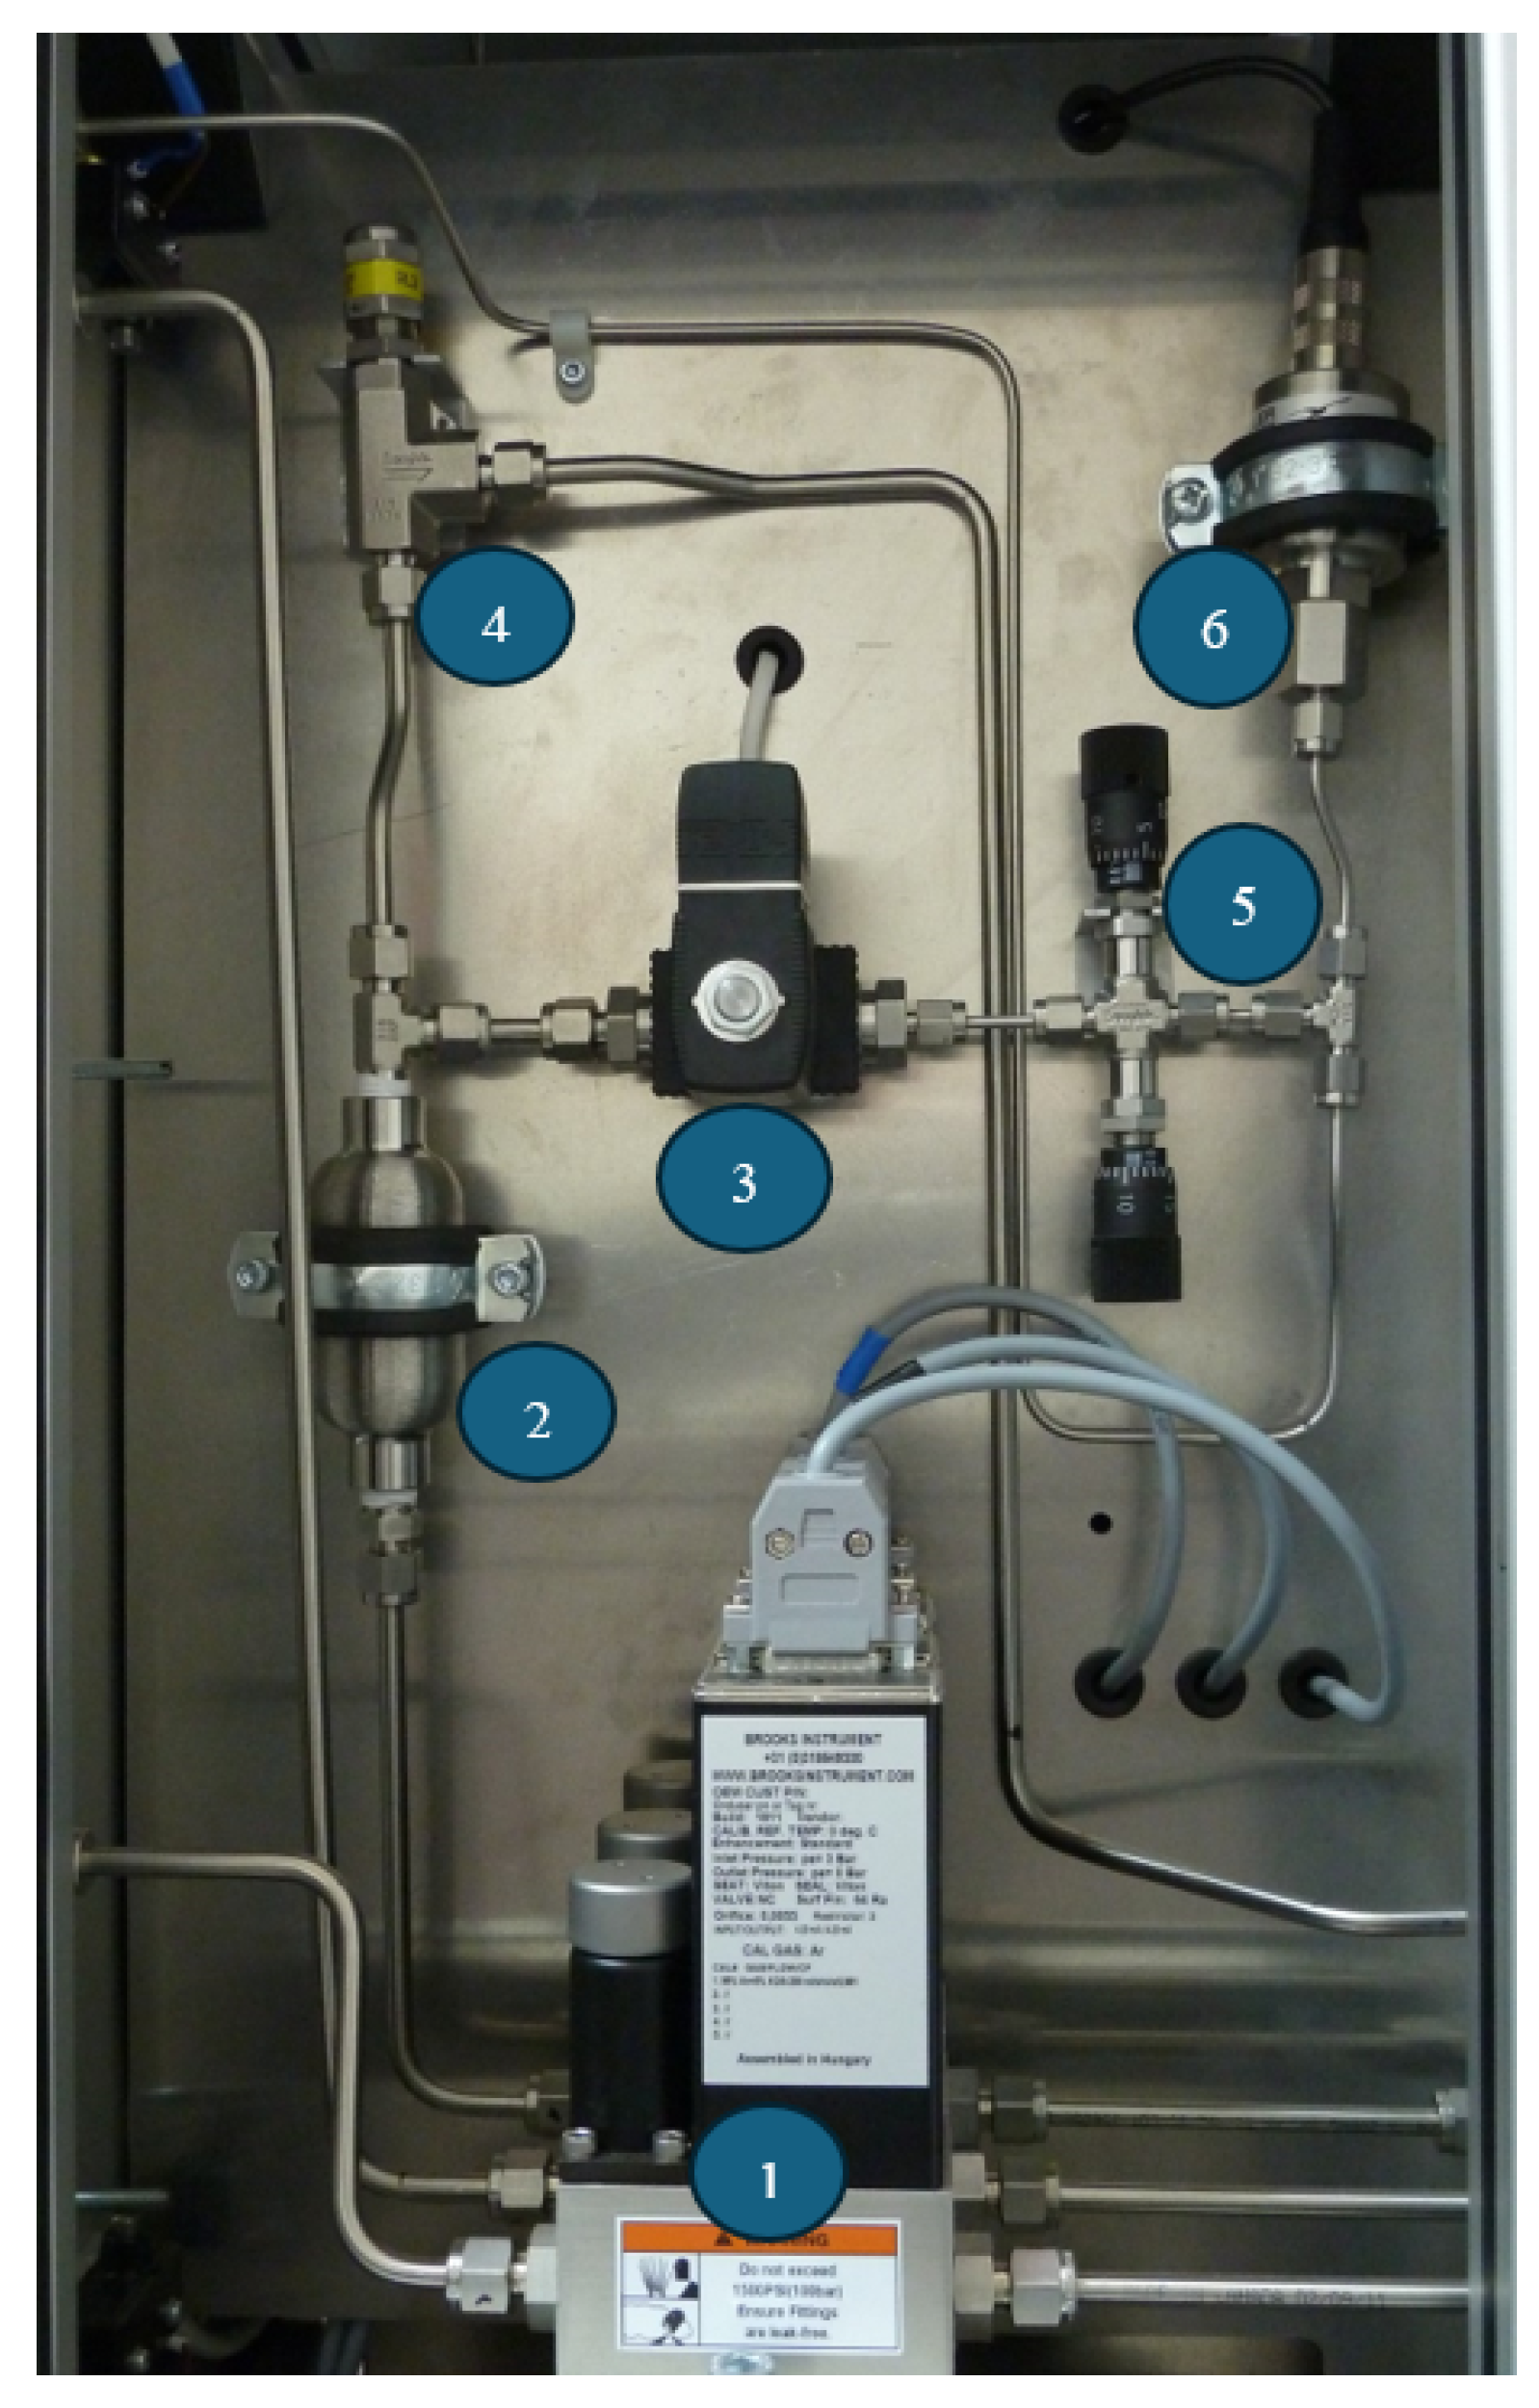
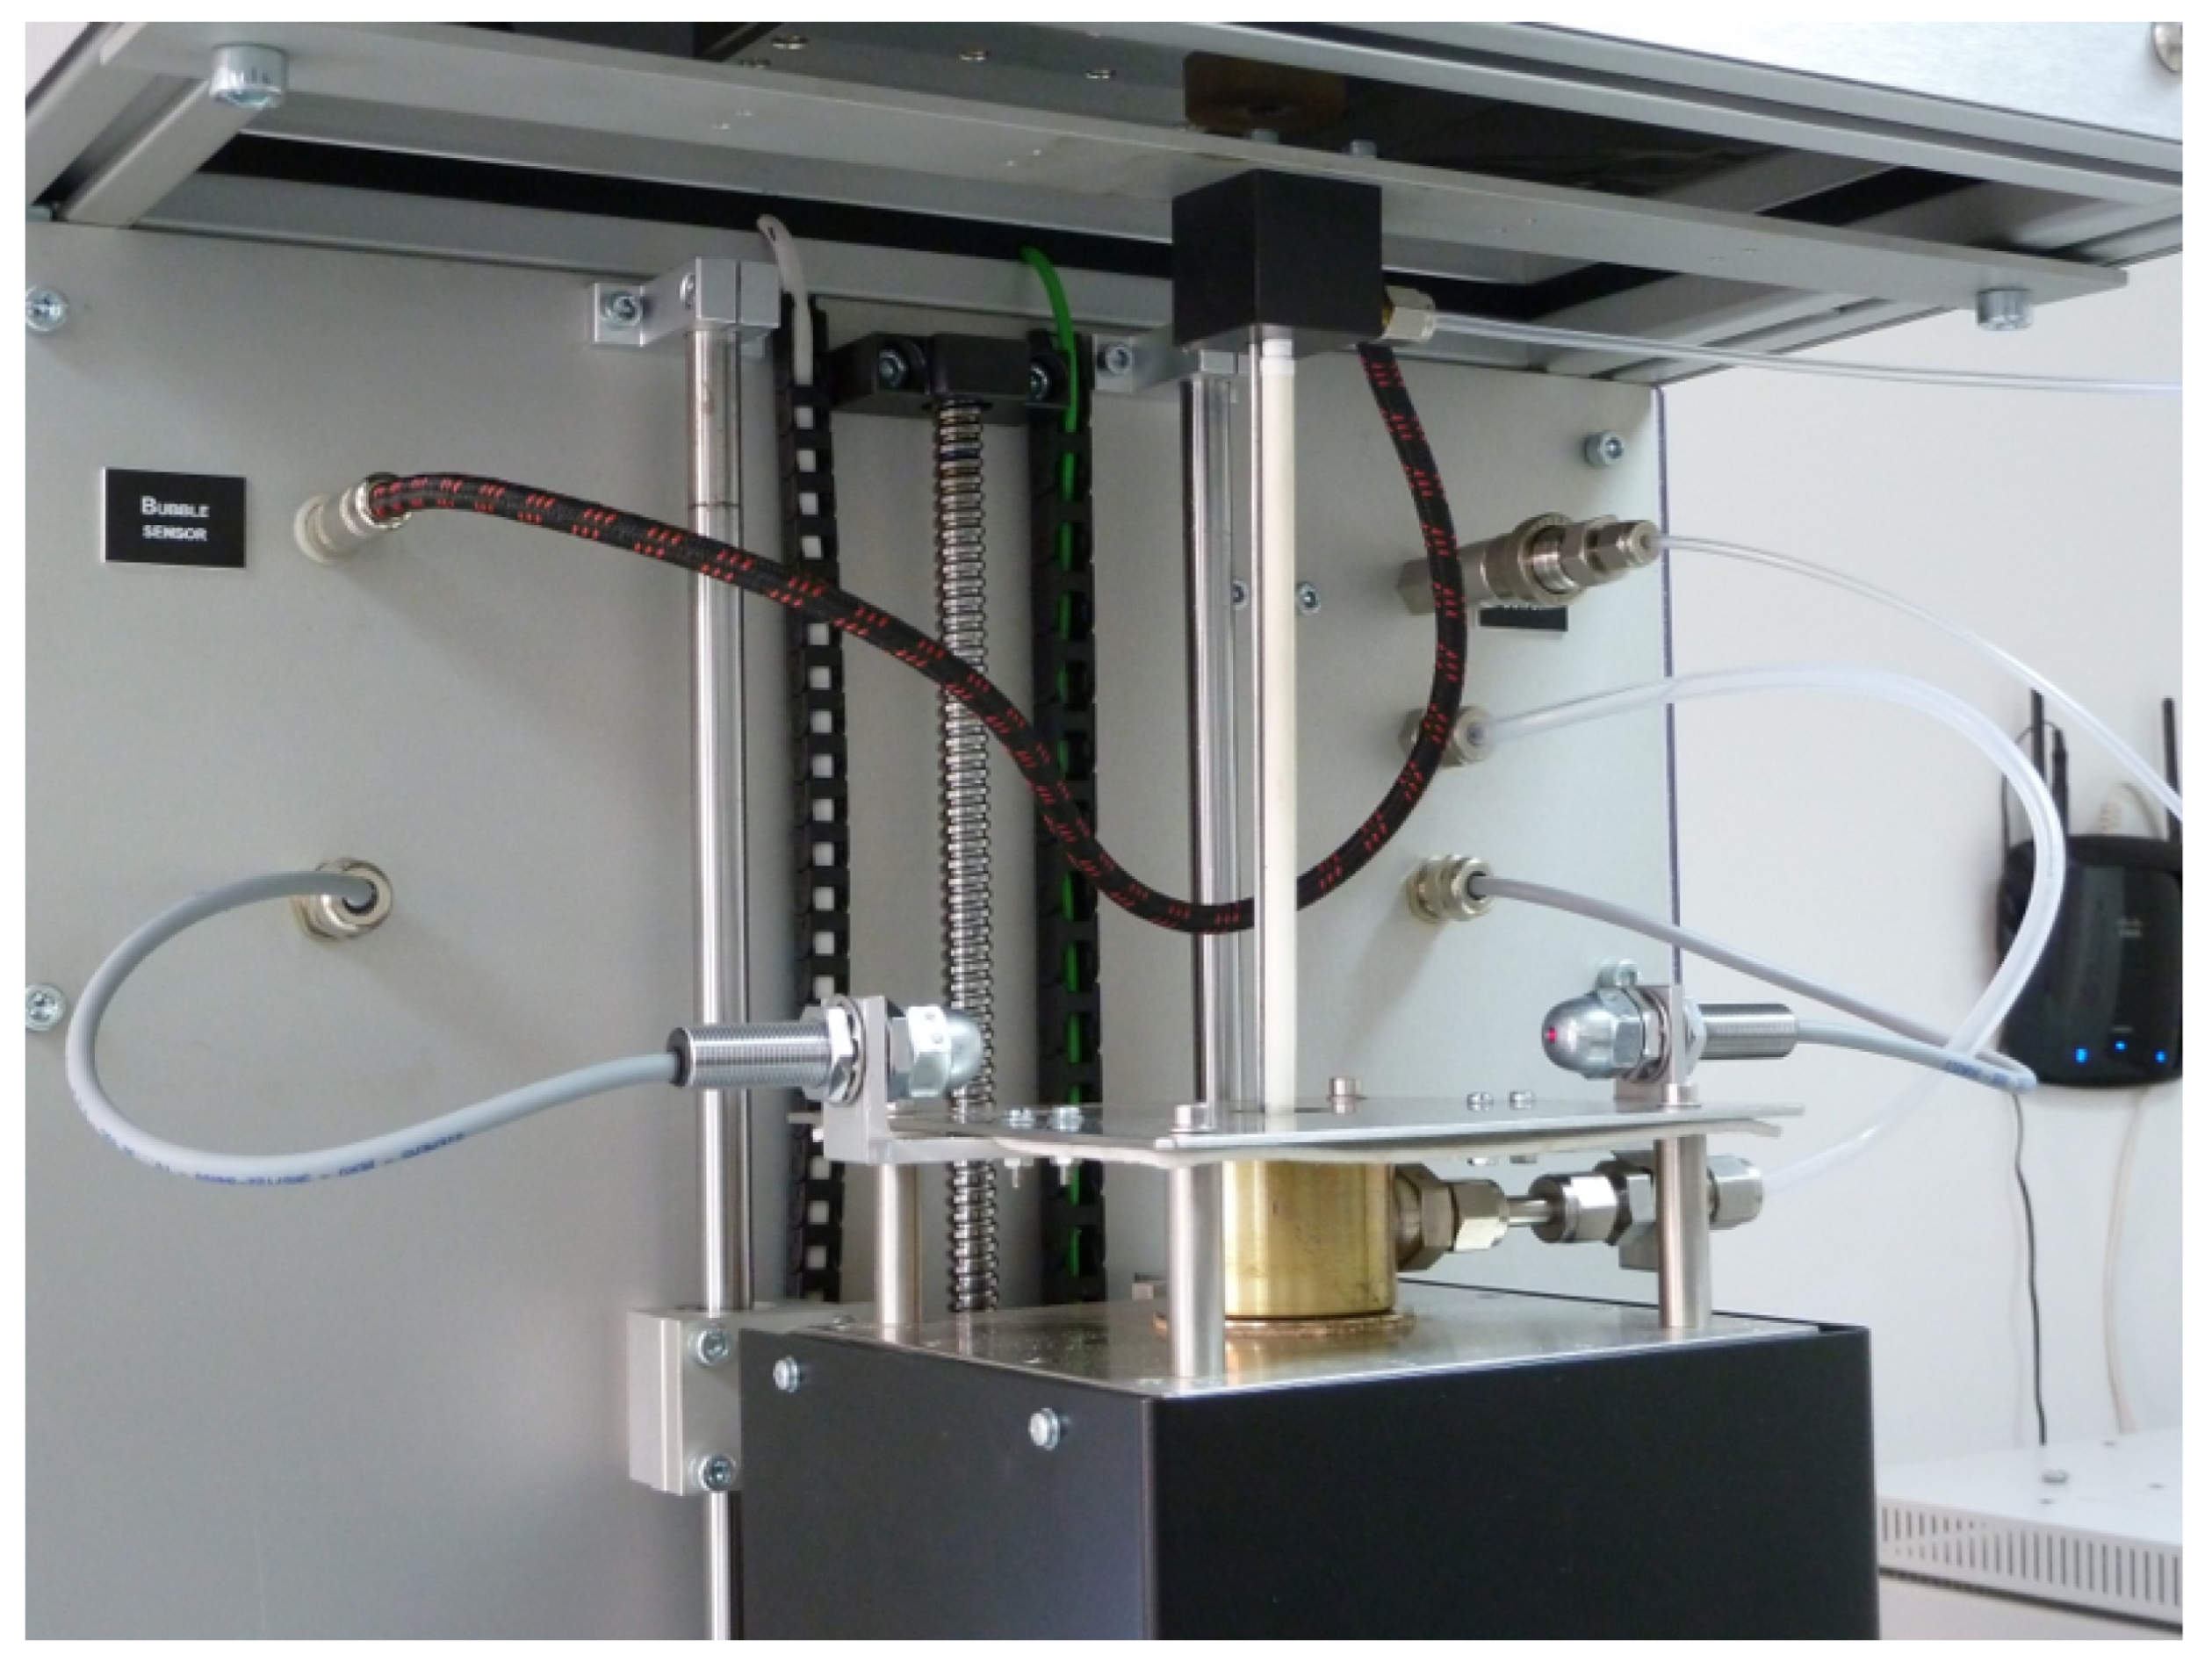
3.3. Module for Measuring the Surface Tension of Liquid Solders: Construction
4. Results of the Experiment
5. Discussion
Author Contributions
Funding
Institutional Review Board Statement
Informed Consent Statement
Data Availability Statement
Conflicts of Interest
References
- Adamson, A.W.; Klerer, J. Physical Chemistry of Surfaces. J. Electrochem. Soc. 1977, 124, 192C. [Google Scholar] [CrossRef]
- Roberts, P. Industrial Brazing Practice; CRC Press: Boca Raton, FL, USA, 2003. [Google Scholar]
- Saad, S.M.; Policova, Z.; Neumann, A.W. Design and accuracy of pendant drop methods for surface tension measurement. Colloids Surf. A Physicochem. Eng. Asp. 2011, 384, 442–452. [Google Scholar] [CrossRef]
- Bąkała, M.; Wojciechowski, R. Integrated Platform for Automatic Determination of Wettability and Surface Tension of High-Temperature Brazes; Technical Report No. N 519 441839; The Polish National Research Committee: Lodz, Poland, 2012. [Google Scholar]
- Cabezas, M.; Bateni, A.; Montanero, J.; Neumann, A. A new drop-shape methodology for surface tension measurement. Appl. Surf. Sci. 2004, 238, 480–484. [Google Scholar] [CrossRef]
- Eustathopoulos, N. Wetting by liquid metals—Application in materials processing: The contribution of the grenoble group. Metals 2015, 5, 350–370. [Google Scholar] [CrossRef]
- Li, Y.; Chen, C.; Yi, R.; Ouyang, Y. Special brazing and soldering. J. Manuf. Process. 2020, 60, 608–635. [Google Scholar] [CrossRef]
- Eustathopoulos, N.; Hodaj, F.; Kozlova, O. The wetting process in brazing. In Advances in Brazing; Woodhead Publishing: Cambridge, UK, 2013; pp. 3–30. [Google Scholar]
- Wu, N.; Dai, J.; Micale, F.J. Dynamic surface tension measurement with a dynamic Wilhelmy plate technique. J. Colloid Interface Sci. 1999, 215, 258–269. [Google Scholar] [CrossRef] [PubMed]
- Mennella, A.; Morrow, N.R. Point-by-point method of determining contact angles from dynamic Wilhelmy plate data for oil/brine/solid systems. J. Colloid Interface Sci. 1995, 172, 48–55. [Google Scholar] [CrossRef]
- Siwiec, G.; Bator, J.; Machulec, B. The surface tension determination through the estimation of the parameters of the sessile drop equation. Arch. Metall. Mater. 2003, 48, 209–221. [Google Scholar]
- Ebnesajjad, S. Surface tension and its measurement. In Handbook of Adhesives and Surface Preparation; William Andrew: Norwich, NY, USA, 2011; pp. 21–30. [Google Scholar]
- Mysels, K.J. Improvements in the maximum-bubble-pressure method of measuring surface tension. Langmuir 1986, 2, 428–432. [Google Scholar] [CrossRef]
- Bendure, R.L. Dynamic surface tension determination with the maximum bubble pressure method. J. Colloid Interface Sci. 1971, 35, 238–248. [Google Scholar] [CrossRef]
- Adamson, A.; Gast, A. Physical Chemistry of Surfaces; Wiley: New York, NY, USA, 1997. [Google Scholar]
- Schwartz, M. Soldering: Understanding the Basics; ASM International: Almere, The Netherlands, 2014. [Google Scholar]
- Cojocaru, R.; Botila, L.N.; Verbiţchi, V.; Ciucă, C. New Ecological Technique for Soldering of Metallic Materials. Adv. Mater. Res. 2014, 1029, 218–223. [Google Scholar] [CrossRef]
- Kang, S.K.; Shih, D.; Fogel, K.; Lauro, P.; Yim, M.J.; Advocate, G.G.; Griffin, M.; Goldsmith, C.; Henderson, D.W.; Gosselin, T.A.; et al. Interfacial reaction studies on lead (Pb)-free solder alloys. IEEE Trans. Electron. Packag. Manuf. 2002, 25, 155–161. [Google Scholar] [CrossRef]


| Parameter | Value |
|---|---|
| Temperature | 250 [°C] |
| Capillary material | Al2O3 |
| Surface activation time | 60 [s] |
| Sample immersion time | 120 [s] |
| Sample Standstill Time After Experiment | 30 [s] |
| Immersion depth | 6 [mm] |
| Capillary diameter | 3 [mm] |
| Crucible Filling | S-Sn97Cu3 |
| Solder Density | 7300 [kg/m3] |
| Parameter | Value |
|---|---|
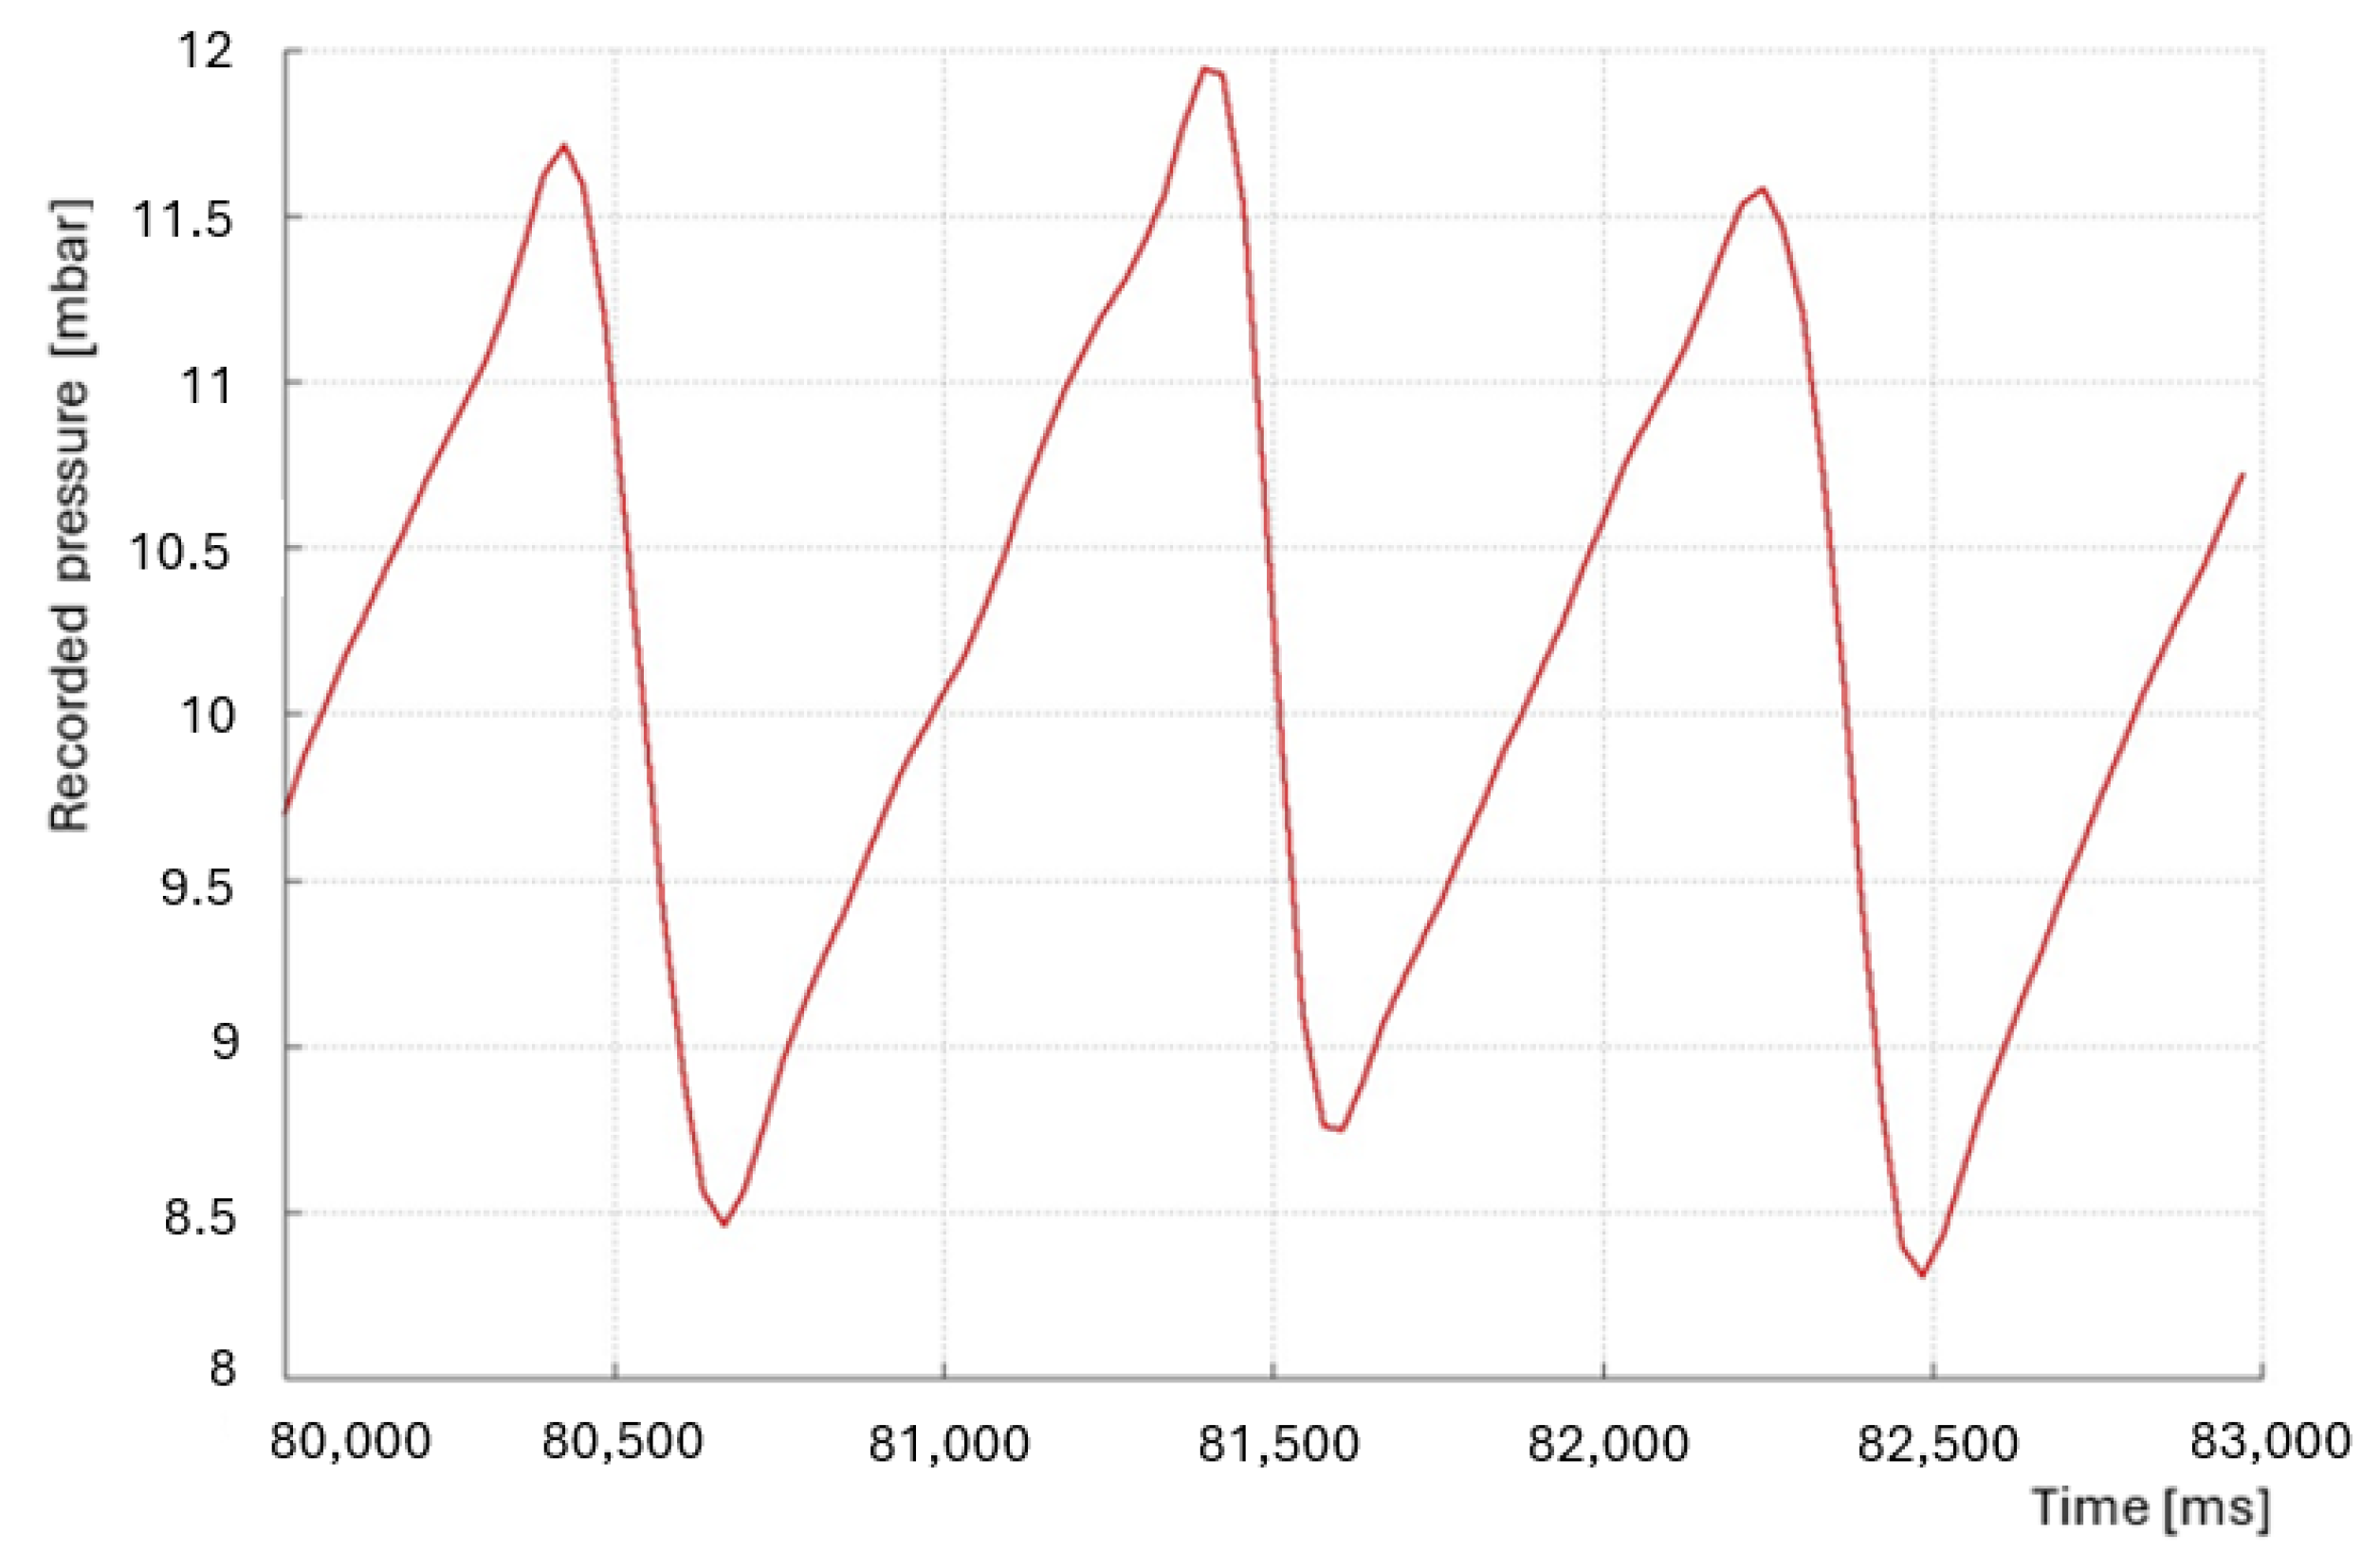
| Maximum Pressure | 11.83 [mbar] |
| Surface tension | 565.55 [mN/m] |
| Corrected surface tension | 458.13 [mN/m] |
Disclaimer/Publisher’s Note: The statements, opinions and data contained in all publications are solely those of the individual author(s) and contributor(s) and not of MDPI and/or the editor(s). MDPI and/or the editor(s) disclaim responsibility for any injury to people or property resulting from any ideas, methods, instructions or products referred to in the content. |
© 2024 by the authors. Licensee MDPI, Basel, Switzerland. This article is an open access article distributed under the terms and conditions of the Creative Commons Attribution (CC BY) license (https://creativecommons.org/licenses/by/4.0/).
Share and Cite
Bąkała, M.; Błaszczyk, P. Integrated Platform for Determining Solderability Parameters: Module for Measuring the Surface Tension of Liquid Solders. Appl. Sci. 2024, 14, 7730. https://doi.org/10.3390/app14177730
Bąkała M, Błaszczyk P. Integrated Platform for Determining Solderability Parameters: Module for Measuring the Surface Tension of Liquid Solders. Applied Sciences. 2024; 14(17):7730. https://doi.org/10.3390/app14177730
Chicago/Turabian StyleBąkała, Marcin, and Piotr Błaszczyk. 2024. "Integrated Platform for Determining Solderability Parameters: Module for Measuring the Surface Tension of Liquid Solders" Applied Sciences 14, no. 17: 7730. https://doi.org/10.3390/app14177730