Article

YOLOv8n–CBAM–EfficientNetV2 Model for Aircraft Wake Recognition

1
College of Electronic Information and Automation, Civil Aviation University of China, Tianjin 300300, China
2
Hong Kong Observatory, Hong Kong 999077, China
*
Author to whom correspondence should be addressed.
Appl. Sci. 2024, 14(17), 7754; https://doi.org/10.3390/app14177754
Submission received: 6 August 2024 / Revised: 29 August 2024 / Accepted: 29 August 2024 / Published: 2 September 2024
(This article belongs to the Section Aerospace Science and Engineering)

Abstract

:
In the study of aircraft wake target detection, as the wake evolves and develops, the detection area of the LiDAR often shows the presence of two distinct vortices, one on each side. Sometimes, only a single wake vortex may be present. This can lead to a reduction in the accuracy of wake detection and an increased likelihood of missed detections, which may have a significant impact on the flight safety. Hence, we propose an algorithm based on the YOLOv8n–CBAM–EfficientNetV2 model for wake detection. The algorithm incorporates the lightweight network of EfficientNetV2 and the Convolutional Block Attention Module (CBAM) based on the YOLOv8n model, which achieves the lightweight improvement in the YOLOv8n algorithm and the improvement in detection accuracy. First, this study classifies the wake vortices in the wake greyscale images obtained at Hong Kong International Airport, based on the Range–Height Indicator (RHI) scanning characteristics of the LiDAR and the symmetry of the wake vortex pairs. The classification is used to detect left and right vortices for more accurate wake detection in wind field images, which thereby improves the precision rate of target detection. Subsequently, experiments are conducted using a YOLOv8n–CBAM–EfficientNetV2 model for aircraft wake detection. Finally, the performance of the YOLOv8n–CBAM–EfficientNetV2 model is analysed. The results show that the algorithm proposed in this study can achieve a 96.35% precision rate, 93.58% recall rate, 95.06% F1-score, and 250 frames/s. The results show that the method proposed in this study can be effectively applied in aircraft wake detection.

1. Introduction

During takeoff and landing, the tail of an aircraft generates a spiral vortex with a symmetrical structure, called the aircraft wake [1]. Aircraft wake can cause potential hazards to following aircraft, limit the takeoff and landing efficiency of airlines, and even cause following aircraft to bump and roll [2,3]. Therefore, to reduce the impact of aircraft wake on the following aircraft, it is necessary to ensure minimum wake intervals and to detect information such as the location, intensity, and duration of the wake in a timely manner so that appropriate action can be taken. The accurate identification of the wake is key to setting appropriate minimum wake interval standards to ensure that neighbouring aircraft can maintain a sufficiently safe distance to avoid the effects of the wake and to ensure flight stability and safety. Moreover, as the flight density rises steadily, particularly at busy airports and along congested routes, the study of aircraft wakes has significant implications for flight safety and efficiency.
Currently, LiDAR is the main means of aircraft wake detection [4]. LiDAR can detect the radial velocity information of the atmosphere in the wind field and obtain the vortex core position, vortex circulation, and other parameters of the wake through the radial velocity and other information [5]. In recent years, some progress has been made in wake detection methods based on radial velocity. In 2015, Smalikho used radial velocity information collected by LiDAR and derived wake parameters through line-of-sight velocity regression, but the error was large [6]. In 2017, Yoshikawa proposed a LiDAR-based Range–Height Indicator (RHI) observation method to invert parameters such as the vortex core position and circulation [7]. In 2019, Shilong Xu proposed an aircraft wake identification algorithm by extracting radial velocity spectral features [8]. In 2020, Jianbing Li proposed a wake vortex core localization algorithm based on path integration, but it is computationally complex and difficult to meet real-time requirements [9]. In 2021, Xiaoye Wang proposed a fast wake identification method based on CDL spectral width and radial wind speed, but the identification efficiency still needs improvement [10].
Machine learning and deep learning have been used in the field of aircraft wake recognitions. In 2020, Weijun proposed a k-nearest neighbour (KNN)-based recognition method [11], but the recognition accuracy needs to be improved. In 2021, Xuan Wang proposed an aircraft wake vortex recognition method based on support vector machines (SVMs) [12], and they adopted a single velocity extreme value feature extraction method that resulted in the local information of the wake vortex being filtered out, thereby resulting in the model displaying low recognition accuracy on real measurement data. With the development of deep learning, Weijun Pan classified a wake velocity cloud map based on the AlexNet network to achieve the identification of wakes in 2019, and its accuracy reached 91.30% [13]. However, the structure of the AlexNet network is complex, the number of model parameters is large, and the occupancy rate of hardware resources is high. These factors are not conducive to the real-time monitoring of wakes in airports. In 2022, Weijun Pan proposed a convolutional neural network model for the rapid recognition of aircraft wakes, which was developed by improving the GoogleNet network [14]. In 2023, we proposed a method for aircraft wake recognition based on an improved ParNet convolutional neural network. The introduction of a depth-separable convolution and attention mechanism module resulted in an enhanced wake recognition accuracy. However, the real-time performance of the algorithm remains a limitation [15]. Currently, research in the field of wake detection primarily focuses on the accuracy and real-time performance of the detection algorithm, with minimal attention given to the location of the wake.
The YOLOv8n–CBAM–EfficientNetV2 model proposed in this paper is based on ‘You Only Look Once’ (YOLO) [16,17,18,19,20], incorporating the submodules from the EfficientNetV2 [21] model and the Convolutional Block Attention Module (CBAM) [22]. It achieves the high-precision and real-time recognition of aircraft wake vortices.

2. LiDAR RHI Scanning Detection

The characteristics of wake vortices generated by an aircraft, including the intensity, shape, existence time, and location, can vary, depending on the specific aircraft type, background winds, and turbulence [23]. The spiral wake vortex structure may persist over the runway for some time and affect other aircraft, especially during takeoff or landing near the runway. First, the characteristics of the wake vortex are affected by the maximum weight and wingspan length of the aircraft at takeoff, and the strength and duration of the wake vortex will be significantly different for light aircraft compared with heavy aircraft. For example, the wake vortices produced by large aircraft such as Boeing 747s are stronger and last longer, while the wake vortices produced by smaller aircraft are relatively weaker. Secondly, weather conditions also have an important effect on the characteristics of wake vortices. For example, in strong wind conditions, wake vortices may dissipate quickly, while in stable weather conditions, such as no wind or inversion layers, wake vortices may remain suspended in the air for a longer period of time, increasing potential flight safety risks. In this context, LiDAR is a valuable tool for wind field and meteorological detection, as it offers high accuracy, high spatial resolution, and long-distance measurements [24].
The Hong Kong International Airport is one of the largest airports in the world in terms of passenger traffic. The Leosphere Windcube200s LiDAR [25,26,27,28] was employed for detection over the runway. Table 1 shows the main parameters. The LiDAR was situated at a vertical distance of approximately 1400 m from the south runway of the Hong Kong International Airport. The RHI scanning method was employed to detect the wake vortices generated by departing aircraft. Figure 1 illustrates the distribution of LiDAR locations within the airport. During the RHI scanning, it is necessary to fix the azimuth angle of the LiDAR. The due north direction, that is, 0°, was set as the reference direction. The adjusted azimuth angle was 340°. The pitch angle of the LiDAR was continuously adjusted to scan the runway in both the vertical and horizontal planes, according to the pre-set angle range, and the LiDAR one-dimensional echo signal was then received. Figure 2 illustrates the RHI scanning process. The collected one-dimensional echo signals were processed to generate two-dimensional RHI scan images, which were used as the dataset for aircraft wake recognition. The processing details are described in Section 4.1. The dataset used in the aircraft wake identification is derived from 2D wind fields scanned by RHI from the Leosphere Windcube200s LiDAR at Hong Kong International Airport between 3 and 5 February 2019.

3. The Proposed Method

The YOLO model has gained considerable popularity in the field of target detection in recent years. The core concept of the YOLO model is to transform the target detection problem into a regression problem, thereby enabling the localisation and classification of the target in the image through a single forward propagation [16,17,18,19,20,29]. YOLOv8 represents a recent iteration of the YOLO model. It exhibits enhanced detection accuracy and a more rapid inference speed, which contributes to its extensive deployment in a diverse array of target detection applications, including automated driving, security monitoring, and medical image analysis.
YOLOv8n represents a lightweight variant of the YOLOv8 model. It offers a rapid recognition speed, high detection accuracy, and minimal memory occupation. Moreover, it can be deployed on hardware platforms, such as central processing units (CPUs) and graphics processing units (GPUs). Nevertheless, experimental findings have revealed that there are certain limitations associated with the deployment of YOLOv8n for aircraft wake detection purposes. For example, the dissipation of the wake renders it challenging for the model to capture the characteristics of the wake. The YOLOv8n model may exhibit false or missed detections in complex backgrounds.
Therefore, based on the YOLOv8n model, we proposed the YOLOv8n–CBAM–EfficientNetV2 model for aircraft wake recognition. The specific improvements include the introduction of the MBConv module and the Fused-MBConv module (referred to as the EfficientNetV2 submodule in this study) in the EfficientNetV2 model as well as the CBAM. Figure 3 shows the structure of the YOLOv8n model. The backbone part constitutes the backbone network of YOLOv8n, which is primarily responsible for the extraction of features from the input image. In the backbone network, the stem module can realise the initial feature extraction of the input image. The Conv indicates the convolution module. The C2f represents the feature extraction module, which is capable of processing information extracted in the convolutional layer. SPPF, Spatial Pyramid Pooling-Fast, is a multiscale information capture module. The Concat module is able to concatenate the output after the jump connection with the output of the convolutional module. The neck part represents the neck network, which is capable of further processing and fusing the features extracted by the backbone. The Concat module can concatenate the output after the jump connection with the output of the convolutional module. The linked feature information is then output to the next module. The head part, which is also called the detecting head, is responsible for classifying and locating the target according to the features passed by the neck. The detecting head outputs the category probability and bounding frame coordinates for each detection frame.

3.1. YOLOv8n–CBAM–EfficientNetV2 Modules

3.1.1. EfficientNetV2 Submodule

EfficientNetV2 is an improved network based on EfficientNetV1, which optimises the performance of the network in terms of parameters such as depth and width. EfficientNetV2 is capable of adaptively balancing the depth and width of the network as well as the resolution of the input image, which effectively reduces the number of parameters and the complexity of the model training, thereby markedly accelerating the training speed of the model [21].
The EfficientNetV2 network incorporates a number of Fused-MBConv and MBConv modules. The Fused-MBConv module is frequently employed in the shallow layers of the network, owing to its high efficiency. In contrast, the MBConv module is better suited to the deeper layers, owing to its depth and width tunability. Figure 4 shows the specific structure of these two modules. The MBConv module comprises two 1 × 1 convolutions, one 3 × 3 depth-separable convolution, and one SE attention module, as illustrated in Figure 4a. The Fused-MBConv module unifies the originally independent 1 × 1 point-by-point convolution and 3 × 3 depth convolution into a single 3 × 3 convolutional structure, as illustrated in Figure 4b. This fusion design reduces the computational burden of the model. The combination of Fused-MBConv and MBConv in EfficientNetV2 allows for the exploitation of the high efficiency of Fused-MBConv and the tunability of MBConv, thereby achieving a real-time performance improvement in the wake detection process.

3.1.2. CBAM

The CBAM represents a module designed to enhance the performance of convolutional neural networks. It improves the perceptual ability of the model by introducing channel attention and spatial attention in the model to improve the performance without increasing the complexity of the network. The structure of the CBAM is illustrated in Figure 5, which contains the channel attention and spatial attention submodules.
In the channel attention submodule, the input feature map F was subjected to global maximum pooling and global average pooling, thereby resulting in the generation of two one-dimensional feature maps. The two feature maps were then passed through a fully connected neural network MLP (Multi-Layer Perceptron) and summed to generate the channel attention feature MC(F) through a sigmoid activation operation. This value, MC, was then used to describe the channel attention. Finally, the channel attention feature map was multiplied by the input feature map F, thereby generating the channel attention feature map F′.
The spatial attention submodule, denoted by MS, accepts the feature map F′ as the input feature map. Two feature maps with channel 1 were obtained by applying the average pooling and maximum pooling operations to the feature maps, which were then spliced together. Subsequently, a spatial attention feature, denoted by MS(F′), was generated by a 7 × 7 convolution and sigmoid activation, with the objective of characterising the spatial attention. Ultimately, this MS(F″) was multiplied with the input F′ of this spatial attention submodule, thereby resulting in the spatial attention feature map F″.

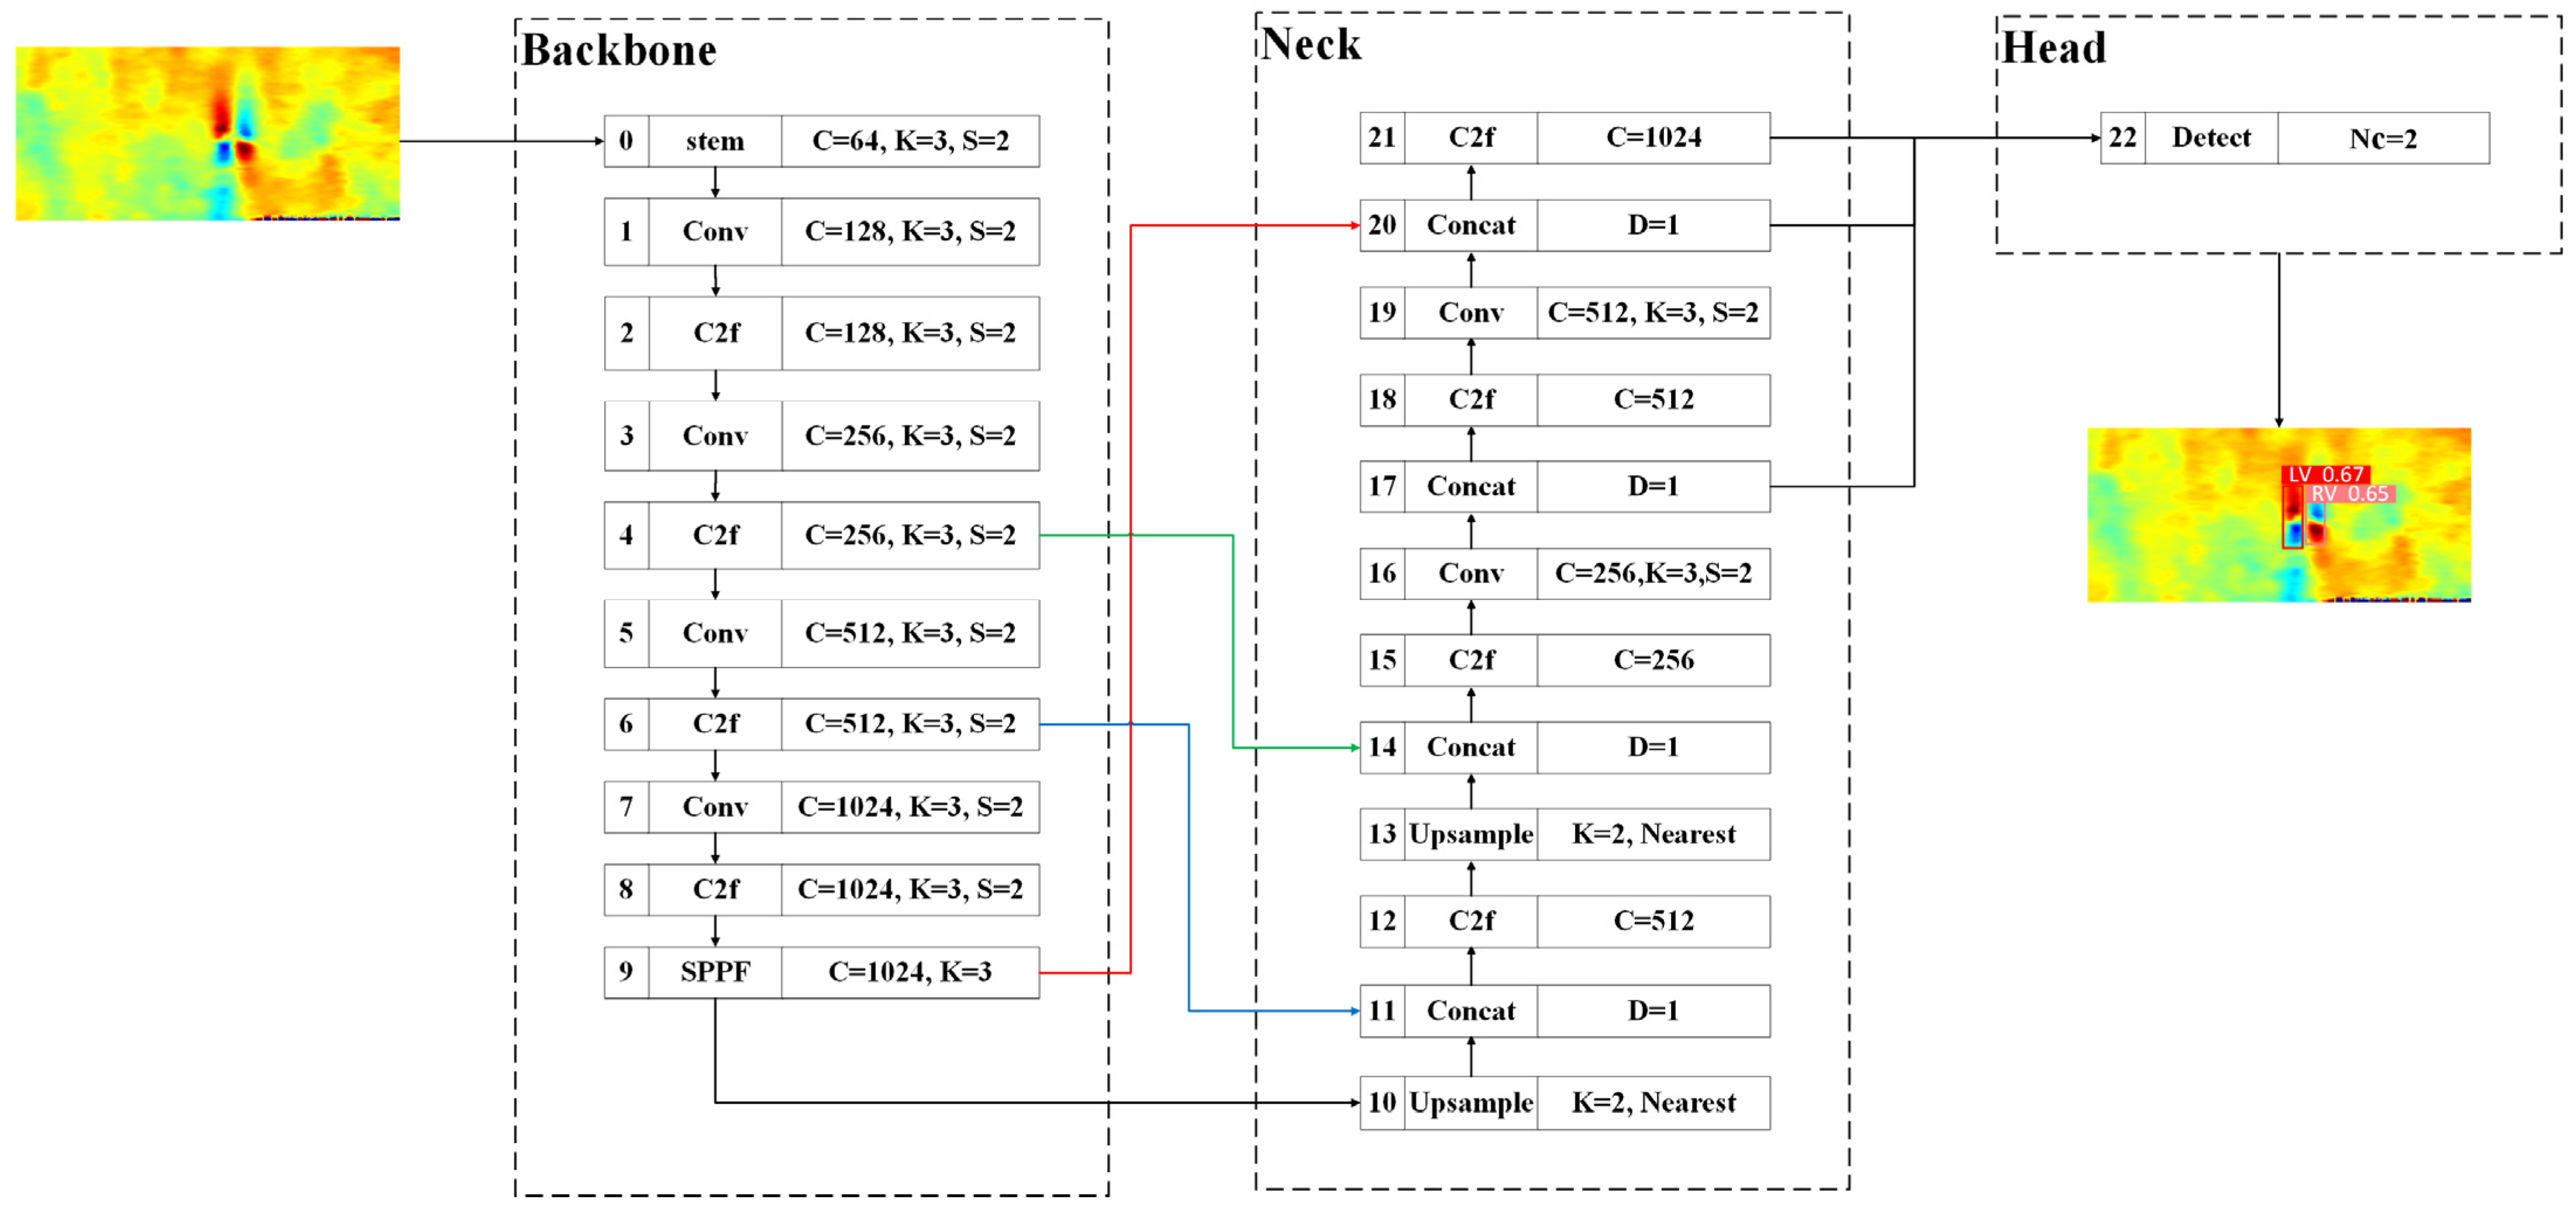
3.2. YOLOv8n–CBAM–EfficientNetV2 Network Design

The YOLOv8n–CBAM–EfficientNetV2 model comprises three principal components, the backbone, neck, and head, as illustrated in Figure 6. Most of the improvements are concentrated on the backbone and neck networks, which are highlighted in green and yellow, respectively. Further details regarding the specific improvements can be found in Section 3.2.1 and Section 3.2.2.

3.2.1. Backbone Network

In the backbone network of the YOLOv8n–CBAM–EfficientNetV2 model, the Conv and C2f module have been substituted with the Fused-MBConv and MBConv modules present in the EfficientNetV2 model. However, the stem module in the input layer and the SPPF module in the output layer have been retained.
The Fused-MBConv module has been incorporated into the shallow network to improve the efficiency of the YOLOv8n model. This was carried out primarily to optimise the model’s feature extraction. Moreover, the MBConv module has been integrated into the deeper portion of the network, thereby allowing the model to adaptively balance the depth and width of the network in addition to the resolution of the input image. SPPF is a feature extraction module. The extraction of multiscale feature information is achieved through the application of pooling kernels of varying scales (e.g., multiple pooling operations in series or parallel) on the feature map. Subsequently, the feature maps are spliced together in the channel dimension to form a feature map with richer feature information, which is then passed to the neck network for further feature processing.

3.2.2. Neck Network and Head Network

The neck network of the YOLOv8n–CBAM–EfficientNetV2 model is primarily comprised of a convolutional layer, an upsampling layer, a connection layer, and a module derived from the CBAM. The Conv module is employed for the extraction of wake features and the reduction in dimensionality. The Upsample module is utilised for the scaling of low-resolution feature maps to a size commensurate with that of the high-resolution feature maps, i.e., to recover the spatial resolution of the feature map. The Concat module enables the feature fusion of feature maps with different resolutions or at different layers, thereby providing richer information to the subsequent network layers. The C2f module is a residual block that enables the network to learn the mapping relationship between inputs and outputs by introducing residual connections, thereby optimising the training process of the network. Furthermore, the incorporation of the CBAM module serves to augment the feature extraction capabilities of the YOLOv8n–CBAM–EfficientNetV2 model.
The detect module in the head network is primarily responsible for classifying the targets present in the input image, locating the detection frames, and calculating the confidence level score. To generate the final detection results, a non-maximal value suppression algorithm was employed to eliminate superfluous detection results and select the detection frame with the highest confidence level score as the output result. This was achieved by screening multiple overlapping detection frames. Ultimately, the detect module can extract and generate predicted frames based on the information obtained from the neck network, including the target location, category, and confidence level.

4. Aircraft Wake Recognition

4.1. Aircraft Wake Image Dataset

The one-dimensional echo data collected by the LiDAR are preprocessed as follows. First, the radial distance of the LiDAR scan is employed as the horizontal coordinate, with the radar elevation angle serving as the vertical coordinate. Subsequently, the radial velocity data of the discrete points within the wind field data are mapped into the coordinate system through the utilisation of the bicubic interpolation algorithm [30]. Finally, the wind velocity values of each interpolated point are mapped into the coordinate system through the application of the jet colour mapping scheme, thereby facilitating the generation of velocity cloud maps for the two-dimensional wind field cross-section, as illustrated in Figure 7. Moreover, Figure 7 shows a sample of the detected wake data at 4:35:31 on 5 February 2019. The horizontal coordinate represents the radial distance detected by the LiDAR, whereas the vertical coordinate depicts the pitch angle of the LiDAR. The symmetrical structure depicted in the figure represents the aircraft wake. In Figure 7 the red color denotes the large value of the wind speed, while the blue color denotes the small value of the speed. Positive speed means the wind speed has the same direction with the laser beam, while negative speed indicates the wind speed has the opposite direction.
The dataset employed in this experiment for wake detection comprised samples of wake data detected at the Hong Kong International Airport between 3 and 5 February 2019. A total of 5320 LiDAR scanned images were obtained for the experiment, comprising 4000 samples with wake and 1000 samples without wake. In the course of the image screening process, 152 images displaying burr effects and 168 images entirely obscured by background wind were identified and excluded. In this experiment, the dataset was divided into a training set and validation set by randomly assigning 3000 images of wake and 2000 images of no wake in a ratio of 7:3. Figure 8a shows the positive samples, which exhibit the presence of wake, whereas Figure 8b illustrates the negative samples, which lack wake. The horizontal coordinate represents the distance detected by the LiDAR, which ranges from 1000 to 1780 m, whereas the vertical coordinate represents the elevation angle of the emitted laser of the LiDAR, which ranges from −0.125° to 5°.
Prior to the commencement of the wake detection experiment, it is necessary to preprocess the dataset images. This involves adjusting the resolution of each sample in the wake image dataset to 316 × 144 pixels and then performing grayscale processing on each sample. Figure 9 illustrates the latter. Figure 10 presents the final generated samples of the dataset. Figure 10a–d illustrate the wake samples under four distinct scenarios: upwind, clear, downwind, and left–right vortex separation, respectively.
Following the completion of the image processing, it is essential to create labels for the wakes within the images. This is achieved through the utilisation of LabelIMG, which is a target label creation tool that allows for the annotation of each wake sample with wake features. Thus, LabelIMG generates the requisite sample datasets of wakes with labels. To facilitate the convenient representation of the left and right vortices of the wake, the labels LV and RV were employed to distinguish between the left vortex and right vortex, respectively. Figure 11 presents the labelled dataset samples.

4.2. Experimental Environment

This experiment is based on the PyTorch deep learning framework, which was written in the Python 3.8.18 programming language. Additionally, an aircraft wake detection framework based on the YOLOv8n–CBAM–EfficientNetV2 model network was constructed. The operating system is Windows 11, the CUDA version is 11.7, the Torch version is 1.13.1, and the hardware equipment used is an Intel(R) Core(TM) i5-8300H CPU @ 2.3GHz processor and NVIDIA GEFORCE GTX 1050Ti graphics card with 4 GB video memory.
The hyperparameter settings employed during the training process are presented in Table 2. To circumvent the issue of inadequate weight decay during training, the stochastic gradient descent (AdamW) optimisation algorithm was employed in all experimental models presented in this study. To save computer resources, only the optimal epoch training weights and training weights from the final epoch were retained during the training process.

4.3. Loss Function

Regression loss is a metric that is used to quantify the discrepancy between the predicted outcomes of a regression model and the actual observations. To enhance the performance of the target detection model in terms of category imbalance and target localisation, as well as to improve the detection of the wake, a combination of the distribution focal loss (DFL) and complete intersection over union loss (CIoU Loss) was employed in the experiments. The DFL represents a loss function that addresses the issue of category imbalance in the context of target detection. The introduction of the focal loss into the DFL framework results in a greater focus on samples that are more challenging to classify, thereby reducing the influence of samples that are more readily categorizable on the loss function. The CIoU loss represents a loss function for target localisation. In comparison with the conventional IoU loss, the CIoU loss considers the complete intersection region between the predicted and actual frames, thereby providing a more precise assessment of the similarity between them. By minimising the CIoU loss, the target detection model can more effectively learn the location and shape of a target, thereby improving the accuracy of target localisation. The expressions of the DFL and CIoU loss functions are shown in Equations (1) and (2), respectively:
L D F = i P o s 1 P i γ log P i ,
where Pi denotes the similarity between the predicted and actual frames and γ is a moderating factor that is used to balance the weights of easily predictable and difficult-to-predict targets;
L C I o U = 1 I o U + ρ 2 b , b g t c 2 + α υ ,
I o U = Inter section U n i o n ,
where IoU stands for intersection over union. As illustrated in Equation (3), the term “Intersection” refers to the area of intersection between the predicted and actual frames, whereas “Union” denotes the area of concurrency between them. In addition, ρ(b, bgt) denotes the Euclidean distance between the centroids of the two bounding frames, whereas c denotes the Euclidean distance between the diagonals of the two bounding frames, α is a balancing factor that serves to balance the centroid distance and the weight of the diagonal distance, and υ is a penalty item that assesses the discrepancy in size, location, and shape between the predicted and actual frames. When the discrepancy is significant, the penalty item of the CIoU loss results in an increase in the value of the loss function, which prompts the model to devote greater attention to the target frames with notable differences. This encourages the model to develop a more precise prediction of the target frame, thereby enhancing its overall performance.
Considering the aforementioned evidence, the overall regression loss of the model can be calculated as follows:
L r e g = λ d f L D F + λ C I o U L C I o U ,
where λdf and λCIoU are the weighting coefficients used to balance the DFL and CIoU loss, respectively.

4.4. Metrics of Proposed Method for Wake Recognition

To assess the efficacy of the YOLOv8n–CBAM–EfficientNetV2 model proposed in this study for wake detection, the precision rate, recall rate, and F1-score have been selected as the evaluation metrics for the experimental outcomes. The underlying calculation formulas are presented in Equations (5), (6) and (7), respectively:
P P r e c i s i o n = T P T P + F P × 100 % ,
P R e c a l l = T P T P + F N × 100 % ,
P F 1 s c o r e = 2 × P P r e c i s i o n × P R e c a l l P P r e c i s i o n + P R e c a l l
where wake samples are designated as positive samples and samples devoid of wake are classified as negative samples. In addition, TP represents the number of samples identified as positive with a positive truth value, FP denotes the number of samples identified as positive with a negative truth value, FN is the number of samples identified as negative with a positive truth value, and TN is the number of samples identified as negative with a negative truth value. Furthermore, the precision rate is associated with the false alarm rate of the wake, which decreases as the precision rate increases. The recall rate is linked to the missed detection rate of the wake, which decreases as the recall rate increases. The F1-score is a harmonic average of precision and recall used to comprehensively evaluate the performance of the model.
Additionally, the experiments employed giga floating-point operations per second (GFLOPs) and frames per second (FPSs) as evaluation metrics for the model performance. GFLOPs measure the computational complexity of a model. A higher GFLOP value indicates that the model requires greater computational resources, which may result in a reduced rate of target detection. FPS is a metric that is used to assess the real-time performance of a model, and it denotes the number of image frames processed per second.

4.5. Ablation Experiment

A total of four models were compared in terms of their detection performance, namely, YOLOv8n, YOLOv8n-CBAM, YOLOv8n–EfficientNetV2, and YOLOv8n–CBAM–EfficientNetV2. The comparison was made based on the precision rate, recall rate, F1-score, FPS, GFLOPs, and number of model parameters, as shown in Table 3. Figure 12a,b illustrate the comparison of the precision rate and recall rate curves for each model, respectively. Figure 12 shows that the YOLOv8n–CBAM–EfficientNetV2 model exhibits the highest precision rate on the validation set, whereas the recall rate remains relatively consistent. This evidence substantiates the feasibility of the proposed improvement to the YOLOv8n model.
Figure 13 shows the iteration of the loss function during the experiment. As the number of iterations increases, the loss functions of the training set and validation set demonstrate a consistent convergence, indicating the absence of overfitting or underfitting. These results demonstrate that the model exhibits robust generalisation capabilities and is capable of accurately detecting previously unseen data.
According to Table 3, by comparing the YOLOv8n with the YOLOv8n-CBAM model and the YOLOv8n–EfficientNetV2 model with the YOLOv8n–CBAM–EfficientNetV2 model, the introduction of the CBAM can improve the precision rate of the model to a certain extent. However, this approach may also result in an increase in the computational burden. A comparison of the YOLOv8n and YOLOv8n–EfficientNetV2 models, along with their CBAM and CBAM–EfficientNetV2 variants (as detailed in this study), reveals that while the precision rate is enhanced, the model parameters and computational load are significantly reduced. This not only accelerates the convergence process but also offers a lightweight enhancement to the YOLOv8n model. Concurrently, the FPS value is enhanced from 161 to 250, thereby markedly improving the real-time performance of the model.
Considering the precision rate and real-time performance, the YOLOv8n–CBAM–EfficientNetV2 model proposed in this study yields the most optimal detection results, exhibiting a 2.72% increase in the precision rate, a 55.28% increase in the FPS value, and a 40.78% reduction in the number of model parameters, compared with the YOLOv8n model.
The findings substantiate that the YOLOv8n–CBAM–EfficientNetV2 model exhibits enhanced precision and real-time functionality in wake detection. The CBAM attention mechanism incorporated into the YOLOv8n–CBAM–EfficientNetV2 model improves the accuracy of the model’s detection capabilities. Furthermore, the incorporation of the MBConv and Fused-MBConv modules into the EfficientNetV2 network results in a lightweight improvement to the YOLOv8n model.

4.6. Wake Recognition Results

To more accurately reflect the impact of the YOLOv8n–CBAM–EfficientNetV2 model, four wake images with disparate background conditions were randomly selected for this experiment. The objective was to compare the influences of different models on wake detection. The resulting images are presented in Figure 14 for a visual analysis. Figure 14a–d illustrate the four sample images of the input. Figure 14a–c depict the wake samples generated by an aircraft in upwind, clear, and downwind conditions, respectively. Figure 14d demonstrates the separation of the left and right vortex structures subsequent to the wake spreading over a period of time. The LV and RV in the output image represent the names of the left and right vortex categories of the wake, respectively. The numbers indicate the confidence level associated with the model’s prediction of the target’s category. A higher confidence level indicates a greater degree of certainty in the model’s prediction.
The results of the detection models demonstrate that both the EfficientNetV2 network and CBAM have enhanced detection capabilities. However, the YOLOv8n–CBAM–EfficientNetV2 model exhibits a more pronounced improvement in detection effectiveness, compared with the YOLOv8n model.

4.7. Performance of Different Recognition Models

To provide a more accurate demonstration of the benefits of the YOLOv8n–CBAM–EfficientNetV2 model, this study undertakes a comparative analysis of the YOLOv8n–CBAM–EfficientNetV2 model with other machine learning and target detection algorithms, including KNN [11], SVM [12], ParNet [15], SSD, YOLOv5-lite, and YOLOv8n. Table 4 presents the results of the comparative experiments. SVM and KNN are traditional machine learning models, with evaluation criteria based on the precision rate, recall rate, and F1-score. The GFLOPs and number of parameters are not particularly informative when comparing these models.
Table 4 shows that the YOLOv8n–CBAM–EfficientNetV2 model exhibits the highest precision rate, reaching 96.59%, in comparison with SVM and KNN. This notable improvement enables the accurate detection of aircraft wake. Furthermore, when benchmarked against ParNet, SSD, and the conventional YOLO algorithm, the YOLOv8n–CBAM–EfficientNetV2 model not only demonstrates an elevated precision rate but also exhibits the lowest GFLOPs and the minimal number of parameters, which helps to reduce the hardware performance requirements of the model and improve the real-time performance of wake detection. In summary, the YOLOv8n–CBAM–EfficientNetV2 model demonstrates satisfactory performance in terms of the precision rate, computational complexity, and real-time detection. This not only enhances the accuracy of wake detection but also reduces the computational cost and improves real-time detection performance.

5. Conclusions

This study proposes an aircraft wake detection method based on YOLOv8n–CBAM–EfficientNetV2. The left and right wake vortices in the LiDAR RHI scanning image were labelled to generate the wake dataset. The CBAM was introduced into the YOLOv8n–CBAM–EfficientNetV2 model and enhanced the model’s capacity to extract spatial features, thereby improving its detection accuracy. The incorporation of the EfficientNetV2 network submodule (MBConv and Fused-MBConv modules) resulted in a notable reduction in the model’s complexity, a decrease in the number of model parameters, and an enhancement in the model’s real-time performance. The results of the ablation experiment demonstrate that the incorporation of the CBAM and EfficientNetV2 module markedly improves the detection performance of the model. The YOLOv8n–CBAM–EfficientNetV2 model demonstrates a precision rate of 96.59%, representing a 2.72% improvement; a 40.78% reduction in the number of model parameters; and a 55.28% increase in frames per second (FPSs), compared with the YOLOv8n algorithm. Additional comparative experimental results demonstrate that the YOLOv8n–CBAM–EfficientNetV2 model exhibits optimal performance in all aspects of aircraft wake detection when compared with conventional machine learning algorithms and other target detection algorithms. This is evidenced by its superior recognition effectiveness and the reduced hardware and software costs required, which substantiates the viability of utilising a deep learning model for wake detection. Furthermore, the lightweight nature of the model allows for its deployment on embedded devices.
The limited dataset is not representative of the wake conditions that may occur in certain extreme environments. While the probability of wake over the runway in extremely adverse weather conditions is low, such conditions may have a significant impact on aircraft takeoffs and landings at airports. Therefore, this phenomenon warrants further investigation. Meanwhile, as the wake develops and dissipates, the left and right vortices become separated, and the vortex circulation declines. This process presents a significant challenge to the detection capability of the model, potentially leading to missed detections. For this reason, this research group will conduct further simulations of the wake field in extreme weather conditions and its subsequent decay to improve the wake detection performance of the model. Furthermore, the set operational mode of the LiDAR influences the diversity of the data collected. Additionally, the range of sampling angles, distance from the runway, and location of the LiDAR all impact the distribution of the collected wake within the entire wind field. Therefore, it is possible to consider the joint detection of wake by multiple LiDARs, which would provide a more comprehensive picture of the airport environment to air traffic controllers.

Author Contributions

Conceptualisation, Y.M.; methodology, Y.M. and X.T.; software, X.T. and Y.S.; supervision, P.-W.C. All authors have read and agreed to the published version of the manuscript.

Funding

This work was funded by National Natural Science Foundation of China, grant number U1833111.

Institutional Review Board Statement

Not applicable.

Informed Consent Statement

Not applicable.

Data Availability Statement

The data used to support the findings of the study are available from the corresponding author upon request.

Conflicts of Interest

The authors declare no conflicts of interest.

References

  1. Hallock, J.N.; Holzäpfel, F. A review of recent wake vortex research for increasing airport capacity. Prog. Aerosp. Sci. 2018, 98, 27–36. [Google Scholar] [CrossRef]
  2. Li, J.; Gao, H.; Wang, T.; Wang, X. A survey of the scattering characteristics and detection of aircraft wake vortices. J. Radars 2017, 6, 653–672. [Google Scholar]
  3. Kaden, A.; Luckner, R. Impact of wake vortex deformation on aircraft encounter hazard. J. Aircr. 2019, 56, 800–811. [Google Scholar] [CrossRef]
  4. Dolfi-Bouteyre, A.; Canat, G.; Valla, M.; Augere, B.; Besson, C.; Goular, D.; Lombard, L.; Cariou, J.P.; Durecu, A.; Fleury, D.; et al. Pulsed 1.5-µm LIDAR for axial aircraft wake vortex detection based on high-brightness large-core fiber amplifier. IEEE J. Sel. Top. Quantum Electron. 2009, 15, 441–450. [Google Scholar] [CrossRef]
  5. Shen, C.; Gao, H.; Wang, X.; Li, J. Aircraft wake vortex parameter-retrieval system based on LiDAR. J. Radars 2020, 9, 1032–1044. [Google Scholar]
  6. Smalikho, I.N.; Banakh, V.A.; Holzäpfel, F.; Rahm, S. Method of radial velocities for the estimation of aircraft wake vortex parameters from data measured by coherent Doppler LiDAR. Opt. Express 2015, 23, A1194–A1207. [Google Scholar] [CrossRef] [PubMed]
  7. Eiichi, Y.; Naoki, M. Aircraft Wake Vortex Retrieval Method on LiDAR Lateral Range–Height Indicator Observation. AIAA J. 2017, 55, 2269–2278. [Google Scholar]
  8. Xu, S.; Hu, Y.; Wu, Y. Identification of aircraft wake vortex based on Doppler spectrum features. J. Optoelectron. Laser 2011, 22, 1826–1830. [Google Scholar]
  9. Li, J.; Shen, C.; Gao, H.; Chan, P.W.; Hon, K.K.; Wang, X. Path integration (PI) method for the parameter-retrieval of aircraft wake vortex by LiDAR. Opt. Express 2020, 28, 4286–4306. [Google Scholar] [CrossRef]
  10. Wang, X.; Wu, S.; Liu, X.; Yin, J.; Pan, W.; Wang, X. Observation of aircraft wake vortex based on coherent Doppler LiDAR. Acta Opt. Sin. 2021, 41, 9–26. [Google Scholar]
  11. Pan, W.; Wu, Z.; Zhang, X. Identification of aircraft wake vortex based on k-nearest neighbor. Laser Technol. 2020, 44, 471–477. [Google Scholar]
  12. Wang, X.; Pan, W.; Han, S.; Wu, Z. Identification of aircraft wake vortex using LiDAR based on SVM. J. Ordnance Equip. Eng. 2021, 42, 150–155. [Google Scholar]
  13. Pan, W.; Duan, Y.; Zhang, Q.; Wu, Z.; Liu, H. Research on aircraft wake vortex recognition using AlexNet. Opto-Electron. Eng. 2019, 46, 121–128. [Google Scholar]
  14. Pan, W.; Leng, Y.; Wu, T.; Wang, X. Rapid identification of aircraft wake based on improved GoogLeNet. J. Ordnance Equip. Eng. 2022, 43, 38–44. [Google Scholar]
  15. Ma, Y.; Zhao, J.; Han, H.; Chan, P.W.; Xiong, X. Aircraft Wake Recognition Based on Improved ParNet Convolutional Neural Network. Appl. Sci. 2023, 13, 3560. [Google Scholar] [CrossRef]
  16. Redmon, J.; Divvala, S.; Girshick, R.; Farhadi, A. You Only Look Once: Unified, Real-Time Object Detection. In Proceedings of the Computer Vision & Pattern Recognition, Las Vegas, NV, USA, 12–14 December 2016. [Google Scholar]
  17. Redmon, J.; Farhadi, A. YOLO9000: Better, Faster, Stronger. In Proceedings of the IEEE Conference on Computer Vision & Pattern Recognition, Honolulu, HI, USA, 22–25 July 2017; pp. 6517–6525. [Google Scholar]
  18. Redmon, J.; Farhadi, A. YOLOv3: An Incremental Improvement. arXiv 2018, arXiv:1804.02767. [Google Scholar]
  19. Bochkovskiy, A.; Wang, C.Y.; Liao, H.Y.M. YOLOv4: Optimal Speed and Accuracy of Object Detection. arXiv 2020, arXiv:2004.10934. [Google Scholar]
  20. Li, C.; Li, L.; Jiang, H.; Weng, K.; Geng, Y.; Li, L.; Ke, Z.; Li, Q.; Cheng, M.; Nie, W.; et al. YOLOv6: A Single-Stage Object Detection Framework for Industrial Applications. arXiv 2022, arXiv:2209.02976. [Google Scholar]
  21. Tan, M.; Le, Q.V. EfficientNetV2: Smaller Models and Faster Training. arXiv 2021, arXiv:2104.00298. [Google Scholar]
  22. Woo, S.; Park, J.; Lee, J.Y.; Kweon, I.S. CBAM: Convolutional Block Attention Module. In Proceedings of the European Conference on Computer Vision, Munich, Germany, 8–14 September 2018. [Google Scholar]
  23. Wei, Z.; Qu, Q.; Li, W.; Xu, X. Review on the artificial calculating methods for aircraft wake vortex flow field parameters. Acta Aerodyn. Sin. 2019, 37, 33–42. [Google Scholar]
  24. Fu, J.; Li, J.; Wu, Q. Application and prospect of Dopplar LiDAR in the wind field observation. Acta Aerodyn. Sin. 2021, 39, 172–179. [Google Scholar]
  25. Bretschneider, L.; Hankers, R.; Schönhals, S.; Heimann, J.M.; Lampert, A. Wind Shear of Low-Level Jets and Their Influence on Manned and Unmanned Fixed-Wing Aircraft during Landing Approach. Atmosphere 2021, 13, 35. [Google Scholar] [CrossRef]
  26. Jiang, L.; Tian, B.; Xiong, X.; Zhuang, Z.; Yao, B. Numerical simulations of low attitude wind shear based on Doppler LiDAR. Infrared Laser Eng. 2012, 41, 1761–1766. [Google Scholar]
  27. Goyal, A.; Bochkovskiy, A.; Deng, J.; Koltun, V. Non-deep networks. arXiv 2021, arXiv:2110.07641. [Google Scholar]
  28. Hon, K.K.; Chan, P.W.; Chim, K.C.Y.; Visscher, I.D.; Thobois, L.; Troiville, A.; Rooseleer, F. Wake vortex measurements at the Hong Kong International Airport. In Proceedings of the 2022 AIAA Science and Technology Forum and Exposition, San Diego, CA, USA, 3–7 January 2022. [Google Scholar]
  29. Cheng, Y.; Li, G.; Chen, H.B.; Tan, S.X.; Yu, H. DEEPEYE: A Compact and Accurate Video Comprehension at Terminal Devices Compressed with Quantization and Tensorization. arXiv 2018, arXiv:1805.07935. [Google Scholar]
  30. Wang, H.; Zhou, L.; Zhang, J. Region-based bicubic image interpolation algorithm. Comput. Eng. 2010, 36, 216–218. [Google Scholar]
Figure 1. The location of the LiDAR (circled in red) at the Hong Kong International Airport.
Applsci 14 07754 g001
Figure 2. LiDAR RHI scanning pattern.
Applsci 14 07754 g002
Figure 3. Network structure of the YOLOv8n model. C, K, and S, respectively, represent the number of output channels of the convolutional layer, kernel size, and stride. Nearest indicates that the nearest interpolation algorithm is used in the Upsample module. D represents the dimension that needs to be concatenated in the Concat module. Nc represents the number of target categories in the experimental dataset.
Applsci 14 07754 g003
Figure 4. Structures of Fused-MBConv and MBConv modules. H, W, and C, respectively, represent the height, width, and channels of the extracted feature map. (a) MBConv module; (b) Fused-MBConv module.
Applsci 14 07754 g004
Figure 5. CBAM structure. F, F′, and F″, respectively, represent the feature map characteristics in CBAM. MC(F) and MS(F′), respectively, represent the mapping functions of the channel attention submodule and the spatial attention submodule. AvgPool and MaxPool, respectively, represent average pooling and max pooling. MLP stands for Multi-Layer Perceptron.
Applsci 14 07754 g005
Figure 6. YOLOv8n–CBAM–EfficientNetV2 model network structure. The modules marked in green and yellow are the EfficientNetV2 submodules and CBAM, respectively.
Applsci 14 07754 g006
Figure 7. Wake structure under LiDAR RHI scanning.
Applsci 14 07754 g007
Figure 8. Positive and negative samples in the dataset. (a) Positive samples with wake; (b) negative samples without wake.
Applsci 14 07754 g008
Figure 9. Grayscale processing of wake images.
Applsci 14 07754 g009
Figure 10. Wake dataset samples: (a) normal vortex with upwind; (b) normal vortex with clear sky (c) normal vortex with downwind; (d) separate vortex with clear sky.
Applsci 14 07754 g010
Figure 11. Dataset samples labelled via LabelIMG. (a) normal vortex with upwind; (b) normal vortex with clear sky; (c) normal vortex with downwind; (d) separate vortex with clear sky.
Applsci 14 07754 g011
Figure 12. Precision rate and recall rate curves for the ablation experiment. (a) The comparison of the precision rates of the validation set; (b) the comparison of the recall rates of the validation set.
Applsci 14 07754 g012
Figure 13. Loss function curves for the training set and validation set of the YOLOv8n–CBAM–EfficientNetV2 model.
Applsci 14 07754 g013
Figure 14. Visual comparison of test results for each model. (a) normal vortex with upwind; (b) normal vortex with clear sky; (c) normal vortex with downwind; (d) separate vortex with clear sky.
Applsci 14 07754 g014
Table 1. LiDAR Parameter Settings.
ParameterValue
Radar wavelength1.54 μm
Pulse width200 ns
Pulse repetition rate20 kHz
Detection range1000 m–1785 m
Range gate width5 m
Angular resolution0.5°
Elevation−0.125°–5°
Azimuth340°
Table 2. Hyperparameter Settings.
HyperparameterEpochBatch SizeOptimiserInitial Learning Rate
Value20016AdamW optimisation algorithm0.001
Table 3. Comparison of Detection Performance Parameters of Different Models in the Ablation Experiment.
ModelPrecisionRecallF1-ScoreFPSGFLOPsNumber of Parameters
YOLOv8n93.87%93.71%93.79%1618.1953,006,038
YOLOv8n-CBAM94.52%93.32%93.91%1758.2093,014,601
YOLOv8n–EfficientNetV295.39%92.22%93.78%2382.5692,126,686
YOLOv8n–CBAM–EfficientNetV2 96.59%93.58%95.06%2502.5732,135,249
Table 4. Comparative Experiment of Wake Detection Performance.
ModelPrecisionRecallF1-ScoreFPSGFLOPsNumber of Parameters
KNN92.31%89.55%86.15%---
SVM88.41%93.85%91.04%---
ParNet92.64%96.92%94.73%6712.3867,721,645
SSD88.14%89.27%88.70%4160.80723,612,246
YOLOv5-lite93.70%94.26%93.98%2087.1782,508,854
YOLOv8n93.87%93.71%93.79%1618.1953,006,038
YOLOv8n–CBAM–EfficientNetV296.59%93.58%95.06%2502.5732,135,249
Disclaimer/Publisher’s Note: The statements, opinions and data contained in all publications are solely those of the individual author(s) and contributor(s) and not of MDPI and/or the editor(s). MDPI and/or the editor(s) disclaim responsibility for any injury to people or property resulting from any ideas, methods, instructions or products referred to in the content.

