Abstract
This paper focuses on predicting road passenger probability and optimizing taxi driving routes based on trajectory big data. By utilizing clustering algorithms to identify key passenger points, a method for calculating and predicting road passenger probability is proposed. This method calculates the passenger probability for each road segment during different time periods and uses a BiLSTM neural network for prediction. A passenger-seeking recommendation model is then constructed with the goal of maximizing passenger probability, and it is solved using the NSGA-II algorithm. Experiments are conducted on the Chengdu taxi trajectory dataset, using MSE as the metric for model prediction accuracy. The results show that the BiLSTM prediction model improves prediction accuracy by 9.67% compared to the BP neural network and by 6.45% compared to the LSTM neural network. The proposed taxi driver passenger-seeking route selection method increases the average passenger probability by 18.95% compared to common methods. The proposed passenger-seeking recommendation framework, which includes passenger probability prediction and route optimization, maximizes road passenger efficiency and holds significant academic and practical value.
1. Introduction
With the significant increase in the urban population, the demand for transportation services has also risen, posing new challenges for the development and management of urban public transportation systems. As a vital part of urban public transportation, taxis play an important role in the city’s transportation network, which includes public transport, private cars, electric vehicles, motorcycles, and bicycles. Taxis have notable advantages in terms of shared use and travel distance, providing flexible and fast transportation services that meet the spatial and temporal needs of urban travel to a high degree, making them a key choice for medium- and short-distance travel for city residents [1]. However, with the continuous increase in the number and variety of vehicles and the diversified growth of travel demands, taxi operations have encountered difficulties. According to surveys, the current taxi vacancy rate remains high at 30–40%, while passengers in many locations still face the issue of “difficulty hailing a taxi”. Taxis exhibit an imbalanced supply and demand in terms of spatial and temporal distribution, with either “clustering” or “absence”, resulting in two problems: “drivers having difficulty finding passengers” and “passengers having difficulty finding taxis”. This imbalance leads to a higher taxi vacancy rate, a decline in service levels, and challenges for drivers in maintaining profitability. To resolve the issues of “clustering” and “absence”, smarter vehicle dispatching and route guidance are needed to achieve a dynamic balance between supply and demand, improve taxi operational efficiency, and enhance the passenger experience, thereby creating a positive cycle and further promoting the development of the taxi industry. The GPS devices installed in taxis record important information such as the taxi’s latitude and longitude, time, speed, direction, and passenger status. By mining and analyzing taxi GPS trajectory data, the operational patterns of taxis and the travel patterns of residents can be determined, facilitating the recommendation of passenger-seeking routes and destinations, which improves passenger-seeking efficiency and reduces vacancy rates.
2. Literature Review
In the mining and application of trajectory data, researchers have achieved many results. For example, Lai et al. leveraged trajectory data from Fuzhou Metro to enhance short-term passenger flow prediction using an improved particle swarm optimization algorithm, showcasing the effectiveness of trajectory data in optimizing rail transit prediction models [2]. Na et al. mined the urban road network flow based on the net car travel data, which in turn leads to the optimization of the net car travel route scheme in different time periods [3]. Zhou et al. proposed a method for optimizing the passenger search routes of rental cars by considering three indicators, namely, the probability of carrying passengers, the unloaded traveling time, and the regional supply–demand ratio [4]. Chou et al. [5] introduced a fusion clustering algorithm based on trajectory data to improve the clustering accuracy of trajectory data. Liu et al. [6] used an optimized affinity propagation (AP) clustering algorithm to determine the locations of shared car stops by analyzing the OD points in the GPS trajectory data of Beijing taxis and then predicted the optimal arrangement of shared car stops. Zhou et al. [7] proposed a human cognitive mechanism mimicking the data and knowledge-driven combination of pedestrian intention estimation and trajectory prediction method by constructing a knowledge graph of a pedestrian crossing scene and combining it with the Bayesian network to estimate the pedestrian crossing intention; they then combined it with the data to drive the prediction of pedestrian trajectory characteristics. In the context of the rapid growth of trajectory data and the development of big data technology, how to mine meaningful individual information and group patterns from trajectory data has become a research hotspot.
More and more researchers are focusing on improving road passenger-carrying probability. In order to improve the efficiency of passenger-seeking, Dang Pengfei [8] established a two-stage taxi driver passenger-seeking program recommendation model to give dynamic recommendations to the driver’s passenger-seeking program. Tang et al. [9] established a regression model for taxi passenger trips by combining the data of residents’ appearances, urban land-use data, weather data, etc., and the number of slice posts. Weather conditions were then analyzed using the regression model constructed based on the RBF neural network, time period, and area of the district, as well as the number of residents in the district and whether it was a working day. Niu Dandan [10] obtained visualized feature data by processing taxi passenger travel data using the method of multi-view cooperative interaction and analyzed the spatial and temporal distribution of urban taxi passenger travel features according to the results. Si et al. [11] investigated the effects of psychological activities such as attitudes, subjective norms, behavioral control, and destination choice intention of taxi drivers for three types of destinations, namely, commercial areas, residential areas, and airport areas.
Zhou et al. [12] proposed a DBSCAN algorithm based on grid optimization to improve the efficiency of passenger search by mapping taxi trajectory data to a grid of the same size and generating clusters based on a width-first search so as to quickly mine hotspot areas. Feng et al. [13] proposed a popular passenger route mining algorithm based on spatio-temporal similarity clustering to improve the efficiency of passenger searches by analyzing the passenger trajectory data of more than 3000 taxis in Lanzhou City for one week to improve the efficiency of passenger searching. Xie et al. [14] proposed a method to calculate travel time based on the grid traffic state by gridding the selected area, constructing a macroscopic base map using taxi GPS data, and then analyzing the data by mining the data of the taxis loaded with passengers. Meghna et al. [15] proposed an algorithm based on spatial and temporal similarity clustering to improve the efficiency of passenger search. This was estimated by estimating the relationship between socio-demographic factors and the factors influencing car rental decisions—time flexibility is the most important consideration for taxi target passengers. Ku et al. [16] developed a model that includes online taxi platforms, taxi companies, and gasoline vehicle leasing companies and analyzed the pricing strategy of the system and its impact on the drivers’ net income, rental prices, and wages. Yang et al. [17] proposed a passenger–taxi matching queuing model that reveals the queuing dynamics of passengers and taxis at taxi stands in transportation hubs by taking into account real-world factors such as multiple boarding points, matching time, and arrival rates over time. However, the existing studies mainly give suggestions for finding passengers by mining the activity behavior and space of taxi drivers in the process of finding passengers as well as the characteristics of passengers’ travel activities, but they ignore the probability of finding passengers, which is the most important concern of taxi drivers in the actual process of finding passengers, and maximizing the search for passengers around the cruising roads and hotspots is not a kind of shortest-path or least-cost idea to plan the path of finding passengers. Therefore, in terms of the probability of finding passengers, the above research still lacks a better solution and research conclusions.
On the issue of path planning, An et al. [18] first proposed a topological map-matching algorithm based on taxi trajectory data that considers four weights of headway orientation, proximity distance, roadway connectivity, and turning restrictions and then proposed a taxi travel trajectory recognition method through analysis, on the basis of which a storage structure model of taxi GPS trajectory was established. On the basis of a large number of conclusions on taxi GPS data mining, more scholars began to work on the research about taxi hierarchical path planning. For example, Du et al. [19] used a Long Short-Term Memory Recurrent Neural Network (LSTM-RNN) with a Mixed Density Network (MDN) to predict taxi demand. An integrated learning model integrating linear regression (LR), ridge regression (RR), and multilayer perceptron (MLP) is used to obtain the results for fare prediction. Zhao [20] proposed a method of distance metrics between trajectories and extracted the center-of-mass empirical trajectories by clustering through the similarity of trajectories; on this basis for the study of path planning methods, a hierarchical path planning method based on empirical routes was proposed. Liu et al. [21] proposed a hierarchical path planning method using AdaBoost Bagging Maximum Entropy Deep Inverse Reinforcement Learning to learn cruising strategies from experienced taxi driver trajectories and developed a trajectory-based self-attentive bi-directional LSTM model to adjust cruising speeds on different roads for taxi path planning. Yang et al. [22] proposed a multi-path standardized glide based on the System Optimal Traffic Assignment (SOTA) Route (MPSTR) planning and validation method, and the results show that MPSTRs is a promising approach for balancing the safety and efficiency of STR-based taxi operations and dynamic route optimization. Yang et al. [23] used annual taxi trajectory data of the city of Porto from the Kaggle platform and compared the performance of two spatial indexing structures, namely, the K-d tree and the R-tree, in dealing with large-scale datasets in terms of efficiency and overhead. These findings provide an important reference for taxi path planning and other big data applications. Zhu et al. [24] applied a time-optimal and privacy-preserving carpool path planning system via deep reinforcement learning. The system uses the traffic information around the carpool vehicle to optimize the travel time of passengers and generates a detailed route plan for the carpool vehicle. Yang et al. [25] proposed a route planning mechanism for supermarket shuttle service based on large-scale taxi GPS trajectory information, which optimizes the shuttle routes by exploring pick-up and drop-off information in order to improve the quality of service. Hsieh et al. [26] proposed an algorithm to optimize taxi route planning by combining multiple factors by constructing a grid-based road network graph and using deep learning techniques to predict taxi demand and destination distribution. By combing through the literature, it was found that existing studies usually conduct multi-objective route planning based on trajectory data in the dimensions of cost and time. However, taxi loading is not a mere passenger demand event, and if only the fixed point-to-point person-vehicle matching between taxis and passengers is studied and only a single path between a fixed starting point and a destination point is considered, the algorithms and modeling will inevitably suffer from the problem of incomplete influencing factors that lead to biased results.
In summary, it is found that the existing research based on artificial intelligence, trajectory data-driven hotspot area mining for picking up and dropping off passengers, the construction of passenger-seeking recommendation index model, and the recommendation of taxi passenger-seeking strategy are developed in the direction of high accuracy, reasonableness, and practicability, which lays the foundation of the research in this paper. However, there are still the following shortcomings: the strong time-varying nature of the road passenger probability brings great challenges to the accuracy of the related research results, and the existing research focuses on the performance of clustering algorithms and optimization algorithms but ignores the pursuit of road passenger probability, which is the most essential part of the taxi driver’s passenger search behavior.
Therefore, this paper proposes a method for calculating and predicting the probability of passenger-seeking road loads, constructs a road load prediction model based on the BiLSTM neural network, and calculates the load probability of all roads by the road load probability calculation method. Then, a passenger-seeking route recommendation model for taxi drivers is proposed, and the Pareto solution set of the passenger-seeking scheme is solved based on the NSGA-II algorithm, which solves the problem of recommending passenger-seeking paths for taxis according to the conditions of real-time changes in the probability of carrying passengers. The technical route is shown in Figure 1.
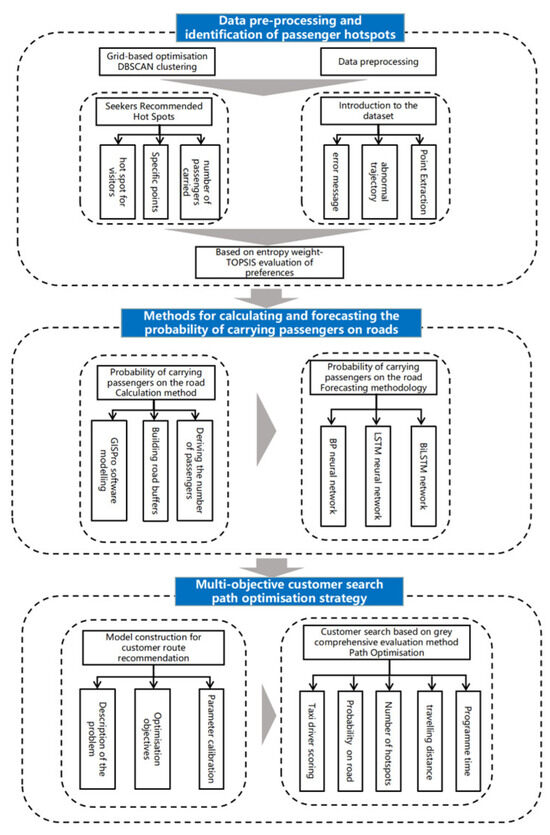
Figure 1.
Technology roadmap.
3. Data Preparation and Data Preprocessing
This paper provides a detailed introduction to the source of the raw data and the reasons for selecting Chengdu taxi trajectory data as the research subject. It also discusses data preprocessing, which provides high-quality foundational data for the subsequent key issue of road passenger probability prediction.
Taxi trajectory data are a type of spatiotemporal big data with high data quality, extensive collection range, and detailed records of spatiotemporal information characteristics. It contains rich spatiotemporal information, which can be analyzed to uncover the spatiotemporal travel patterns of residents, perceive urban traffic congestion, understand taxi driver driving experience, and analyze and predict taxi supply and demand balance based on demand. Currently, there is extensive research on taxi trajectory data mining. However, for data owners (taxi companies and ride-hailing platforms), there is a concern that taxi trajectory datasets may pose a risk of leaking personal travel information, especially sensitive fields such as user IDs, order costs, and driver incomes. Therefore, these datasets are not publicly available, making it difficult to obtain high-quality trajectory data [27].
For mining urban residents’ travel patterns, the more stable the temporal characteristics of urban travel, the more conducive it is to obtaining generalizable research conclusions. Therefore, this paper compares and selects trajectory data from Beijing, Shanghai, Guangzhou, and Chengdu, including data from the year 2020. The specifics are shown in Table 1.

Table 1.
Comparison of trajectory datasets.
Under the dual impact of new transportation modes like ride-hailing and the COVID-19 pandemic, the taxi passenger volume in all four cities experienced varying degrees of decline compared to pre-pandemic levels. Chengdu saw the smallest decrease in taxi passenger volume, with a year-on-year decline of only 12.7%, demonstrating good representativeness in terms of the temporal stability of urban residents’ travel patterns.
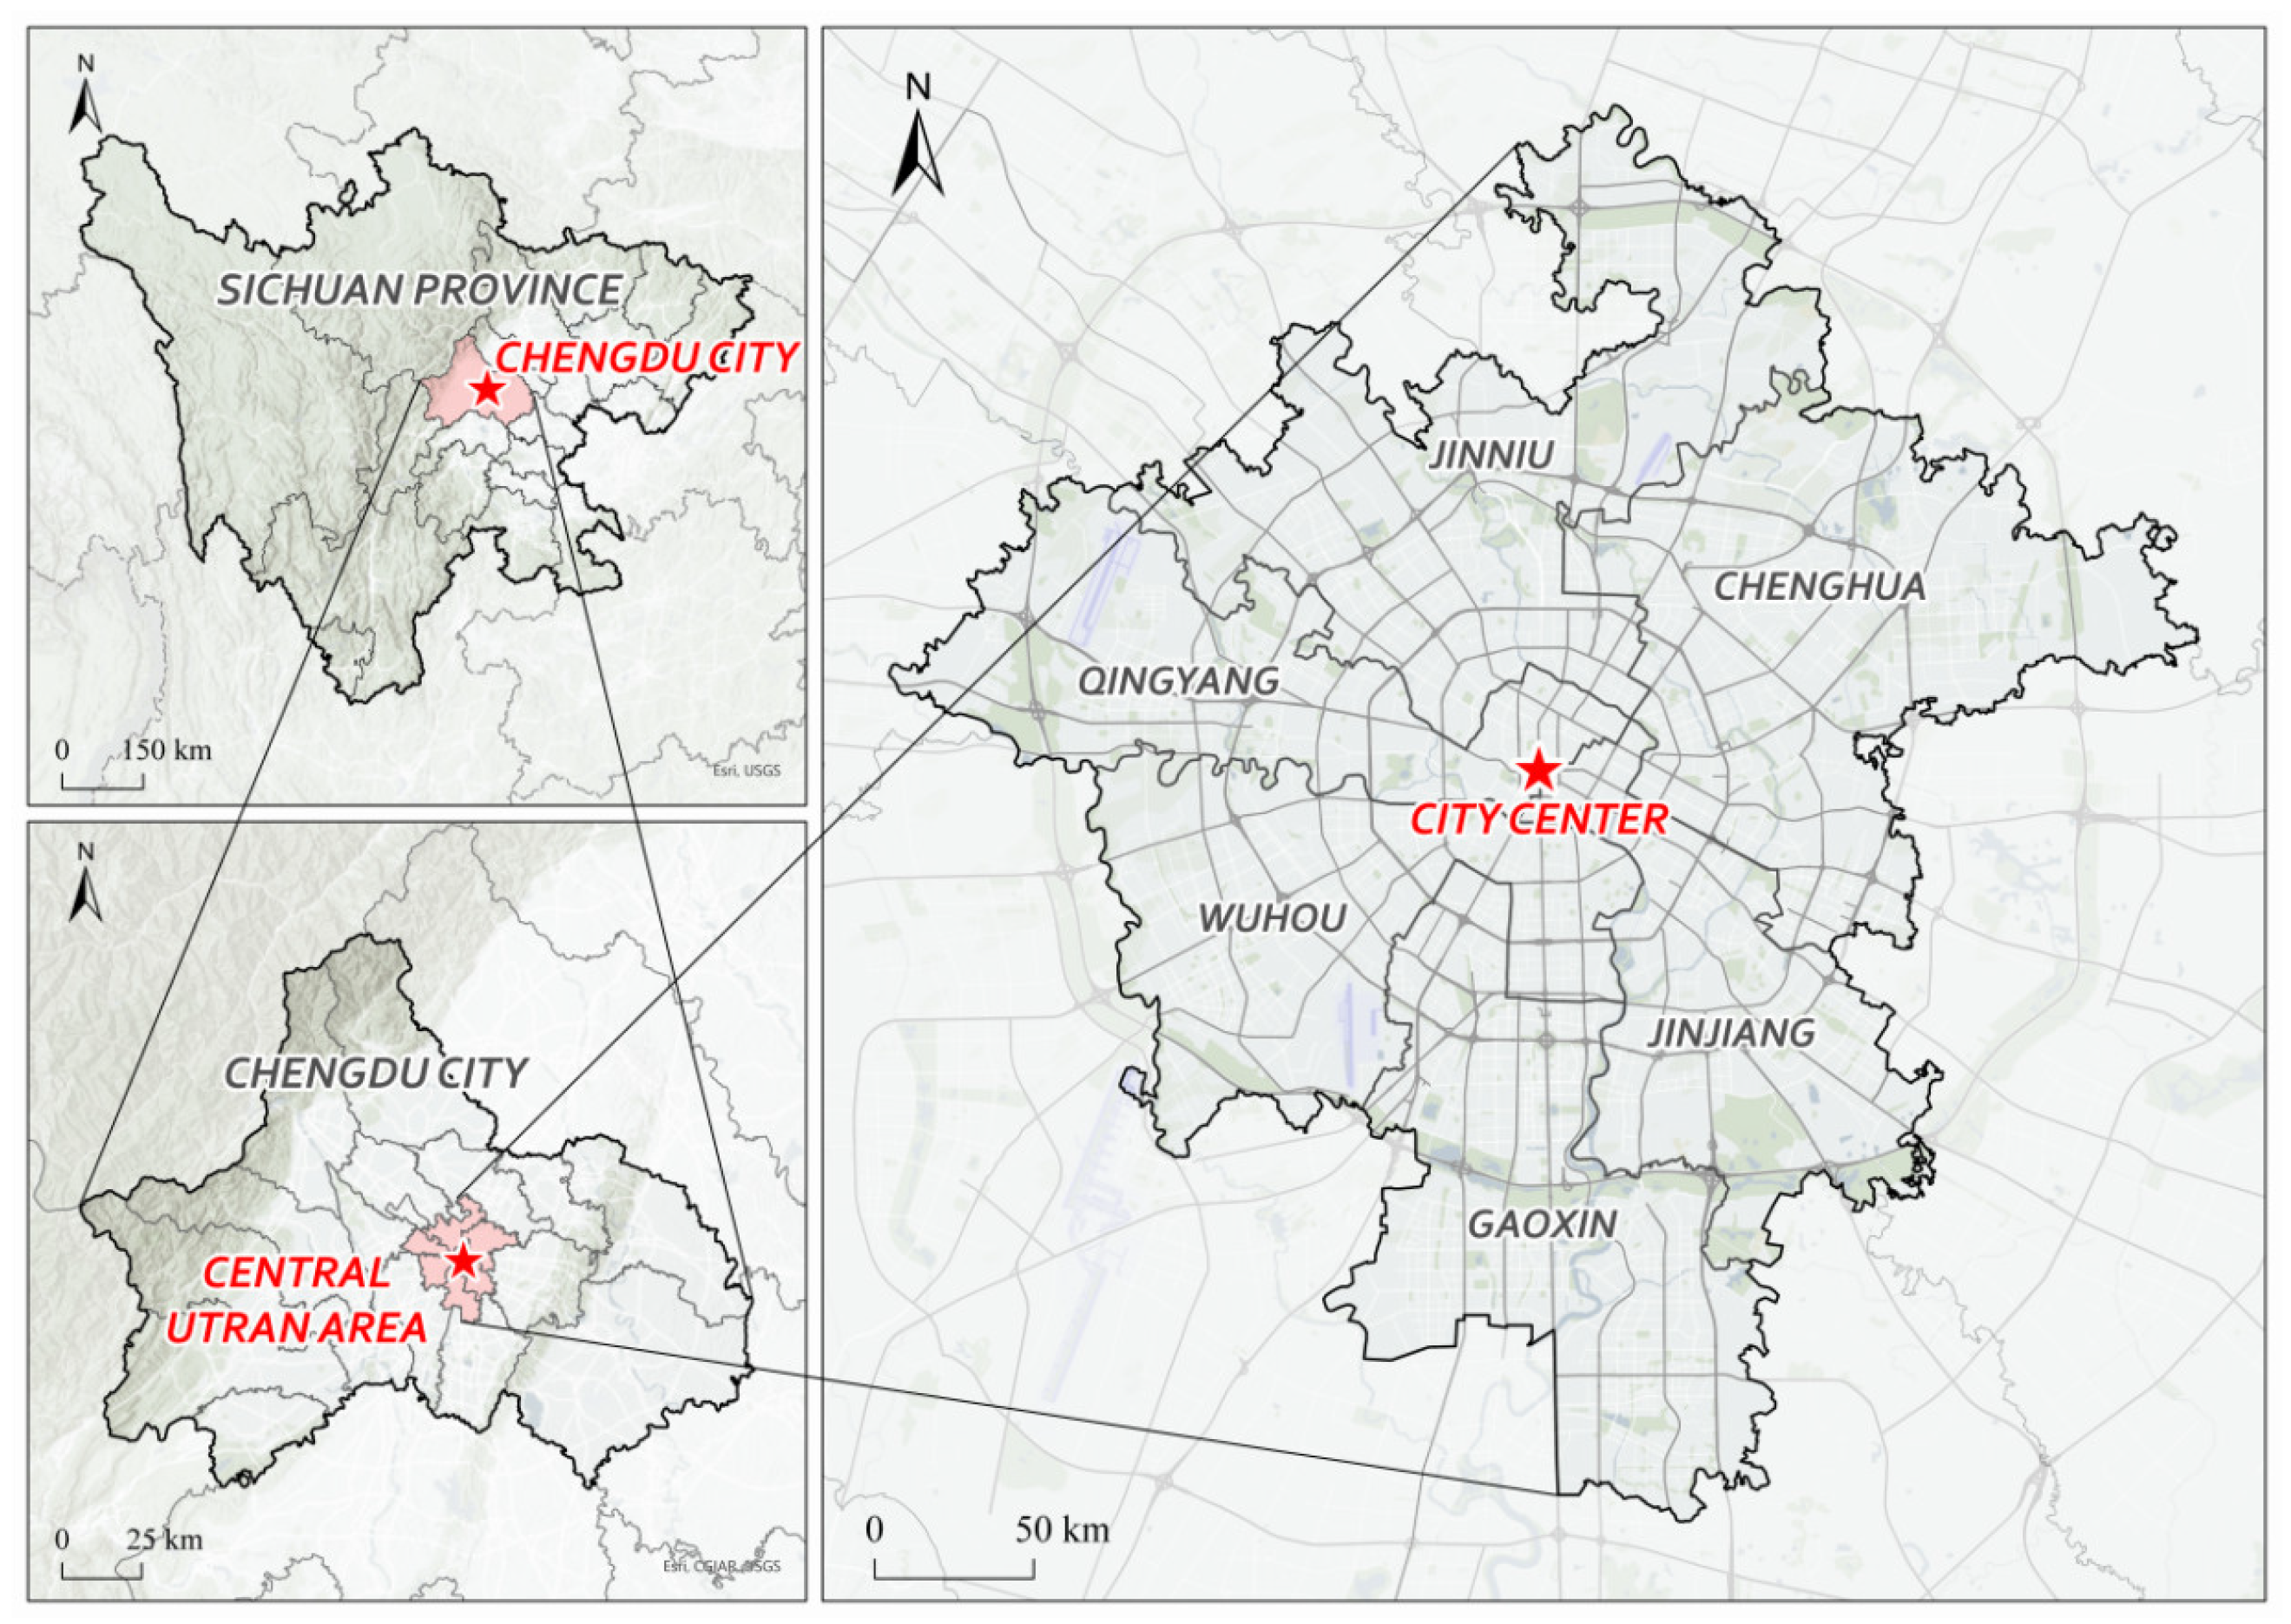
Chengdu, located in the western part of the Sichuan Basin between longitudes 102°54′ E and 104°53′ E and latitudes 30°05′ N and 31°26′ N, covers a total area of 14,335 square kilometers, with an urban area of 1421.6 square kilometers. It is one of the central cities in China. As of the end of 2022, Chengdu administratively comprises 11 districts, including Jinjiang, Qingyang, Jinniu, Wuhou, and Chenghua; as well as five county-level cities, including Jianyang, Dujiangyan, and Pengzhou; and four counties: Jintang, Dayi, Pujiang, and Xinjin. This forms an administrative structure of 11 districts, five county-level cities, and four counties, as shown in Figure 1. Chengdu’s permanent population and urban population are 21.192 million and 16.843 million, respectively, with an urbanization rate of 79.5%. The daily travel demand of urban residents is high. Chengdu has now essentially established an international inland comprehensive transportation hub and a modern integrated transportation system. Therefore, selecting Chengdu as the research area is highly representative. The location of Chengdu is shown in Figure 2.
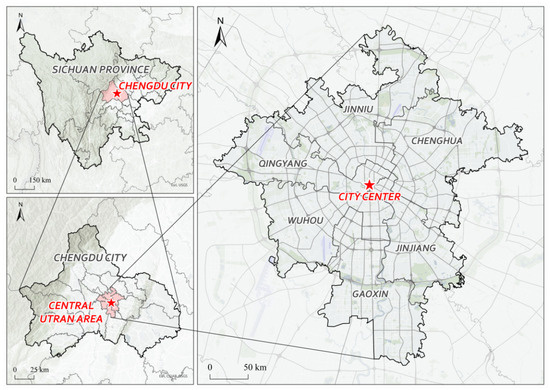
Figure 2.
Location map of Chengdu.
3.1. Data Description
This study selected one week’s worth of taxi trajectory data from Chengdu as the research subject. The daily data file is approximately 1 GB in size, and the data file format is CSV. During the exploration of road passenger volume prediction, the trajectory data for the entire month of August were used. The data fields are shown in Table 2.
Table 2.
Description of data fields.
3.2. Data Preprocessing
In taxi trajectory big data, there may be a certain amount of abnormal data due to the instability of the equipment. To complete the data mining work more accurately, this study preprocesses the raw data before starting the research. The trajectory data preprocessing can be divided into five core stages: data quality inspection, outlier handling, abnormal and missing value handling, abnormal GPS trajectory processing, and extraction of passenger pick-up and drop-off points [28,29].
Data quality inspection is a crucial step in preprocessing and is an important foundation for ensuring the correctness of the analysis conclusions. The main task of data quality analysis is to check for the presence of “dirty data”. Common dirty data in taxi trajectory datasets include missing values, outliers, inconsistent formats, duplicate data, and unexpected abnormal trajectory points outside the study area.
3.2.1. Deletion of Outliers
The study area of this paper is Chengdu, located between longitudes 102°54′ E and 104°53′ E and latitudes 30°05′ N and 31°26′ N. Therefore, data outside this range of latitude and longitude coordinates are excluded from this study.
3.2.2. Handling Outliers and Missing Values
Abnormal values refer to data that are either incorrectly entered or unreasonable. Typically, abnormal values significantly deviate from the range of most observations. For example, in the passenger status field, a value of 1 indicates the taxi is occupied, while a value of 0 indicates it is empty. Ideally, the passenger status should alternately appear as continuous 0 s followed by continuous 1 s. A typical abnormal situation would be a sudden appearance of a 0 within a sequence of 1 s. Although it is possible that in hotspot areas, the passenger waiting time is so short that an empty interval is too brief to record a complete normal passenger process, such situations are exceedingly rare and are therefore not considered in this study.
Missing values primarily include the complete absence of data records and the absence of information in certain fields. Based on past experience, the fields most prone to missing values are longitude, latitude, and time. In the process of handling taxi trajectory data in this study, if a sample record has most of its valid data missing and interpolation might change its original meaning, the record is directly deleted.
In summary, this paper carries out data cleaning under the following circumstances. First, data points with latitudes and longitudes outside the research scope are removed. Chengdu is located between 102°54′~104°53′ E and 30°05′~31°26′ N, and trajectory records outside this range are deleted. Second, some fields may be empty or missing; if these fields affect subsequent analyses, the corresponding records are deleted. Third, there are multiple duplicate records at the same location or from the same vehicle ID within a short period. This could be due to temporary stops or disruptions caused by traffic congestion or road control. Such duplicate trajectory records are removed.
3.2.3. Filtering Anomalous GPS Tracks
Abnormal GPS trajectory refers to when the data that the position recorded by the GPS device deviate from the actual position, and research shows that data drift is more likely to occur when the positioning object is in a stationary or low-speed moving state and the key pick-up and drop-off points are almost all in the taxi when it is stationary or moving at a low speed, so the drift data cleaning work is very important. In this paper, the DP (Douglas–Peucker) algorithm is used to clean the drifted data, and its basic principle is to connect the three trajectory points A, B, and C into a triangle; then, the area of the triangle is
where , , and are the lengths of AB, BC, and AC, respectively, and is half the perimeter of triangle ABC. The drift data points can be judged according to the following equation:
where indicates the distance from point B to AC, i.e., the offset distance between the trajectory point B and the two trajectory points A and C before and after. When is less than the offset threshold error, point B is judged to be within the error allowance; on the contrary, point B is judged to be drifting data and needs to be eliminated. The offset threshold error can be determined according to the accuracy of the equipment and the width of the road.
3.2.4. Extraction of Drop-Off and Pick-Up Points
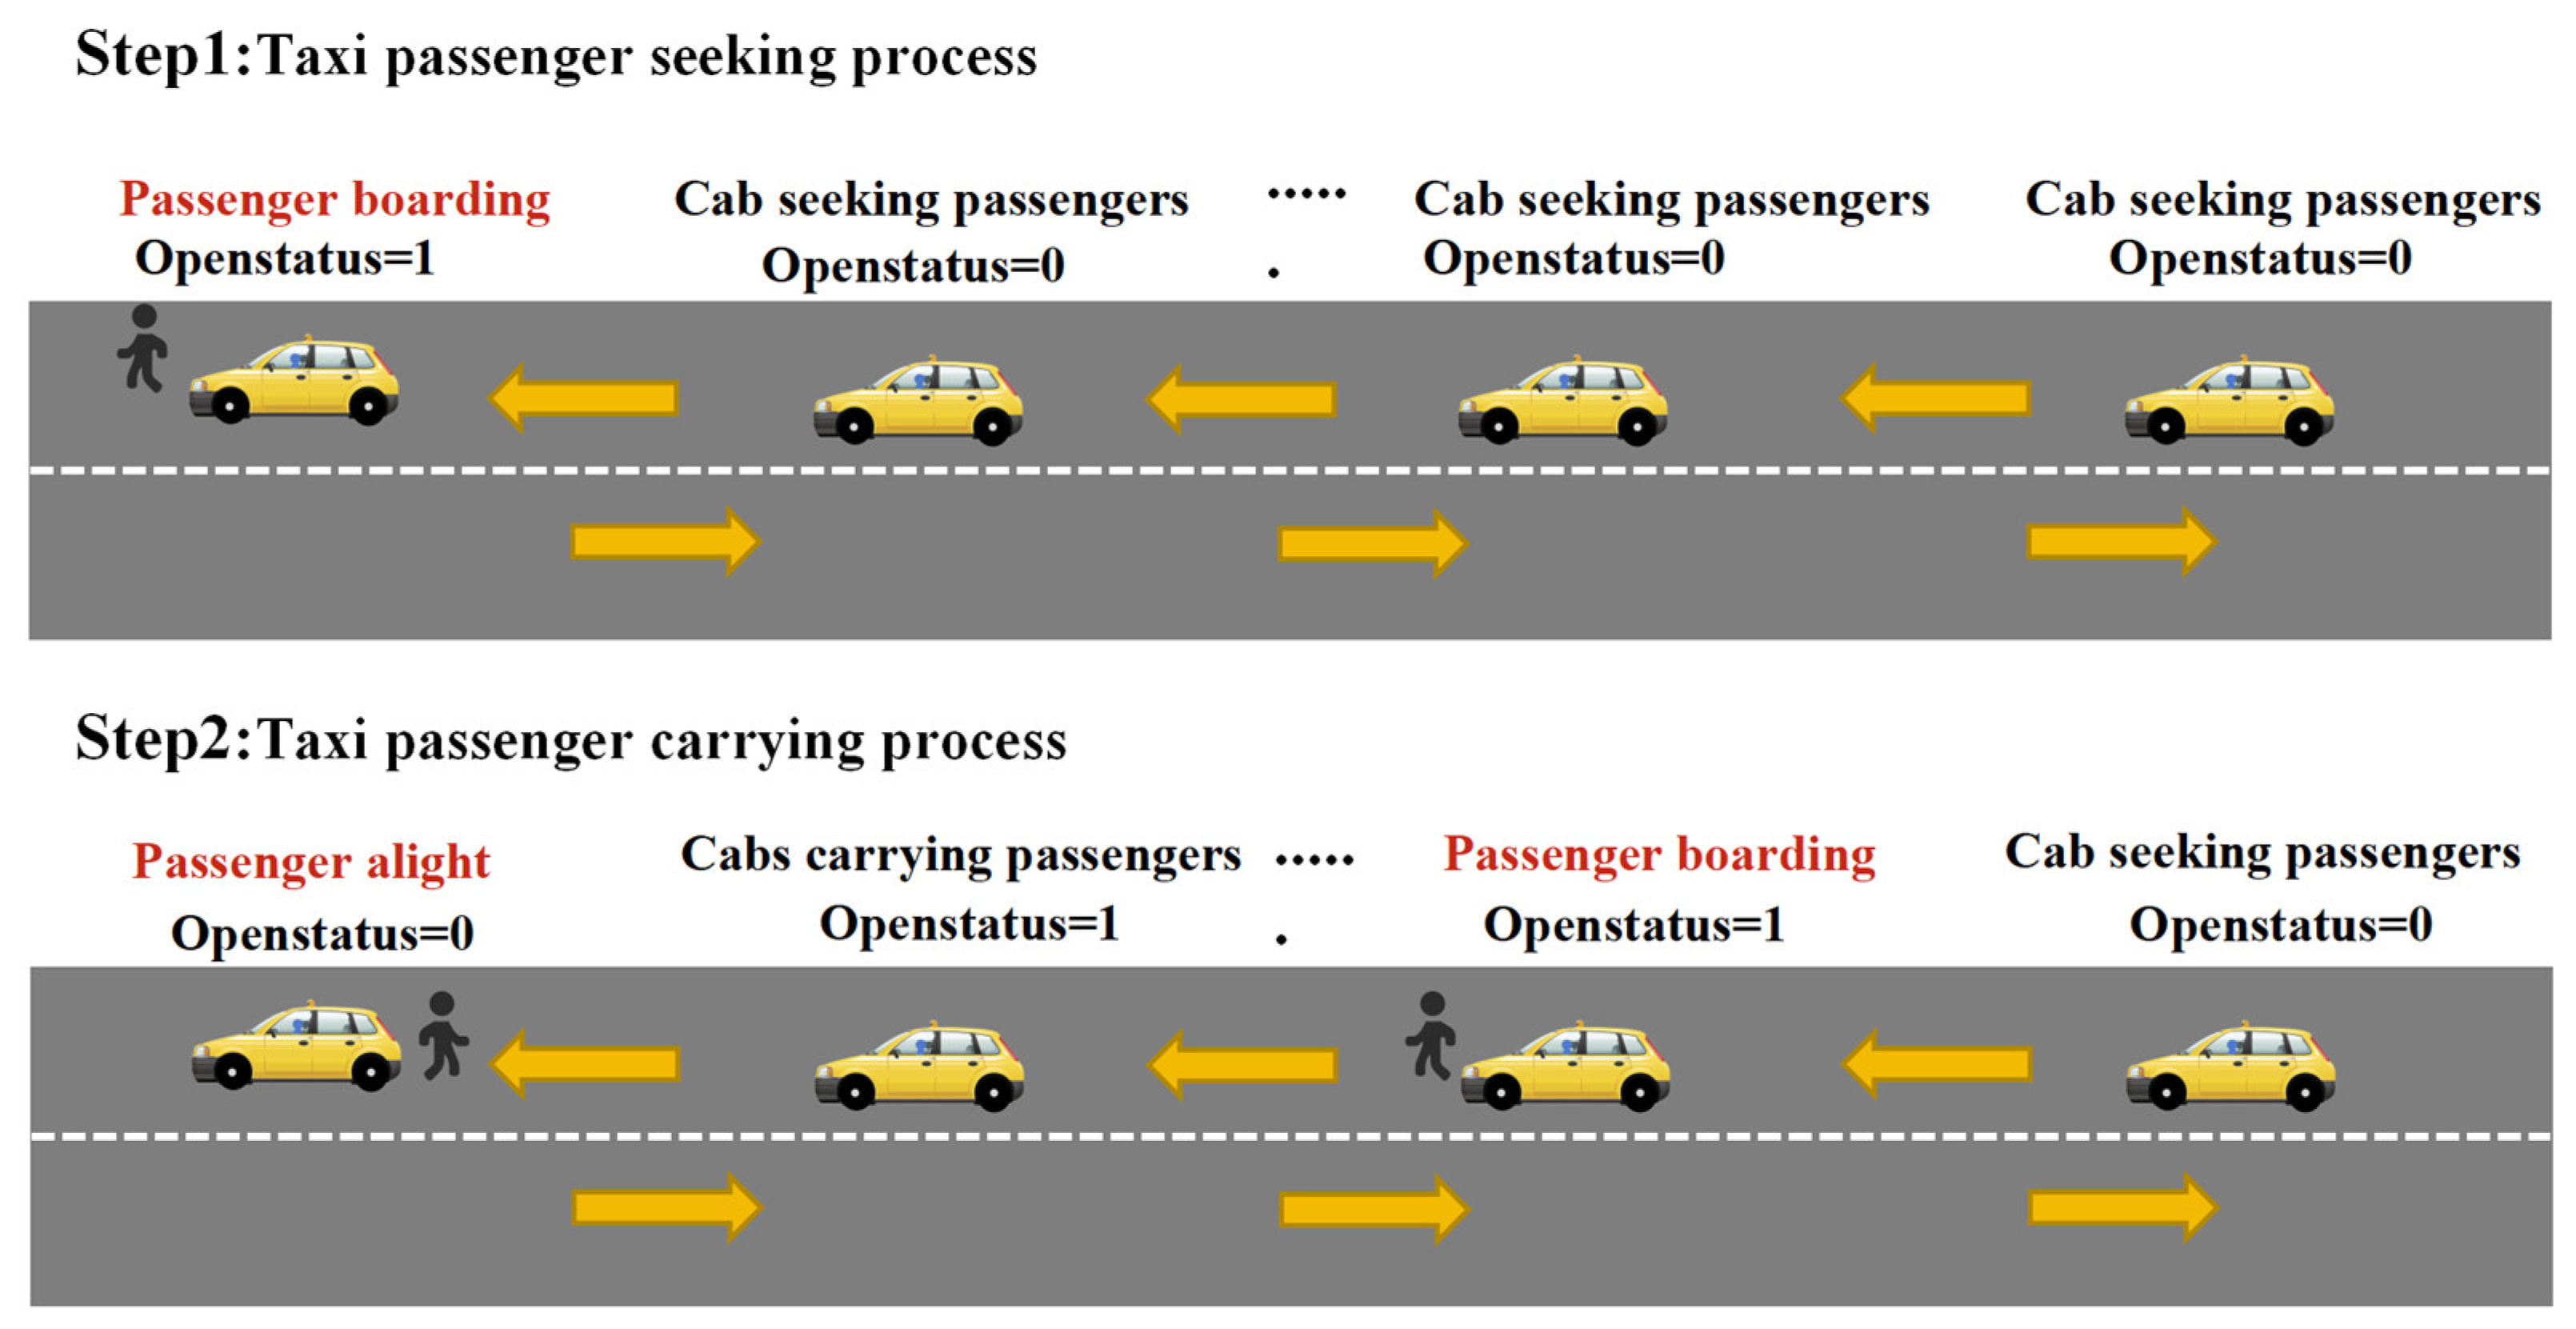
Since trajectory data are different from other types of relational data, with obvious spatio-temporal attributes, it is necessary to make trajectory processing for taxi GPS positioning data [30]. The characteristics of the passenger field of the data in this paper are shown in Figure 3.
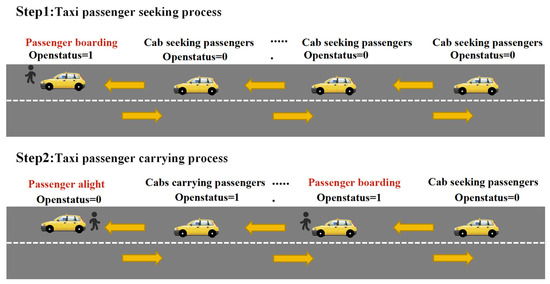
Figure 3.
Characterization of passenger-carrying fields.
Based on the characteristics of the passenger status field, the process of the taxi pick-up and drop-off point extraction algorithm designed in this paper is as follows:
Step 1: Initialize the preprocessed trajectory data; the set of boarding points is noted as , and the set of alighting points is noted as ; execute Step 2.
Step 2: Iterate over the trajectory dataset’s passenger-carrying status column Statei, notate the serial number as i, and execute Step 3.
Step 3: Calculate the difference of , denoted as . If , then put this record into the set ; if , then the taxi is in the traveling stage, without identifying whether it is carrying a passenger or not. If , then put this record into the set and execute Step 4.
Step 4: Extract the set of boarding points as and the set of alighting points as , respectively.
3.2.5. OD Map-Matching
Preprocessing of the trajectory data can effectively eliminate data such as missing values, outliers, and drift points, but it cannot solve the problem of data accuracy due to GPS devices. This results in taxi trajectories not being accurately displayed on the road but floating on the roadway. Therefore, it is necessary to match the taxi trajectory data with the road network map before processing and analyzing it. The purpose of OD map-matching is to take the accuracy errors brought by GPS devices and accurately locate them on the correct road sections.
In this paper, a weight-based OD map-matching algorithm is used. The specific OD map-matching process is mainly divided into the following five steps:
Step 1: Connect the start and end points of the taxi track segments to the road network. In this process, accurate map data needs to be acquired to match road segments.
Step 2: Update the weights of the road sections within the radius of the taxi trajectory point. The distance between the trajectory point and the candidate road section, the angle between the coordinate direction of the trajectory point and the direction of the road section, and the topological relationship between the candidate road section at the current point and the road section where the previous point is located are regarded as the weighting factors.
Step 3: Search for the shortest path with weights between the start and end points of taxis. Assign the appropriate weight coefficients of the above factors, calculate the total weights, and use the total weights as the best matching path.
Step 4: Obtain the correspondence between taxi track points and road sections and the corresponding points.
4. Methods and Models
This paper uses a grid-optimized DBSCAN algorithm to find suitable pick-up points and then constructs a model to calculate the probability of picking up passengers on the roads. The BiLSTM model predicts the probability of picking up passengers on the roads. By creatively using the passenger pick-up probability as the recommendation value for the pick-up route, this approach maximizes the passenger pick-up probability in the optimization process of taxi drivers’ pick-up routes, making the research results more consistent with real-world conditions.
4.1. Mining and Evaluation Methods for Pick-Up and Drop-Off Points
The DBSCAN clustering algorithm can discover non-spherical and irregular clusters, making it suitable for mining passenger hotspots with irregular distributions in trajectory data. However, the traditional DBSCAN clustering algorithm has issues such as poor clustering performance when an inappropriate radius is set and high time costs when processing large-scale data [31,32]. Therefore, this paper uses a grid-optimized DBSCAN algorithm to mine trajectory data, optimizing the partitioning method to eliminate the need to query all trajectory points, thereby further reducing the algorithm’s time complexity. The relevant parameter settings for the algorithm are as follows:
Grid cell: first, set the division parameter ; the entire data space is divided into a grid with side length , which is written as grid cell .
where denotes the dimension, and denotes the spatial ordinal.
-neighboring grid set: the grid cell is set to the top, bottom, left, and right, respectively, extending grid edge lengths after the rows into the rectangular region; the rectangular region contains a collection of grids is recorded as , and rectangular region edge lengths are recorded as . The formula is as follows:
where is the division parameter, is the number of neighboring grids in a single direction, and is the side length of the rectangular region.
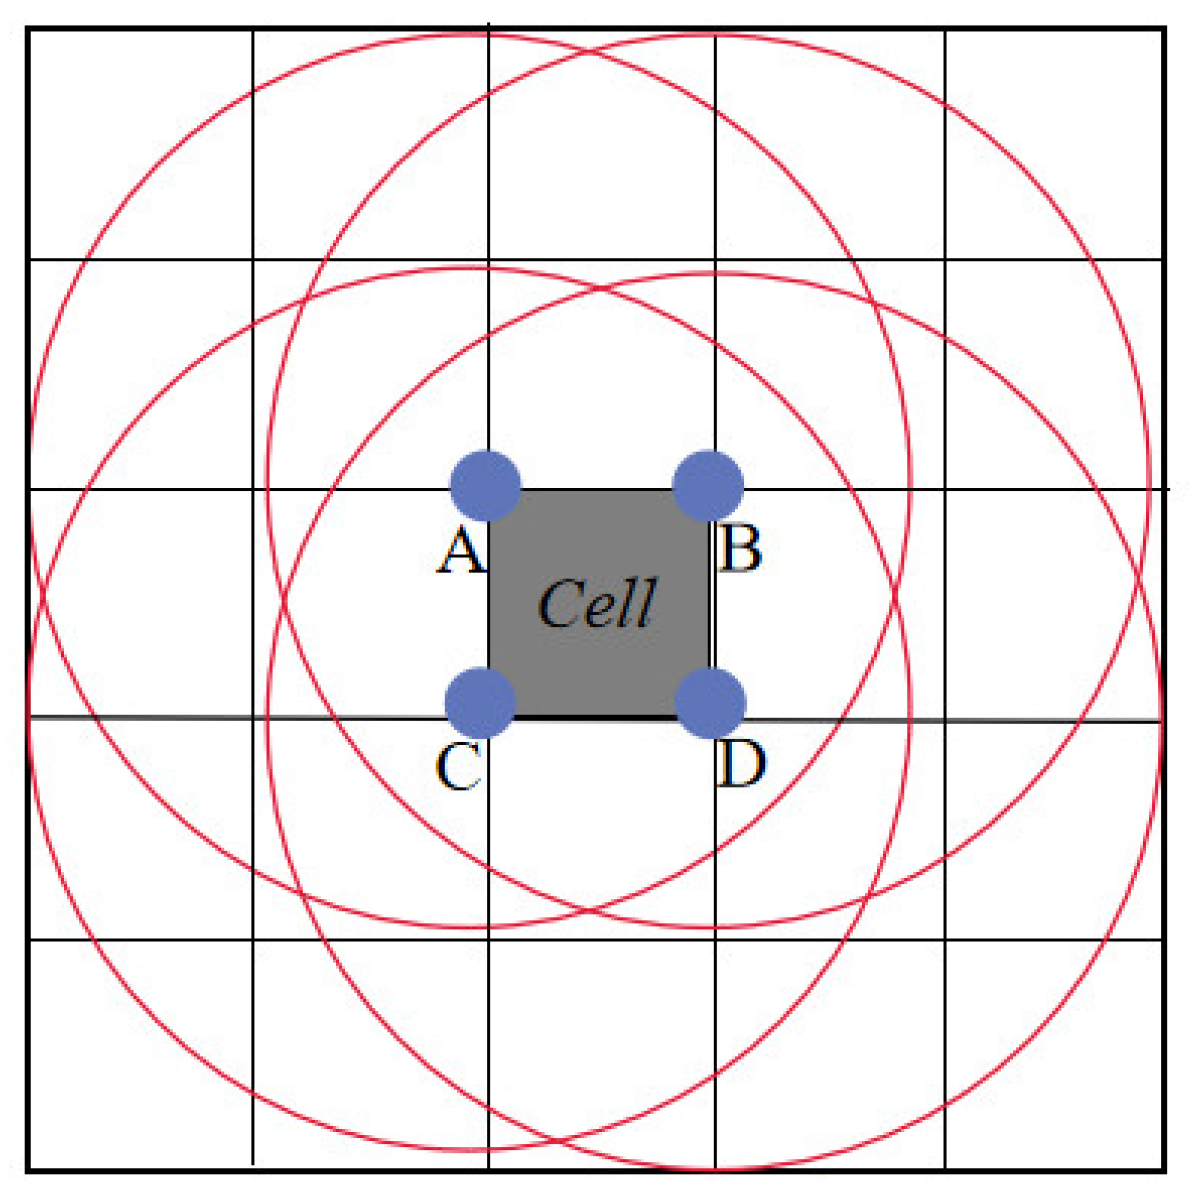
rectangular domain: Considering the four vertices of the grid as the center of the circle, a circle with radius is drawn with these four vertices as the center. The rectangular domain of grid cell is defined as the area formed by the set of -neighboring grids that can cover these four circles, as shown in Figure 4.
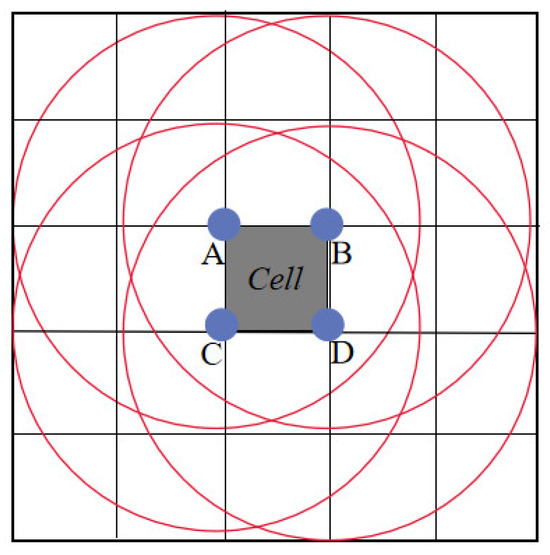
Figure 4.
Schematic diagram of neighboring grids.
In order to facilitate the calculation of the rectangular domain, the side length of the grid cell is selected as = , where is the side length of the grid cell, is the radius, and is a constant, which can be set according to the size of the data volume.
After obtaining the passenger hotspots, the passenger hotspots are evaluated by considering the ratio of taxi supply and demand in the recommended area, the density of the road network, and the number of passengers in the hottest spot. The TOPSIS algorithm is a method of sorting according to the degree of proximity of a finite number of evaluated objects to an idealized target, the core idea of which is to find out positive and negative ideal solutions by using corresponding algorithms to compare the index data of each index data with the positive and negative ideal solutions of each alternative solution and then compare the index data of each alternative program with the index data of the positive ideal solution and negative ideal solution, compare the proximity of each program to the positive ideal solution using the corresponding algorithm, and arrive at the ranking results of each program.
4.2. BiLSTM Model
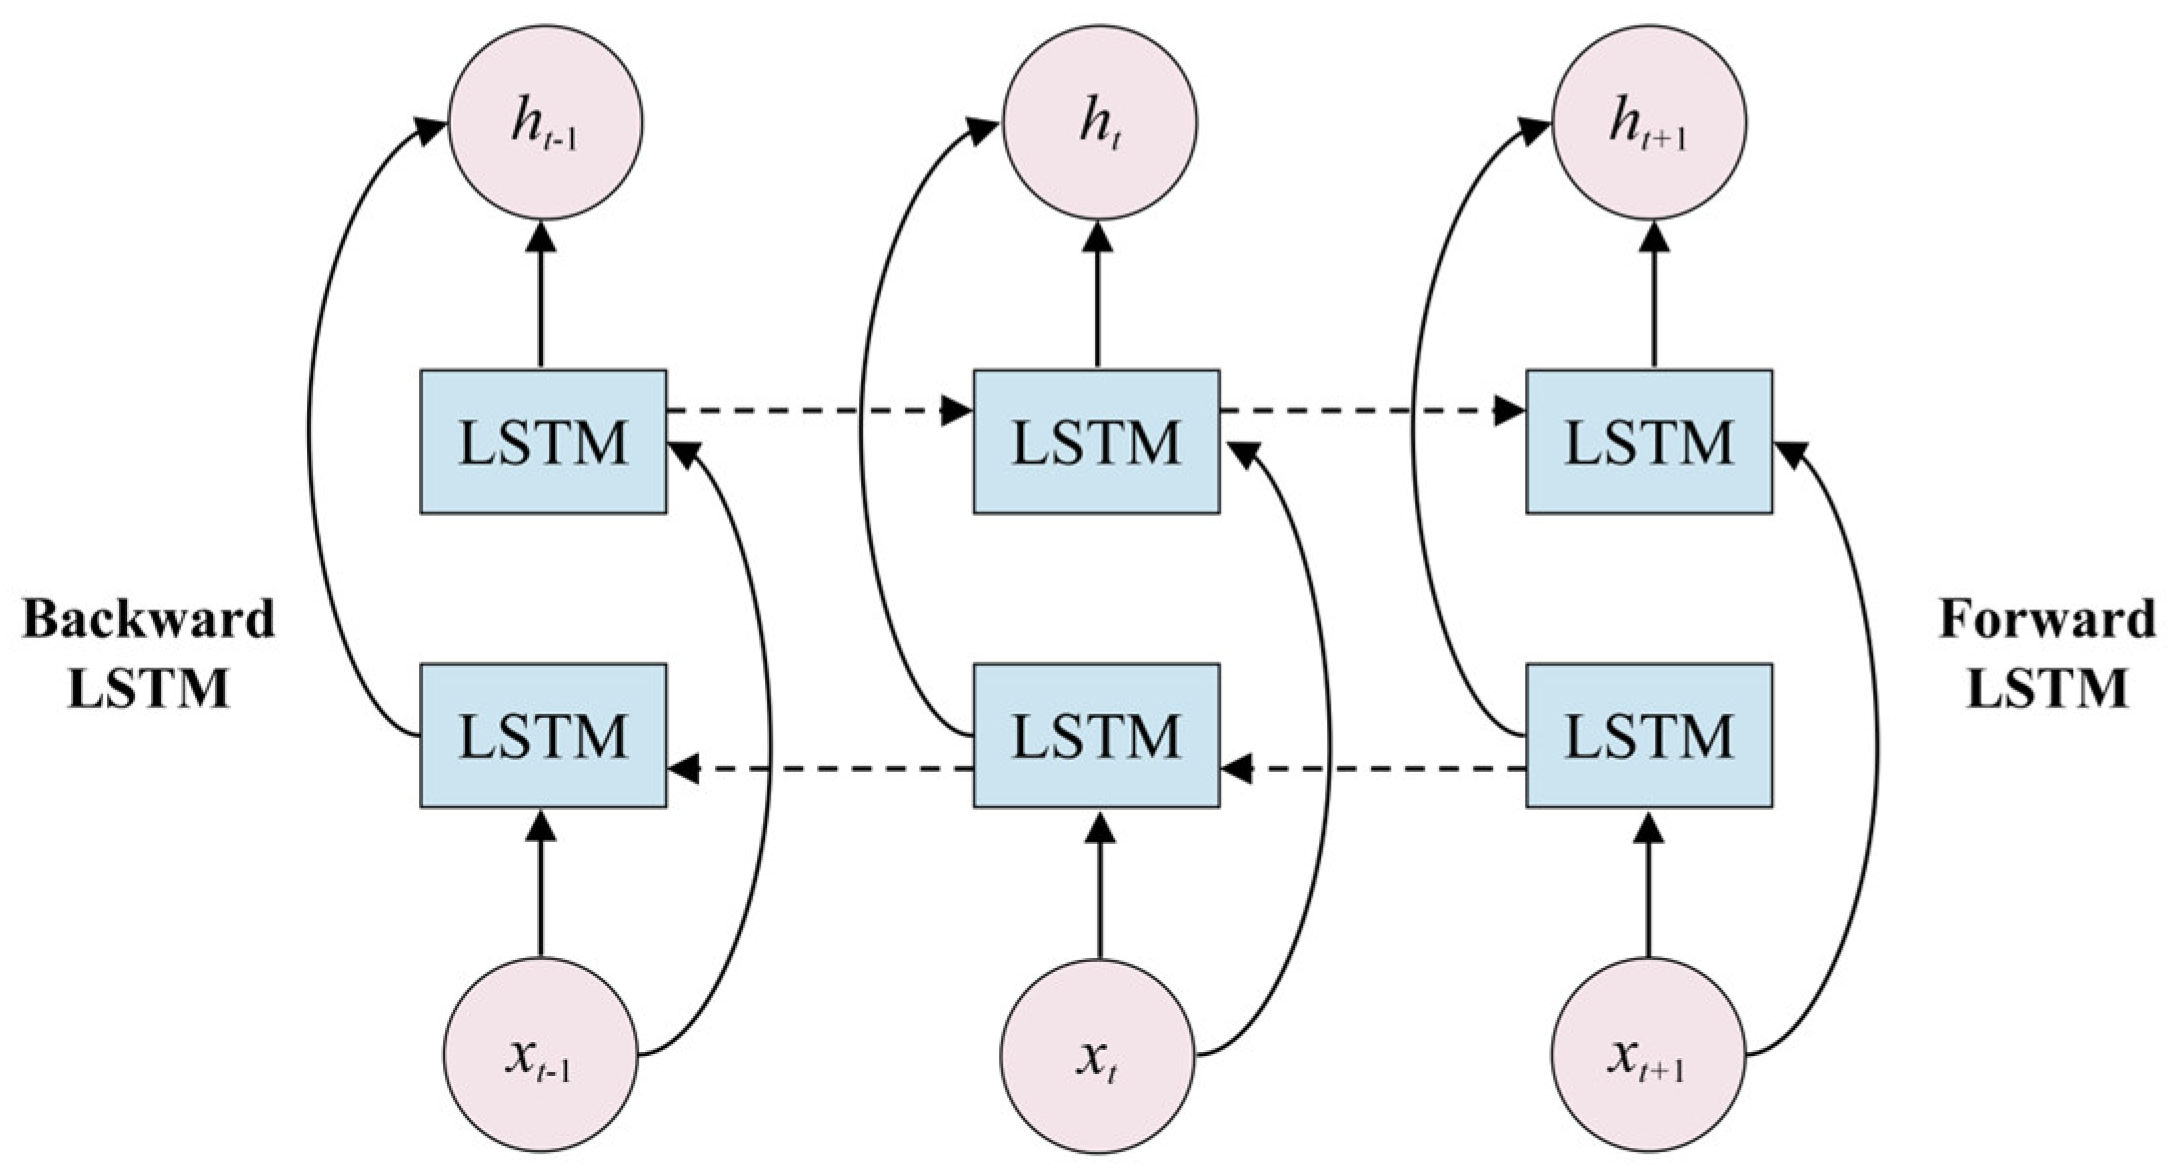
This paper employs a Bidirectional Long Short-Term Memory Network (BiLSTM). The BiLSTM deep learning model, compared to other deep learning models, can simultaneously learn from both past and future temporal features, making better use of the time series characteristics of traffic flow on road segments. As a result, its prediction performance is significantly superior to other deep learning models, allowing for more accurate predictions of future road segment traffic flow. Therefore, it can be used as a method for short-term traffic flow prediction. In the experimental setup for road segment traffic flow prediction in this section, an analysis from a temporal perspective shows that the predictive accuracy of all models decreases as the number of forecast days increases. However, the BiLSTM deep learning model is able to predict road segment traffic flow more accurately [33,34]. The BiLSTM network structure consists of a forward LSTM and a backward LSTM, allowing the feature data of the dataset to simultaneously have both past and future feature information. The network structure of the model is shown in Figure 5.
where is the input data at the moment of , is the forward LSTM implicit layer output information, is the reverse LSTM implicit layer output information, and is the constant coefficient of , which denotes the weight; similarly, is the constant coefficient of , which denotes the weight.
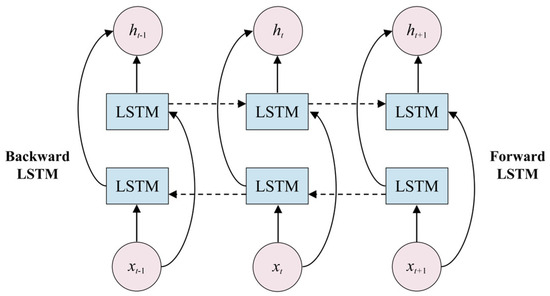
Figure 5.
BiLSTM model network structure.
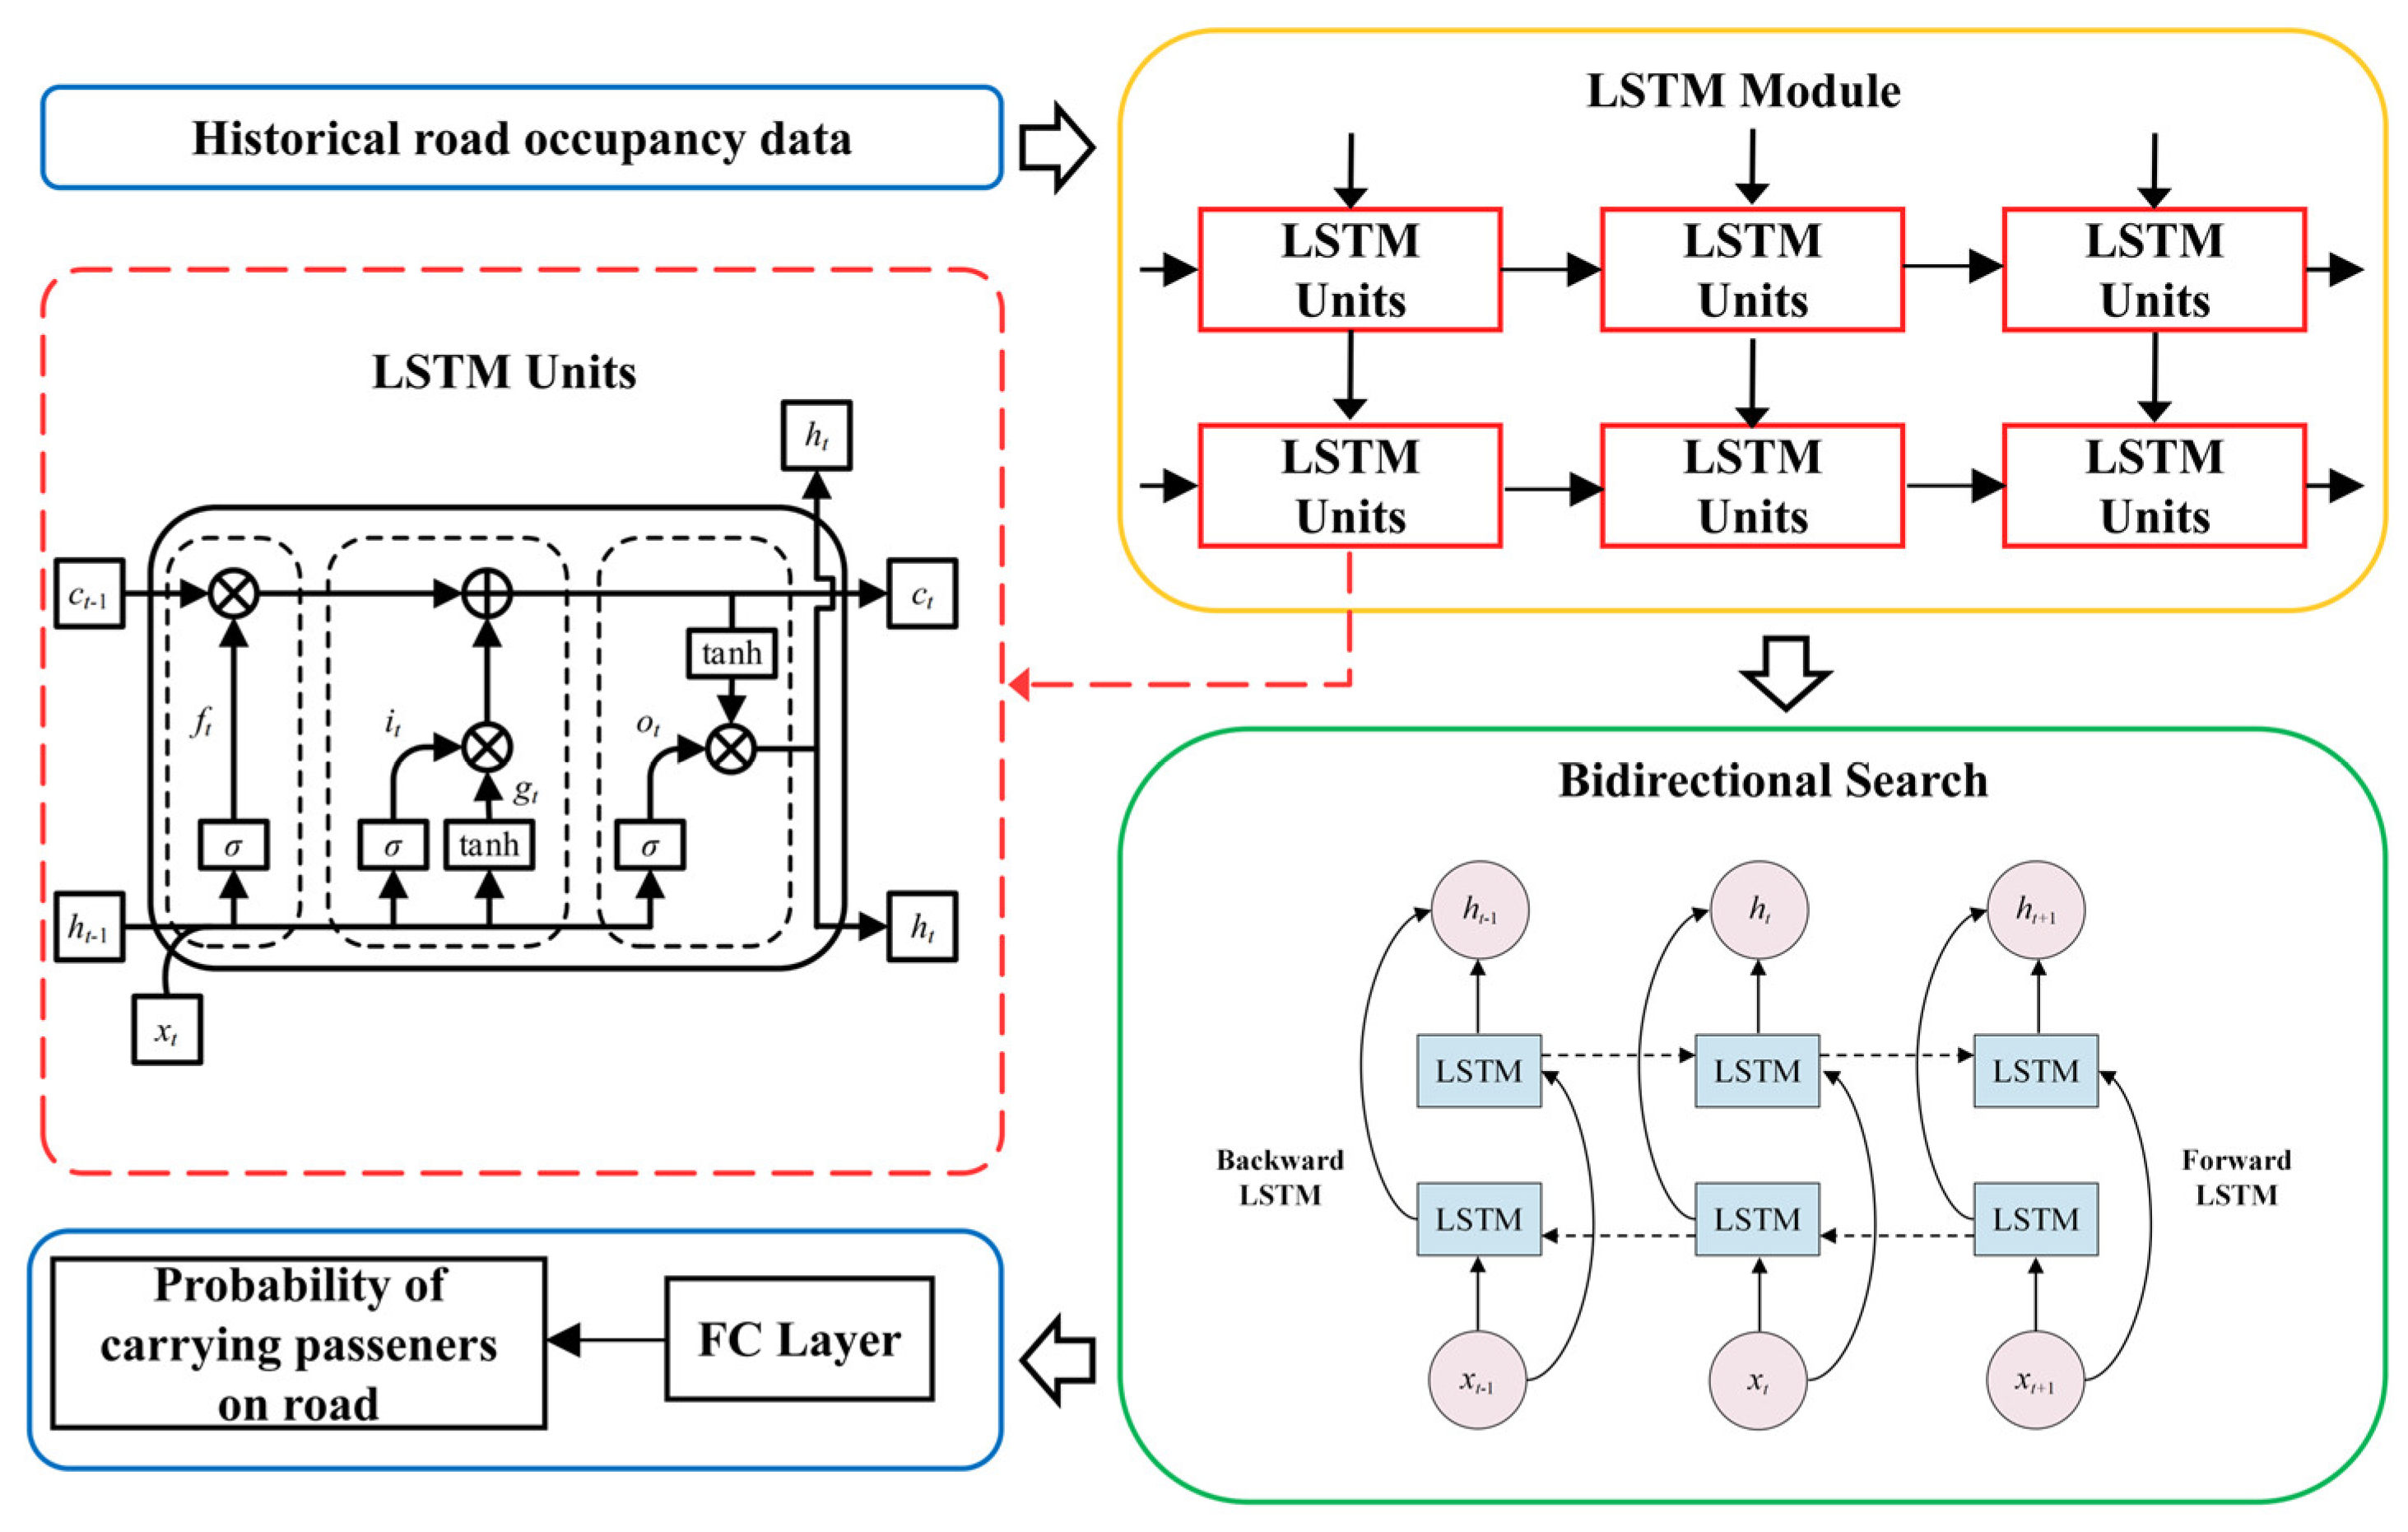
Based on the temporal characteristics of passenger pick-up probability, this paper utilizes the BiLSTM model, which is commonly used for time series prediction tasks, to improve the accuracy of passenger pick-up probability prediction. The BiLSTM model, as shown in Figure 6, follows the main process outlined below:
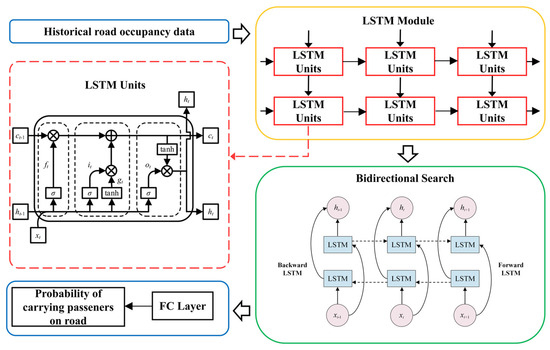
Figure 6.
Prediction model of road passenger load probability based on BiLSTM model.
Step 1: Use historical passenger pick-up data from taxis as input to the LSTM module to extract time-related features.
Step 2: Combine bidirectional search to enhance the LSTM model’s ability to capture bidirectional information, effectively addressing the issue of long-term dependency and gradient vanishing.
Step 3: Use a fully connected layer to construct the number of passengers on taxi roads. This can predict the passenger volume on a particular road at a specific time period (5 min) on a certain day. Finally, calculate the passenger pick-up probability for each road according to the road passenger pick-up probability calculation method.
4.3. Taxi Passenger-Seeking Route Recommendation Model
Based on the known node and route information, a reasonable customer-seeking scheme is developed while satisfying the regional supply–demand ratio and the maximum distance of customer-seeking. The following assumptions are also made in this study when developing the passenger search program:
Assumption 1.
If a passenger is encountered on the road during the process of passenger-seeking, it will go to the passenger’s destination and will no longer go to the passenger-carrying hotspot.
Assumption 2.
The speed of the taxi remains unchanged during the passenger-seeking process, ignoring traffic jams, bad weather, and other situations. Since the research object of this paper is cruising taxis, the waiting time window problem is not considered.
Assumption 3.
The hotspot nodes in the passenger search program have known location coordinates before passenger search, and the passage time and road conditions of the roads at each node are known.
Assumption 4.
The passenger search scheme does not consider the case of carpooling, i.e., the successful passenger search immediately goes to the designated destination of the passenger.
Assumption 5.
Taxi drivers have the qualification of transport hubs to carry passengers and can go to the city’s transport hubs to carry passengers at any time.
Assumption 6.
Taxi passenger-seeking recommended locations for straight-line distances of 20 km from the taxi, which are effective. However, straight-line distances of more than 20 km for taxis do not have a significant recommended passenger-seeking effect.
Assumption 7.
Taxis visit each passenger-seeking hotspot 1 time and do not need to go back to the starting point, looking for passengers during one cruise from the starting point to the end point.
In the process of passenger searching, the primary goal of taxi drivers is to increase the probability of finding passengers and reduce empty running time, with the secondary goal being the shortest path distance [35,36]. Therefore, when optimizing the path for passenger searching, it is not sufficient to simply consider time, distance, or cost. Instead, it is necessary to comprehensively consider factors such as the probability of finding passengers on the roads and the time required to make a reasonable decision for taxi drivers’ passenger searching paths. Therefore, this paper takes the probability of finding passengers as the primary objective for path optimization and considers the shortest distance as the secondary objective. The following passenger searching path optimization model is established in this paper:
where the taxi driver passenger-seeking path optimization problem can be represented as a complete graph ; denotes the set of passenger-carrying hotspot nodes; and denotes the set of arcs. denotes the Manhattan distance between hotspots, and denotes the probability of carrying a passenger. Manhattan distance [37] is a path between two location points from the start point to the end point with only two directions and non-opposite directions.
The objective function (1) represents maximizing the probability of a taxi driver carrying a passenger on the road; the objective function (2) represents the passenger-seeking distance from the starting point to the end point. Constraint (1) represents a non-duplicated, non-bifurcated path from the starting point to the end point, and the meaning of the left-hand side is the difference between the number of paths with node as the starting point and the number of paths with node as the end point. Constraint (2) represents that the problem is an open-ended path planning problem, where there is no need to go back to the starting point; here, we need to pay attention to . Constraint (3) represents that each node only needs to be served by 1 taxi; that is, the search for passengers is successful. Constraint (4) represents that the pathway is 1 if it exists in the shortest path from the starting point to the ending point; otherwise, it is 0. Constraint (5) represents that the distance for searching for passengers can not be more than 48 km.
It is worth noting that in the taxi passenger search problem modeling research, the shortest distance model, minimum cost model, and taxi driver driving experience model have been based on the taxi driver driving experience model. This paper is based on the consideration of the maximum probability of carrying passengers, and due to the dense road traffic network in Chengdu, most of the passenger hotspot nodes are not directly connected to each other. There are many small hotspots between the nodes, the Manhattan distance is chosen for simple calculations, and many paths similar to the Manhattan distance can be found on the actual road, which is of strong practical application significance. Therefore, this section chooses to use Manhattan distance between nodes, which can ensure to find the passenger-seeking driving path with the maximum probability of carrying passengers under the relatively shortest distance.
The NSGA-II algorithm is used to solve the above optimization model. The main difference between the NSGA algorithm and the classical genetic algorithm is the fast, non-dominated sorting during the selection operation, which increases the probability that the excellent individuals are retained. However, the NSGA algorithm still has the disadvantages of high algorithmic complexity, not using elite strategy, and needing to set the sharing radius artificially. In order to improve the shortcomings of the NSGA algorithm, the NSGA-II algorithm adopts fast, non-dominated sorting, which reduces the time complexity; it adopts the method of calculating congestion instead of the adaptation of the sharing radius, which guarantees the diversity of group individuals.
5. Experimental Results
This paper verifies the proposed method based on the taxi trajectory data from Chengdu. The experiments were conducted in a PC environment (Intel(R) Core(TM) i7-7500U, CPU @ 2.70 GHz, 8 GB RAM, 500 GB hard drive). First, the DBSCAN algorithm optimized by grid search was used to cluster the pick-up and drop-off points to determine the starting and ending areas for passenger searching. Then, the number of passenger pick-up points in each road segment between the start and end points was counted, and their passenger probabilities were calculated. The BiLSTM algorithm was used to predict the passenger probabilities on the roads. Finally, a passenger search path optimization model based on road passenger probabilities was established and solved, resulting in a passenger search path with the maximum passenger probability and the shortest possible travel distance.
5.1. Mining of Passenger Search Start and End Points
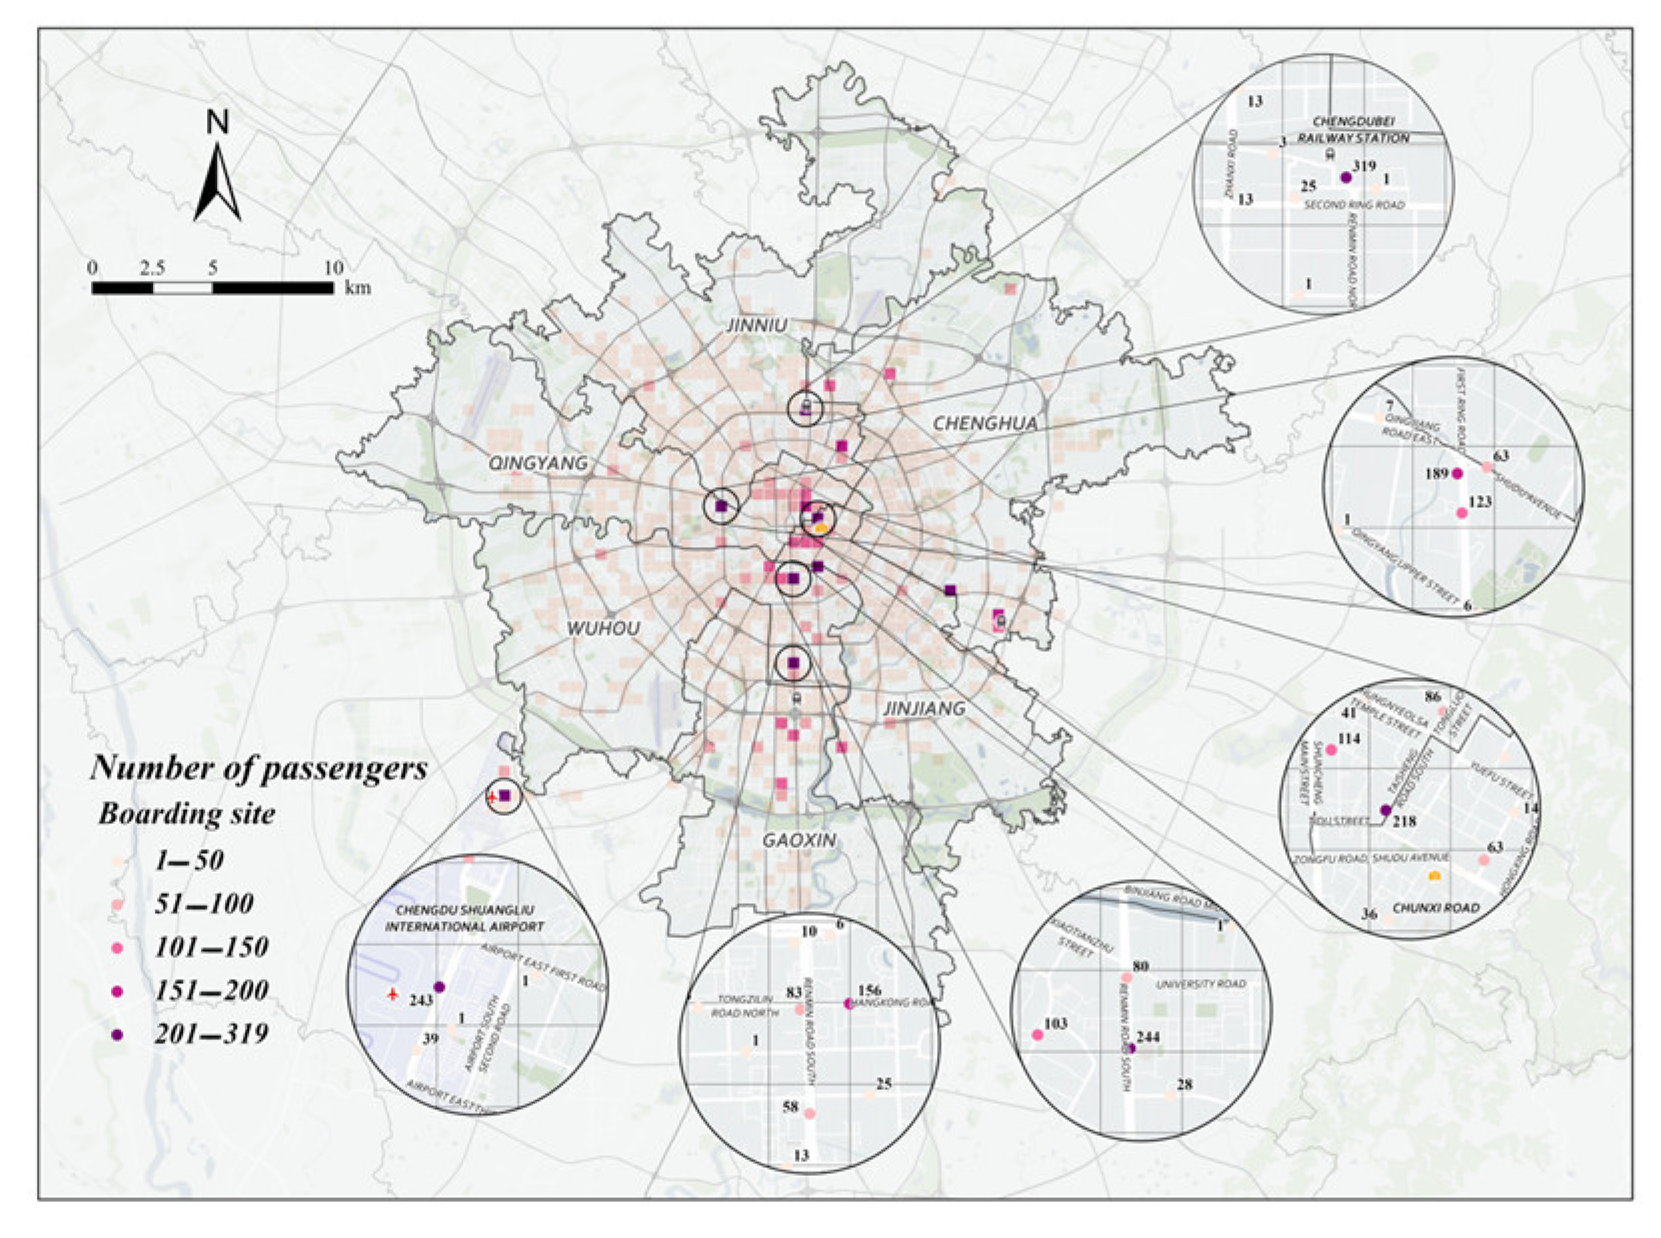
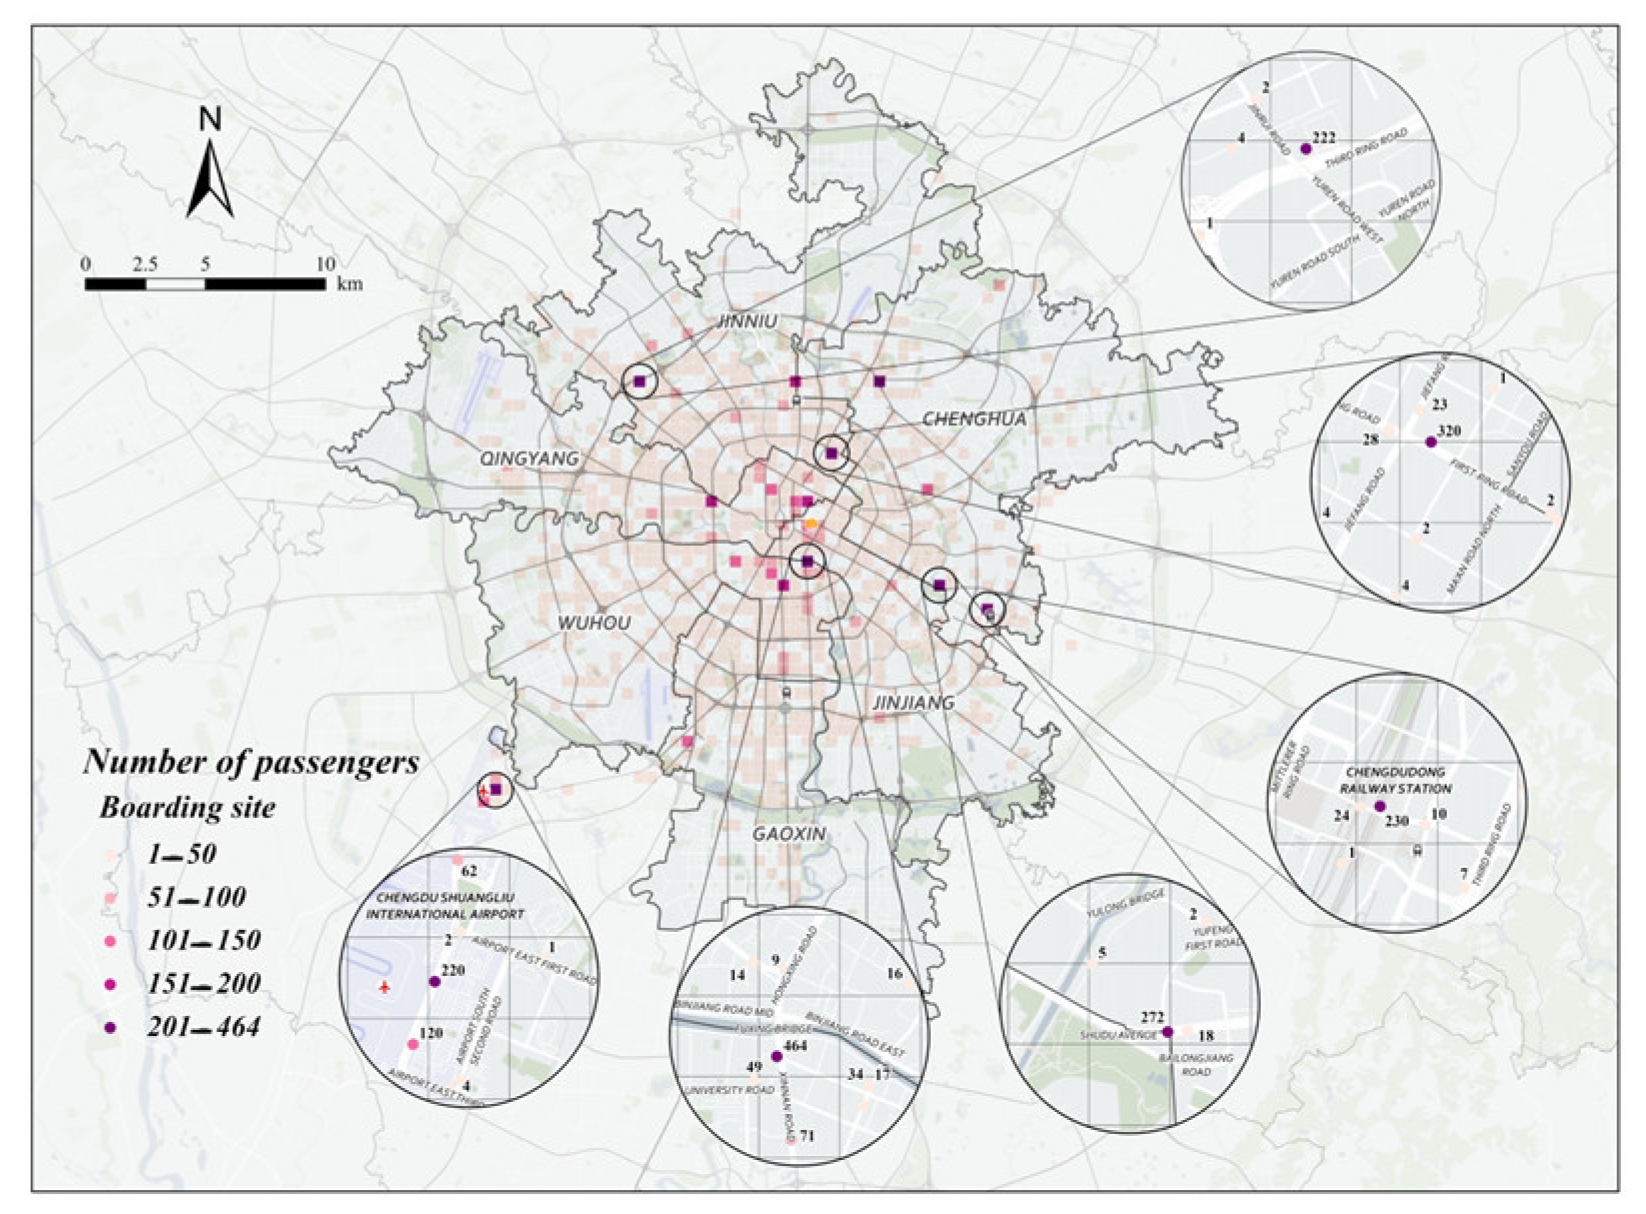
This paper analyzes taxi trajectory data for the morning peak, noon peak, and evening peak on August 18 (a weekday) and August 23 (a non-working day) using the grid-optimized DBSCAN clustering algorithm. The goal is to identify recommended passenger search points for each time period. The specific scheme information is shown in Figure 7 and Figure 8.
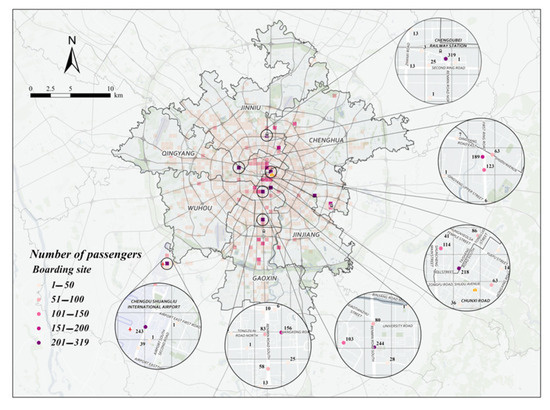
Figure 7.
Specific points recommended for morning peak seeking on August 18 (weekdays).
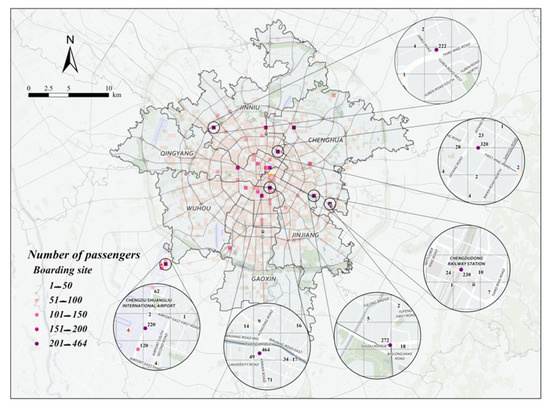
Figure 8.
Specific points recommended for morning peak seeking on August 23 (non-working days).
From Figure 7 and Figure 8, it can be analyzed that the following three phenomena exist in the hot spots of taxi passengers in the morning peak:
- (1)
- During the morning rush hour, loading points are concentrated in Xindu and Wuhou districts;
- (2)
- During the morning peak hour, the highest number of passengers carried on weekdays was at Exit C of Chengdu North Railway Station Metro Station, the highest number of passengers carried on non-weekdays was at Xinnanmen Metro Station, and the number of passengers carried by taxis on non-weekdays was significantly higher than that on weekdays, with a difference of 145 passengers between the two peaks in the morning peak;
- (3)
- During the morning peak hour, weekday loading points come from a complex source, originating from transportation hubs, commercial districts, and hospitals, and non-weekday loading points are generally at transportation hubs.
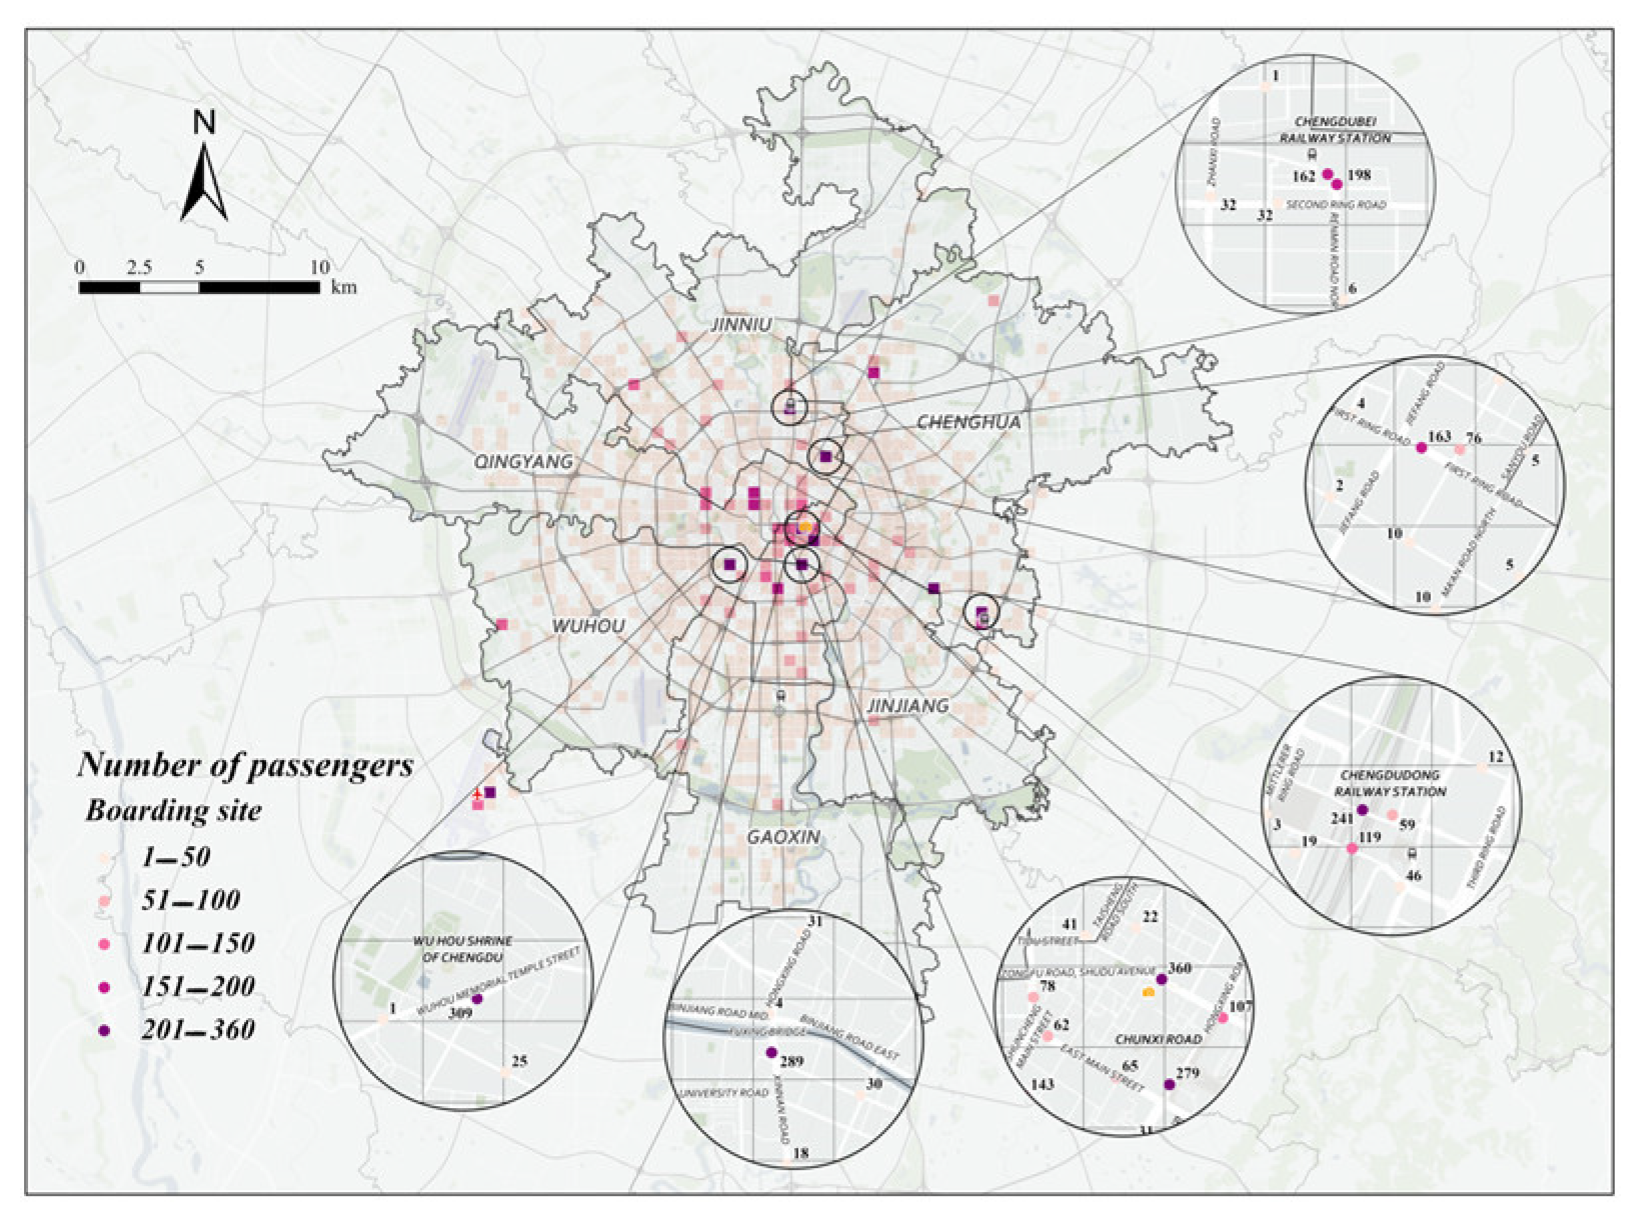
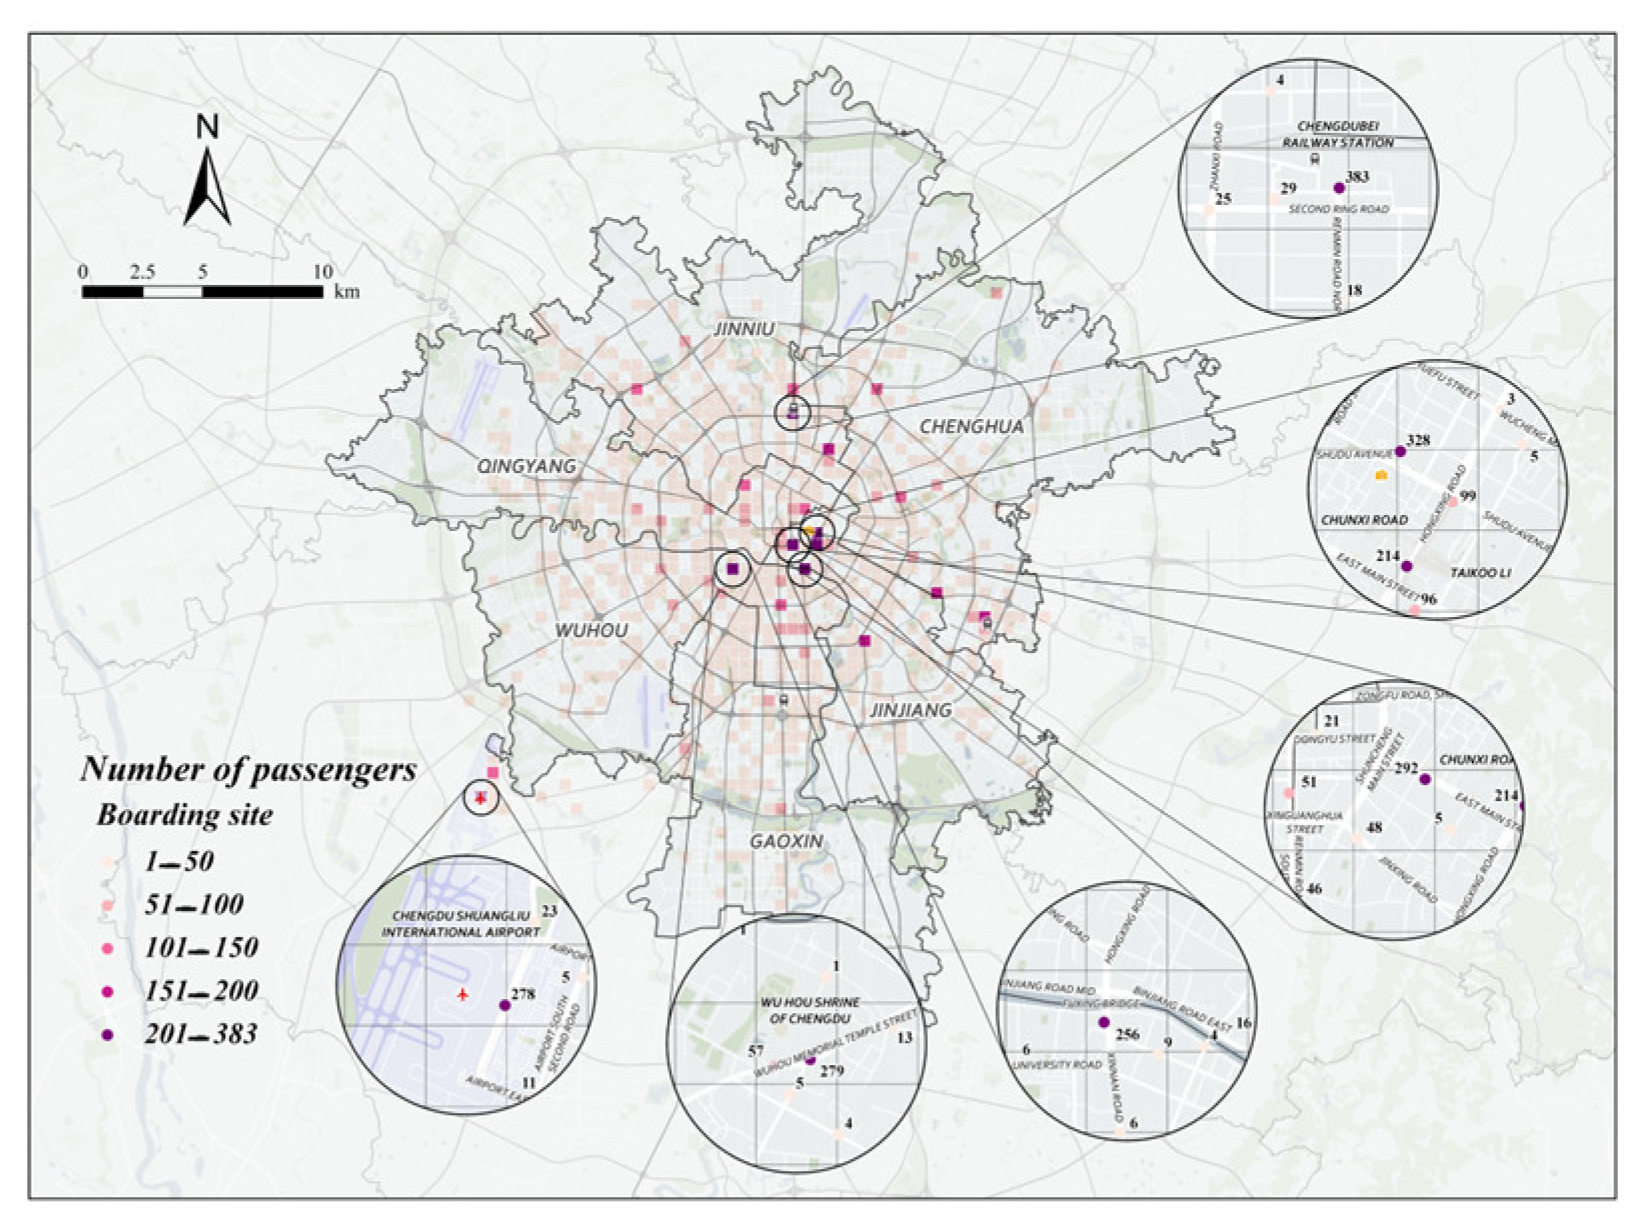
From Figure 9 and Figure 10, we can analyze the following three phenomena in the hot spots of taxi passengers in the afternoon peak:
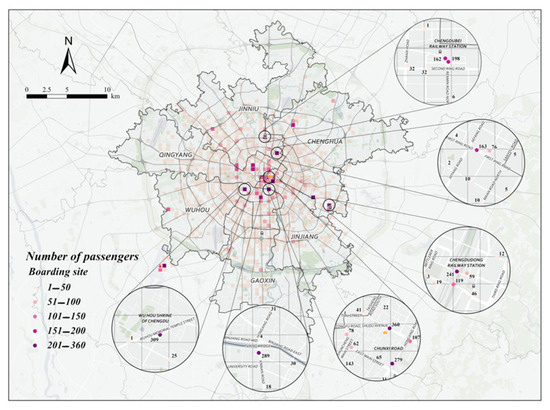
Figure 9.
Specific points recommended for midday peak passenger-seeking on August 18 (weekday).
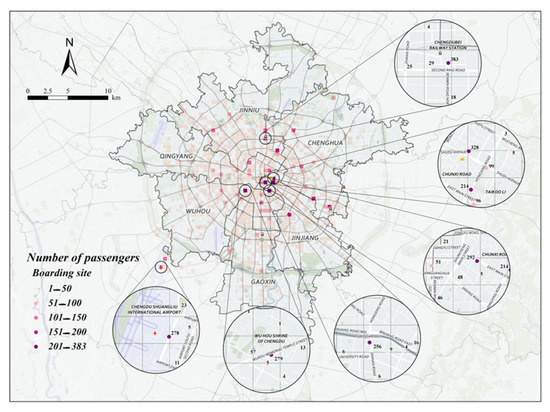
Figure 10.
Specific points recommended for midday peak passenger-seeking on August 23 (non-weekday).
- (1)
- During the midday peak hour, loading points are concentrated in Jinjiang, Wuhou, and Xindu districts;
- (2)
- During the midday peak hour, the highest number of passengers carried on weekdays was at the Commercial Grounds Shopping Center, the highest number of passengers carried on non-weekdays was at the North Train Station, and there was almost no difference in the highest point of the midday peak between weekdays and non-weekdays;
- (3)
- During the midday peak hour, unlike the morning peak hour, the loading points are concentrated at the entrances of commercial districts and scenic spots, and the rest are at the transportation hubs, both on weekdays and non-weekdays.
Based on the analysis of passenger hotspots during morning, noon, and evening peak hours on both weekdays and non-working days, the following four conclusions can be drawn:
- (1)
- Regardless of whether it is the morning, noon, or evening peak hours, passenger pick-up points are concentrated in Wuhou District, Jinjiang District, and Xindu District;
- (2)
- During weekdays, the types of passenger pick-up points during morning and evening peak hours are diverse, including locations such as hospital entrances, transportation hubs, and commercial areas. During non-working days, the noon and evening peak pick-up points are significantly concentrated in commercial areas;
- (3)
- Whether on weekdays or non-working days, Chengdu Shuangliu International Airport T2 Terminal and Chengdu North Railway Station consistently rank among the top in terms of taxi passenger numbers;
- (4)
- The number of taxi passengers on non-working days is approximately 22% higher than on weekdays. Taxi drivers can adjust their operating hours accordingly to optimize their service during these periods.
Taking the recommended area for taxis in the morning peak on August 18 as an example, the three basic indicators of the recommended area for taxi passenger search are shown in Table 3.
Table 3.
Basic information on recommended areas for taxi passenger-seeking in the morning peak on August 18th.
Based on the entropy weight-TOPSIS method, the ranking results of recommended taxi areas during the morning rush hour on 18 August are as follows: Shuangliu Airport, Provincial Hospital, Evergrande Plaza, Chengdu North Railway Station, Sichuan University, and RT-Mart. Similarly, the evaluation results of recommended points during the morning, noon, and evening rush hours on 18 August and 23 August were calculated, and the top recommended points for each time period were identified as follows: Shuangliu Airport, Dongkezhan Subway Station, Chengdu North Station, Shuangliu Airport, Xinnanmen Subway Station, and Shuangliu Airport.
5.2. Road Passenger Point Statistics
Resident travel demand varies over time, leading to changes in passenger hotspot areas. Therefore, by comprehensively considering the travel demand within each area and the supply of taxis, we establish a regional passenger probability model to determine the road passenger probability, which serves as a crucial indicator for taxi drivers’ route choices [38]. The probability of carrying passengers in different areas is modeled as follows:
where represents the probability of carrying passengers in the road area, represents the number of pick-up points in the order data in the area, represents the sum of the number of all orders in the study area, and denotes the number of hotspots for carrying passengers. The larger the value of , the greater the attractiveness of the area to taxi drivers.
After determining the number of passengers for each road segment, the probability distribution can be directly calculated based on the current scheme. Similarly, the passenger probability for different time periods can be obtained. As the scheme and time change, the road passenger probability also varies. For instance, during the evening peak period from 18:55 to 19:00 on August 18, the passenger probability distribution is as follows: Second Ring Elevated Road (0.181), East Third Section of First Ring Road (0.03), Jindong Section of East Street (0.2), East Third Section of Second Ring Road (0.045), Second Ring Road (0.076), North Renmin Road (0.076), North Fourth Section of Second Ring Road (0.045), Second Section of Fuqing Road (0.045), Shuanglin Road of Xinhua Avenue (0.045), North Fourth Section of First Ring Road (0.091), East Second Section of First Ring Road (0.045), and Huaxing Road (0.121).
5.3. BiLSTM Predicts the Probability of Carrying Passengers
This study employs BiLSTM to predict passenger probability and conducts a comparative analysis of prediction accuracy with BP and LSTM models. Both the hidden and output layers use the ReLU activation function. The design of the BiLSTM and LSTM passenger volume models is similar to DFN, with added dropout regularization to prevent overfitting and a parameter set to 0.5. The number of nodes in the hidden layer is set to 128. The parameter settings of the BiLSTM and LSTM prediction models constructed in this study are shown in Table 4.
Table 4.
Model parameters.
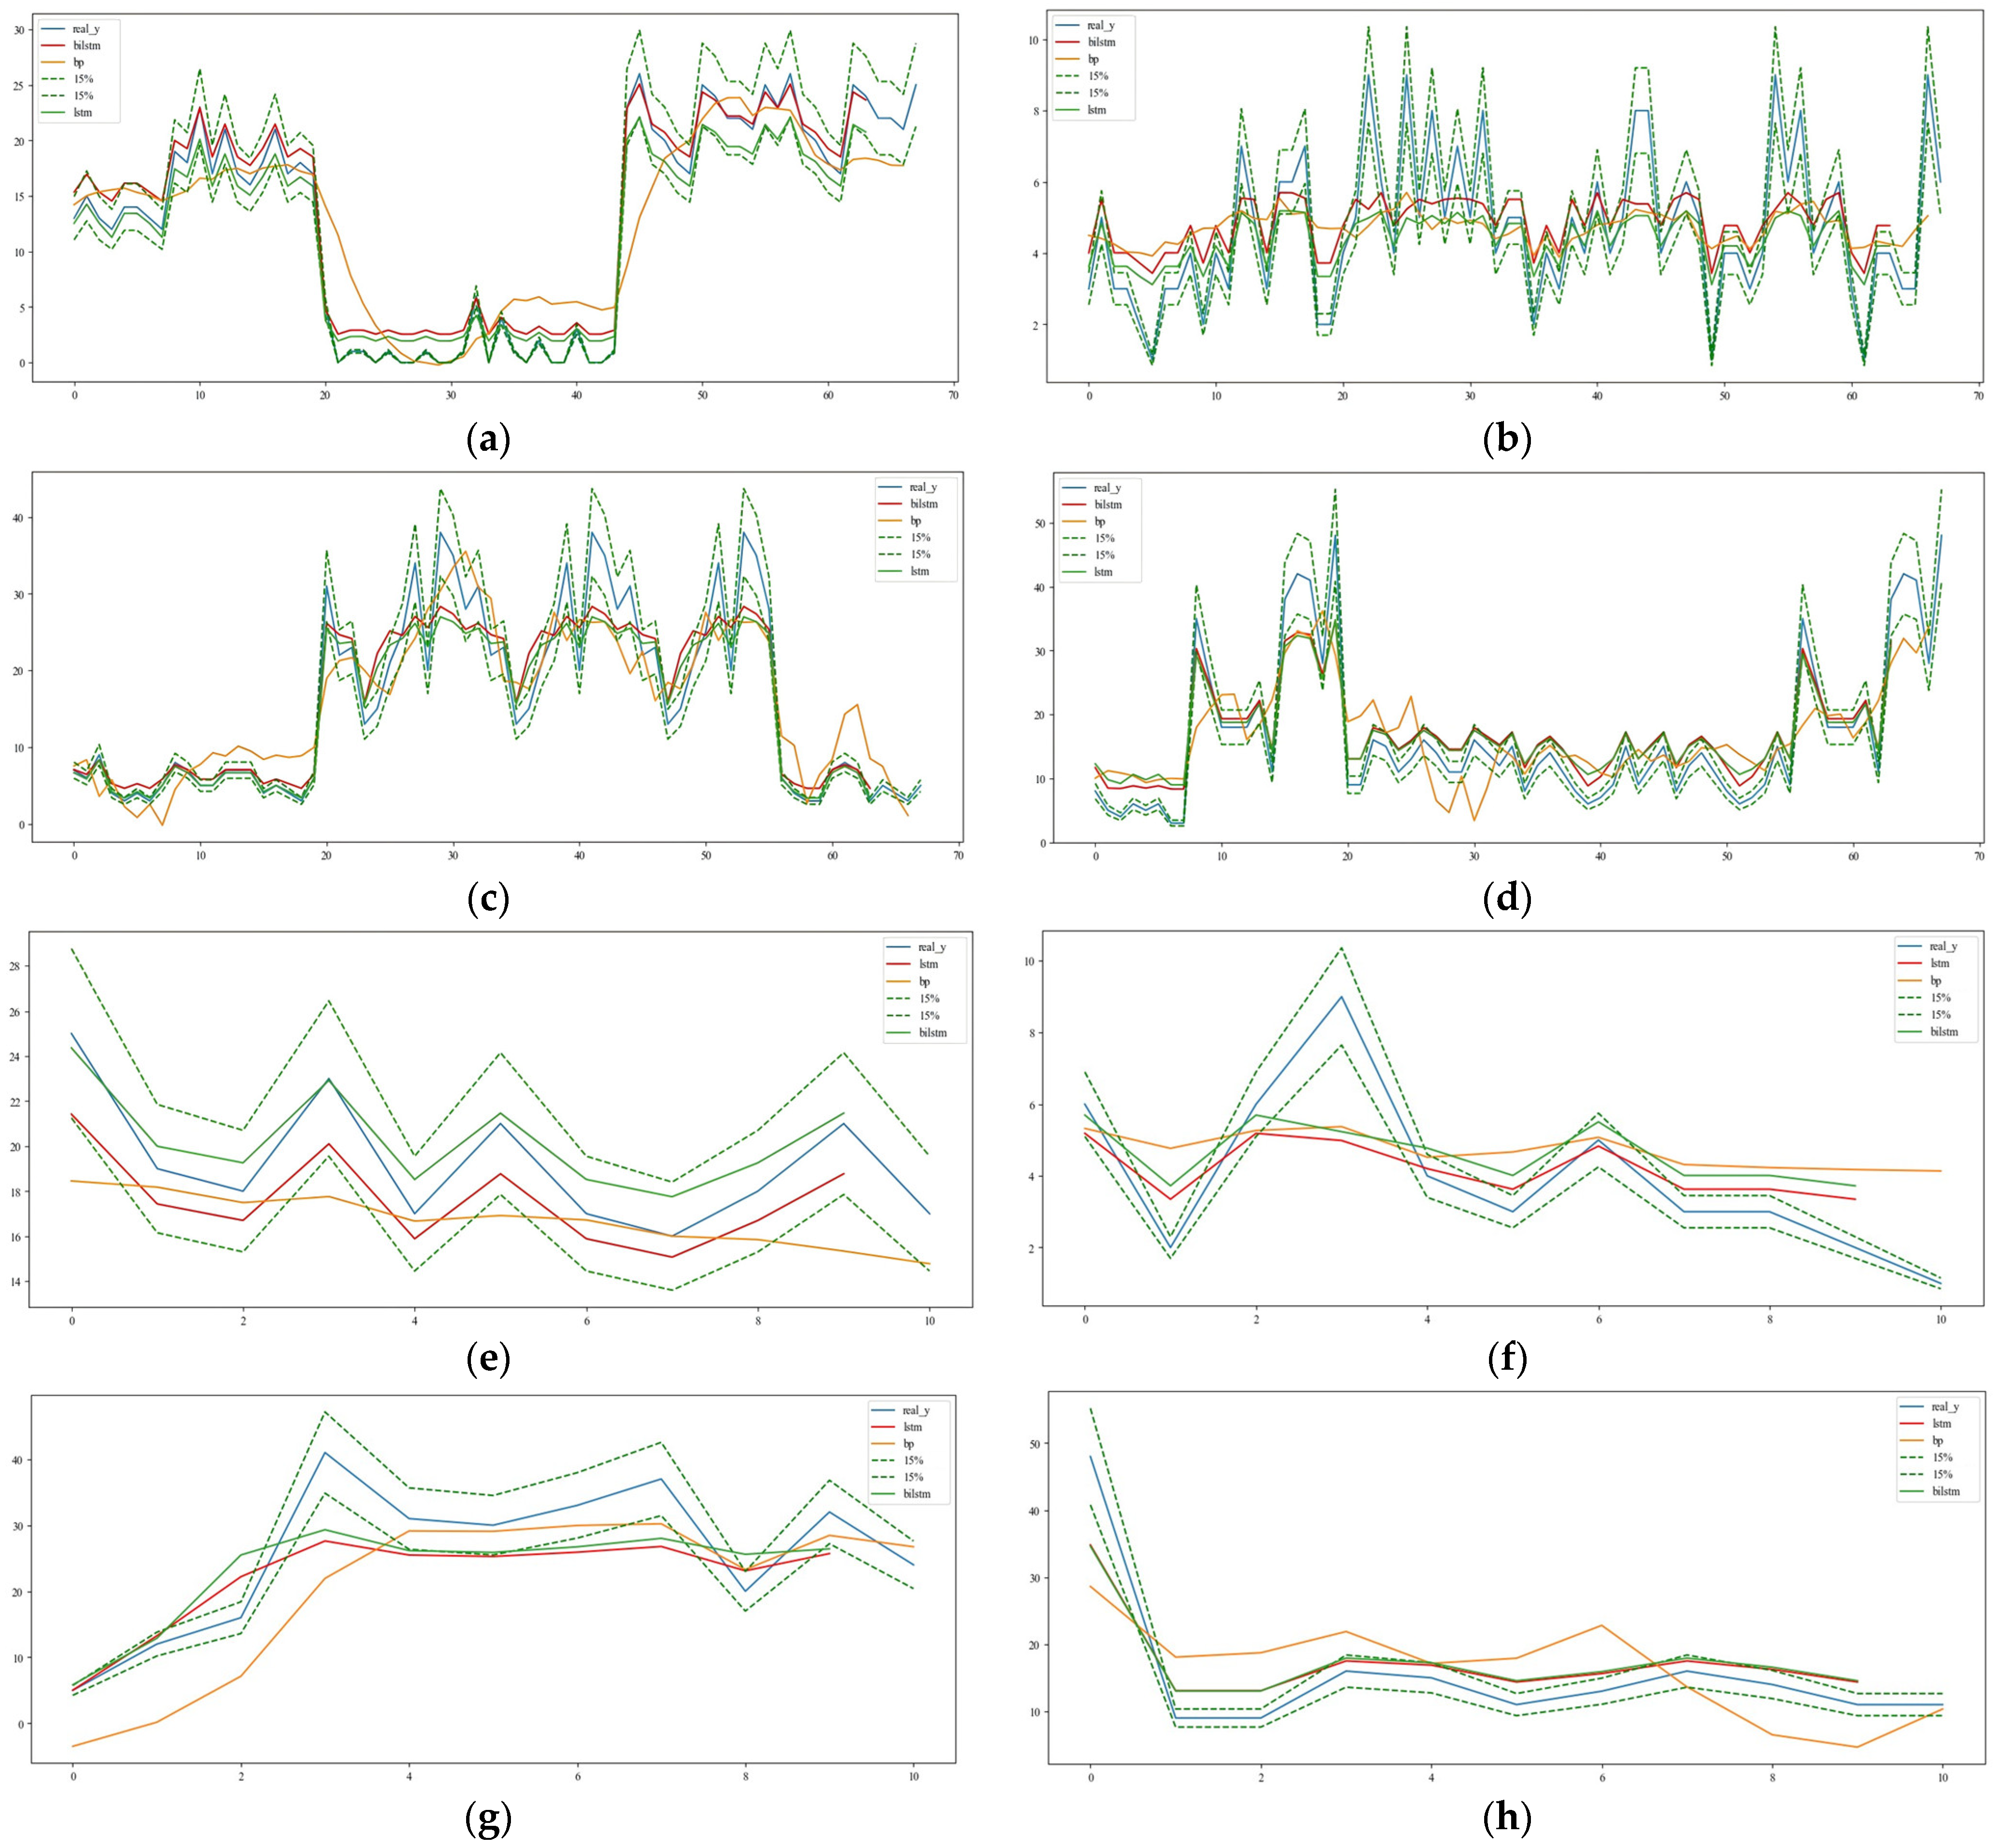
To observe and analyze the models’ ability to predict short-term road segment traffic, as well as the differences in predictive capabilities among the models, BP, LSTM, and BiLSTM deep learning models were used to predict road segment passenger volume during the evening peak period. Ten experiments were conducted to obtain the average MSE. The training and prediction results are shown in Figure 11.
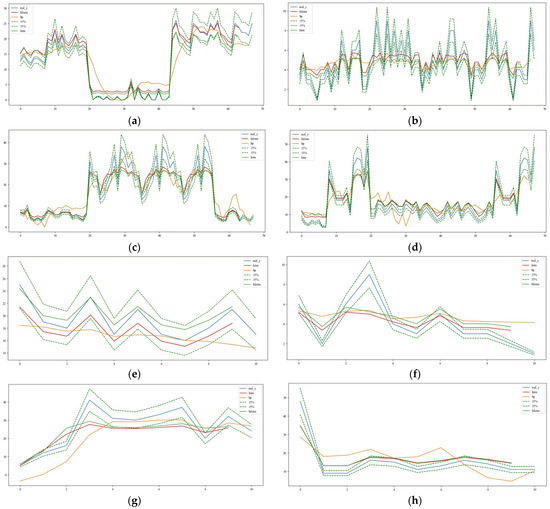
Figure 11.
Model training results and prediction results. (a) Training results for the dataset of section a of the Second Ring Elevated Road; (b) training results of Chengdu Airport Highway dataset; (c) training results for the East Main Street and Upper East Main Street segment dataset; (d) training results for the dataset for section b of the Second Ring Viaduct; (e) predicted results of the dataset for section a of the Second Ring Viaduct; (f) prediction results of the Chengdu Airport Expressway dataset; (g) predicted results for the East Street Upper and East Street Segment dataset; (h) prediction results of the dataset for section b of the Second Ring Viaduct.
The mean square error is the expected value of the square of the difference between the estimated value of the parameter and the true value of the parameter, and it is denoted as MSE, which can be used as a measure of the degree of variability of the data, which is calculated as follows:
where is the real data, is the fitted data, and is the number of samples
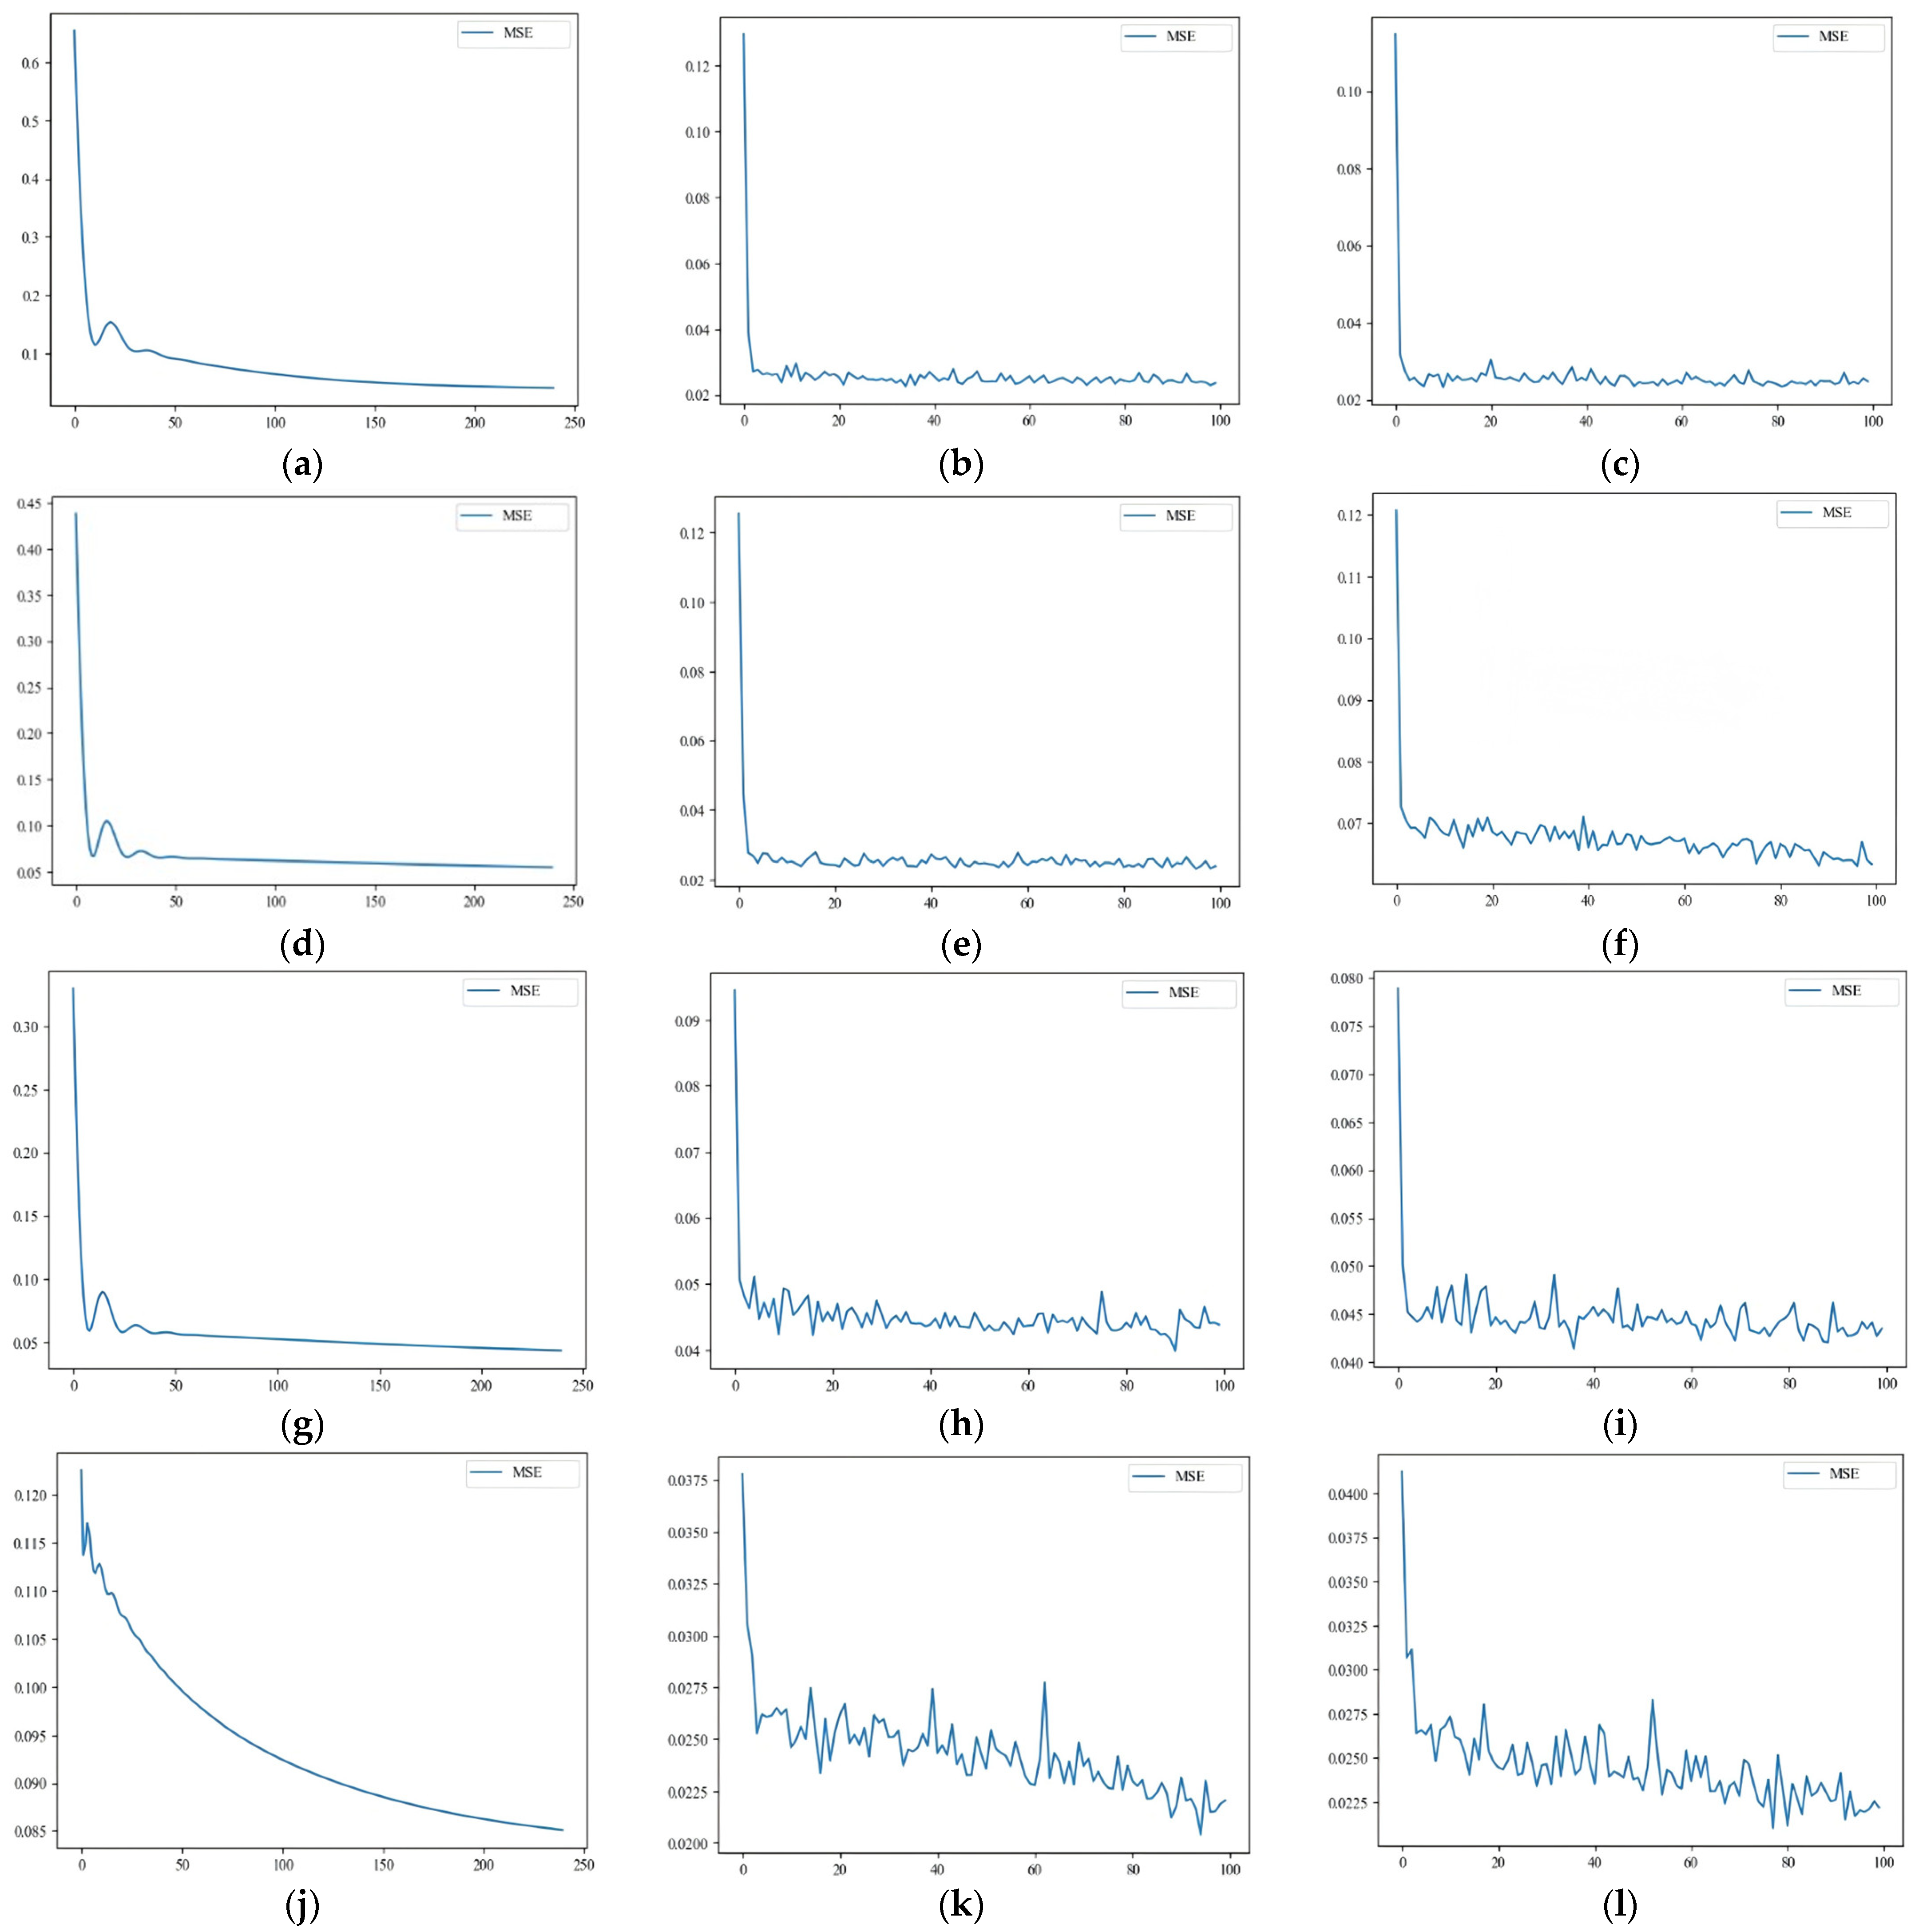
Taking the mean square error as the loss function, the convergence curves of the four cases are obtained, as shown in Figure 12. In the following figures, Figure 12a–c show the data convergence curves for section a of the Second Ring Elevated Road, Figure 12d–f show the data convergence curves for the Chengdu Airport Expressway, Figure 12g–i show the convergence curves for the section of East Street on East Main Street, and Figure 12j–l show the data convergence curves for section b of the Second Ring Elevated Road.
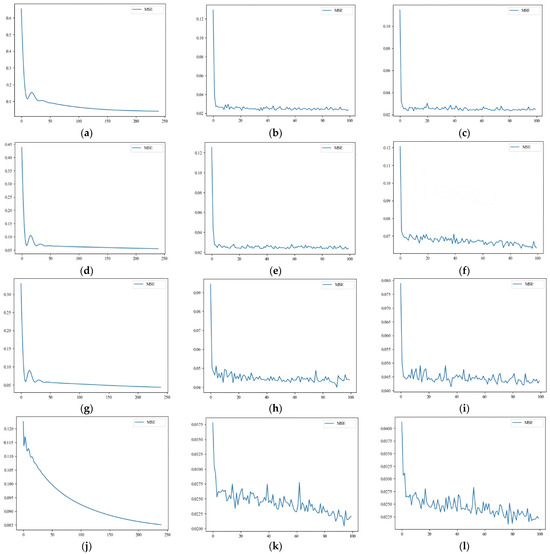
Figure 12.
Convergence curves. (a) BP network convergence curve; (b) LSTM network convergence curve; (c) convergence curve of BiLSTM network; (d) BP network convergence curve; (e) convergence curve of LSTM network; (f) convergence curve of BiLSTM network; (g) BP network convergence curve; (h) convergence curve of LSTM network; (i) convergence curve of BiLSTM network; (j) BP network convergence curve; (k) LSTM network convergence curve; (l) convergence curve of BiLSTM network.
After comparing the model training results, it was found that the BP network model converges significantly slower than the LSTM and BiLSTM networks. The BP network converges at around 250 epochs, while the LSTM and BiLSTM networks converge at around 80 epochs. The MSE loss values are 0.034 for the BP network, 0.033 for the LSTM network, and 0.031 for the BiLSTM network. The BiLSTM deep learning model has a prediction accuracy that is 9.67% higher than the BP deep learning model and 6.45% higher than the LSTM deep learning model. Therefore, the BP network has a slower convergence rate and poorer fitting performance compared to the BiLSTM and LSTM networks; under the same number of epochs, the BiLSTM network’s fitting performance is superior to that of the LSTM network.
5.4. Path Optimization Based on Passenger-Carrying Probability
5.4.1. Description of the Two-Stage Passenger-Seeking Problem
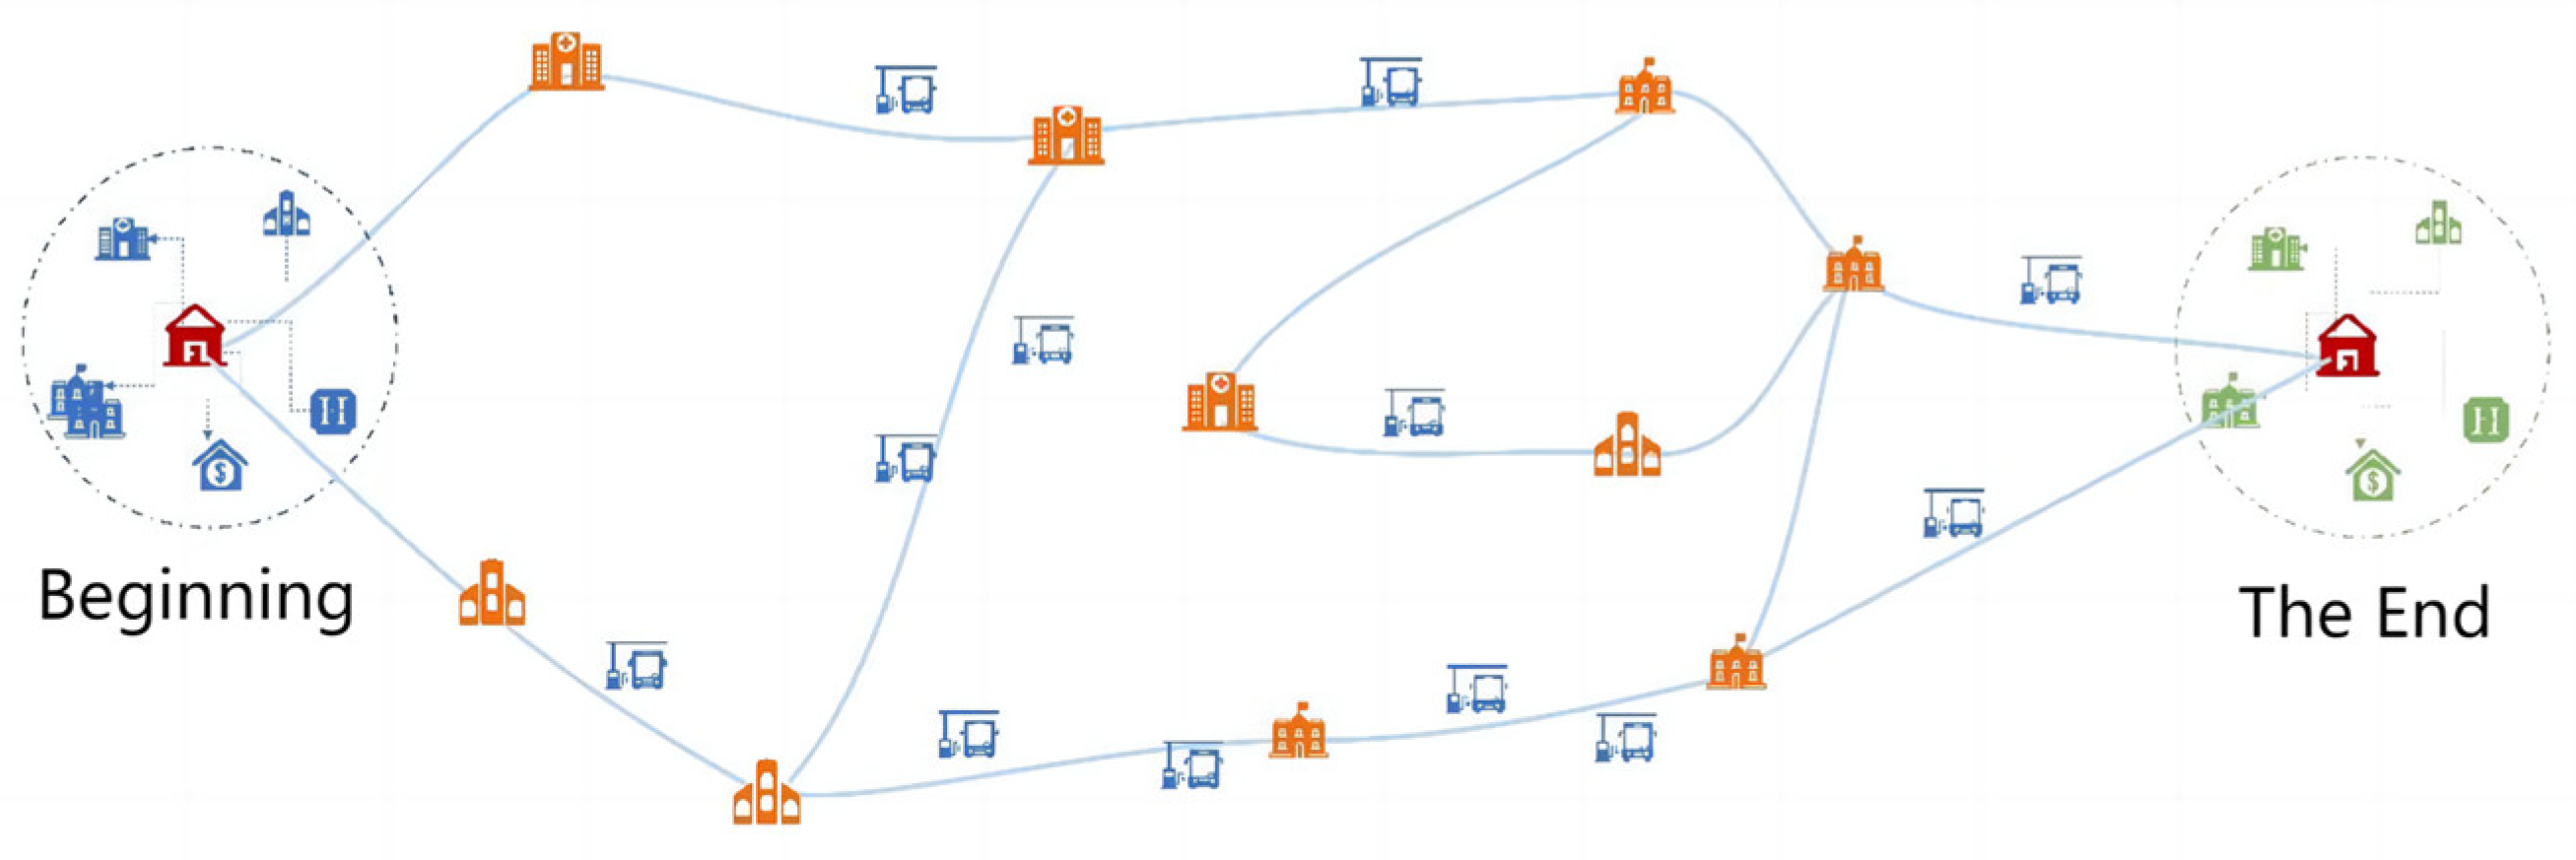
In reality, taxi drivers begin searching for passengers from their drop-off points, choosing an area (hotspot area) where they believe they are most likely to find passengers as their destination based on their experience. They also select road segments where they are more likely to find passengers. If they pick up a passenger on the way to the destination, it is considered a successful search, as illustrated in Figure 13. This study abstracts this problem into an undirected network path problem from the starting point to the destination. The areas around the starting and ending points are large drop-off and pick-up hotspot areas, respectively, and the path should pass through various smaller pick-up hotspot areas as much as possible. Unlike traditional passenger search path optimization models, the model constructed in this study stops the search as soon as the driver finds a passenger on the path without necessarily reaching the destination. Therefore, it fundamentally aims to optimize the path to increase the probability of finding passengers.
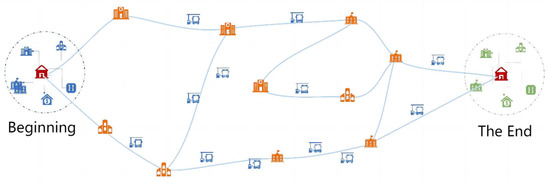
Figure 13.
Schematic diagram of the passenger search problem.
This study subdivides the taxi driver’s passenger search process into two states: the first state is the search process from the drop-off area to the first passenger search area; the second state is the process from the first passenger search area to the second passenger search area [39,40]. When taxi drivers begin their search for passengers, they first need to identify several passenger hotspot areas that are relatively close to them during the current time period. Then, they rank these areas according to their preferences and proceed to each area in sequence or search for passengers while en route.
5.4.2. Path Optimization Scheme
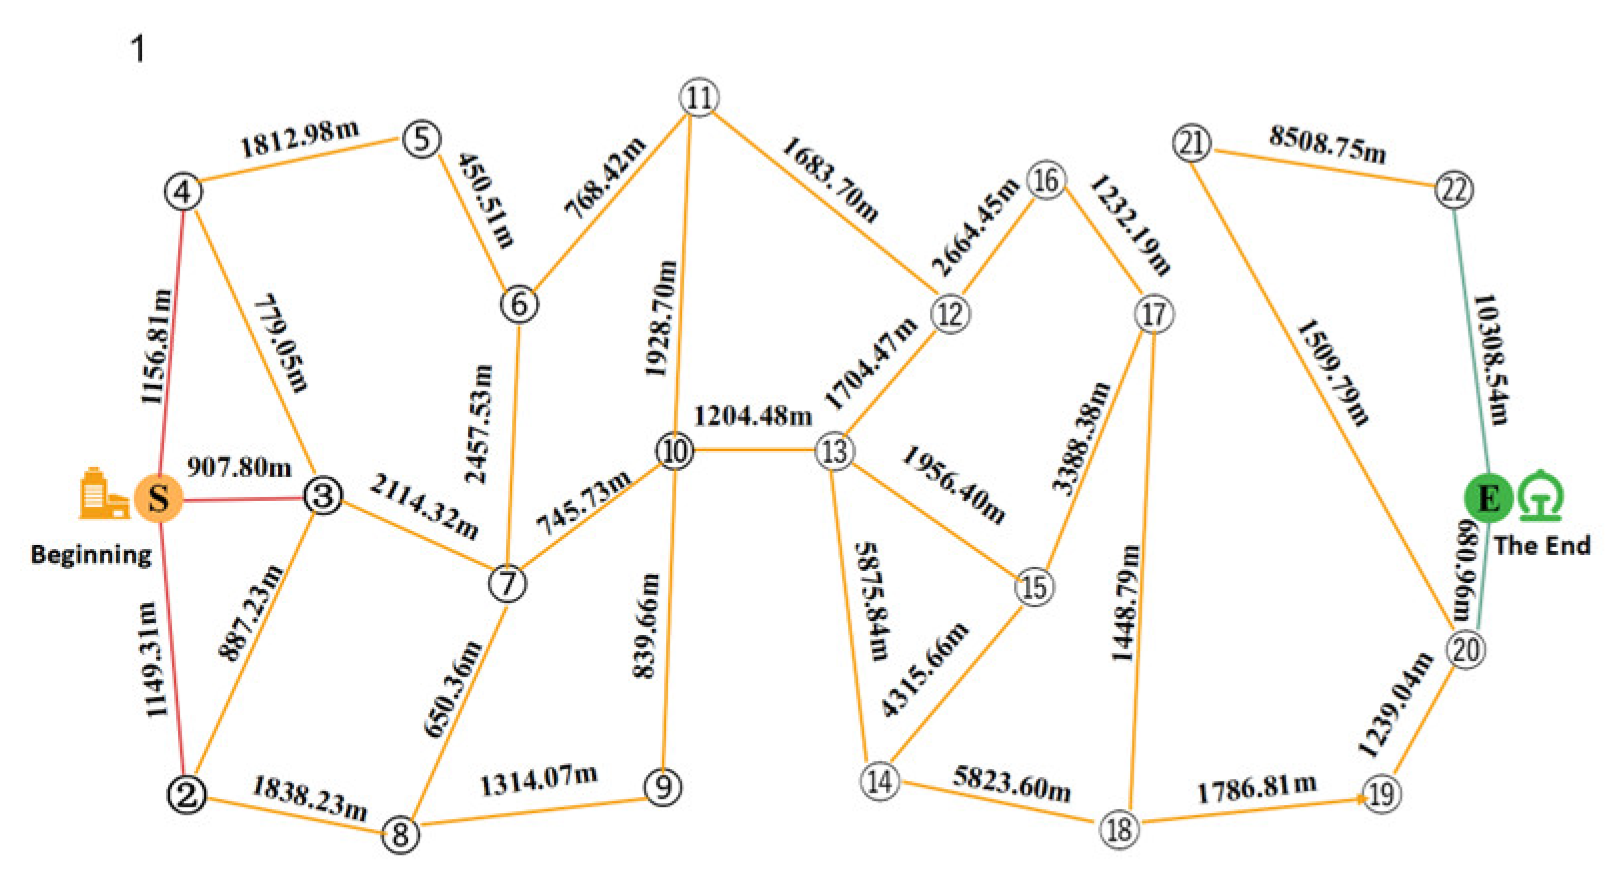
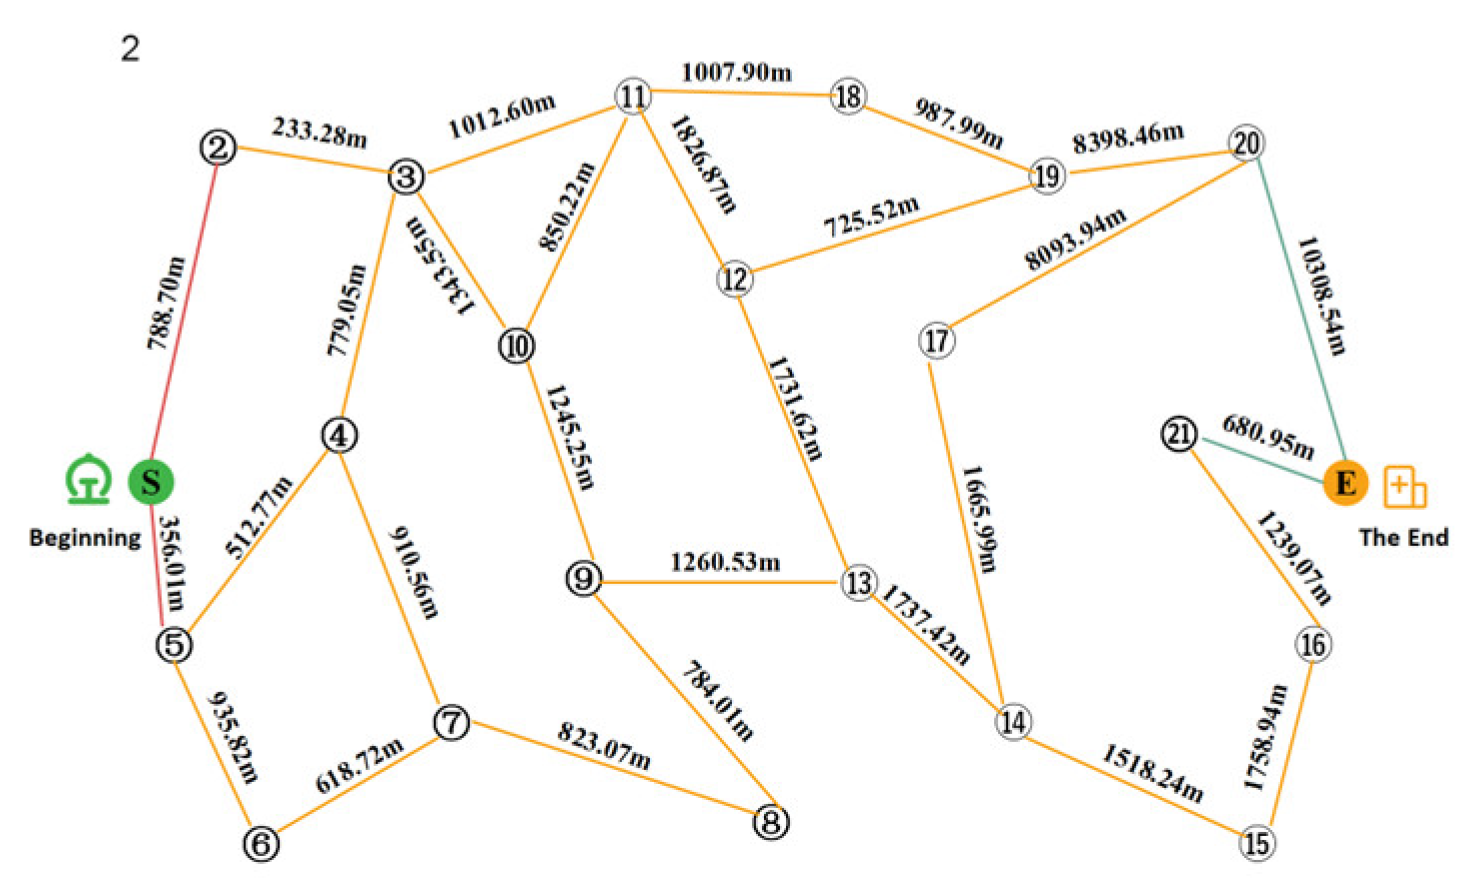
In this paper, we take the evening rush hour as an example to develop the corresponding phased passenger search strategy. The passenger search road network is shown in Figure 14 and Figure 15, respectively. Figure 14 shows from Jinjiang Wanda Plaza to Chengdu North Railway Station, and Figure 15 shows from Chengdu North Railway Station to Sichuan Fourth People’s Hospital.
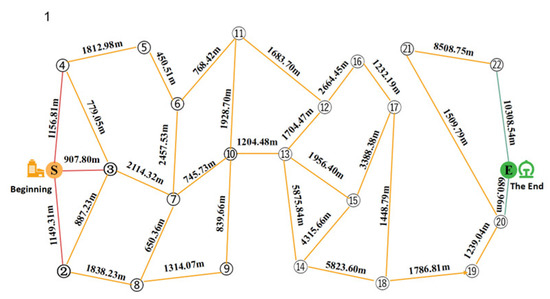
Figure 14.
State 1: Passenger-finding road network from the drop-off point to the first pick-up referral point.
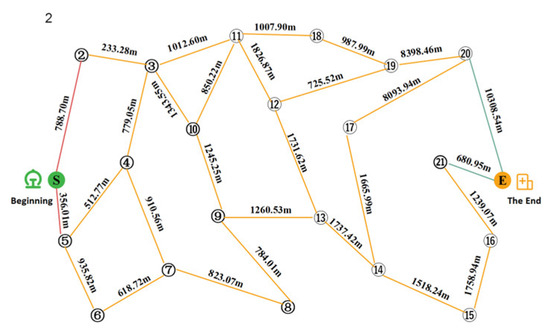
Figure 15.
State 2: Passenger-finding road network from the first recommended passenger-finding point to the second recommended passenger-finding point.
Table 5.
State 1: Solved set of passenger-seeking scenarios from the lower passenger point to the first upper passenger referral point.
Table 6.
State 2: Solution set for the passenger search program from the first recommended passenger search point to the second recommended passenger search point.
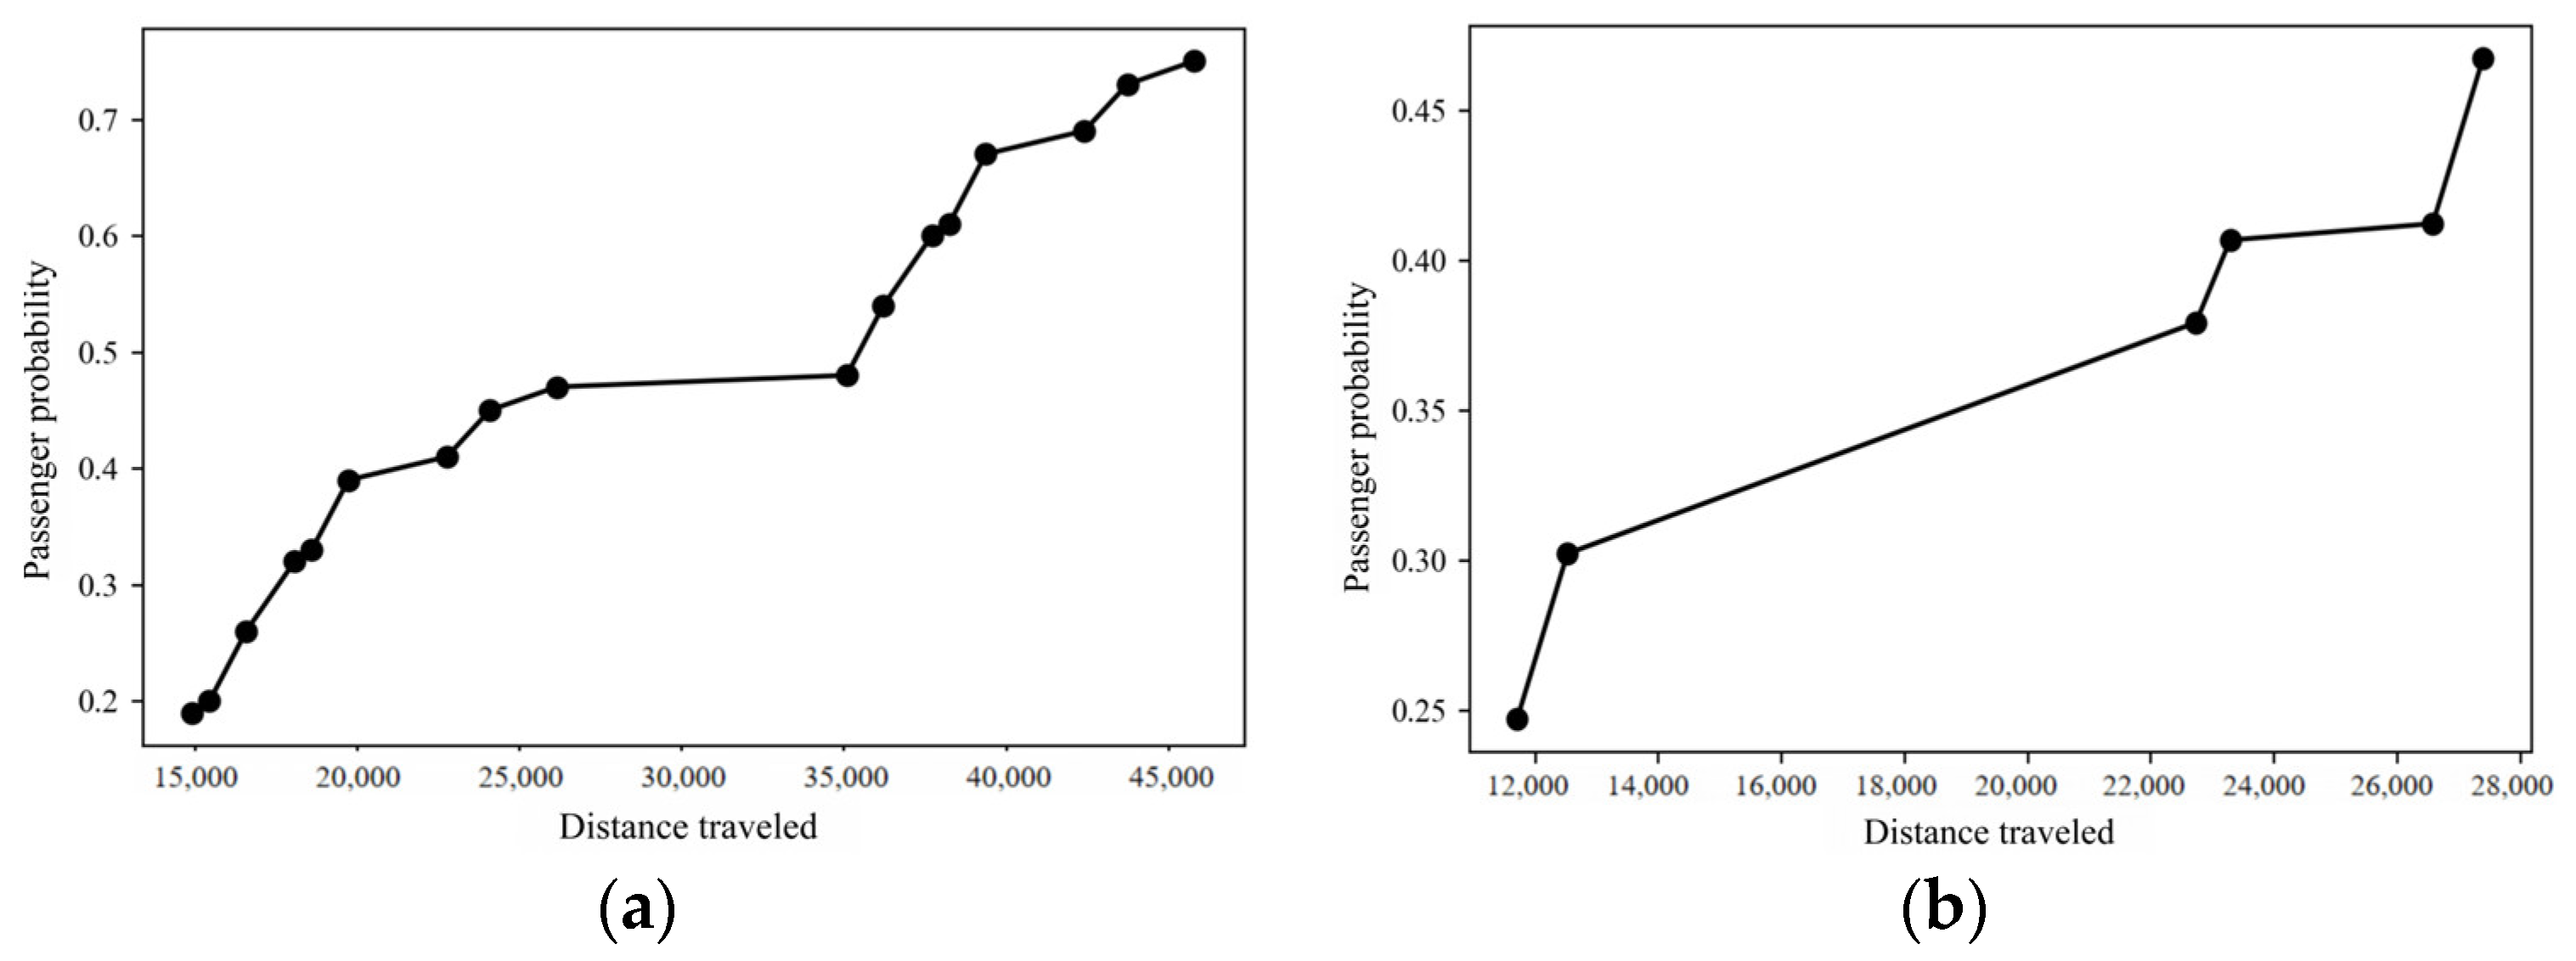
The primary task in solving multi-objective optimization problems is to find as many representative, optimal Pareto solutions as possible without bias and select the desired optimization results from them. The NSGA-II algorithm uses the following parameters: a mutation probability of 0.05, an initial population size of 4000, and a maximum evolutionary generation of 400. The optimal Pareto solutions obtained by the algorithm for this problem are shown in Figure 16.

Figure 16.
Optimal Pareto solution of the passenger-seeking scheme in two states: (a) State 1: Optimal Pareto solution; (b) State 2: Optimal Pareto solution.
5.4.3. Optimization Scheme Evaluation
The biggest advantage of the gray comprehensive evaluation method is that there is no requirement for the amount of data, which is more practical in the case of less systematic data information. It solves the entropy weight TOPSIS method of the method of the amount of data requirements; so, this paper adopts gray correlation comprehensive evaluation method for taxi drivers to seek passengers to solve the set of solutions for further optimization.
To ensure that the optimized passenger search path schemes have a high probability of finding passengers, paths with a passenger probability lower than 0.35 were first deleted. Further optimization was conducted using the gray comprehensive evaluation method. This study invited 20 taxi drivers to comprehensively score the first four indicators of the passenger search path schemes to reflect their attitudes toward path selection in the evaluation. In the path schemes from the drop-off point to the first recommended passenger pick-up point, schemes 2, 4, 6, 9, 10, and 17 were deleted. In the path schemes from the first recommended passenger pick-up point to the second recommended passenger pick-up point, schemes 2 and 5 were deleted. Based on principles such as the shortest path, the fewest traffic lights, and the most bus stops passed, the following three paths were screened out as candidate paths and compared with the calculated routes. The results are shown in Table 7 and Table 8. The final passenger search route was obtained through comprehensive evaluation, and the route obtained by this method increased the average passenger probability by 18.95% compared to common schemes. Comparative analysis of instances proves that the method proposed in this study is reasonable to a certain extent, effectively increasing the passenger probability and providing scientific guidance for taxi drivers in their passenger search route selection.
Table 7.
Comparison of passenger-finding path alternatives (from drop-off point to first-up recommended point).
Table 8.
Comparison of trail-finding alternatives (from 1st recommended trail-finding point to 2nd recommended trail-finding point).
6. Discussion
With the continuous development of information and communication technology, various industries are generating massive amounts of data at an astonishing rate, which is being applied in different scenarios. To address issues of supply and demand imbalance, such as “oversupply” and “shortages”, it is necessary to implement smarter vehicle dispatch and route guidance for taxis to achieve a dynamic balance between supply and demand, improve operational efficiency, and enhance passengers’ taxi-hailing experience. This would create a positive feedback loop, further promoting the development of the taxi industry. Therefore, based on massive trajectory data, this paper provides a comprehensive strategy for cruising taxi drivers to find passengers, aiming to reduce the randomness in the passenger-seeking process of vacant taxis and to improve the operational efficiency of taxis.
7. Conclusions
This paper proposes a method for calculating and predicting the passenger pick-up probability on taxi-seeking roads. It uses the BiLSTM neural network to predict the passenger volume for each road and calculates the pick-up probability for all roads through a passenger probability calculation method. The results show that the BiLSTM deep learning model achieves a prediction accuracy of 9.67% higher than the BP deep learning model and 6.45% higher than the LSTM deep learning model. Therefore, the BP network has a slower convergence rate, and its fitting performance is inferior to that of both the BiLSTM and LSTM networks. Under the same number of epochs, the BiLSTM network outperforms the LSTM network in fitting performance.
This paper constructs a route recommendation model for taxi drivers seeking passengers and proposes a passenger-seeking route optimization strategy based on the NSGA-II algorithm, addressing the problem of recommending taxi-seeking routes under real-time changes in passenger pick-up probability. First, the taxi-seeking route recommendation model is built using concepts from graph theory and optimization theory. Then, the NSGA-II algorithm is designed to solve the route planning problem based on its specific characteristics. A gray comprehensive evaluation method is employed to assess the taxi-seeking route plans. Finally, using taxi trajectory data from Chengdu’s main urban area during the evening rush hour, this study identifies taxi-seeking routes from Jinjiang Wanda to Chengdu North Station and from Chengdu North Station to the Fourth People’s Hospital of Sichuan Province, along with their Manhattan distances and passenger pick-up probabilities. Based on the gray comprehensive evaluation method, factors such as travel time, number of bus stops, and driver ratings are used to evaluate the taxi-seeking plans. The results show that the proposed taxi-seeking route selection strategy increases the average passenger pick-up probability by 18.95% compared to common methods, effectively reducing the taxi vacancy rate.
There are still some shortcomings in the methods proposed in this paper, which can be further explored in the future, specifically in the following two areas. First, there is a certain degree of subjectivity in the selection of factors influencing taxi passenger-seeking, mainly based on interviews with experienced taxi drivers and a review of the literature. This may lead to limitations and bias in the analysis. Therefore, future research needs to improve and refine a more comprehensive set of influencing factor indicators. Second, the training of deep learning models requires continuous parameter optimization, but in this paper, the parameters were set based on experience without hyperparameter optimization. In the future, further optimization of the prediction model will be carried out.
Author Contributions
Conceptualization, G.G., B.L., D.Z., X.W., J.C. and T.W.; methodology, G.G., B.L., D.Z., X.W., H.X. and Y.L.; formal analysis, B.L., X.W., J.C., H.X. and Y.L.; resources, G.G.; supervision, G.G. and T.W.; visualization, J.C. and H.X.; project administration, G.G.; writing—original draft, B.L., J.C. and H.X.; writing—review and editing, G.G., X.W., T.W. and Y.L. All authors have read and agreed to the published version of the manuscript.
Funding
This work was supported by the National Natural Science Foundation of China under grant no. 71861005, Transportation Operation Subsidy Project of Guangxi Key Laboratory of International Join for China-ASEAN Comprehensive Transportation in 2021 (No. 21-220-21), Guangxi Science and Technology Base and Talent Specialization (Guike AD23026029), Basic ability enhancement project for young and middle-aged teachers of universities in Guangxi (2024KY1883, 2024KY1180).
Institutional Review Board Statement
Not applicable.
Informed Consent Statement
Not applicable.
Data Availability Statement
The data presented in this study are available on request from the corresponding author. The data are not publicly available due to commercial factors related to taxi.
Conflicts of Interest
The authors declare no conflicts of interest.
References
- Li, Z.; Tang, J.; Feng, T.; Liu, B.; Cao, J.; Yu, T.; Ji, Y. Investigating urban mobility through multi-source public transportation data: A multiplex network perspective. Appl. Geogr. 2024, 169, 103337. [Google Scholar] [CrossRef]
- Lai, Y.; Wang, Y. Short-term passenger flow prediction for rail transit based on improved particle swarm optimization algorithm. Iet Intell. Transp. Sy. 2022, 17, 825–834. [Google Scholar] [CrossRef]
- Na, X.; Zhang, Y.; Li, M. Demand prediction model of online car rental based on ODCG. J. Shandong Univ. 2023, 53, 48–56. [Google Scholar]
- Zhou, D.; Sun, J.; Gu, G.; Zhong, C.; Wang, T. Optimization method for taxi drivers’passenger search path basedon trajectory data. J. Chongqing Jiaotong Univ. 2024, 43, 83–90. [Google Scholar]
- Chou, K.S.; Wong, K.L.; Zhang, B.; Aguiari, D.; Im, S.K.; Lam, C.T.; Tse, R.; Tang, S.-K.; Pau, G. Taxi Demand and Fare Prediction with Hybrid Models: Enhancing Efficiency and User Experience in City Transportation. Appl. Sci. 2023, 13, 10192. [Google Scholar] [CrossRef]
- Liu, Z.; Jia, Y.; Zhu, X. Deployment strategy for car-sharing depots by clustering urban traffic big data based on affinity propagation. Sci. Program. 2018, 2018, 3907513. [Google Scholar] [CrossRef]
- Zhou, J.; Bai, X.; Fu, W.; Ning, B.; Li, R. Pedestrian intention estimation and trajectory prediction based on data and knowledge-driven method. IET Intell. Transp. Syst. 2024, 18, 315–331. [Google Scholar] [CrossRef]
- Dang, P. Research on the Analysis of Cab Passenger-Seeking Behavior and Path Planning Based on GPS Data. Master’s Thesis, Dalian University of Technology, Dalian, China, 2021. [Google Scholar]
- Tang, Y.; Jiang, C.; Zheng, B. Research on urban cab passenger travel characteristics based on multi-source data fusion—Taking Yueyang city as an example. Transp. Syst. Eng. Inf. 2018, 18, 45–51. [Google Scholar]
- Niu, D. Research on the Visualization of Cab GPS Trajectory Data. Master’s Thesis, Chang’an University, Xi’an, China, 2018. [Google Scholar]
- Si, Y.; Guan, H. A study on the choice of cab and internet express car for travelers based on latent variables. J. Chongqing Jiaotong Univ. 2022, 41, 46–50. [Google Scholar]
- Zhou, D.; Lou, B.; Gu, G.; Yuan, Q.; Zhong, C.; Zou, J.; Hu, Q. Mining of taxi passenger-seeking regions based on grid-optimised DBSCAN algorithm. SPIE Proc. Int. Conf. Traffic Eng. Transp. Syst. 2024, 13064, 776–781. [Google Scholar]
- Feng, H.; Yang, Z. Hot passenger routes mining based on spatial-temporal similarity clustering. J. Transp. Syst. Eng. Inf. Technol. 2019, 19, 94. [Google Scholar]
- Xie, D.; Jia, H.; Li, C.; Zhao, X. Mining and calculating travel time based on classification of grid traffic state. J. Transp. Syst. Eng. Inf. Technol. 2022, 22, 168. [Google Scholar]
- Verma, M.; Verma, A.; Narsaria, I. Measuring sentiments and attitude of people toward self-drive rental car services in Bangalore City, India. Transp. Lett. 2022, 14, 622–628. [Google Scholar] [CrossRef]
- Ku, Y.; Wu, P.; Ren, Q.; Wang, Y. The sequential pricing of ride-hailing system with rental service in the context of fleet electrification. J. Syst. Sci. Syst. Eng. 2024, 33, 77–105. [Google Scholar] [CrossRef]
- Yang, Q.; Qiao, Z.; Yang, B.; Shi, Z. Modeling and uncovering the passenger–taxi dynamic queues at taxi station with multiple boarding points using a Markovian environment. Physica A 2021, 572, 125870. [Google Scholar] [CrossRef]
- An, S.; Kuang, W. Research on taxi GPS data trajectoryization method. Sci. Technol. Eng. 2015, 15, 125–130. [Google Scholar]
- Du, J.; Meng, C.; Liu, X. Analysis of Urban Residents’ Travelling Characteristics and Hotspots Based on Taxi Trajectory Data. Appl. Sci. 2024, 14, 1279. [Google Scholar] [CrossRef]
- Zhao, F. Research on Path Planning Based on Floating Car Data. Master’s Thesis, Beijing Jiaotong University, Beijing, China, 2020. [Google Scholar]
- Liu, S.; Zhang, Y.; Wang, Z.; Gu, S. AdaBoost-Bagging deep inverse reinforcement learning for autonomous taxi cruising route and speed planning. Transp. Res. Part E 2023, 177, 103232. [Google Scholar] [CrossRef]
- Yang, L.; Wang, S.; Liang, F.; Zhao, Z. A holistic approach for optimal pre-planning of multi-path standardized taxiing routes. Aerospace 2021, 8, 241. [Google Scholar] [CrossRef]
- Yang, X.; Chen, Z.; Luo, Y. Optimizing taxi route planning based on taxi trajectory data analysis. In Databases Theory and Applications; Australasian Database Conference; Springer: Berlin/Heidelberg, Germany, 2023; pp. 44–55. [Google Scholar]
- Zhu, C.; Ye, D.; Zhu, T.; Zhou, W. Time-optimal and privacy preserving route planning for carpool policy. World Wide Web 2022, 25, 1151–1168. [Google Scholar] [CrossRef]
- Yang, G.; Yuan, E.; Zhang, X.; Zhou, H. A route planning mechanism for supermarket shuttle service based on taxi traces. Res. Transp. Bus. Manag. 2021, 38, 100502. [Google Scholar] [CrossRef]
- Hsieh, H.P.; Lin, F. Recommending taxi routes with an advance reservation–a multi-criteria route planner. Int. J. Urban Sci. 2022, 26, 162–183. [Google Scholar] [CrossRef]
- Zhao, L.; Song, Y.; Zhang, C.; Liu, Y.; Wang, P.; Lin, T.; Deng, M.; Li, H. T-GCN: A temporal graph convolutional network for traffic prediction. IEEE Trans. Intell. Transp. Syst. 2019, 21, 3848–3858. [Google Scholar] [CrossRef]
- Zhu, X.; Fan, Y.; Zhang, F.; Ye, X.; Chen, C.; Yue, H. Multiple-factor based sparse urban travel time prediction. Appl. Sci. 2018, 8, 279. [Google Scholar] [CrossRef]
- Shwe, T.; Aritsugi, M. Optimizing data processing: A comparative study of big data platforms in edge, fog, and cloud layers. Appl. Sci. 2024, 14, 452. [Google Scholar] [CrossRef]
- Huang, W.; Xiong, W.; Wang, X. PMMTss: A parallel multi-way merging-based trajectory similarity search for a million metro passengers. Appl. Sci. 2023, 13, 7988. [Google Scholar] [CrossRef]
- Zhang, X.; Zhou, S. WOA-DBSCAN: Application of whale optimization algorithm in DBSCAN parameter adaption. IEEE Access 2023, 11, 91861–91878. [Google Scholar] [CrossRef]
- Chen, Y.; Zhou, L.; Bouguila, N.; Wang, C.; Chen, Y.; Du, J. BLOCK-DBSCAN: Fast clustering for large scale data. Pattern Recognit. 2021, 109, 107624. [Google Scholar] [CrossRef]
- Zhang, H.; Yang, G.; Yu, H.; Zheng, Z. Kalman filter-based CNN-BiLSTM-ATT model for traffic flow prediction. Comput. Mater. Contin. 2023, 76, 1047–1063. [Google Scholar] [CrossRef]
- Zhai, Y.; Wan, Y.; Wang, X. Optimization of traffic congestion management in smart cities under bidirectional long and short-term memory model. J. Adv. Transp. 2022, 2022, 3305400. [Google Scholar] [CrossRef]
- Zhang, X.; Li, Y.; Zhou, X.; Luo, J. CGAIL: Conditional generative adversarial imitation learning—An application in taxi drivers’ strategy learning. IEEE Trans. Big Data 2020, 8, 1288–1300. [Google Scholar] [CrossRef]
- Qian, X.; Ukkusuri, S.V. Taxi market equilibrium with third-party hailing service. Transport. Res. B-Meth. 2017, 100, 43–63. [Google Scholar] [CrossRef]
- Ni, L.; Li, Q.; Zhang, Y.; Luo, W.; Sheng, V.S. LSADEN: Local spatial-aware community detection in evolving geo-social networks. IEEE Trans. Knowl. Data Eng. 2024, 36, 3265–3280. [Google Scholar] [CrossRef]
- Wu, Y.; Yuan, Z.; Chen, Q.; Xiao, Q.; Wang, W.; Wei, L. Taxi pooling method of urban integrated passenger transport hub with trajectory similarity. Transp. Syst. Eng. Inf. Technol. 2020, 20, 188–195. [Google Scholar]
- Espinoza-Molina, F.E.; Ortega, M.; Sandoval Escobar, K.E.; Vazquez Salazar, J.S. An integrated approach to the Spanish Driving Behavior Questionnaire (SDBQ) in the city of Cuenca, Ecuador. Sustainability 2024, 16, 4885. [Google Scholar] [CrossRef]
- Glenn, S.J.; Gentry-Lear, Z.; Shavlik, M.; Harms, M.J.; Asaki, T.J.; Baylink, A. Bacterial vampirism mediated through taxis to serum. Elife 2024, 12, RP93178. [Google Scholar] [CrossRef]

Disclaimer/Publisher’s Note: The statements, opinions and data contained in all publications are solely those of the individual author(s) and contributor(s) and not of MDPI and/or the editor(s). MDPI and/or the editor(s) disclaim responsibility for any injury to people or property resulting from any ideas, methods, instructions or products referred to in the content. |
© 2024 by the authors. Licensee MDPI, Basel, Switzerland. This article is an open access article distributed under the terms and conditions of the Creative Commons Attribution (CC BY) license (https://creativecommons.org/licenses/by/4.0/).