Article

Free Ammonia Strategy for Nitrite-Oxidizing Bacteria (NOB) Suppression in Mainstream Nitritation Start-Up

1
Department of Civil and Environmental Engineering, Pusan National University, Busan 46241, Republic of Korea
2
Gyeongsangnam-do Institute of Health & Environment, Jinju 52732, Republic of Korea
3
Technology Development Center, Samsung Engineering Co., Ltd., Suwon 16523, Republic of Korea
4
Disaster Scientific Investigation Division, National Disaster Management Research Institute, Ulsan 44538, Republic of Korea
5
Department of Energy and Environment, Korea Polytechnic, Changwon 51518, Republic of Korea
*
Author to whom correspondence should be addressed.
Appl. Sci. 2024, 14(17), 7801; https://doi.org/10.3390/app14177801
Submission received: 6 August 2024 / Revised: 21 August 2024 / Accepted: 23 August 2024 / Published: 3 September 2024
(This article belongs to the Section Environmental Sciences)

Abstract

:
The partial nitritation (PN)–anammox (PN/A) process offers a sustainable alternative to nitrogen management in wastewater treatment, addressing the high costs and increasing the low eco-friendliness associated with traditional nitrification/denitrification processes. Stable partial nitritation (PN) is critical for effective PN/A operation, and this study specifically focused on the need to suppress nitrite-oxidizing bacteria (NOB) to facilitate the enrichment of ammonia-oxidizing bacteria (AOB). Utilizing two sequencing batch reactors (SBRs), PN1 and PN2 with different free ammonia (FA) concentrations, this study aimed to evaluate the NOB suppression strategy while enriching AOB. The PN2 reactor, which operated with a higher initial FA concentration (50 mg/L), successfully maintained high nitritation activity, with 96.1% ammonium removal efficiency (ARE) and 95.1% nitrite accumulation efficiency (NAE) at reduced influent NH4+-N concentrations (50 mg NH4+-N/L, FA 10 mg/L). In contrast, PN1 showed inadequate NOB suppression due to lower FA concentrations (10 mg/L). These results suggest that initiating the nitritation process with higher FA concentrations can effectively suppress NOB, enhancing the stability and efficiency of PN/A processes in mainstream applications.

1. Introduction

Carbon neutrality requires intensified research on sustainable nitrogen management strategies in wastewater treatment plants (WWTPs). The traditional nitrification/denitrification process requires a significant amount of aeration for nitrification and an external organic carbon source for denitrification [1], leading to high operating costs and energy requirements. To overcome these challenges, anaerobic ammonia oxidation (anammox)-based processes have been developed, offering substantial economic advantages, and these processes convert NH4+ and NO2 directly into N2 gas under anaerobic conditions [2,3,4,5,6].
The partial nitritation (PN)-anammox (PN/A) process, which combines PN (Equation (1)) and anammox (Equation (2)), involves ammonia-oxidizing bacteria (AOB) converting half of the NH4+ to NO2, followed by anammox bacteria using the remaining NH4+ and NO2 [7,8]. This innovative process has demonstrated benefits, including a 60% reduction in aeration requirement, the elimination of the need for organic carbon sources, and a 90% reduction in sludge production when compared to traditional nitrification/denitrification processes [9,10,11]. Currently, more than 200 full-scale facilities employing the PN/A process are successfully operating across Europe, Asia, and North America [12], predominantly treating high-strength NH4+ wastewater (>500 mg/L) in sidestream applications [13,14].
1.0 NH 4 + + 0.75 O 2 + HCO 3 0.5 NH 4 + + 0.5 NO 2 + CO 2 + 1.5 H 2 O
1.0 NH 4 + + 1.32 NO 2 + 0.066 HCO 3 + 0.13 H + 1.02 N 2 + 0.26 NO 3 + 0.066 CH 2 O 2 N 0.15 + 2.03 H 2 O
The widespread application of mainstream PN/A is challenged by the proliferation of nitrite-oxidizing bacteria (NOB), which disrupt the stable supply of NO2 [15,16]. Various methods have been employed to suppress NOB in sidestream processes, including oxygen control, intermittent aeration, solid retention time (SRT) control, and inhibition by free ammonia (FA) and free nitrous acid (FNA) [17]. For instance, Zeng et al. (2013) maintained PN at a dissolved oxygen (DO) concentration of 0.3–0.6 mg/L, while Laureni et al. (2015) achieved PN in a sequencing batch reactor (SBR) at a DO concentration of 0.15–0.18 mg/L [18,19]. Intermittent aeration strategies, such as alternating 15 min of aerobic time with 15 min of anoxic time in PN/A reactors, have also been effective in suppressing NOB [20]. Controlling SRT by adjusting the sludge in the settling tank has been another effective strategy. At high temperatures of 28–30 °C, a short SRT of 2.5 days has successfully facilitated partial nitritation in wastewater treatment plants, although this method proved ineffective at lower temperatures of 20 °C [21]. FA, being more inhibitory to NOB than to AOB, can suppress NOB activity at concentrations of 1–150 mg/L without adversely affecting AOB [22]. Various strategies combining these methods have been successfully applied to operate PN by suppressing NOB, with FA strategies being particularly effective in sidestream processes [23]. Despite these success in sidestream applications, there is limited information on stable AOB enrichment methods for initiating nitritation in mainstream nitrogen treatment. Additionally, it is necessary to confirm nitritation by analyzing the proportions of AOB, including representative genera such as Nitrosomonas, Nitrosospira, and Nitrosococcus, and NOB, including representative genera such as Nitrospira, Nitrobacter, Nitrotoga, and Nitrococcus [24,25,26,27]. This highlights the need for further research to develop reliable strategies for mainstream applications.
In this study, the FA strategy was applied to suppress NOB and enrich AOB for stable nitritation reactions in mainstream nitrogen treatment. Two parallel reactors (PN1 and PN2) were operated at different FAs, and microbial analysis was conducted to observe changes in AOB and NOB. These findings provide valuable insights for the start-up phase of AOB enrichment in mainstream nitrogen treatment, contributing to the development of energy-efficient wastewater treatment plants employing anammox-based processes.

2. Materials and Methods

2.1. Reactor Set-Up and Operational Condition

The experiments were conducted in two identical sequencing batch reactors (SBRs), denoted PN1 and PN2, each with an effective volume of 10 L. Both PN1 and PN2 were operated with a fixed exchange volume of 80%. Each cycle in the SBRs consisted of four phases: feeding (5 min), reaction (3–8 h, depending on influent concentrations), settling (50 min), and discharge (5 min). The reactors were operated in a dark room at 25 ± 1 °C and were inoculated with activated sludge from Suyeong WWTP in Busan, South Korea. Synthetic wastewater was prepared by modifying the composition from a previous study [6] and included the following components: 50–300 mg-N/L (NH4)2SO4, 241.2–1447.2 mg/L NaHCO3 (as CaCO3), 70 mg/L KH2PO4, 17.5 mg/L CaCl2⋅2H2O, 12.5 mg/L MgSO4, and 9.0 mg/L FeSO4⋅7H2O. The pH of the influent was adjusted to 8.5 using 1M NaOH and 1M HCl. Oxygen was supplied using an air pump, maintaining an internal DO concentration below 0.5 mg/L in both reactors.
PN1 was maintained at a fixed FA concentration of 10 mg/L (50 mg NH4+-N/L). In contrast, PN2 was operated by gradually decreasing the influent NH4+ concentration, starting from an FA of 50 mg/L (300 mg NH4+-N/L) and reducing it to an FA of 10 mg/L (50 mg NH4+-N/L), as shown in Table 1.

2.2. Activity Measurement of AOB and NOB

The activity of enriched AOB and NOB was measured through batch tests evaluating the effect of FA. These tests were conducted in 100 mL, incubated at 25 ± 1 °C, and stirred at 100 rpm using a magnetic stirrer. Biomass was collected from the inoculum of PN1 and PN2, as well as from the suspended sludge on day 50. The sludge was washed three times with a phosphate buffer solution (0.14 g/L KH2PO4 and 0.75 g/L K2HPO4) to remove any remaining substrates, and then inoculated at a concentration of 1 g VSS/L. During the reaction, sufficient oxygen was supplied with an air pump to maintain a DO concentration above 0.5 mg/L. For measuring AOB activity, 50 mg-N/L of (NH4)2SO4 was added to the medium, and for measuring NOB activity, 50 mg-N/L NaNO2 was added. The composition of mineral medium for both tests was the same, consisting of 482.4 mg/L NaHCO3 (as CaCO3), 70 mg/L KH2PO4, 17.5 mg/L CaCl2·2H2O, 12.5 mg/L MgSO4, and 9.0 mg/L FeSO4·7H2O. The batch tests were performed in duplicate. AOB activity was determined by the consumption rate of NH4+, while the NO2- production rate was used to determine NOB activity.

2.3. Chemical Analysis Methods

Influent and effluent samples were regularly collected and filtered using a 0.22 µm membrane filter (RephIQuik syringe filter, RephiLe Bioscience, Ltd., Boston, USA ). The nitrification trend was evaluated by measuring the concentrations of NH4+-N, NO2--N, and NO3--N. NH4+-N was analyzed using a kit (HS–NH3(N)–H, Humas Co., Daejeon, Republic of Korea) and a UV spectrometer (HS 1000, Humas Co., Daejeon, Republic of Korea), according to standard methods [28]. The concentrations of NO2-N and NO3--N were analyzed by ion chromatography (ICS-1000, Dionex, Sunnyvale, CA, USA) with a Dionex IonPac™ AS14 analytical column (4 × 250 mm), and the eluent used was a 3.5 mM Na2CO3/1.0 mM NaHCO3 solution with a flow rate of 1.2 L/min. Mixed liquor volatile suspended solids (MLVSSs) were measured according to standard methods [28]. The pH was measured using a pH meter (pH 33, Horiba Scientific, Kyoto, Japan), and DO concentration was measured using a DO meter (Pro 20i, YSI Inc., Yellow Spring, OH, USA).
To evaluate and compare the nitritation efficiency of each reactor, the ammonium removal efficiency (ARE) and nitrite accumulation efficiency (NAE) were calculated using Equations (3) and (4). Additionally, the FA concentration was determined based on the equation proposed by Anthonisen et al., 1976 (Equation (5)) [22].
ARE   % = NH 4 + N inf NH 4 + N eff NH 4 + N inf . × 100
NAE   % = NO 2 N eff NO 2 N eff + NO 3 N eff × 100
FA inf mg L = 17 14 × NH 4 + N inf × 10 pH 6344 e 273 + Temp .
where (NH4+-N)inf is the influent NH4+-N concentration, while (NH4+-N)eff, (NO2-N)eff, and (NO3-N)eff are the effluent concentrations of NH4+-N, NO2-N, and NO3-N, respectively.

2.4. Microbial Analysis Methods

Microbial samples were collected from the inoculated activated sludge during the operation of each reactor. For PN1, samples were collected on days 6, 32, and 50. For PN2, samples were collected on days 6, 13, 22, 33, and 50, including points where the influent conditions were changed (with day 6 marking the occurrence of nitrification). Genomic DNA was extracted using the DNeasy® PowerSoil® Kit (QIAGEN, Venlo, Netherlands Hilden, Germany), following the manufacturer’s instructions. The extracted DNA samples were stored at −20 °C until they were used for next-generation sequencing (NGS) analysis. The purity and quantity of the DNA were measured using a Nanodrop spectrophotometer (ND-1000, Thermo Fisher Scientific, Waltham, MA, USA). Polymerase chain reaction (PCR) was performed to amplify the V3-V4 region of the 16S rRNA gene (Table 2). Bacterial sequencing was then conducted using the Illumina MiSeq platform (Macrogen Co., Seoul, Republic of Korea). Quality control of the raw sequences was performed to remove ambiguous or potential chimeric sequences. Sequences with over 97% similarity were clustered to derive Operational Taxonomic Units (OTUs). The representative sequences of each OTU were classified based on the most similar bacteria using the National Center for Biotechnology Information (NCBI) database. Diversity indices, such as Chao1, Shannon, and InvSimpson, were calculated to assess the microbial diversity.

3. Results and Discussion

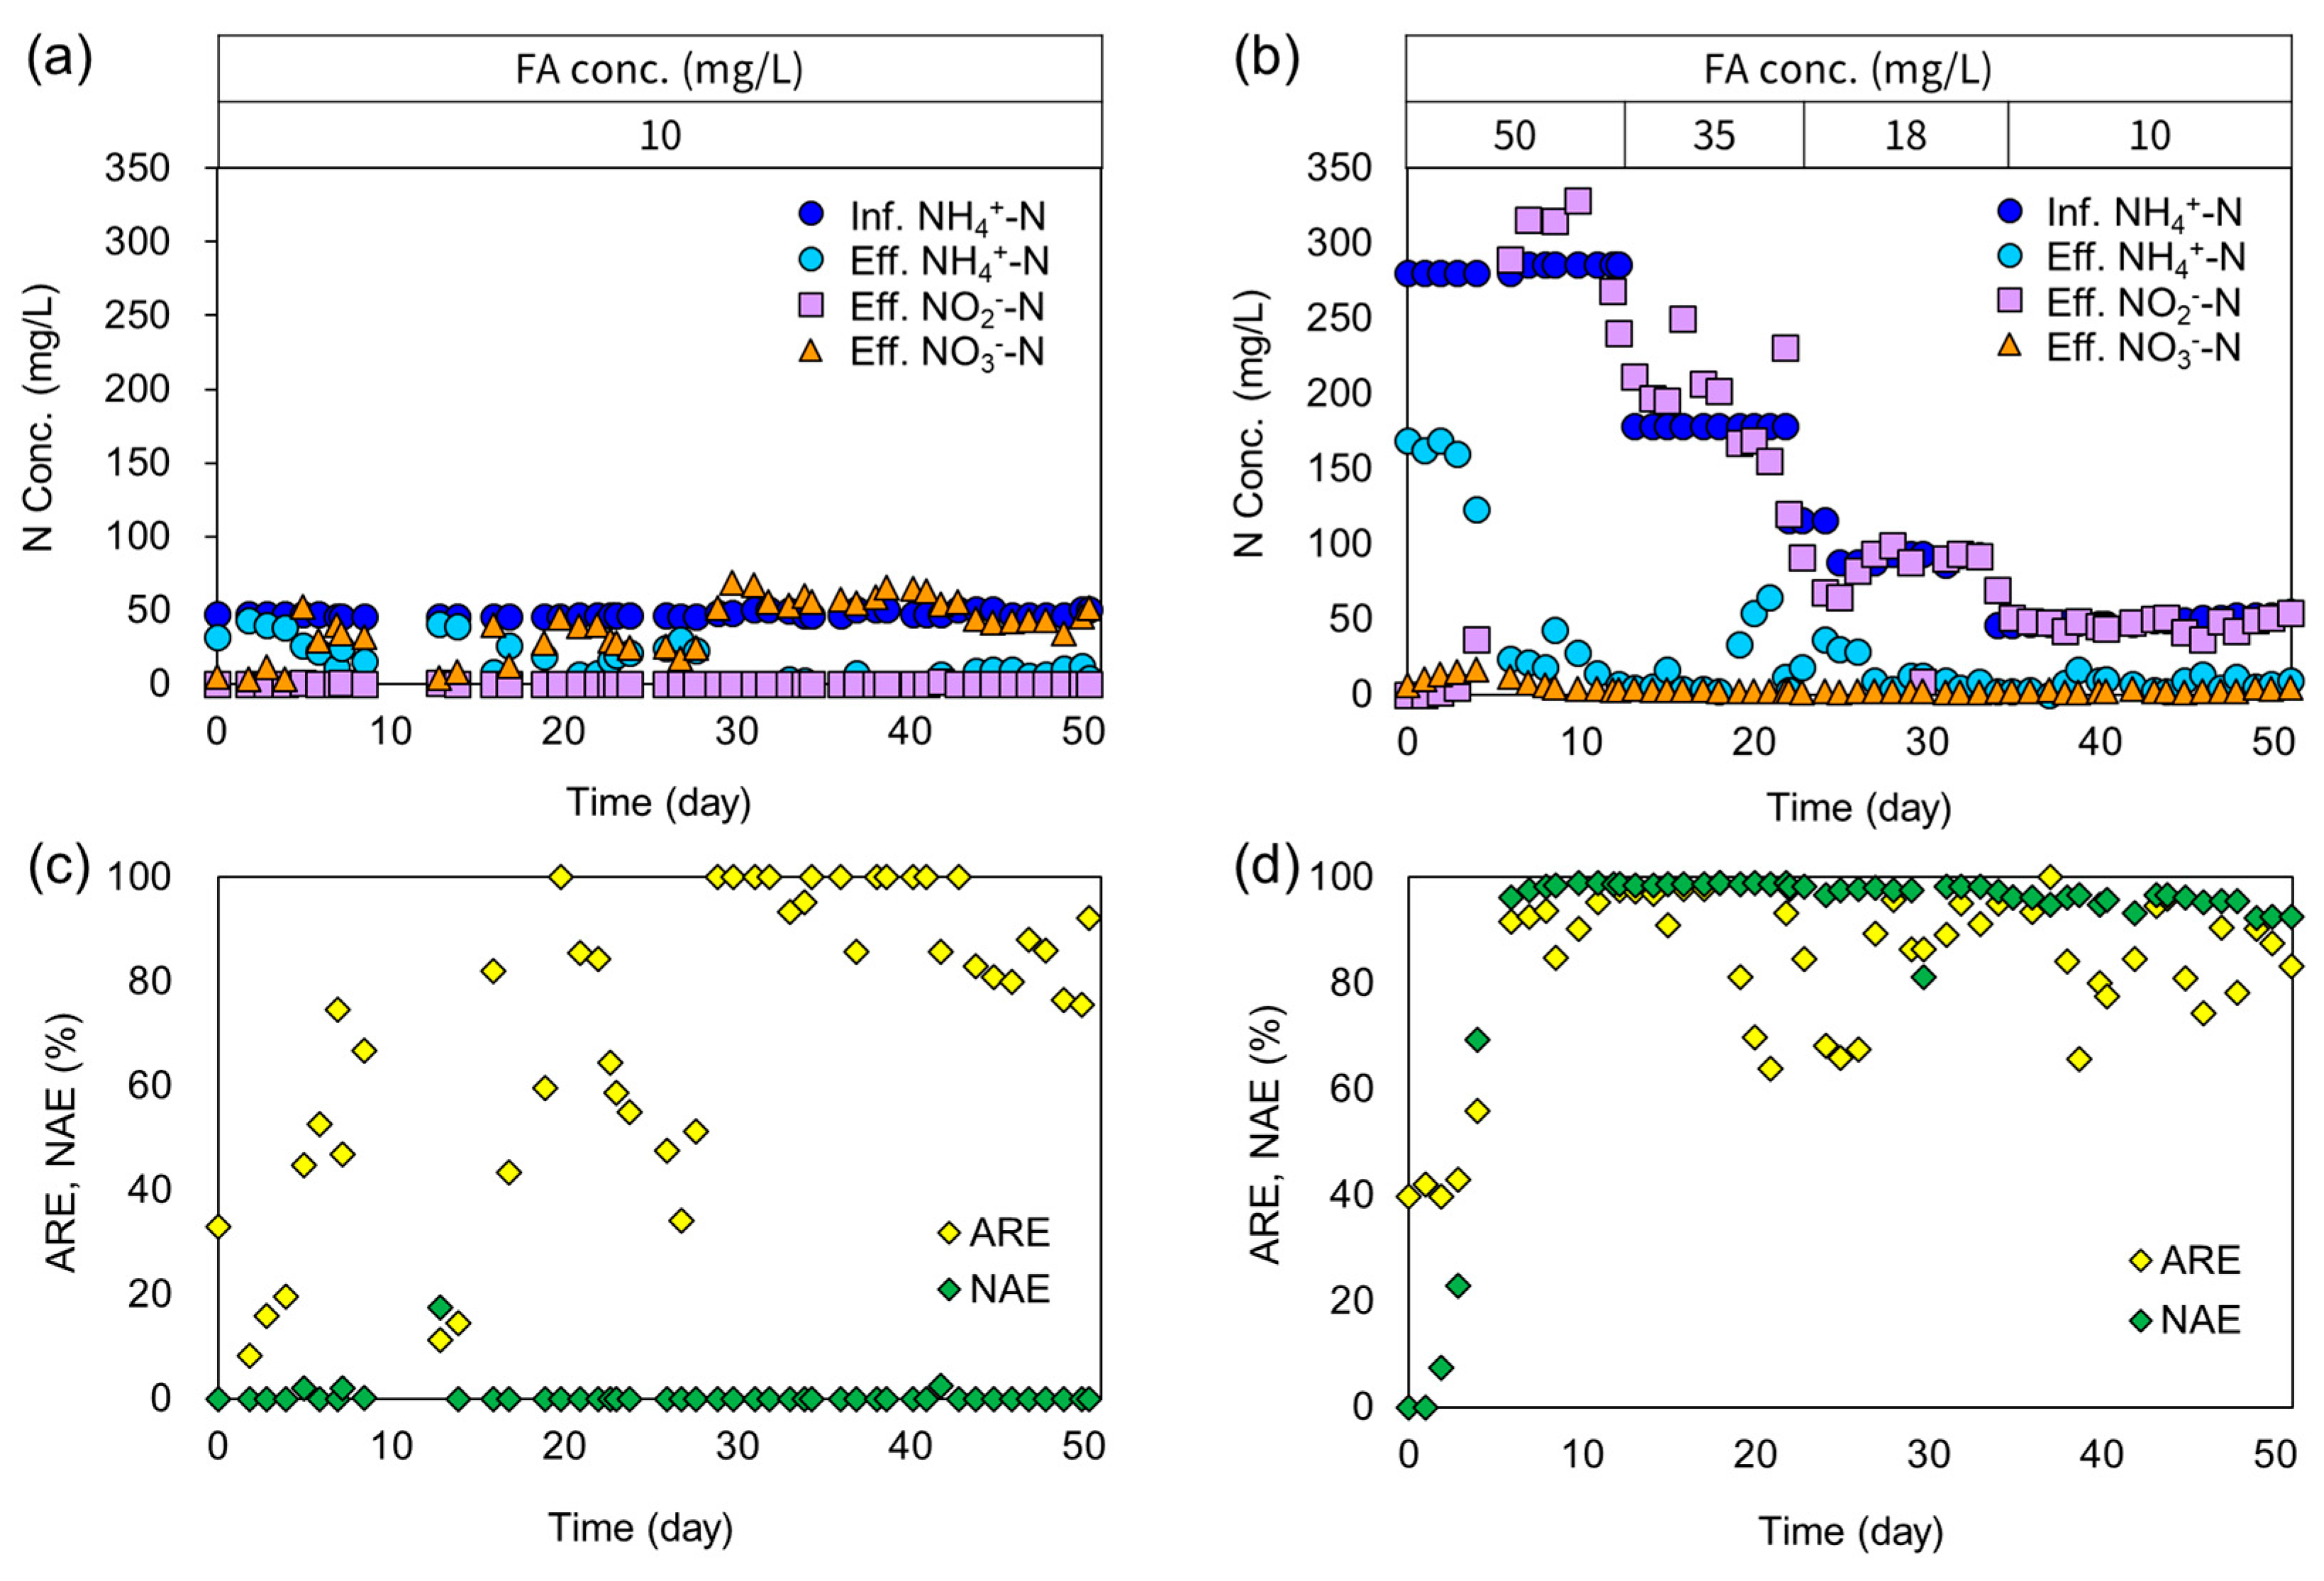
3.1. Overall Performance of PN1 and PN2

PN2 achieved a stable nitritation reaction with an NAE above 90% at an influent NH4+-N concentration of 50 mg/L, compared to the PN1 reactor (Figure 1). PN1 was operated with a mainstream wastewater-level influent NH4+-N concentration, maintaining an FA concentration of 10 mg/L. The oxygen inflow was adjusted to keep the DO concentration below 0.5 mg/L to induce nitrification over the initial 5 days. During this period, the effluent NH4+-N, NO2-N, and NO3-N concentrations were 11.5 mg/L, 1 mg/L, and 39.9 mg/L, respectively. These values indicate that most NH4+ was oxidized to NO3 rather than accumulating as NO2. Following this initial period, PN1 continued to operate with an ARE of 77.1% and an NAE below 5%. This demonstrates that NOB was not sufficiently suppressed, preventing stable nitritation.
PN2 was started with an influent NH4+-N concentration of 300 mg/L, influenced by an FA at 50 mg/L. This concentration was gradually reduced to the mainstream wastewater-level (NH4+-N 50 mg/L, FA 10 mg/L). After a 5-day period of starting up nitrification, PN2 showed an effluent NH4+-N concentration of 23.4 mg/L, NO2-N of 279.7 mg/L, and NO3-N of 7.6 mg/L, achieving an NAE of 98.3%. As the influent NH4+-N was gradually reduced to 200 mg/L and 100 mg/L, the NAE remained high, at 98.8% and 96.5%, respectively. When the influent NH4+-N was further reduced to 50 mg/L, the effluent concentrations were as follows: NH4+-N at 3.0 mg/L, NO2-N at 47.3 mg/L, and NO3-N at 3.9 mg/L; at this state, the ARE was 96.1% and an NAE was 95.1%. The inhibition of NOB due to the high FA levels in PN2 effectively promoted stable accumulation of NO2, which maintained the nitritation reaction even as the influent NH4+-N concentration decreased. In comparison, a previous study reported that carriers subjected to an FA shock of 1068 mg/L in a moving bed biofilm reactor (MBBR) achieved stable nitritation after 60 days with an influent NH4+-N concentration of 63 mg/L [29]. This resulted in effluent concentrations of 12 mg/L for NH4+-N, 49 mg/L for NO2-N, and 0.2 mg/L for NO3-N. This study confirms that a high FA strategy is advantageous for suppressing NOB, as evidenced by the stable nitritation observed in PN2 following an initial shock of high FA.
After 50 days of operation, the activities of AOB and NOB in reactors PN1 and PN2 were evaluated through batch tests (Figure 2). The activity of AOB was similar in both reactors, with PN1 at 0.43 ± 0.042 gN/gVSS/d and PN2 at 0.40 ± 0.005 gN/gVSS/d. In contrast, the activity of NOB was significantly higher in PN1 at 1.32 ± 0.059 gN/gVSS/d, compared to 0.01 ± 0.018 gN/gVSS/d in PN2. The PN2 reactor, influenced by 50 mg/L of FA, was more favorable for stably enriching AOB that accumulate NO2.

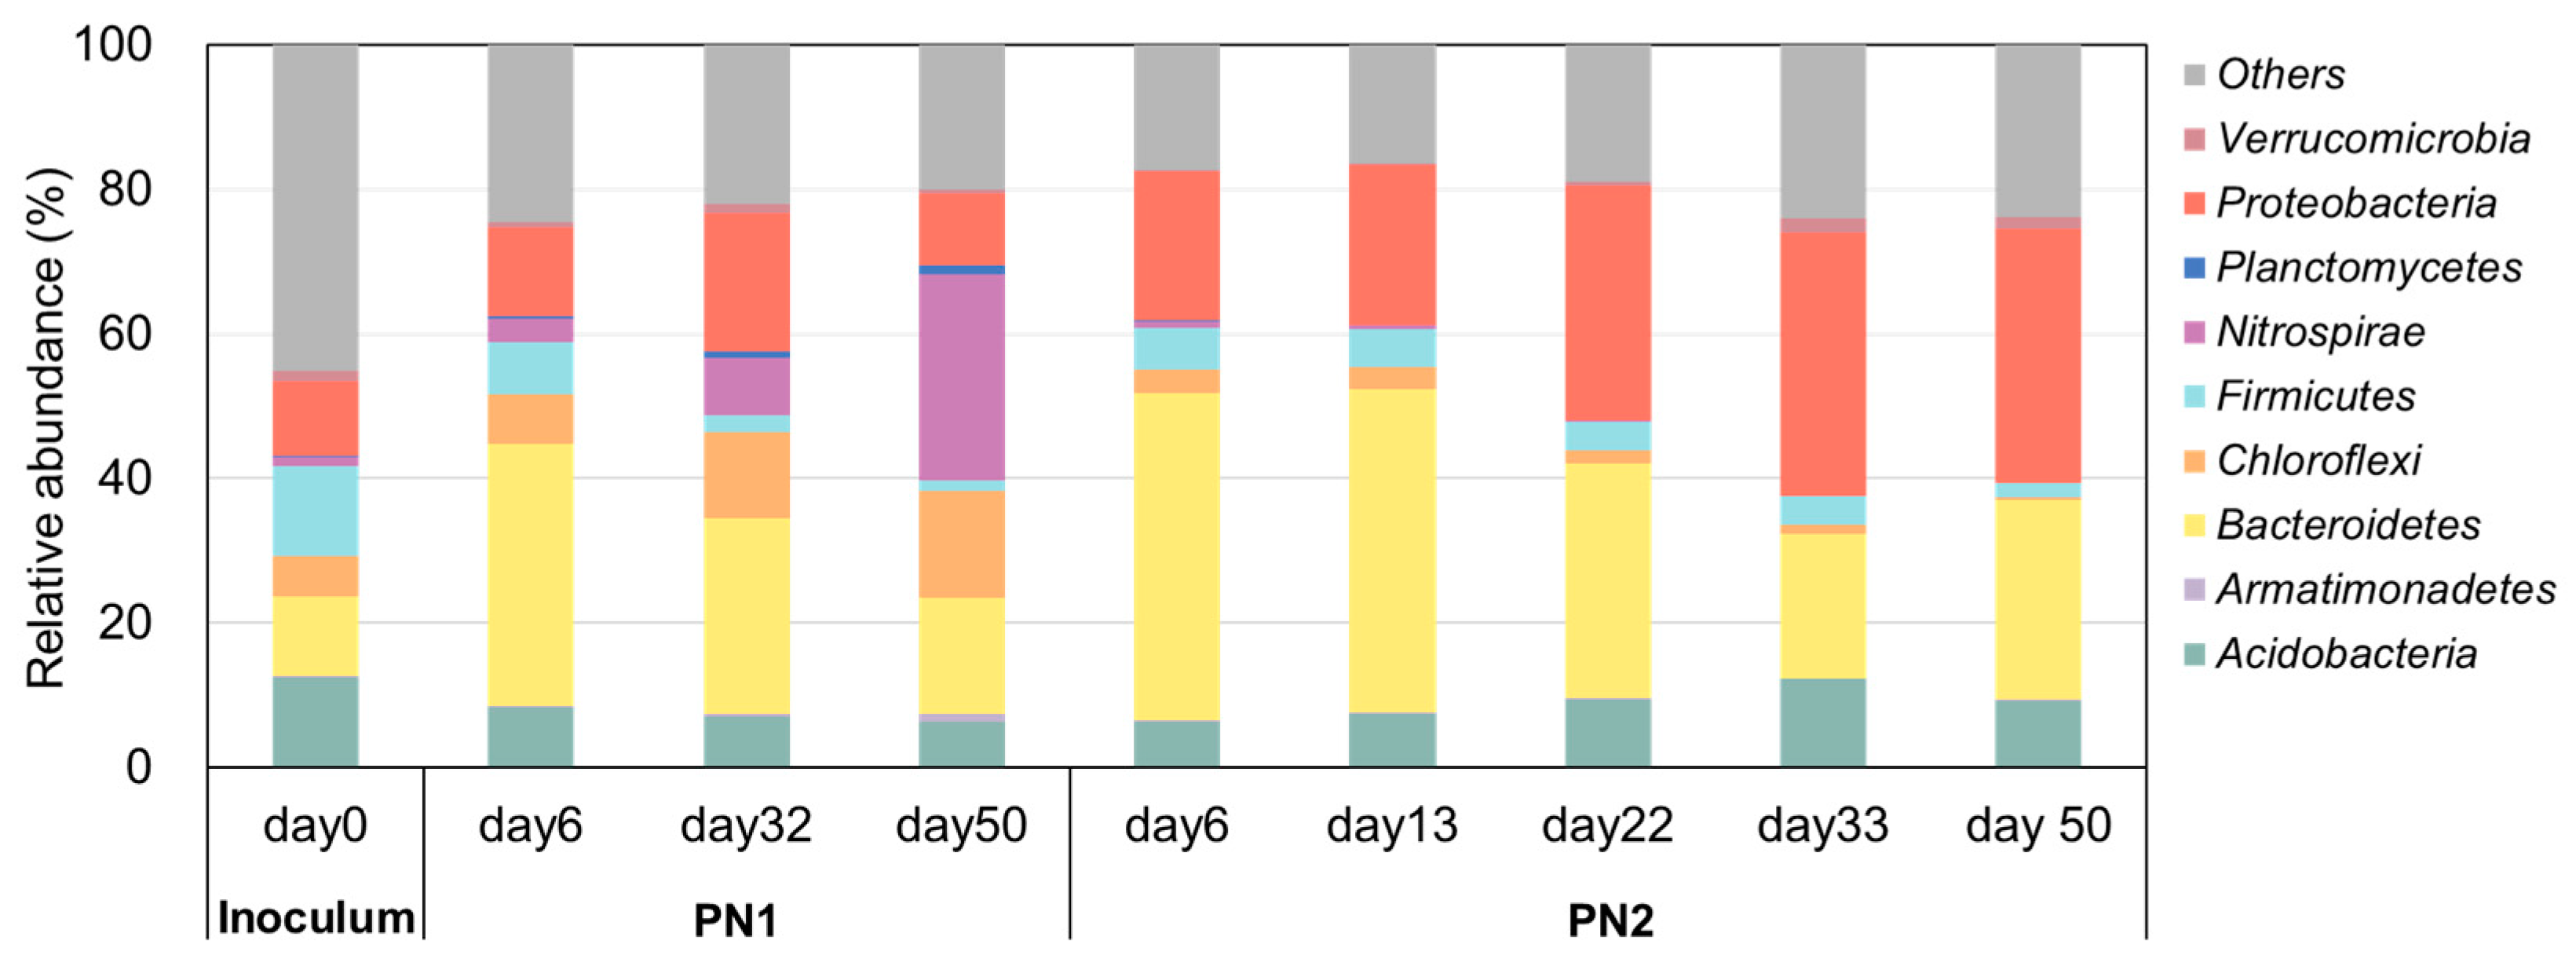
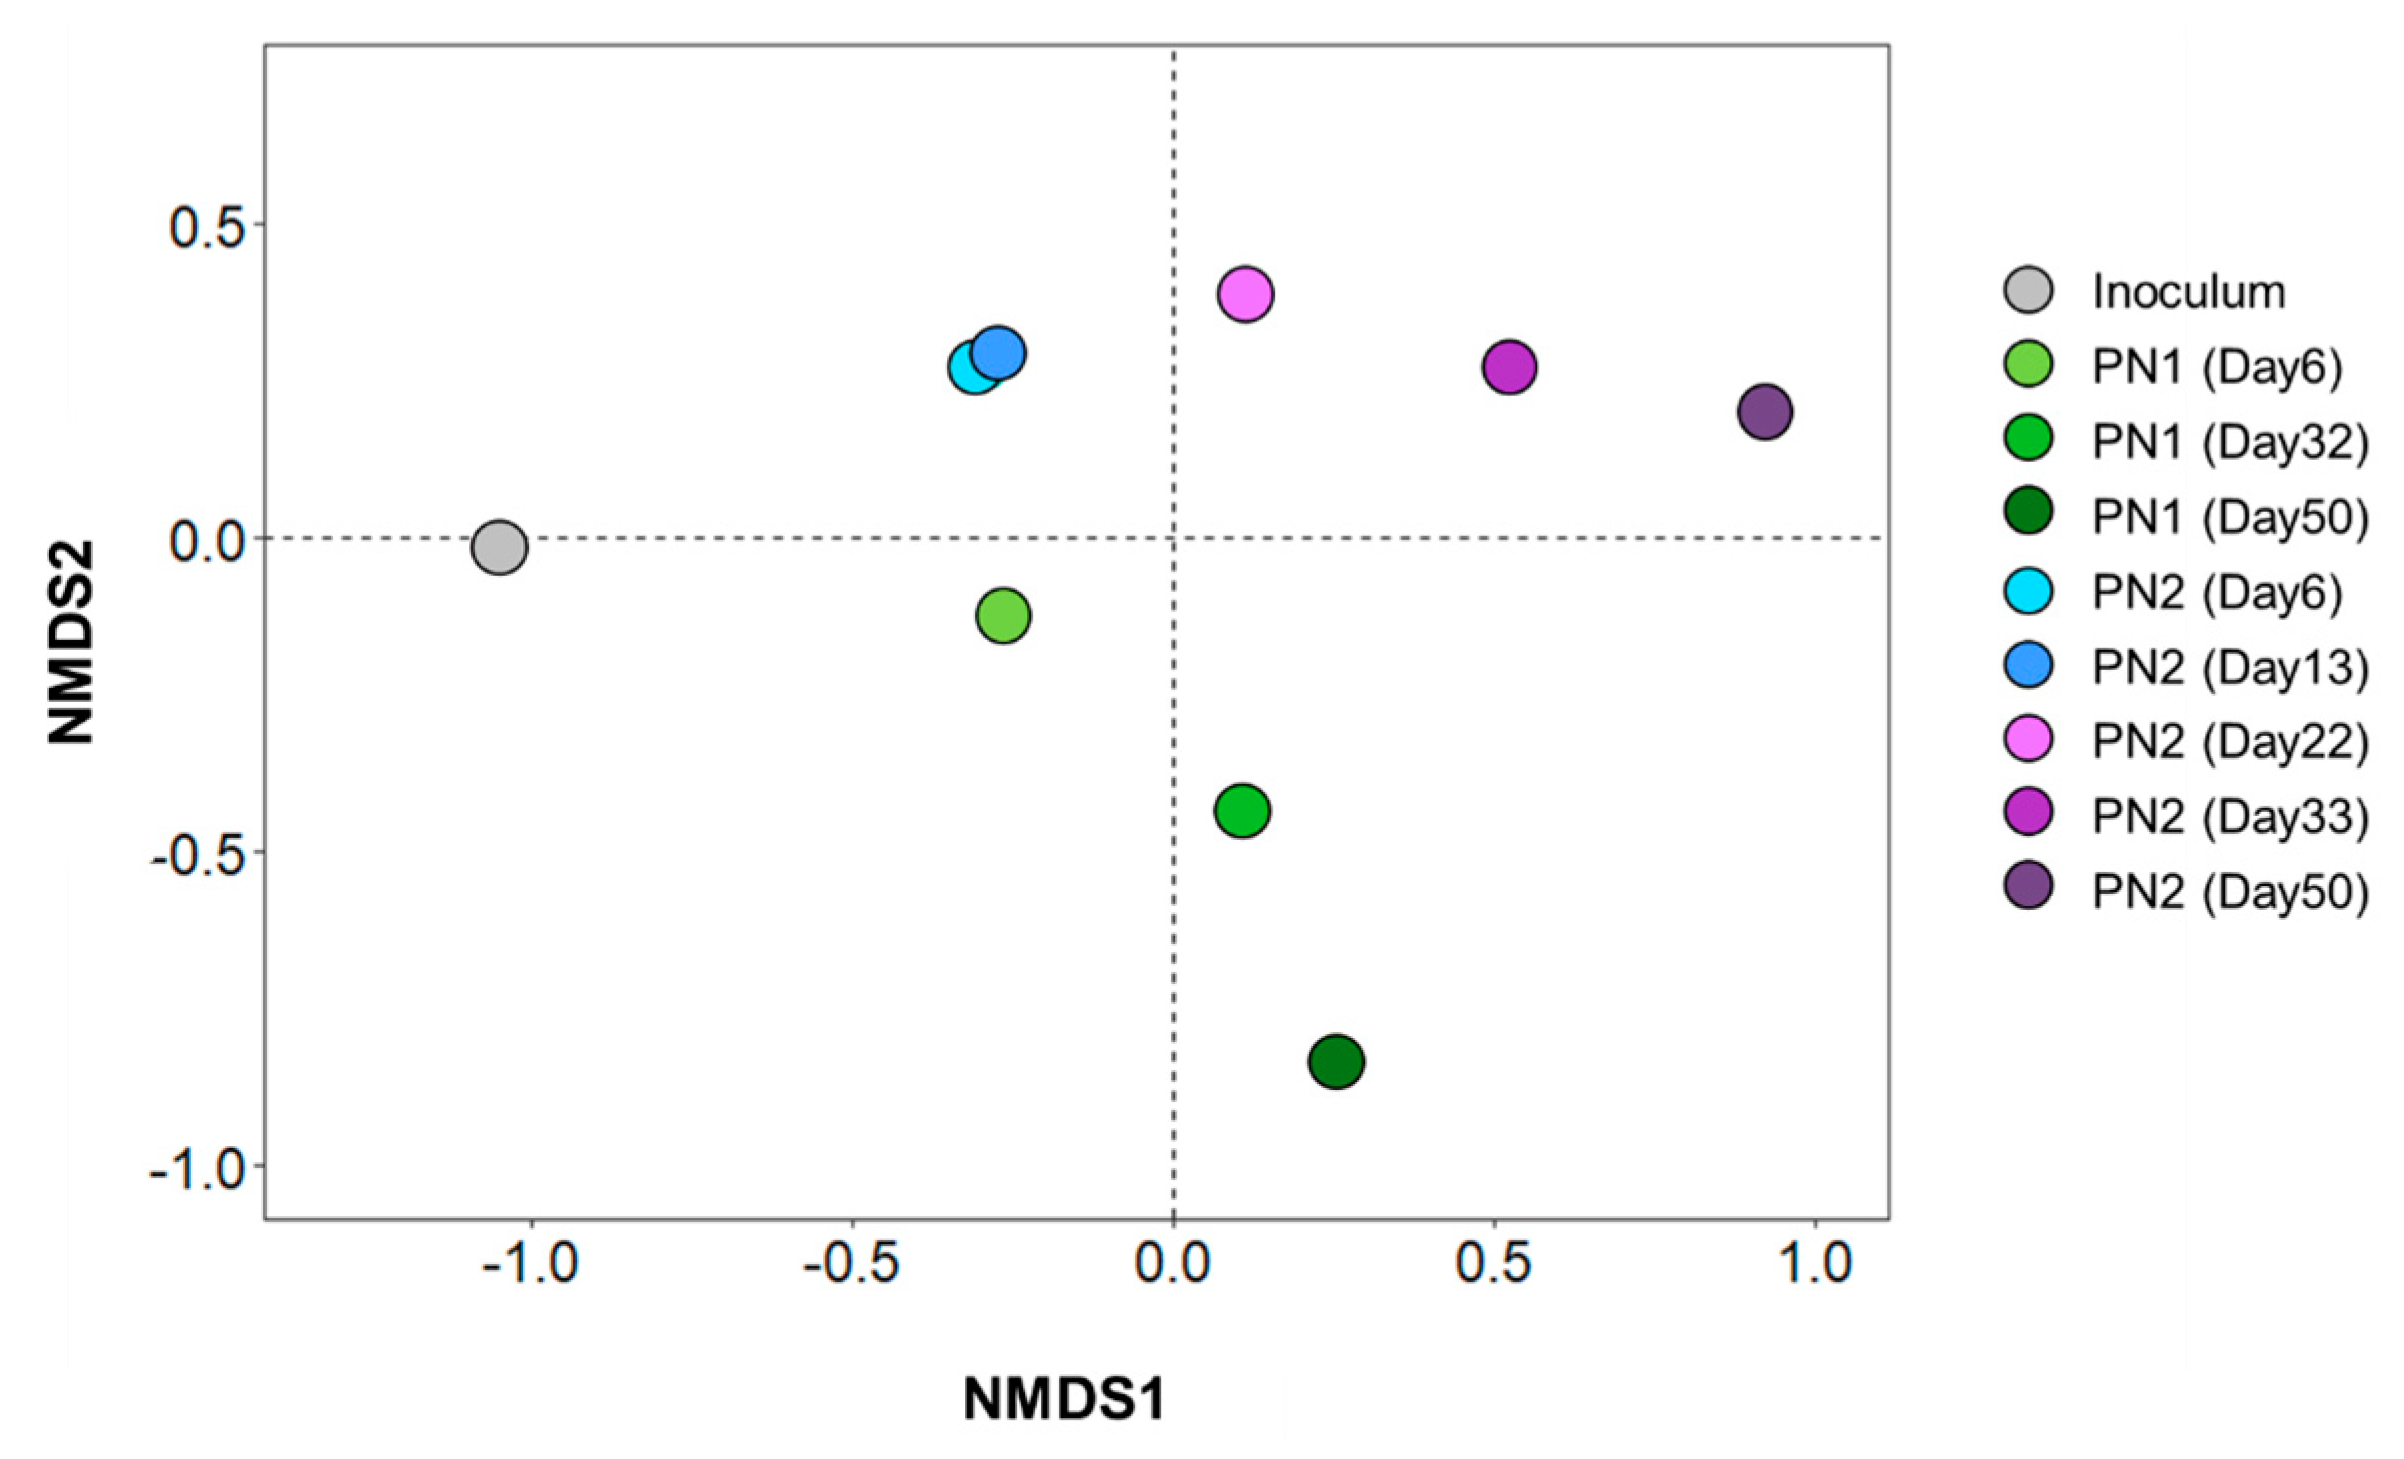
3.2. Changes in Microbial Communities According to FA Concentration

The microbial communities in PN1 and PN2 showed a decrease in diversity indices, such as ASVs, Chao1, and Shannon, during the operation period (Table 3). This decrease suggests that specific microbial communities became dominant during the enrichment of AOB. PN1, affected by low FA, exhibited relatively minor changes in microbial community diversity and maintained a higher species diversity compared to PN2. In contrast, PN2, influenced by high FA concentrations, experienced a rapid decrease in ASVs and species diversity indices by day 6, the initial stage of the nitrification reaction. These results indicate that under high FA concentration conditions, which suppress NOB, the microbial community was simplified in the early stages. Previous studies support these results; for instance, when AOB enrichment was initiated with an influent NH4+-N concentration of 175 mg/L, the OTUs decreased from 3870 to 1430, Chao1 from 3879 to 1450, and Shannon from 6.796 to 3.854 after 34 days. This demonstrates that the diversity indices decreased as NOB was suppressed and AOB became dominant [30].
The microbial diversity and dominant microbial communities underwent significant changes during the AOB enrichment process influenced by FA (Figure 3). At the phylum level, the inoculum primarily comprised Acidobacteria (12.6%), Firmicutes (12.3%), Bacteroidetes (11.0%), and Proteobacteria (10.2%), with other microbial communities (less than 1%) accounting for 45.1%. On day 6 of the nitrification reaction in PN1, the proportions of Acidobacteria and Firmicutes had decreased to 8.4% and 7.2%, respectively, while Bacteroidetes had sharply increased to 36.2%. Proteobacteria showed a slight increase to 12.2%, and the proportion of other microbial communities (less than 1%) had significantly decreased to 24.6%. By day 50, under continued operation with 10 mg/L FA, Nitrospirae and Chloroflexi increased to 28.5% and 14.8%, respectively, whereas Acidobacteria, Firmicutes, and Bacteroidetes had decreased to 6.4%, 1.5%, and 16.0%.
The microbial community dynamics in PN2 also showed significant changes during the nitrification process. On day 6 of the nitrification reaction, the proportion of Acidobacteria and Firmicutes decreased to 6.4% and 5.8%, respectively, while Bacteroidetes and Proteobacteria dramatically increased to 45.5% and 20.6%. After gradually reducing the influent NH4+-N concentration to 50 mg/L (FA of 10 mg/L), by day 50, Bacteroidetes and Firmicutes had decreased to 27.8% and 1.9%, respectively, whereas Acidobacteria and Proteobacteria increased to 9.3% and 35.3%. In PN1, Nitrospirae was the dominant phylum due to the predominance of NOB over AOB, as indicated by the low NAE resulting from NH4+ oxidation [31,32,33]. In contrast, in PN2, Proteobacteria became the dominant phylum. The high proportion of Nitrospirae in PN1 was due to the predominance of NOB over AOB. Meanwhile, in PN2, the stable accumulation of NO2 led to the dominance of AOB belonging to Proteobacteria [34].
The non-metric multidimensional scaling (NMDS) analysis of genus-level changes in the microbial communities of PN1 and PN2 confirmed similar trends to those observed at the phylum level (Figure 4). Although the seed sources for PN1 and PN2 reactors were the same, the microbial communities at the genus-level changed in different directions during the AOB enrichment process influenced by FA concentration. The detailed changes in nitrifying microbial communities are discussed in Section 3.3 below.

3.3. Changes in Dominant Nitrifying Bacteria According to FA Concentration

At the genus level, the changes in the proportion of nitrifying bacteria differed between PN1 and PN2 (Table 4). Representative genera of AOB, which oxidize NH4+ to NO2, include Nitrosomonas, Nitrosospira, and Nitrosococcus. Representative genera of NOB, which oxidize NO2 to NO3, include Nitrospira, Nitrobacter, Nitrotoga, and Nitrococcus [28,29,30]. In the initial inoculum of PN1 and PN2, Nitrosomonas was below the detection limit, and Nitrospira accounted for 1.29%, with no other known AOB and NOB genera detected. Nitrosomonas and Nitrospira are known to be the most common nitrifying bacteria in wastewater treatment plants that perform biological nitrogen removal [35].
In PN1, nitritation was induced but inhibited by FA at 10 mg/L. On day 6, Nitrosomonas increased to 0.24%, and Nitrospira to 3.23%. After 50 days, Nitrosomonas decreased to 2.82%, while Nitrospira significantly increased to 28.45%. It was difficult to suppress NOB at the mainstream NH4+-N concentration of 50 mg/L, making this strategy unsuitable for initiating nitritation.
In contrast, PN2 induced nitritation, inhibited by FA at 50 mg/L. On day 6, Nitrosomonas increased to 3.04%, while Nitrospira decreased to 0.87%. As the influent NH4+-N concentration gradually decreased, the proportion of Nitrosomonas continued to increase, while Nitrospira gradually reduced. Finally, at an influent NH4+-N concentration of 50 mg/L (FA 10 mg/L), Nitrosomonas significantly increased to 23.82%, and Nitrospira decreased to 0.03%. Therefore, starting the operation of a nitritation reactor at a high FA concentration and gradually adapting it to the mainstream wastewater NH4+-N concentration can effectively suppress NOB and stably enrich AOB.

3.4. Implications for the Start-Up of Nitritation Processes in Mainstream WWTPs

The results indicate that starting a PN reactor with a high FA concentration (50 mg/L) and gradually reducing it to a low FA concentration (10 mg/L) effectively suppresses NOB and efficiently enriches AOB. Previous studies have employed various strategies to suppress NOB for mainstream nitrogen treatment. For example, Le et al. (2020) combined low DO (0.2 mg/L) and a high influent NH4+-N concentration (175 mg/L) with a high FA strategy in a CSTR, achieving stable PN at an influent NH4+-N concentration of 50 mg/L in approximately 80 days [30]. At this point, Nitrosomonas reached 4.8%, and Nitrospira was at 0.4%. Additionally, Duan et al. (2019) intermittently applied high FNA (400–500 mg/L) and FA (210 mg/L) inhibition for over 400 days [23]. With an influent NH4+-N concentration of 40 mg/L, the effluent NO2-N was 12 mg/L, and NH4+-N and NO3-N was less than 2 mg/L, indicating effective NOB suppression and NO2- accumulation. Although the proportion of Nitrosomonas was not mentioned, NOB genera Nitrospira and Nitrobacter were detected at less than 0.5%. While various FA concentrations and strategies have been attempted in previous studies, low AOB proportions and long stabilization periods have posed challenges for practical applications. According to this study, starting nitritation with an influent NH4+-N concentration of 300 mg/L (FA of 50 mg/L), and then gradually reducing the influent concentration, can quickly suppress NOB and enrich AOB to high proportions.
In real wastewater treatment plants, achieving high FA levels for mainstream nitrogen treatment may not be feasible. However, integrating the sidestream treatment of anaerobic digester liquor (>500 mg NH4+-N/L) can enable the application of FA inhibition strategies to start a nitritation reactor with suppressed NOB. Furthermore, this strategy can be applied if NO3 production and the proportion of NOB increase during reactor operation. However, further investigation is needed, as information on practical application and controllable strategies remains limited.

4. Conclusions

Applying a high-FA strategy successfully suppressed NOB and enriched AOB, leading to the stable initiation of a nitritation reactor. In PN1, starting with an initial influent NH4+-N concentration of 50 mg/L (FA 10 mg/L) did not suppress NOB, resulting in most of the NH4+ being oxidized to NO3. In contrast, PN2 began with 300 mg NH4+-N/L (FA 50 mg/L) and gradually reduced it, achieving an ARE of 96.1% and an NAE of 95.1% at 50 mg NH4+-N/L (FA 10 mg/L), stably accumulating NO2. The activities of AOB and NOB were 1.32 ± 0.059 gN/gVSS/d and 0.01 ± 0.018 gN/gVSS/d, respectively. The proportion of Nitrosomonas, an AOB genus, was 23.8%, while Nitrospira, a NOB genus, was 0.03%, indicating complete suppression of NOB. Therefore, when starting mainstream nitritation, integrating sidestream treatment and using digester supernatant to reach an FA of 50 mg/L can establish a process that stably accumulates NO2-. While further research and practical applications are needed to validate and optimize this strategy for different operational conditions, this approach ensures effective NOB suppression and AOB enrichment, enhancing nitrogen removal in mainstream WWPTs.

Author Contributions

Writing—original draft, S.J.; conceptualization, S.P. (Seongjae Park); visualization, H.K. and S.Y.; investigation, S.P. (Sewon Park) and D.K.; formal analysis, J.K.; data curation, Y.K.; project administration, J.Y.; supervision and writing—review and editing, T.L. All authors have read and agreed to the published version of the manuscript.

Funding

This research was funded by the Basic Science Research Program (NRF-2021R1A6A1A03039572) and the international cooperation program framework (2023K2A9A2A06060048, FY2023), both managed by the National Research Foundation of Korea.

Institutional Review Board Statement

Not applicable.

Informed Consent Statement

Not applicable.

Data Availability Statement

Data is contained within the article.

Acknowledgments

This work was supported by the Basic Science Research Program (NRF-2021R1A6A1A03039572) and the international cooperation program framework (2023K2A9A2A06060048, FY2023), both managed by the National Research Foundation of Korea.

Conflicts of Interest

Author Jeongmi Kim was employed by the company Technology Development Center, Samsung Engineering Co., Ltd. The remaining authors declare that the research was conducted in the absence of any commercial or financial relationships that could be construed as a potential conflict of interest..

References

  1. Pagga, U.; Bachner, J.; Strotmann, U. Inhibition of Nitrification in Laboratory Tests and Model Wastewater Treatment Plants. Chemosphere 2006, 65, 1–8. [Google Scholar] [CrossRef]
  2. Jetten, M.S.; Strous, M.; Van De Pas-Schoonen, K.T.; Schalk, J.; Van Dongen, U.G.; Van De Graaf, A.A.; Kuenen, J.G. The anaerobic oxidation of ammonium. FEMS Microbiol. Rev. 1998, 22, 421–437. [Google Scholar] [CrossRef] [PubMed]
  3. Kartal, B.; van Niftrik, L.; Keltjens, J.T.; den Camp, H.J.O.; Jetten, M.S. Anammox-growth physiology, cell biology, and metabolism. Adv. Microb. Physiol. 2012, 60, 211–262. [Google Scholar] [CrossRef]
  4. Lackner, S.; Gilbert, E.M.; Vlaeminck, S.E.; Joss, A.; Horn, H.; van Loosdrecht, M.C. Full-scale partial nitritation/anammox experiences–an application survey. Water Res. 2014, 55, 292–303. [Google Scholar] [CrossRef] [PubMed]
  5. Kim, Y.; Yu, J.; Jeong, S.; Kim, J.; Park, S.; Bae, H.; Rhee, S.K.; Unno, T.; Ni, S.Q.; Lee, T. Differences in the effects of calcium and magnesium ions on the anammox granular properties to alleviate salinity stress. Appl. Sci. 2021, 12, 19. [Google Scholar] [CrossRef]
  6. Yu, J.; Kim, Y.; Kim, J.; Jeong, S.; Park, S.; Lee, T. A simple analysis method of specific anammox activity using a respirometer. Appl. Sci. 2022, 12, 1121. [Google Scholar] [CrossRef]
  7. Kim, J.; Yu, J.; Kwon, T.; Choi, W.; Direstiyani, L.C.; Jeong, S.; Kim, Y.; Park, S.; Bae, H.; Lee, T. The real-time monitoring system strategy for stable long-term operation of pilot-scale single-stage deammonification (SSD) process treating moderate-strength NH4+. J. Water Process Eng. 2022, 48, 102895. [Google Scholar] [CrossRef]
  8. Jeong, S.; Kim, J.; Direstiyani, L.C.; Kim, Y.; Yu, J.; Lee, T. Long-term adaptation of two anammox granules with different ratios of Candidatus Brocadia and Candidatus Jettenia under increasing salinity and their application to treat saline wastewater. Sci. Total Environ. 2023, 860, 160494. [Google Scholar] [CrossRef]
  9. Cao, Y.; van Loosdrecht, M.C.; Daigger, G.T. Mainstream partial nitritation–anammox in municipal wastewater treatment: Status, bottlenecks, and further studies. Appl. Microbiol. Biotechnol. 2017, 101, 1365–1383. [Google Scholar] [CrossRef]
  10. Kim, J.; Direstiyani, L.C.; Jeong, S.; Kim, Y.; Park, S.; Yu, J.; Lee, T. Feeding strategy for single-stage deammonification to treat moderate-strength ammonium under low free ammonia conditions. Sci. Total Environ. 2023, 857, 159661. [Google Scholar] [CrossRef]
  11. Wei, Y.; Chen, Y.; Xia, W.; Ye, M.; Li, Y.Y. Dynamic pulse approach to enhancing mainstream Anammox process stability: Integrating sidestream support and tackling nitrite-oxidizing bacteria challenges. Bioresour. Technol. 2024, 395, 130327. [Google Scholar] [CrossRef] [PubMed]
  12. Wang, J.; Li, L.; Liu, Y.; Li, W. A review of partial nitrification in biological nitrogen removal processes: From development to application. Biodegradation 2021, 32, 229–249. [Google Scholar] [CrossRef]
  13. Trinh, H.P.; Lee, S.H.; Jeong, G.; Yoon, H.; Park, H.D. Recent developments of the mainstream anammox processes: Challenges and opportunities. J. Environ. Chem. Eng. 2021, 9, 105583. [Google Scholar] [CrossRef]
  14. Xu, G.; Zhou, Y.; Yang, Q.; Lee, Z.M.P.; Gu, J.; Lay, W.; Cao, Y.; Liu, Y. The challenges of mainstream deammonification process for municipal used water treatment. Appl. Microbiol. Biotechnol. 2015, 99, 2485–2490. [Google Scholar] [CrossRef]
  15. Kao, C.; Li, J.; Gao, R.; Li, W.; Li, X.; Zhang, Q.; Peng, Y. Advanced nitrogen removal from real municipal wastewater by multiple coupling nitritation, denitritation and endogenous denitritation with anammox in a single suspended sludge bioreactor. Water Res. 2022, 221, 118749. [Google Scholar] [CrossRef] [PubMed]
  16. Sui, Q.; Di, F.; Zhang, J.; Chen, M.; Wei, Y. A single-stage membrane aerated biofilm reactor achieving the combination of partial nitritation/anammox and enhanced biological phosphorus removal. J. Water Process Eng. 2024, 58, 104933. [Google Scholar] [CrossRef]
  17. Klaus, S.; Baumler, R.; Rutherford, B.; Thesing, G.; Zhao, H.; Bott, C. Startup of a partial nitritation-anammox MBBR and the implementation of pH-based aeration control. Water Environ. Res. 2017, 89, 500–508. [Google Scholar] [CrossRef] [PubMed]
  18. Zeng, W.; Wang, X.; Li, B.; Bai, X.; Peng, Y. Nitritation and denitrifying phosphorus removal via nitrite pathway from domestic wastewater in a continuous MUCT process. Bioresour. Technol. 2013, 143, 187–195. [Google Scholar] [CrossRef]
  19. Laureni, M.; Weissbrodt, D.G.; Szivák, I.; Robin, O.; Nielsen, J.L.; Morgenroth, E.; Joss, A. Activity and growth of anammox biomass on aerobically pre-treated municipal wastewater. Water Res. 2015, 80, 325–336. [Google Scholar] [CrossRef]
  20. Ma, B.; Bao, P.; Wei, Y.; Zhu, G.; Yuan, Z.; Peng, Y. Suppressing nitrite-oxidizing bacteria growth to achieve nitrogen removal from domestic wastewater via anammox using intermittent aeration with low dissolved oxygen. Sci. Rep. 2015, 5, 13048. [Google Scholar] [CrossRef]
  21. Yeshi, C.; Hong, K.B.; Van Loosdrecht, M.C.; Daigger, G.T.; Yi, P.H.; Wah, Y.L.; Chye, C.S.; Ghani, Y.A. Mainstream partial nitritation and anammox in a 200,000 m3/day activated sludge process in Singapore: Scale-down by using laboratory fed-batch reactor. Water Sci. Technol. 2016, 74, 48–56. [Google Scholar] [CrossRef]
  22. Anthonisen, A.C.; Loehr, R.C.; Prakasam, T.B.S.; Srinath, E.G. Inhibition of nitrification by ammonia and nitrous acid. J. Water Pollut. Control Fed. 1976, 48, 835–852. Available online: https://www.jstor.org/stable/25038971 (accessed on 1 August 2024).
  23. Duan, H.; Ye, L.; Lu, X.; Yuan, Z. Overcoming nitrite oxidizing bacteria adaptation through alternating sludge treatment with free nitrous acid and free ammonia. Environ. Sci. Technol. 2019, 53, 1937–1946. [Google Scholar] [CrossRef] [PubMed]
  24. Gonzalez-Silva, B.M.; Jonassen, K.R.; Bakke, I.; Østgaard, K.; Vadstein, O. Nitrification at different salinities: Biofilm community composition and physiological plasticity. Water Res. 2016, 95, 48–58. [Google Scholar] [CrossRef] [PubMed]
  25. Hüpeden, J.; Wemheuer, B.; Indenbirken, D.; Schulz, C.; Spieck, E. Taxonomic and functional profiling of nitrifying biofilms in freshwater, brackish and marine RAS biofilters. Aquac. Eng. 2020, 90, 102094. [Google Scholar] [CrossRef]
  26. Zhao, H.; Guo, Y.; Wang, Q.; Zhang, Z.; Wu, C.; Gao, M.; Liu, F. The summary of nitritation process in mainstream wastewater treatment. Sustainability 2022, 14, 16453. [Google Scholar] [CrossRef]
  27. Strotmann, U.J.; Windecker, G. Kinetics of Ammonium Removal with Suspended and Immobilized Nitrifying Bacteria in Different Reactor Systems. Chemosphere 1997, 35, 2939–2952. [Google Scholar] [CrossRef]
  28. APHA; AWWA; AEF. Standard Methods for the Examination of Water and Wastewater, 21st ed.; American Public Health Association: Washington, DC, USA, 2005. [Google Scholar]
  29. Wang, B.; Wang, Z.; Wang, S.; Qiao, X.; Gong, X.; Gong, Q.; Liu, W.; Peng, Y. Recovering Partial Nitritation in a PN/A System During Mainstream Wastewater Treatment by Reviving AOB Activity After Thoroughly Inhibiting AOB and NOB with Free Nitrous Acid. Environ. Int. 2020, 139, 105684. [Google Scholar] [CrossRef]
  30. Le, L.T.; Lee, S.; Bui, X.T.; Jahng, D. Suppression of nitrite-oxidizing bacteria under the combined conditions of high free ammonia and low dissolved oxygen concentrations for mainstream partial nitritation. Environ. Technol. Innov. 2020, 20, 101135. [Google Scholar] [CrossRef]
  31. Blackburne, R.; Vadivelu, V.M.; Yuan, Z.; Keller, J. Kinetic characterisation of an enriched Nitrospira culture with comparison to Nitrobacter. Water Res. 2007, 41, 3033–3042. [Google Scholar] [CrossRef]
  32. Wang, X.; Huang, J.; Gao, D. Effects of three storage conditions on the long-term storage and short-term reactivation performances of anammox granular sludge. Int. Biodeterior. Biodegrad. 2021, 164, 105310. [Google Scholar] [CrossRef]
  33. Dacewicz, E.; Lenart-Boroń, A. Waste Polyurethane Foams as Biomass Carriers in the Treatment Process of Domestic Sewage with Increased Ammonium Nitrogen Content. Materials 2023, 16, 619. [Google Scholar] [CrossRef] [PubMed]
  34. Woese, C.R.; Weisburg, W.G.; Paster, B.J.; Hahn, C.M.; Tanner, R.S.; Krieg, N.R.; Stackebrandt, E. The phylogeny of purple bacteria: The beta subdivision. Syst. Appl. Microbiol. 1984, 5, 327–336. [Google Scholar] [CrossRef]
  35. Wang, X.; Wen, X.; Criddle, C.; Wells, G.; Zhang, J.; Zhao, Y. Community analysis of ammonia-oxidizing bacteria in activated sludge of eight wastewater treatment systems. J. Environ. Sci. 2010, 22, 627–634. [Google Scholar] [CrossRef] [PubMed]
Figure 1. Variation in concentrations of nitrogen compounds, ammonium removal efficiency (ARE), and nitrite accumulation efficiency (NAE) during nitritation enrichment: (a,c) PN1 reactor; (b,d) PN2 reactor.
Applsci 14 07801 g001
Figure 2. Activity of AOB and NOB on day 50 under influent NH4+-N of 50 mg/L.
Applsci 14 07801 g002
Figure 3. Changes in phylum-level microbial communities in PN1 and PN2 according to FA concentration.
Applsci 14 07801 g003
Figure 4. Non−metric multidimensional scaling results based on the genus−level microbial communities in PN1 and PN2.
Applsci 14 07801 g004
Table 1. Operational conditions of nitritation in PN1 and PN2.
Operational ConditionPN1PN2
Influent NH4+-N (mg/L)50300, 200, 100, 50
Influent FA (mg/L)1050, 35, 18, 10
HRT (h)5–7.55–10
DO (mg/L)<0.5
pH8.5
Table 2. PCR parameters for amplifying the V3-V4 regions of the bacterial 16S rRNA gene sequence.
PrimerSequence (5’-3’)PCR Conditions
V3FCCTACGGGAGGCAGCAG
  • Initial denaturation step: 3 min at 95 °C.
  • PCR steps (25 cycles)
    denaturation: 30 s at 95 °C;
    annealing: 30 s at 55 °C;
    extension: 30 s at 72 °C.
  • Final extension step: 5 min at 72 °C.
V4RGGACTACHVGGGTWTCTAAT
Table 3. Microbial diversity changes in PN1 and PN2 according to FA concentration.
ReactorSample NameFA
(mg/L)
ASVsChao1ShannonGood’s Coverage
Inoculum0129913088.660.99
PN1Day 610101810247.460.99
Day 33109428537.060.99
Day 50108268366.740.99
PN2Day 6507637646.410.99
Day 13507637646.210.99
Day 22356516526.370.99
Day 33186256256.720.99
Day 50105505526.520.99
Table 4. Relative abundance of nitrifying bacteria at the genus level in PN1 and PN2.
InoculumPN1PN2
Day063350613223350
Nitrosomonas0.000.246.452.823.043.6414.7521.7823.82
Nitrospira1.293.237.9428.480.870.580.190.090.03
Disclaimer/Publisher’s Note: The statements, opinions and data contained in all publications are solely those of the individual author(s) and contributor(s) and not of MDPI and/or the editor(s). MDPI and/or the editor(s) disclaim responsibility for any injury to people or property resulting from any ideas, methods, instructions or products referred to in the content.

