Abstract
To achieve the color matching rules for the textiles discovered during Silk Road excavations between the 4th and 8th centuries, this research proposed an image-based matching network modeling method. The Silk Road facilitated trade and cultural exchange between the East and West, and the textiles found along the way depict the development of fabrics in a color scheme with great cultural significance. A total of 165 images with brocade patterns were collected from a book with a detailed description of the Western influences on textiles along the Silk Road. Two different clustering methods, including the K-means clustering method and octree quantization approach, were used to extract the primary and secondary colors. By combining the HSV color space with the PCCS color system, the color distribution was analyzed to discover the features of representative color patterns. The co-occurrence relationship of the auxiliary colors was explored using the Apriori algorithm, and a total of eight association rules were established. The results showed that the K-means clustering algorithm can show a better effect of color classification to obtain three primary colors and nine secondary colors. The matching mechanism with a visualized network model was also proposed, which showed that reddish-yellow tones are the main colors in the brocade patterns, and the light and soft tones separately account for 27% and 20%. Beige and brown are the most common colorways, with a confidence level of 47%. One style of brocade pattern was used to demonstrate different appearances within various color networks, which could be applied to 3D virtual fitting. This image-based matching network modeling approach makes the color matching schemes visible, and can assist fashion design with fabric features influenced by historical and cultural development.
1. Introduction
The establishment of the Silk Road facilitated close communication between the East and the West, contributing to trade interactions, such as the development of brocade in China [1,2]. The pattern and color design of the fabrics along the road were influenced by Western culture, resulting in a distinctive style. The cultural heritage of the Silk Road continues to have an impact on modern design [3,4]. Color plays a significant role in creating clothing patterns, and is considered as a cultural symbol that can express corresponding cultural imagery and reflect collective thinking and aesthetic conceptions in a specific era or place. Research on the patterns and colors of related fabrics may make the new design more classical and elegant [5].
Brocade, as a Chinese traditional silk fabric, has been evolving and changing over time, eventually spawning many categories, such as Zhuang, Song, and Yun. Many scholars have analyzed various kinds of brocade to summarize the typical manufacturing processes, patterns, and colors, and focused on how to apply the feature into the design of contemporary garments [6,7]. Huang et al. explored the visual perception and cultural characteristics of Zhuang brocade through Likert scale tests and eye tracker experiments [5]. In addition, other methods, including expert interviews, cultural relic inspections, and field surveys, were used to assess the color and perform a related cultural analysis of traditional brocade fabrics, with strong subjectivity and unquantifiable results. Therefore, the research findings cannot be easily and intuitively expressed to the designers or related clothing enterprises, which limits the subsequent design applications.
Generally, some software such as Photoshop CC 2019 or a colorimeter may be used for color extraction from real items or images, and the process is subjective and takes a lot of time [8,9]. Some scholars have proposed methods for color extraction based on computer technologies, which can directly reflect the quantification of the color to increase the productivity. As a prominent and typical technique for quantifying colors, clustering methods, including K-means and mean-shift clustering, are frequently used to extract and analyze color themes [10,11]. Different assessment models are used to investigate the emotional preferences for color and to provide guidance for the development of color schemes [12]. Although the clustering algorithm is quick, the number of clustering centers k is difficult to determine. Due to the limitations of the algorithm, the scholars often need to improve the clustering method or implement multiple clusters to achieve better results, such as determining the initial clustering center of K-means [13]. Liu et al. used the K-means clustering algorithm to improve the selection method of the initial cluster center, and an objective evaluation system was built to effectively evaluate the color extraction effect of Dai brocade [14]. Zhang et al. compared the main color extraction results of K-means in gray scale and tone mode, and concluded that gray scale mode is more suitable for color extraction of textile images [15]. In order to better inherit and carry forward national culture, Chen et al. used the K-means algorithm to extract the characteristic colors of women’s and men’s clothing for the Liangshan Yi group. Complex network concepts were introduced to build a color relationship network, which intuitively showed the color matching characteristics of Yi clothing for product design [16]. Wang et al. used fuzzy C-means (as an improved algorithm of K-means) to extract the colors from representative images of Taiwan and New Zealand, and the results were applied to the design of cultural and creative products [13].
Additionally, other clustering methods were also used to ensure the accuracy of color extraction. Xu et al. used two K-means clustering methods to obtain color values and percentages in the source images for color mapping of patterns [14]. Zhao et al. designed a textile pattern restoration method based on multivariate fuzzy C-means (MFCM) clustering and K-means algorithms. The extraction effect of this method is superior to the traditional digital color extraction method, and the color extraction efficiency is higher [17]. In addition, customer values can also affect garment choices, and user input can greatly promote product development [15]. Scholars have used EEG changes, case-based reasoning, and fuzzy evaluation models based on eye tracking technology to analyze color matching relationship based on rules or user preferences [16,18,19]. Based on human visual features, Zhao et al. combined visual salience with the K-means clustering analysis to extract the color of traditional Mongolian saddles [12]. Since the manual analysis may be time-consuming and subjective, automatic color extraction technology is necessary. The results can be used as a guide for the color matching schemes of new products to help them stand out from the competition. At present, many algorithms have been used for color extraction related to fabrics, and different algorithms are applicable for different research objects. However, due to the complexity and diversity of fabric products, most of the algorithms cannot meet people’s high requirements. It is necessary to obtain a color recognition technology that can realize high robustness and strong applicability through further research and attempts.
Moreover, the color system can provide a unified measurement standard for the research on color matching and color image analysis. There are some commonly used color systems, including the Munsell color system, Natural Color System (NCS), Japanese Practical Color Co-coordinate System (PCCS), etc. Qi et al. combined numerical information from the Munsell color scheme and PCCS color scheme, and quantitatively analyzed the differences in commonly used clothing colors in north and south China. Liu used the NCS system to determine the color codes of the collected cheongsam, and discovered the distribution trend of fabric patterns through the NCS color [20]. In addition, scholars have explored color matching characteristics from handed down, signs, and advertising paintings. However, most research is a subjective summary of the overall style based on the development of patterns or styles and lacks a quantitative analysis of relevant colors. The subjective description has a certain degree of ambiguity, and the results cannot directly be used for classical design. At present, most research on color matching rules is based on the subjective feelings of scholars or consumers, and there is a lack of relevant research on color matching rules based on objective indicators. In addition, the existing research focuses on the mining of rules, and there are few related studies on re-creation based on color matching rules using computer technology.
Therefore, to display the color features of the brocade fabrics found along the Silk Road, this study will propose an image-based matching network modeling method. The images will be preprocessed using a bilateral filtering and variation smoothing model to remove noise. The K-means clustering algorithm will be used for single and multiple images to obtain the overall and respective feature colors of the primary and secondary colors. The extracted feature colors will be converted into HSV space, and the PCCS color system will be used to quantify the distribution of basic color attributes. Based on the Apriori algorithm, the matching network model will be established to summarize the color patterns of the brocade. According to the color matching models, the classical pattern will be redesigned to form different fabric styles. This image-based matching network modeling approach can quickly build the color matching schemes, which can be used for fashion design with fabric features influenced by historical and cultural development.
2. Methods
2.1. Framework
Lei et al. proposed an improved clustering algorithm by combining superpixel segmentation and a superpixel-based fast fuzzy C-means clustering algorithm (hereinafter referred to as the SFFCM algorithm) [21]. As shown in the research results, SFFCM is very fast at color image segmentation because the number of different colors is reduced efficiently due to superpixels and color histograms. Moreover, SFFCM obtains an excellent result for color image segmentation because both adaptive local spatial information and global color features are incorporated into the objective function.
Image segmentation can be achieved to reduce the number of colors and improve the operation efficiency. The watershed segmentation algorithm of multi-scale morphological gradient reconstruction can be used to generate superpixel images. The fuzzy C-means clustering method can be applied to process the segmented images, and the color images with only the main color can be finally obtained.
Therefore, an image-based matching network modeling method was proposed to analyze the characteristic colors of 4th–8th century brocade. Based on the color images, SFFCM was used for image segmentation to improve the complexity and reduce the running time. The K-means algorithm was then used for color classification by calculating the distance between each sample and the cluster center. Compared with the fuzzy clustering method, the K-means algorithm has the advantages of a fast processing speed and easy implementation. The characteristic colors of the brocade images were converted into HSV space. By combining the PCCS system for analyzing the hue of the representative color and the color distribution, the Apriori algorithm was applied to establish the matching network model between secondary colors. The color matching scheme can be established, as shown in Figure 1. As for the images of brocade patterns from the 4th to 8th centuries, bilateral filtering and variation smoothing models were used to remove noise from the images. K-means clustering and the octree algorithm were then used to compare the results, and the color value was converted into HSV space to analyze the distribution with PCCS system. Finally, a color matching model was proposed using the Apriori algorithm and can be applied to a new product.
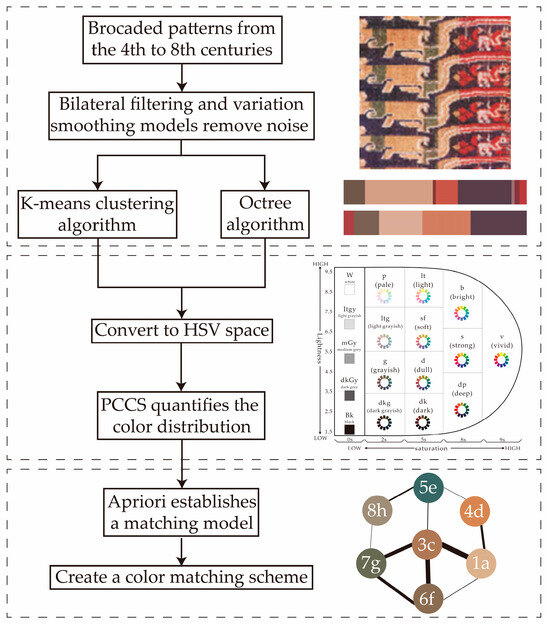
Figure 1.
Framework.
2.2. Dataset Creation
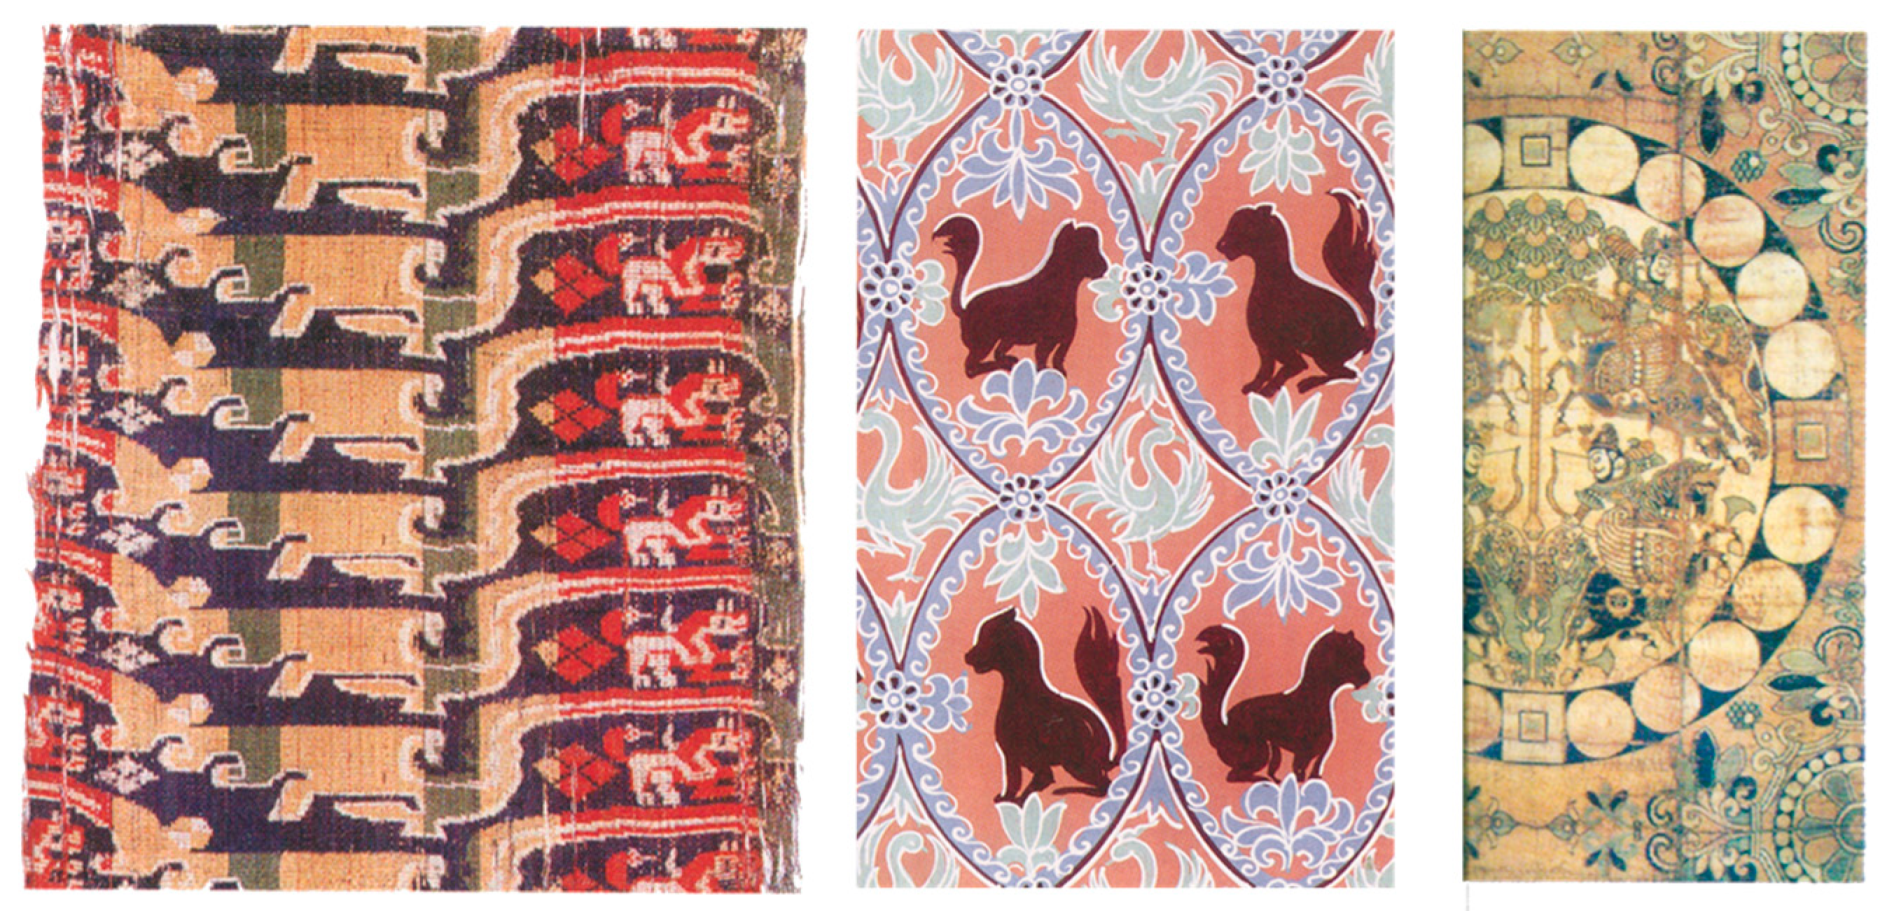
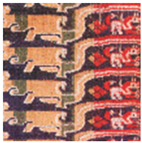
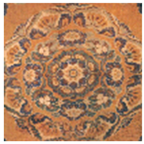
Due to the widespread distribution of surviving textiles on the Silk Road from the 4th to 8th centuries, as well as the problems of longevity and serious surface damage, it is difficult to collect them in physical form. Therefore, 165 images of the brocade fabrics were collected from a book [17]. The book provides detailed descriptions of the textiles along the Silk Road influenced by Western culture, and demonstrates many physical and restored images. The memory size per image is about 2 MB, and the resolution is 300 × 300 dpi. A professional scanner (Epson Perfection V370 Photo) was used to collect the images in order to avoid the effects of the camera angle and light on the results. A neutral gray card was also placed prominently during scanning, and the exposure settings were adjusted to make the gray card display as neutral gray (18% gray) for subsequent color reference. The test images were captured and imported into Lightroom 2021 software for white balance correction, which can greatly enhance color accuracy, as shown in Figure 2.

Figure 2.
Color images of the brocade fabrics (examples).
2.3. Color Extraction
2.3.1. Image Preprocessing
To reduce the effect of the fabric texture on the surface, a structure extraction algorithm based on the total variation model was firstly used to smooth the texture in the image [22]. The process of image as preprocessing is shown in Figure 3.

Figure 3.
Image preprocessing flow diagram.
The bilateral filtering algorithm was then applied to denoise the image before extracting the color, which is shown in Equation (1):
In Equation (1), the parameter σS defines the size of the spatial neighborhood used to filter a pixel, and σr controls the weight of adjacent pixels due to the intensity difference. Wbf normalizes the sum of the weights.
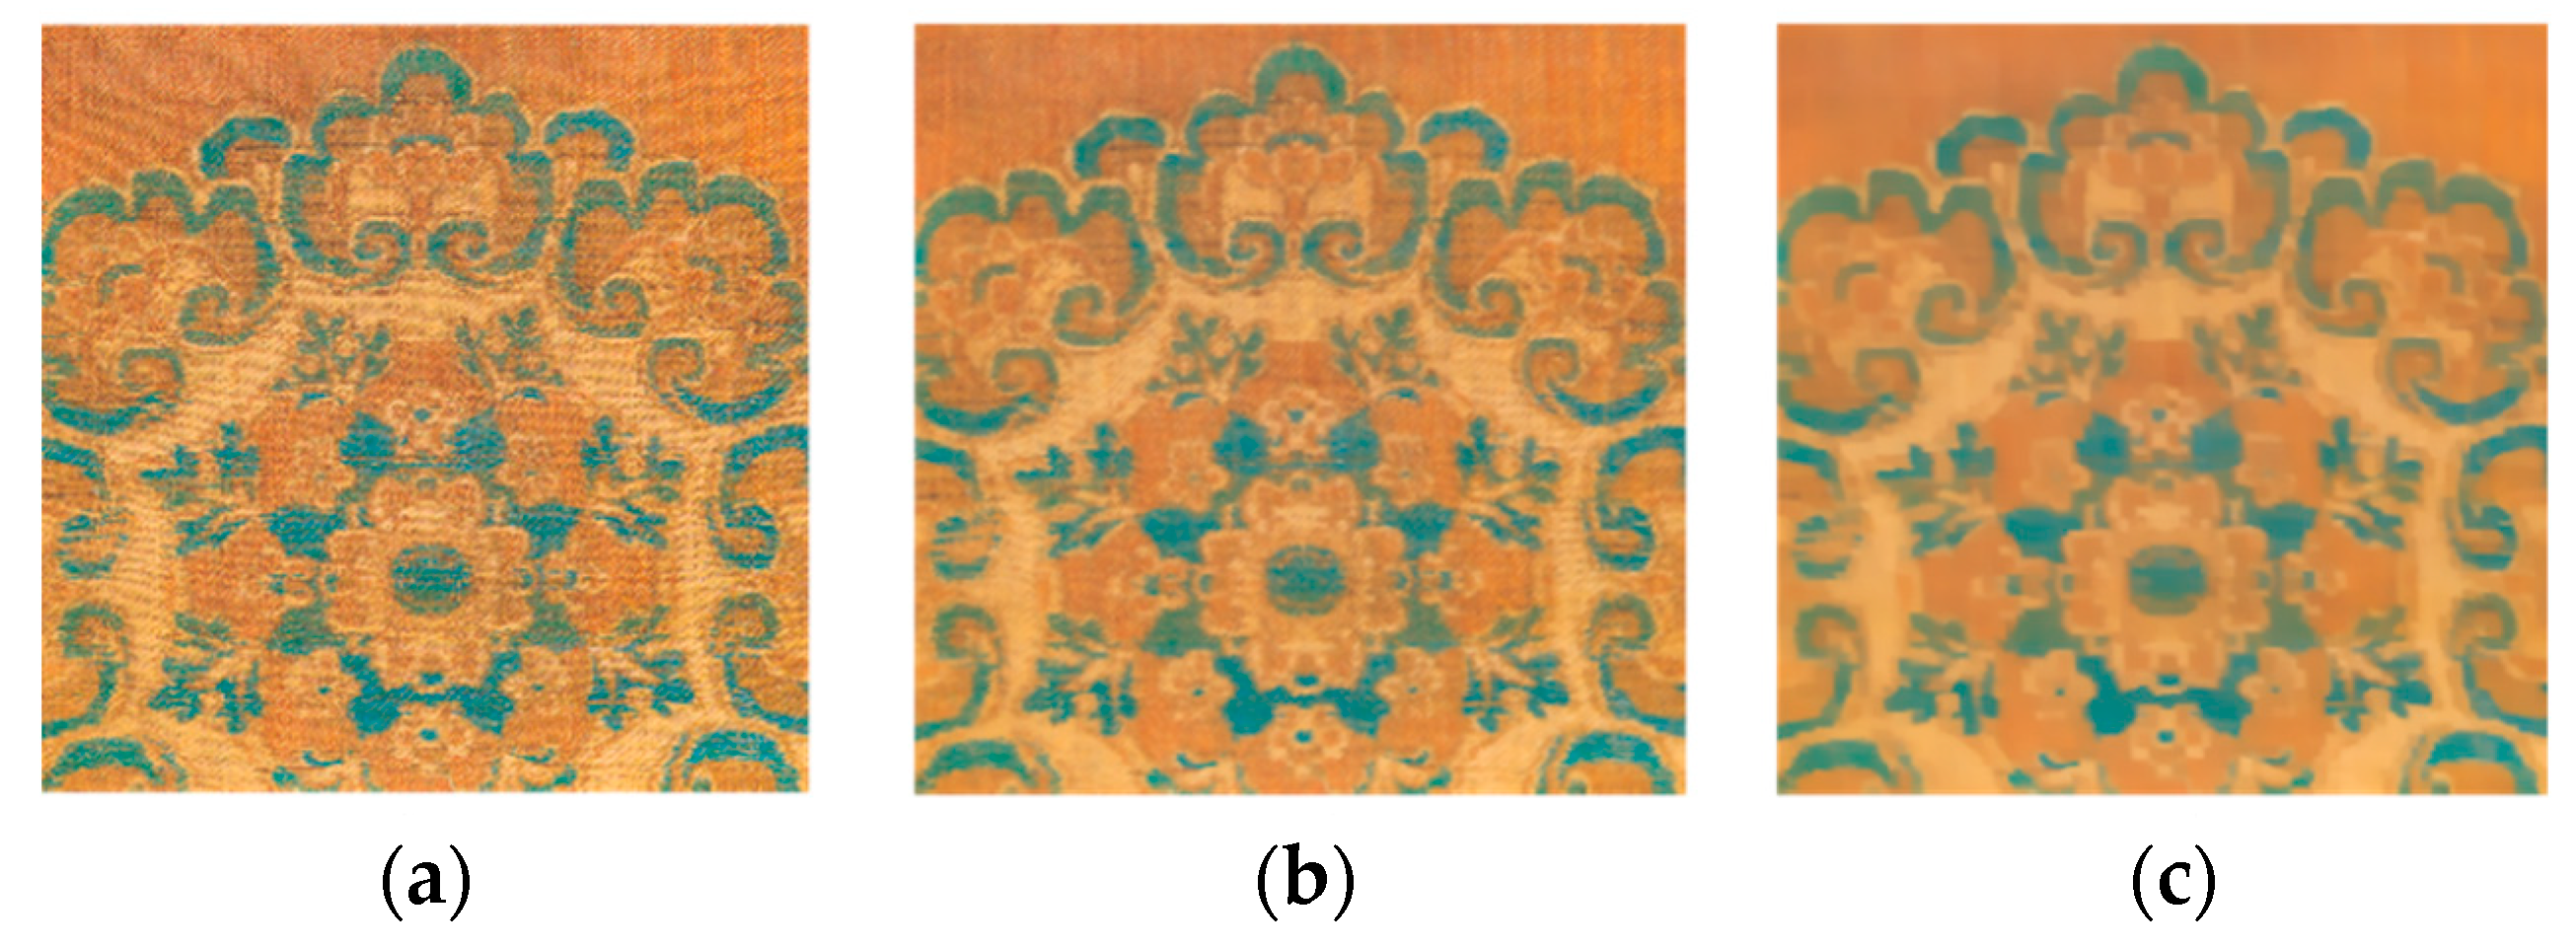
One style of the brocade pattern was taken as an example (see Figure 4a), and the experimental results were compared with different settings of the σS and σr values. The results showed that when the σS was set to 5 and σr was 0.35, the extracted edges of the pattern demonstrated the best appearance. Figure 4b illustrates the effect after dual edge filter blurring. Similarly, several experiments were conducted to compare the outcomes, and the appropriate parameters were finally set to obtain better smoothing results, as seen in Figure 4c.
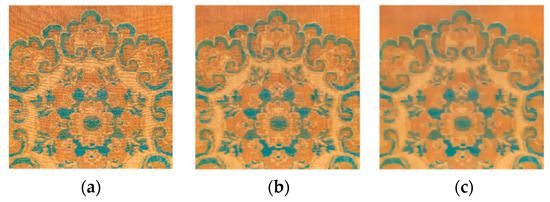
Figure 4.
Image preprocessing results. (a) Original image; (b) image processed by double edge filter blurring; and (c) image processed by the total variance model.
2.3.2. Methods of Color Extraction
According to previous research, color extraction is usually realized by the K-means clustering algorithm and the octree quantization algorithm. The K-means algorithm uses distance as an assessment metric for similarity, while the octree quantization algorithm uses a color octree with a depth of 8 and K leaves.
A group of the processed brocade images with distinct color blocks was taken as the comparative objects. These two methods were applied to compare the effectiveness of color extraction. The number of clusters (K-value) was set as a constant number (such as K = 3, 5, and 6), and the extracted results from the two methods are shown in Table 1.

Table 1.
Comparison of the results from the octree and K-means algorithms.
There are large color blocks for most experimental samples, with almost no color gradient. According to the comparison between the two algorithms, the octree quantization approach is unstable for the number of sub-nodes merged during the runtime, and the output of the color number may be less or more than the set of the K-value. Although the octree algorithm cannot control the number of extracted colors, it consumes less time and can extract part of the gradient colors and relatively small prominent colors. Although the K-means clustering algorithm cannot extract relatively small prominent colors, it can control the number of colors obtained and can better identify subtle differences, such as gradient color changes. Compared with the octree quantization approach, the K-means clustering algorithm can show a better effect of color classification. The color differences in the extracted colors through the K-means method were also compared with the CIE2000 color difference formula, and the results showed that there was high consistency. Therefore, the K-means clustering method was used for the further color extraction. As for each image of the brocade pattern, the color with the largest proportion is defined as the primary color, and the others as the secondary colors. All the primary and secondary colors were independently clustered for the representative colors.
2.3.3. Determination of the Cluster Number
Before the clustering analysis, the elbow method and silhouette coefficient method were used to determine the optimal cluster number (the K-value). The elbow method is proposed to explain and verify the consistency of the clustering analysis, aiming to find the appropriate number of clusters in the dataset. The elbow method is a heuristic used to determine the optimal number of clusters in partitioning clustering algorithms such as k-means, k-modes, and k-prototypes clustering algorithms. With the increase in the number of clusters, the total cluster variance for a given dataset decreases rapidly. After a point, the total cluster variance becomes almost constant or the rate of decrease in total cluster variance becomes very low. The calculative formula is shown in Equation (2):
In Equation (2), SSE is the sum of the squared errors, p is the element of cluster Ci, K is the number of clusters, and mi is the mean value of all elements in Ci.
The degree of sample division and clustering center aggregation are proportional to K, and SSE is inversely proportional to K. When the K-value is less than the actual number of clusters, as K increases, the aggregation degree of each cluster center will be greatly increased, and SSE will be greatly reduced. When K is greater than the actual number of clusters, although SSE is also showing a downward trend as K increases, it eventually tends to be flat. It could be seen that the relationship between SSE and K was elbow-shaped, and the K-value corresponding to the elbow was the best.
Silhouette coefficient is also a way to evaluate the cluster effect with two factors of cohesion and separation. The silhouette coefficient is a metric used to evaluate the quality of clustering in computer science. It measures the coherence of clusters, with a higher coefficient indicating more coherent clusters. The silhouette coefficient S(i) evaluates if a single sample is gathered reasonably in a category. The specific formula is shown in Equation (3):
In Equation (3), a(i) is the average distance between data sample i and all other samples in its cluster, and b(i) is the minimum average distance between sample i and all the samples in any other cluster without the sample i.
For each type i, S(i) varies between −1 and 1. When S(i) is close to 1, the value of a(i) is much smaller than b(i), which means that sample i is assigned to an appropriate cluster with a good cluster effect. However, when S(i) is close to 0, the values of a(i) and b(i) are approximately equal, and it is not clear to which cluster type sample i belongs. When S(i) is close to −1, a(i) is much larger than b(i), which means that sample i is closer to the other cluster type with a poor cluster effect. A high S(i) indicates that the sample matches well with its own cluster, but matches poorly with other clusters. If most samples have a high S(i), the clustering results are appropriate. If the S(i) of many samples is low or negative, the clustering number may be too large or small.
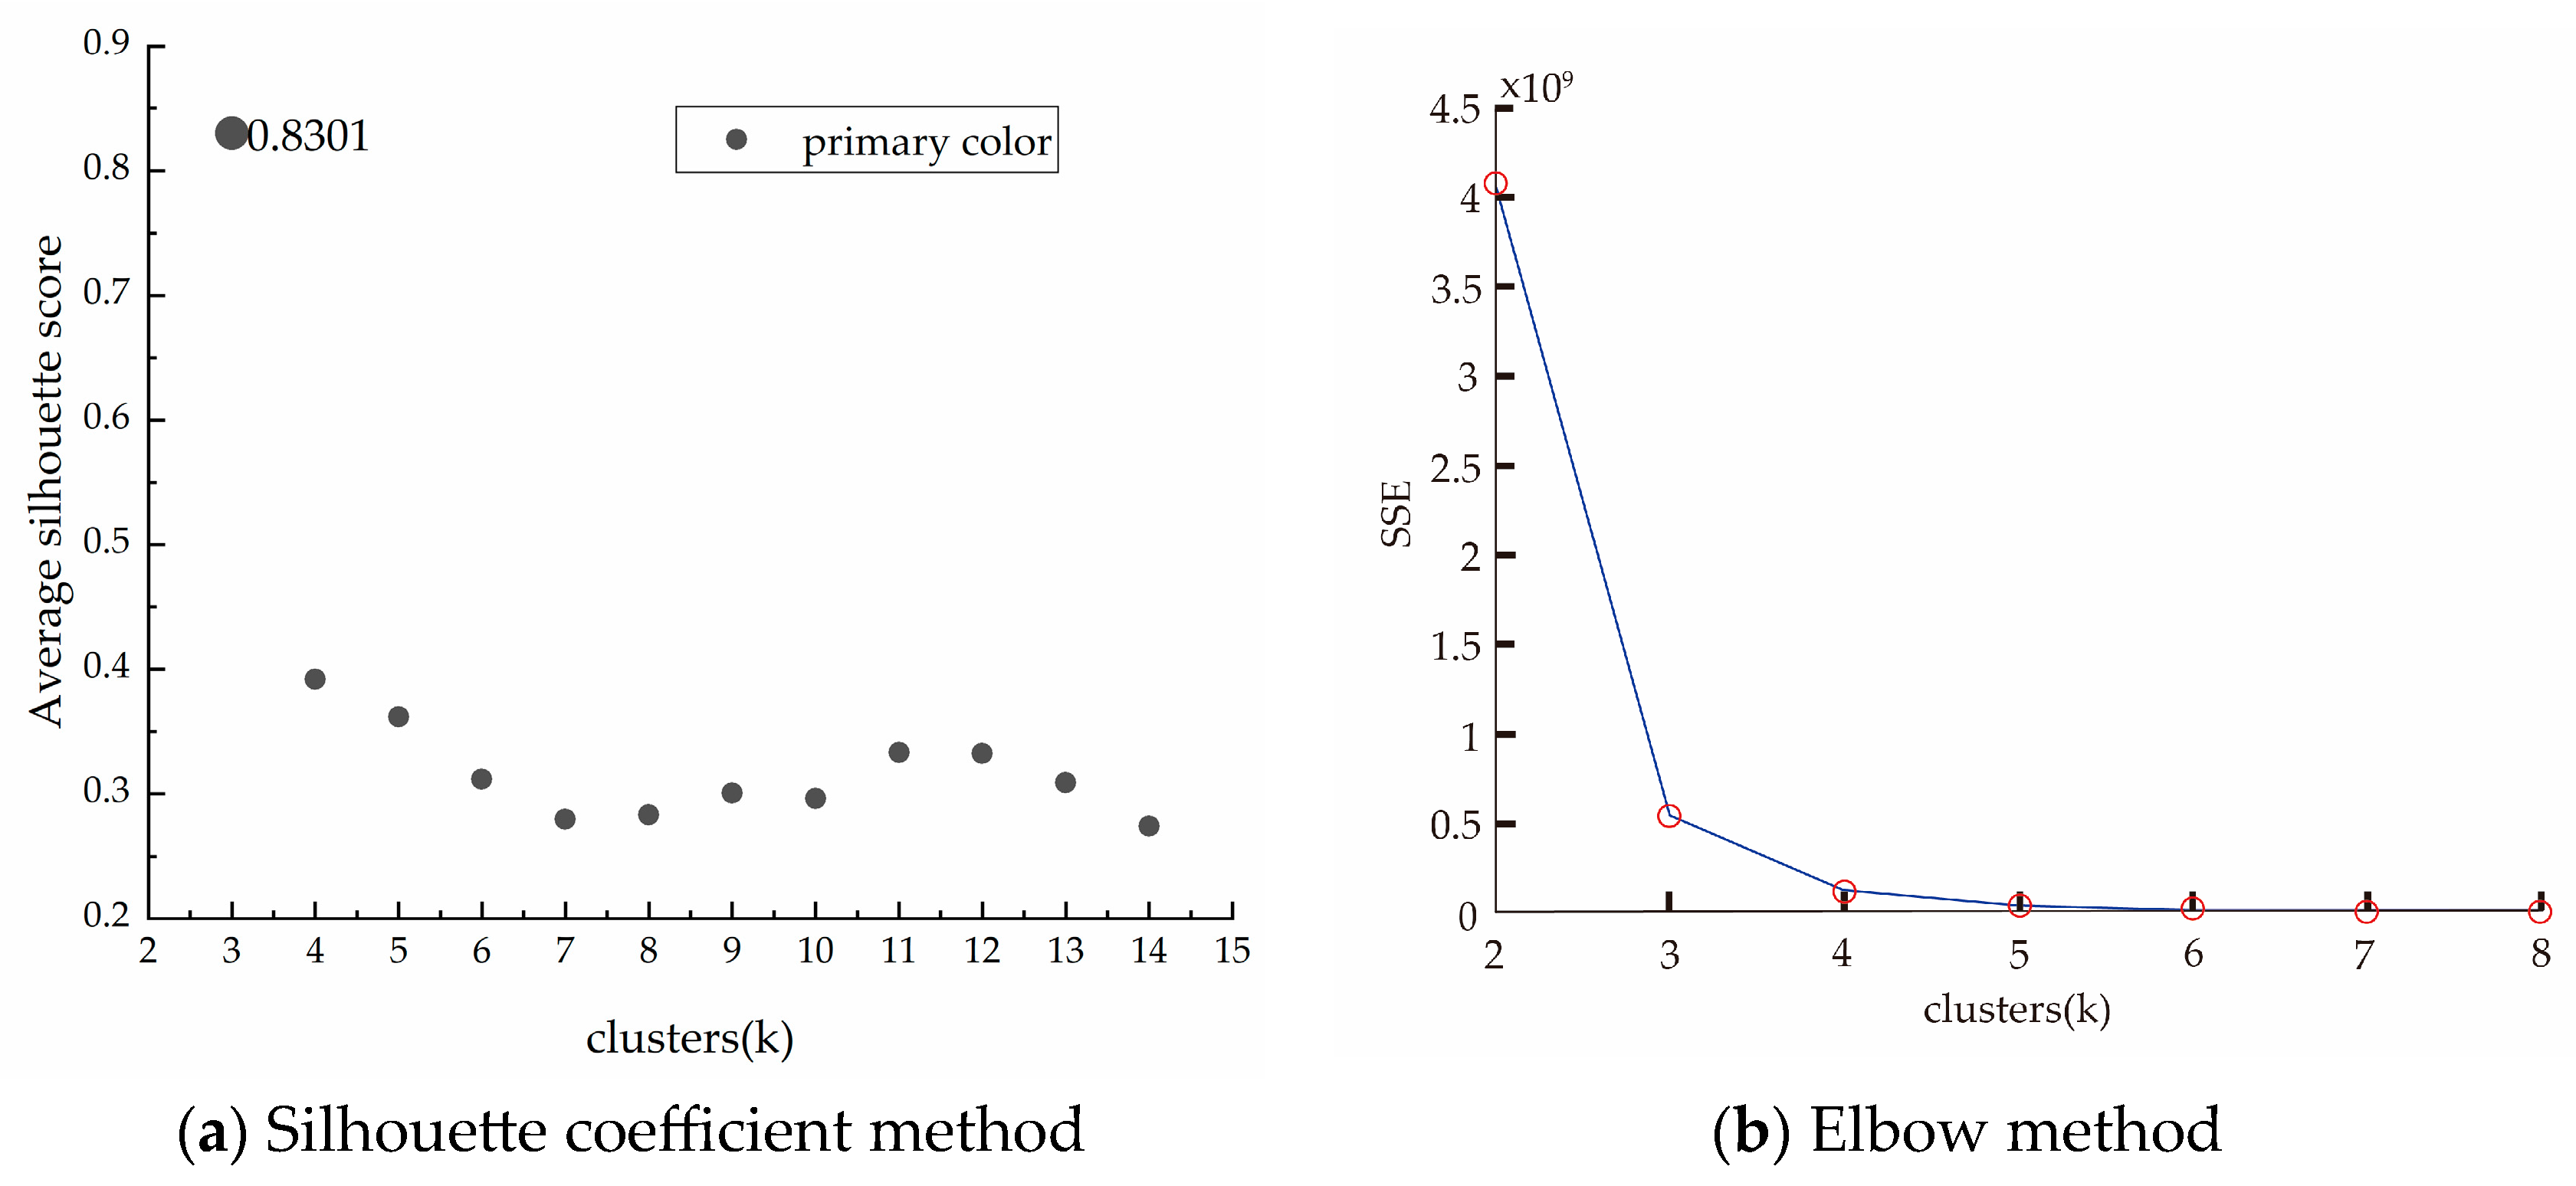
All the colors extracted from the 165 images were analyzed by these two methods, and the determination of the cluster number for the primary color was taken as an example. Figure 5a shows the results of the silhouette coefficient method, and the S(i) value is the largest and generally approaches 1 when the K-value is three. Figure 5b indicates that the cluster effect is the best when the K-value is three using the elbow method. Therefore, after combining the two methods, the optimal cluster number is selected as three for the primary colors. Similarly, the cluster number of the secondary colors should be set as nine.
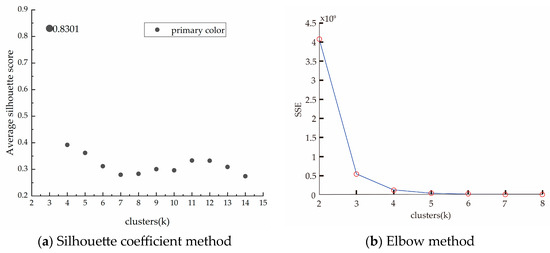
Figure 5.
Determination of the cluster number for the primary color.
2.4. Establishment of the Color Matching Network
2.4.1. Color Conversion
The color space will directly affect the description of color features. Red (R), green (G), and blue (B) are the fundamental colors of the RGB color space; however, human eyes have different sensitivities to these colors. Since human eyes are least sensitive to red and most sensitive to blue among the monochromatic hues, the RGB color space is uneven for human eyes. Since RGB is computer coded and unsuitable for a visual color analysis, the extracted color values in RGB space needs to be converted into HSV color space for the network model, including a visual representation of color tones, brightness, and lightness. H stands for hue, which denotes the hue attribute and is connected to wavelength. S represents color intensity and stands for saturation. Value, abbreviated as V, refers to color brightness. Formulas (4)–(6) are used to convert the RGB parameters of the extracted representative colors into HSV parameters [23]:
In Equations (4)–(6), max and min stand for the R, G, and B maximum and minimum values. H ∈ [0, 360°], S ∈ [0, 1], and V ∈ [0, 1].
After the conversion to HSV space, the Apriori algorithm was used to excavate frequently recurring datasets according to support and confidence, and the collocation correlations could be analyzed to establish the matching models. Support represents the percentage of various related data in the dataset, and confidence reflects the possibility that one data point will appear after another.
2.4.2. Apriori Mining Algorithm for Association Rules
The Apriori algorithm is an unsupervised machine learning algorithm used for association rule learning. Association rule learning is a data mining technique that identifies frequent patterns, connections, and dependencies among different groups of items called item sets in data. Some common use cases are disease prediction and recommendation systems like a market basket analysis for ecommerce platforms. The Apriori algorithm is an association rule mining algorithm that is used to discover whether there is a high correlation between two factors [24]. Association rule mining is an algorithm that realizes an association analysis by analyzing the relationships with significant support and confidence levels. It has the advantages of a simple principle and high efficiency.
Therefore, the Apriori algorithm was selected to explore the symbiotic relationship of auxiliary colors. Support and confidence are two main branch indexes to measure the relationship in an association rule algorithm. Support is the probability that item sets A and B will occur simultaneously in all transactions. Confidence is the probability that itemset B will occur if item set A has already occurred, as shown in Equation (7). Generally, the minimum support (minSup) and minimum confidence (minCon) are set to filter the rules.
Association rules refer to the association form A → B, where A ⸦ I, B ⸦ I, A ∩ B = 0, A is the first term, and B is the last term. When the support and confidence of the association form A → B are both greater than or equal to the minimum support and confidence thresholds, the level of the association rule is strong.
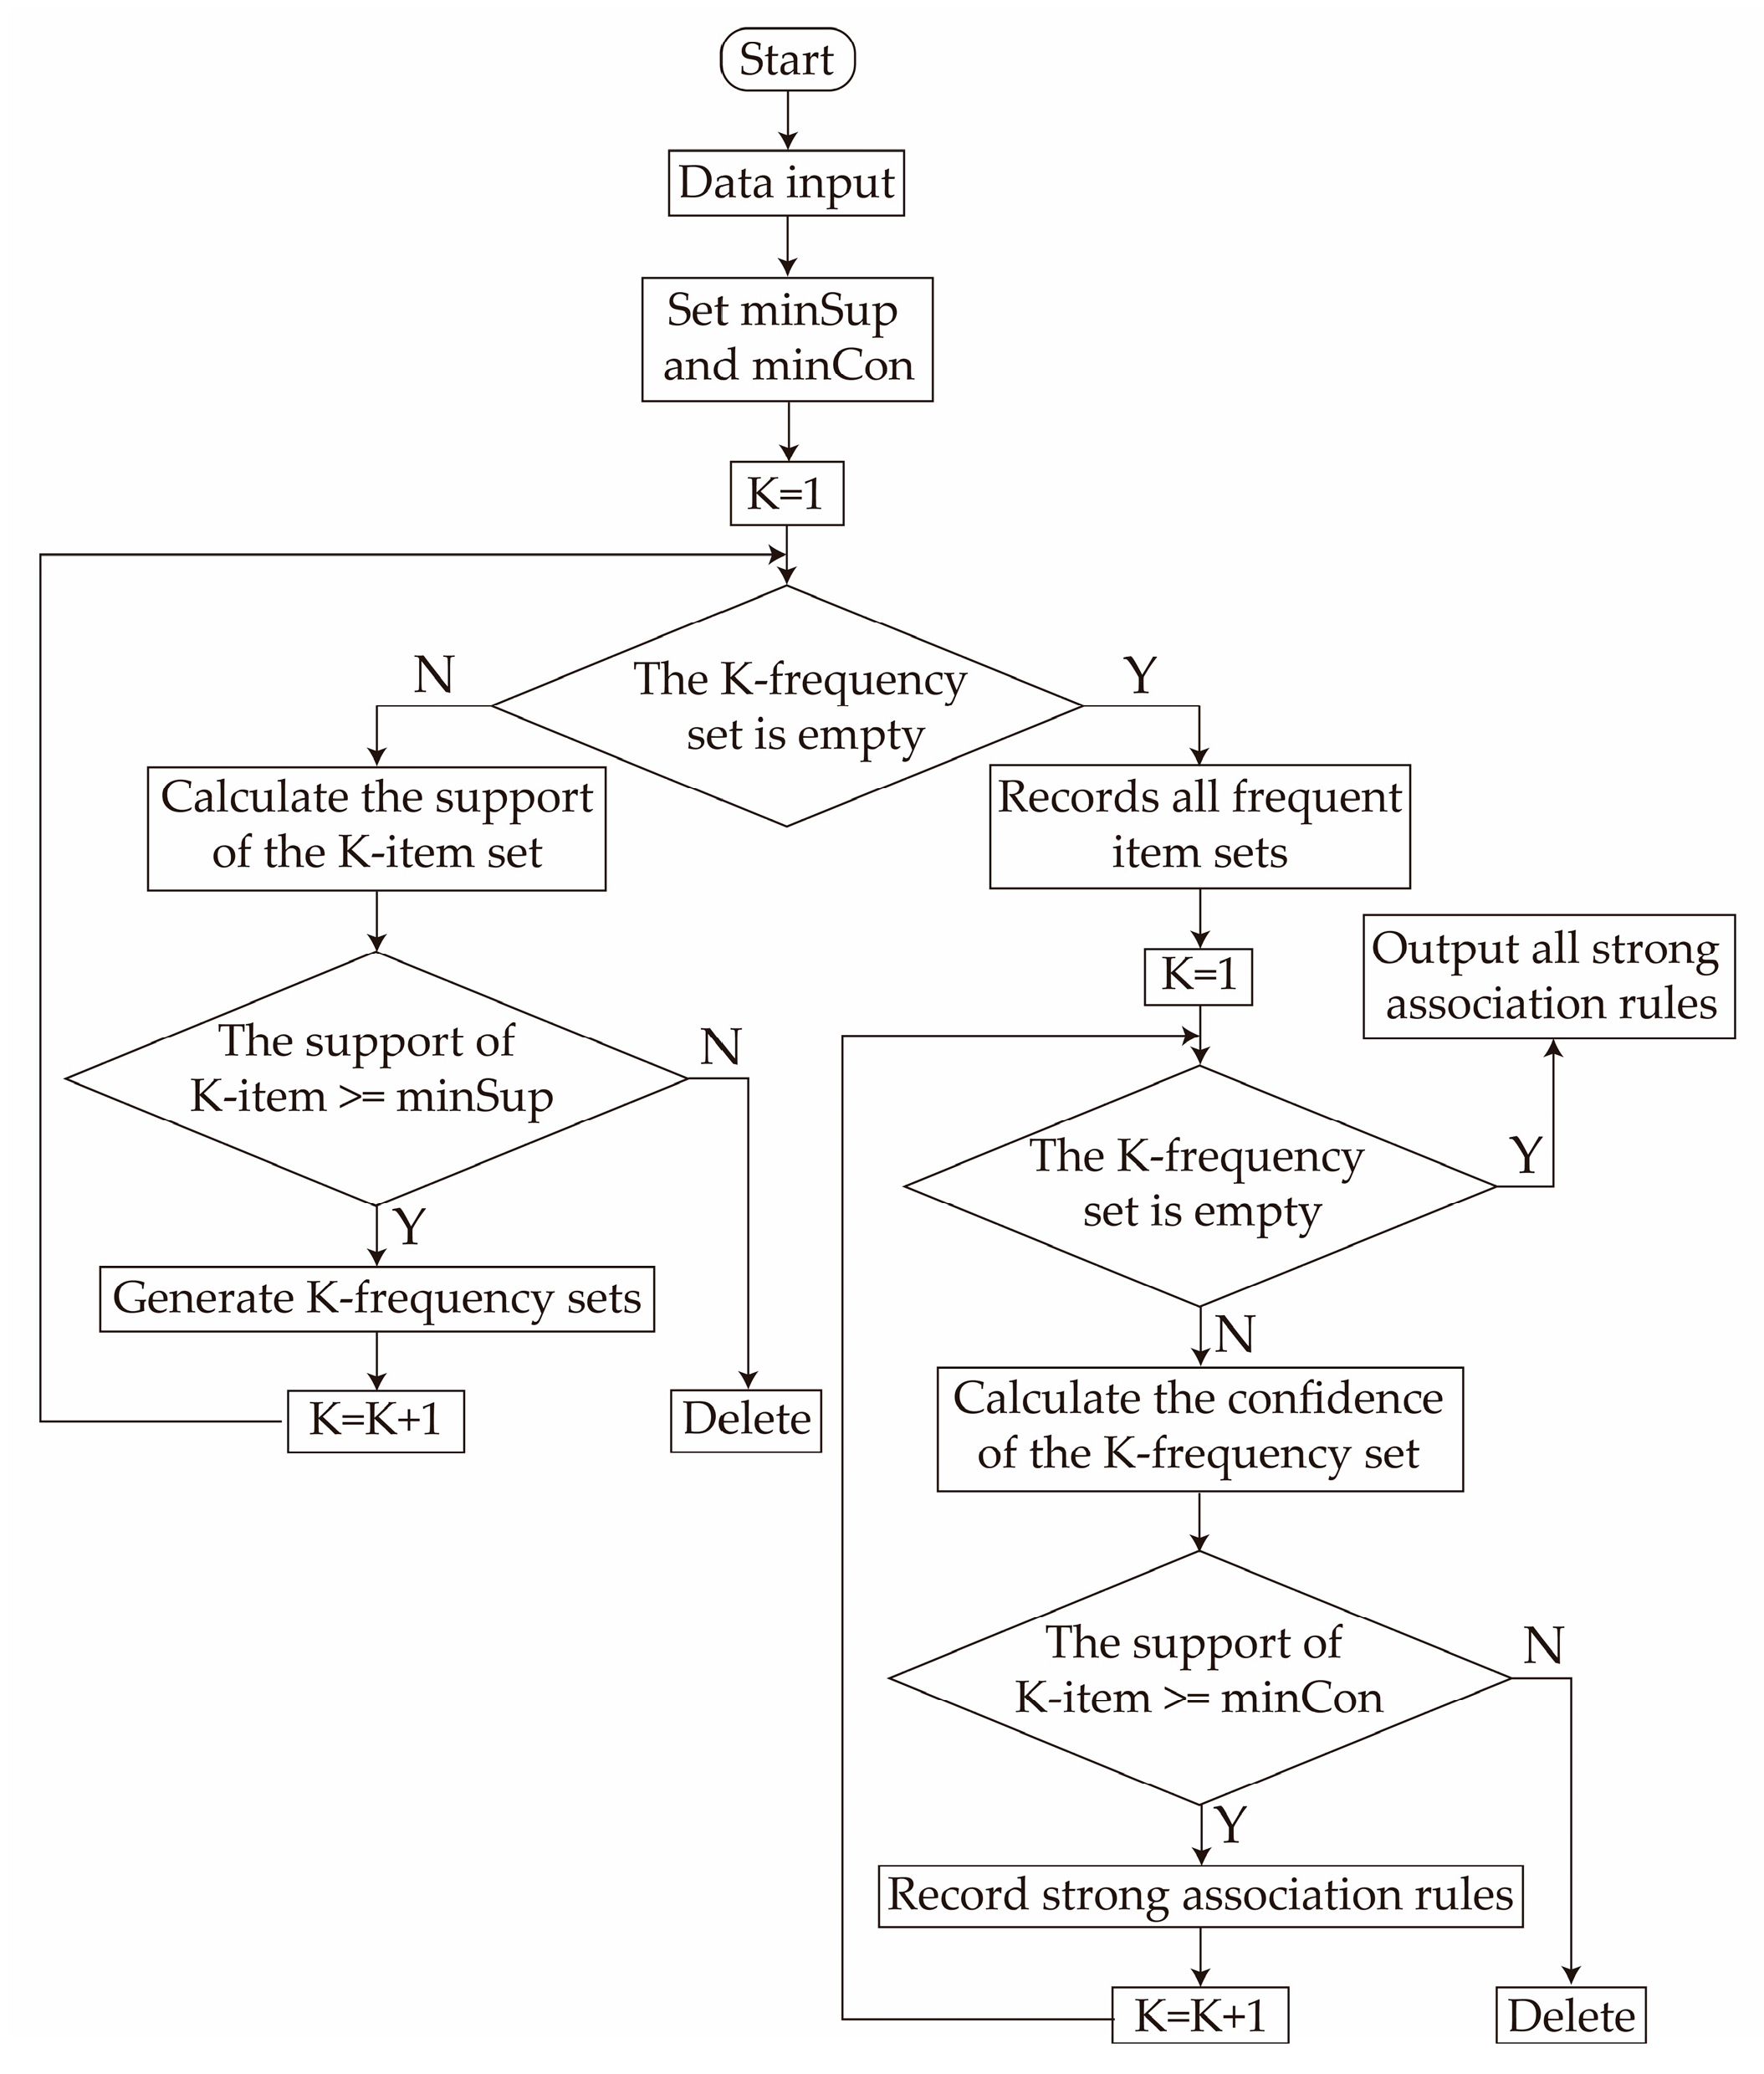
The operation process of the Apriori algorithm is shown in Figure 6. The searching process for frequent item sets is shown in the left side of the flowchart. The Apriori algorithm was used by searching frequent item sets from one to multiple to identify whether the support of the item set is greater than the minimum support. The output process of strong association rules is shown on the right. The confidence of all frequent item sets was calculated separately.
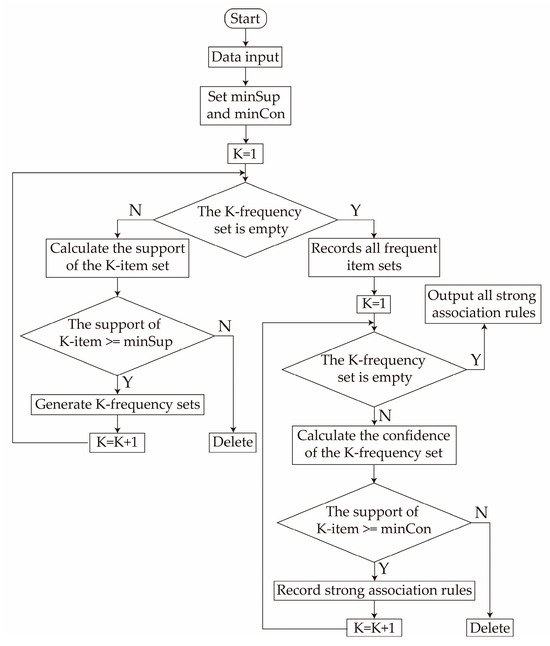
Figure 6.
Principle of the Apriori algorithm.
3. Results and Discussion
3.1. Color Analysis Based on HSV Space
Three primary colors and nine secondary colors were extracted through the above clustering approach, and the results are shown in Table 2. As for the HSV analysis, the three primary colors were red and purple tones, separately named with numbers and uppercase letters, and the nine secondary colors were red, yellow, purple, and cyan tones, named with numbers and lowercase letters. Though the secondary clustering method of the primary color, the representative color of the brocade samples shows a large area of red-yellow color.
Table 2.
Cluster analysis of the primary and secondary colors.
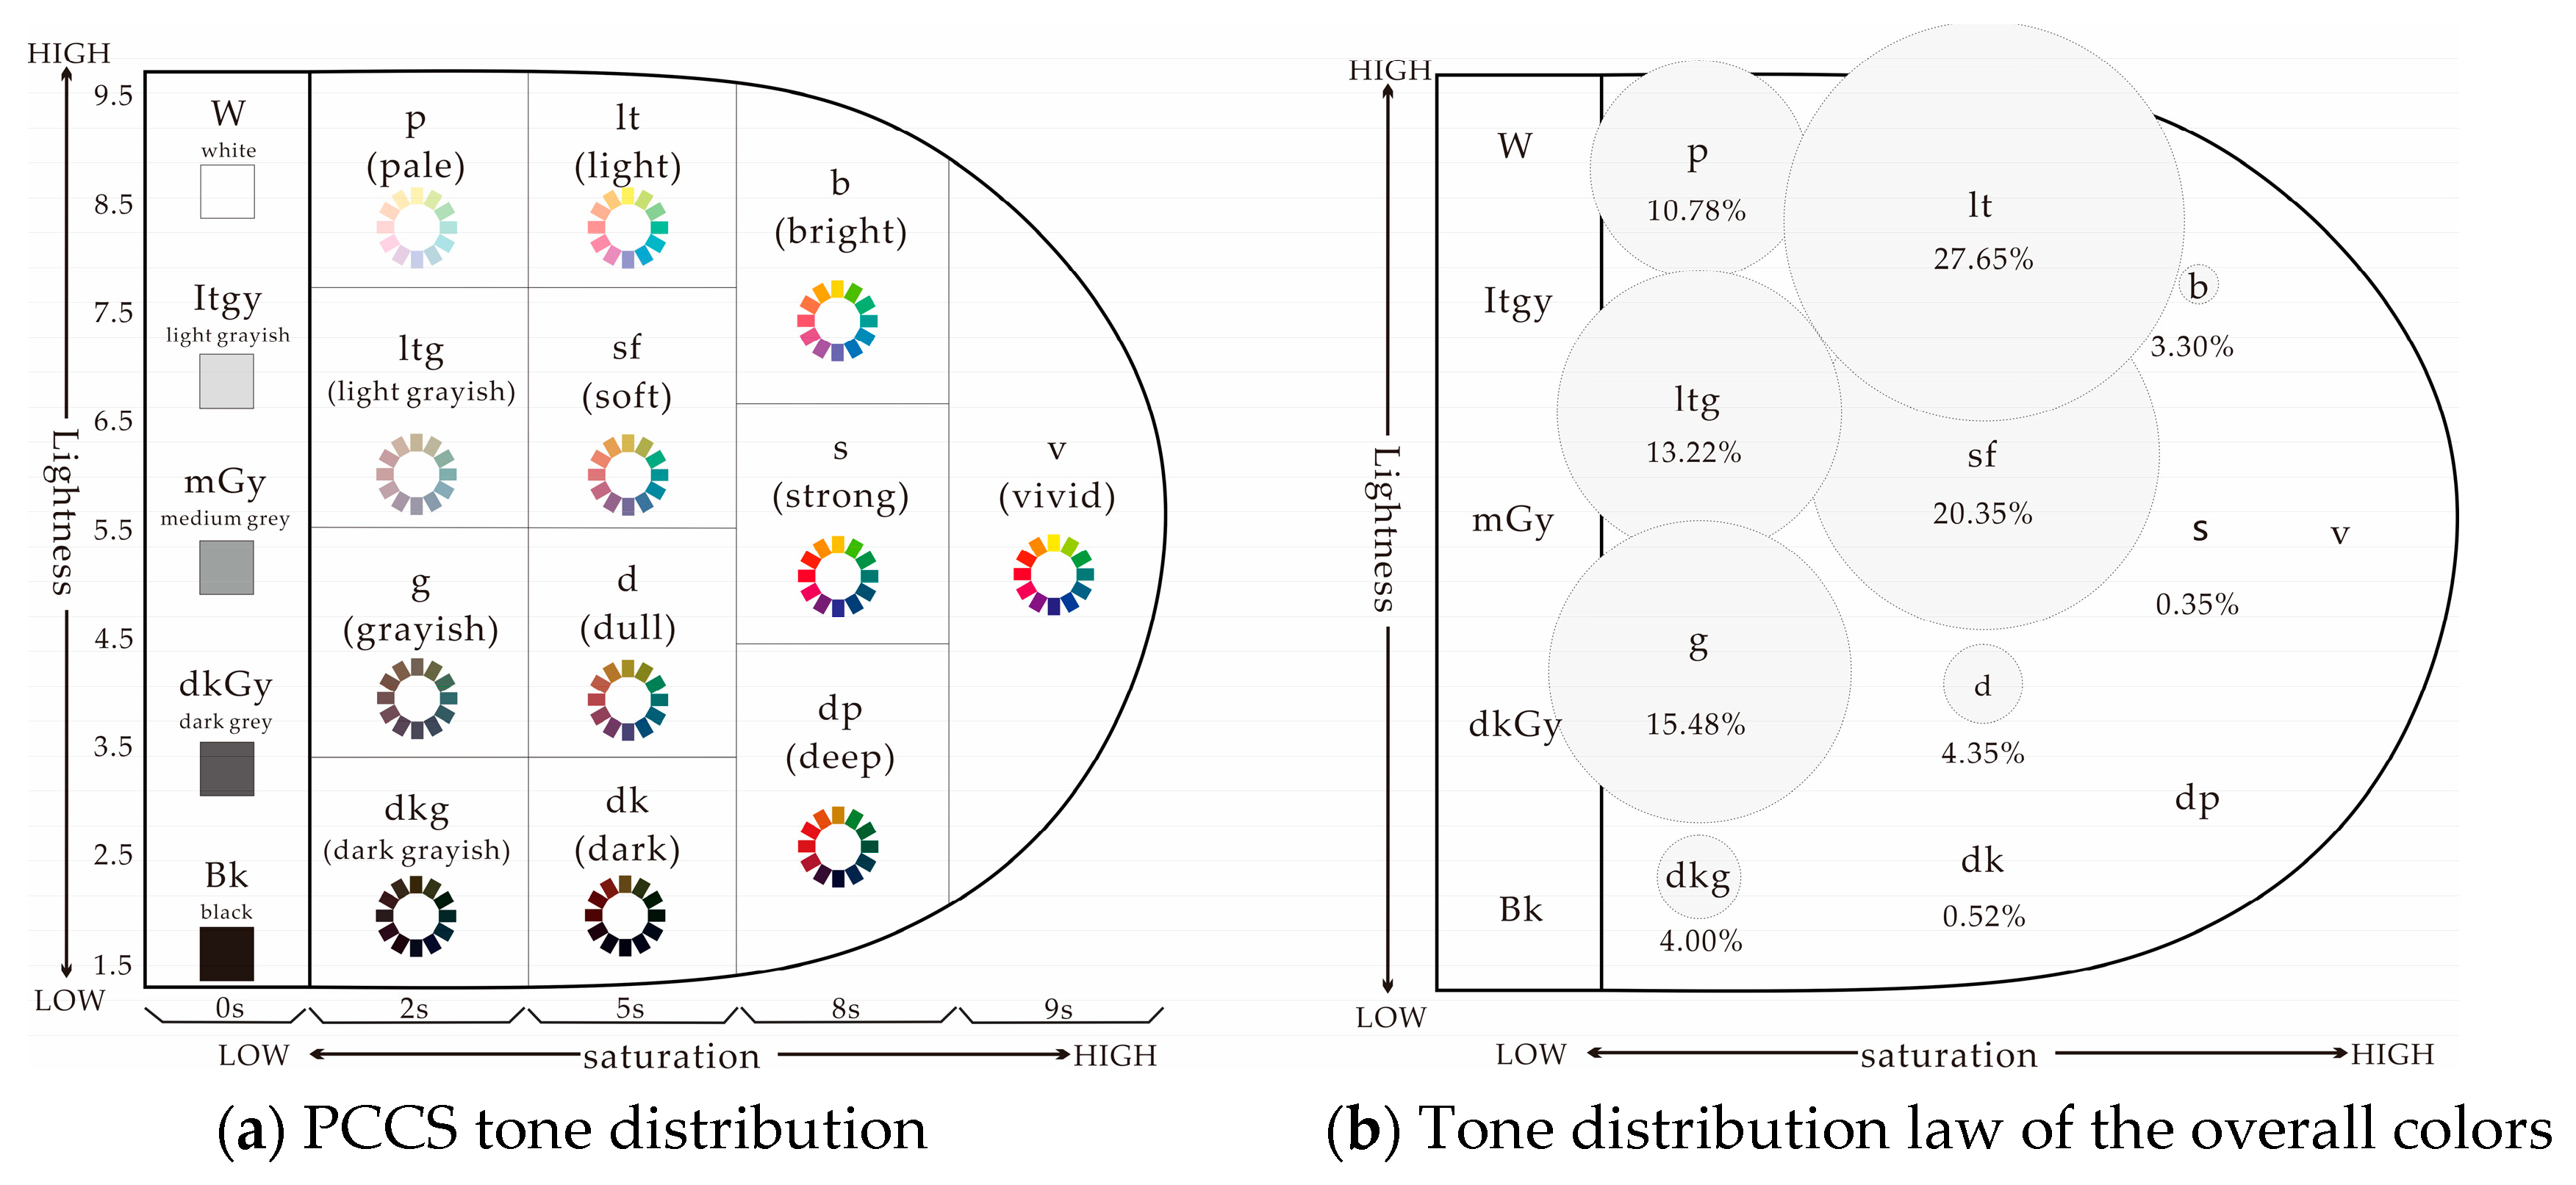
In visual perception, the color tone is determined by the differences in color brightness and saturation. The Practical Color Coordinate System (PCCS) was developed by the Japan Color Research Institute in 1964 and is based on psychological elements. Since the main feature of the PCCS is its hue–tone system, the PCCS has the advantage of treating color as an image using its tone. The Practical Color Coordinate System (PCCS) is commonly used by designers to achieve various color matching relationships, and the principle is different tone series [25]. The 12-tone distribution and the corresponding color representation are shown in Figure 7a.
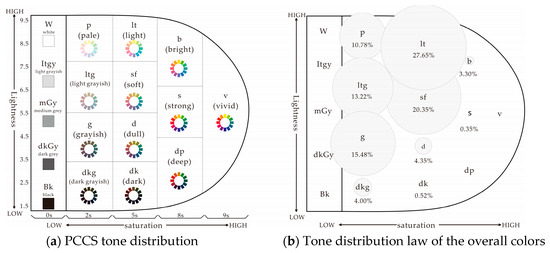
Figure 7.
PCCS color system and distribution rules of overall colors.
Therefore, the tone distribution of the representative colors for the brocade samples was analyzed using the PCCS. The brightness and saturation within the color system are closely correlated with the S and V channel scales in HSV space, which can be used to identify various tones by specific values. The values of the S and V channels were divided evenly, and the color tones and the percentages were calculated to compared with the system. In Figure 7b, the result shows that the brocade pattern colors are primarily concentrated in five tones. The main colors are light and soft colors, accounting, respectively, for 27.65% and 20.35%. Grayish, light grayish, and pale are next, accounting for 39.48% of the total. In addition, dark grayish and dull only constitute 8.35%. The other colors, particularly the deep, vivid, or other colors with strong color preferences, merely account for approximately 1% of the total color distribution.
The analysis results showed that the majority of these fabrics have a red-yellow basis, with an overall color scheme consisting of light or soft tones. This indicates that the textiles from the fourth through eighth centuries were generally produced in a rustic manner. According to Chinese theory of Yin and Yang, yellow is associated with earth and was considered the most natural color according to the old “Five-Element theory” [26]. Both red and yellow have been historically revered, as yellow was frequently linked to the monarchy and red symbolized joy. In addition to the light and soft tones with a large proportion in the whole color scheme, the grayish and light grayish tones account for approximately 30% to make the bright colored fabrics exhibit a natural appearance.
3.2. Network Modeling of the Secondary Colors
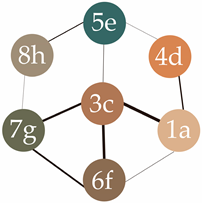
Since there are only three primary colors in all samples, it is more meaningful to establish association rules for secondary colors [27]. The Apriori algorithm was used to analyze secondary colors, and the minimum support was set to 0.05 to obtain a stronger color correlation. The matching network models among the secondary colors were established to identify the pattern’s color scheme, and eight matching rules were obtained, as shown in Table 3.
Table 3.
Network modeling of the secondary colors.
The results showed the most representative color with co-occurrence pairs based on the above association algorithm. The most common matching scheme for the brocade patterns is 1a-3c, i.e., beige and brown, with the most significant support and confidence levels. The color 3c appeared most frequently, and thus was set as the center node within the network model. The line between the nodes indicates that the two auxiliary colors have a certain probability of appearing together as matching colors. The size of the color node represents the proportion of the color, and the thickness of the line indicates the significance of the correlation between the two colors. The common color matching scheme involving three colors (1a-3c-6f) was obtained with a confidence level of 62%. Moreover, matching rules indicated that similar colors are often used, and contrasting colors are rarely used.
3.3. Application of Matching Rules
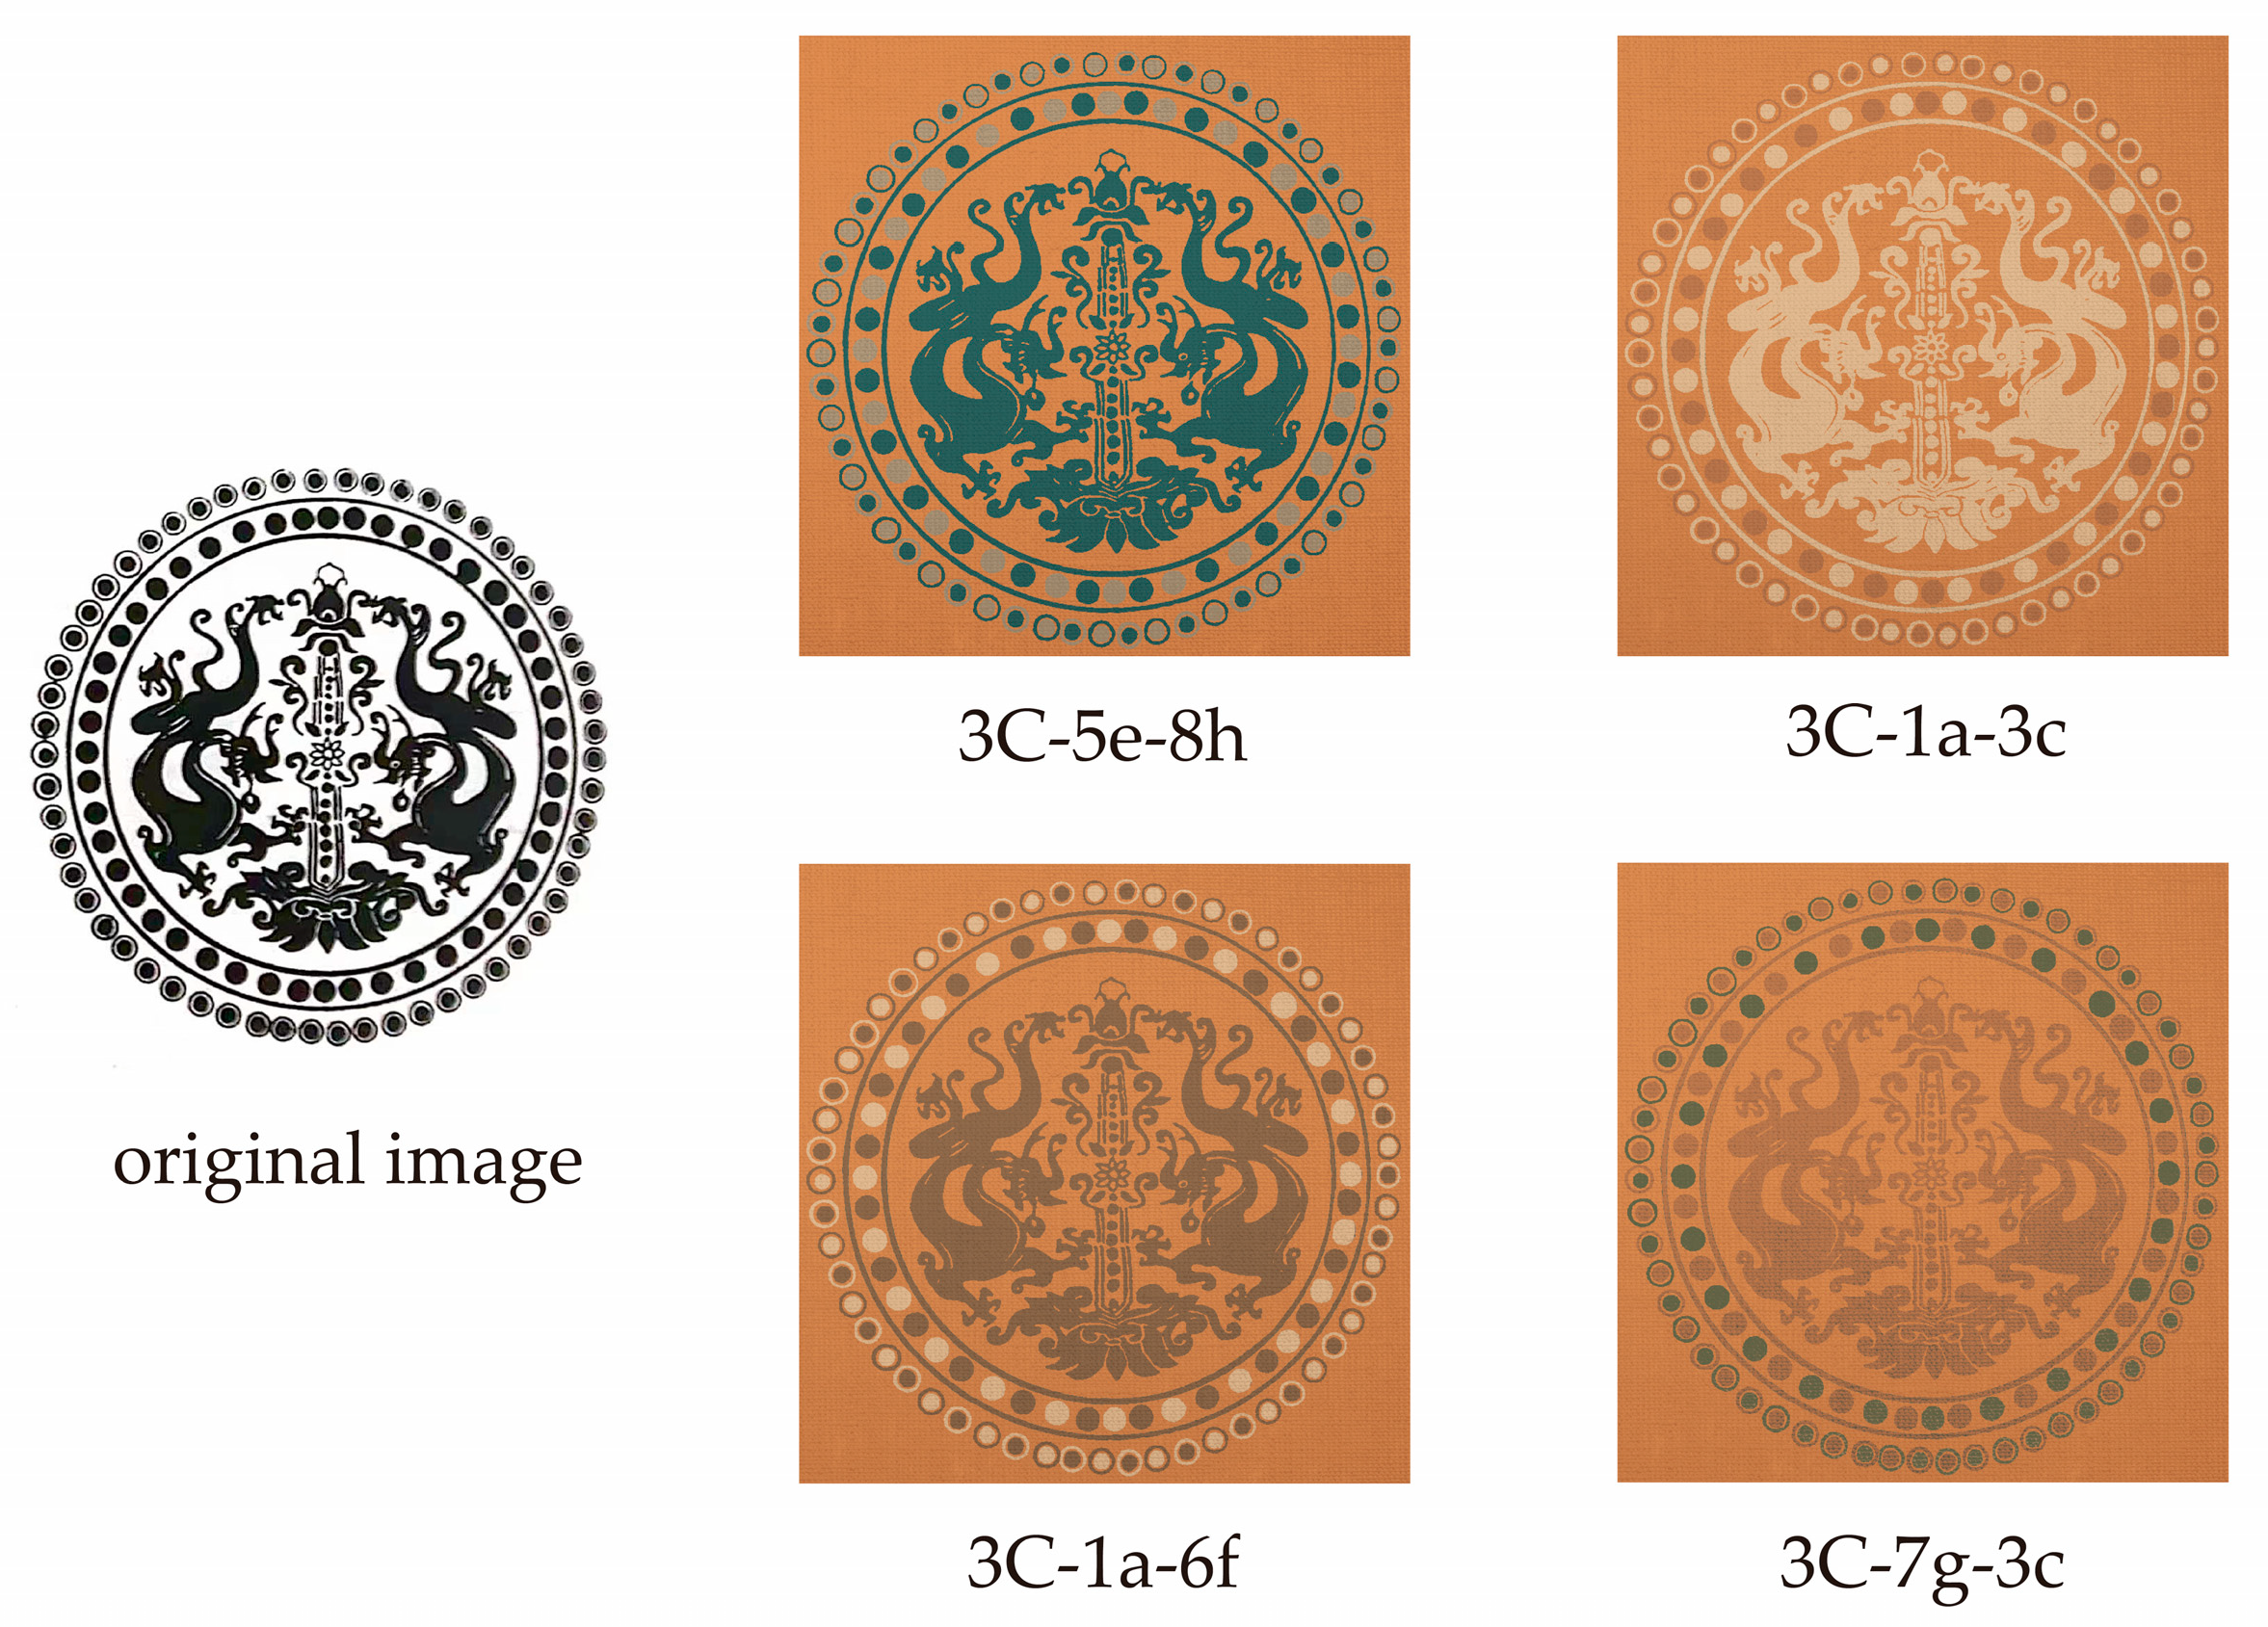
In order to visually depict the relationship between colors, the color matching schemes of the brocade from the 4th–6th centuries were applied to design classic fabric patterns using Style3D V7.0.147 virtual fitting software. As shown in Figure 8, the brocade pattern is a pair of dragons with pearls found in Astana. This image denotes the characteristics of the coupled bead pattern in the Tang dynasty and thematic elements contained within the coupling circle. The pattern typically consists of animals and flowers with a distinct foreign flavor. Instead of the traditional single bead ring, it shows a double ring with a bead combination.

Figure 8.
Application of the matching color scheme in a classic pattern.
The original image of this classic pattern was set as black and white for reference, and the color matching scheme was then applied to redesign the fabric texture. According to the extracted primary color and the network model, the primary color 3C was selected, and four groups of matching color schemes were applied to obtain different styles, as shown in Figure 8. Compared with 5e-8h and 7g-3c, the other two color schemes appear brighter, more elegant, and more colorful.
4. Conclusions
This study proposed a method of image-based matching network modeling to analyze the color characteristics of the textiles found along the Silk Road from the 4th to 8th centuries. Two clustering methods, including K-means clustering and octree clustering, were compared for the datasets containing 165 images of brocade patterns. The cluster numbers for the primary and secondary colors were determined using the SSE method and elbow method to obtain three primary and nine secondary representative colors. The clustering results showed that most fabrics exhibit red-yellow tones, while the secondary colors tend toward yellow and green tones. By comparing the results with the PCSS color system, it was found that light and soft colors account for 27%, contributing to an overall style characterized by simplicity, elegance, and low contrast. The Apriori algorithm was used to derive eight association rules, and the matching network model was established. The results showed that the most frequently used two-color scheme is 1a-3c, with a confidence rate of 47%, while the three-color rule is 1a-3c-6f, with a confidence level of 61%. These color schemes were applied for a classic pattern style with a pair of dragons and pearls found in Astana, demonstrating various styles. This study can quantify the colors for understanding, and has significant implications for historical and cultural heritage. Since the experimental samples are brocade textiles found along the Silk Road, the sample size may be limited and the accuracy of the algorithm also need to be improved for further research.
Author Contributions
Conceptualization, B.G.; Methodology, L.Z. and B.G.; Validation, L.Z.; Formal analysis, L.Z., Y.L. and B.G.; Investigation, Y.L.; Resources, H.F. and Y.L.; Writing—original draft, X.S. and L.Z.; Writing—review & editing, B.G.; Supervision, H.F. and B.G.; Project administration, H.F.; Funding acquisition, H.F. All authors have read and agreed to the published version of the manuscript.
Funding
The project was supported by National Natural Science Foundation of China (Grant No. 61702461), “Textile Light” Applied Basic Research Project of China National Textile Industry Federation (Grant No. J202007), Zhejiang Province Philosophy and Social Science Planning Art Research Project (Grant No. 24NDJC171YB), and the Special Fund for Scientific Research of Zhejiang Sci-Tech University (Grant No. 24076114Y).
Institutional Review Board Statement
Not applicable.
Informed Consent Statement
Not applicable.
Data Availability Statement
The original contributions presented in the study are included in the article, further inquiries can be directed to the corresponding author.
Conflicts of Interest
The authors declare no conflict of interest.
References
- Ni, M.; Huang, Q.; Ni, N.; Zhao, H.; Sun, B. Research on the Design of Zhuang Brocade Patterns Based on Automatic Pattern Generation. Appl. Sci. 2024, 14, 5375. [Google Scholar] [CrossRef]
- Wang, S.; Li, Q.; Khaskheli, M.B. Management Economic Systems and Governance to Reduce Potential Risks in Digital Silk Road Investments: Legal Cooperation between Hainan Free Trade Port and Ethiopia. Systems 2024, 12, 305. [Google Scholar] [CrossRef]
- Barron, L.J.F.P. The creative influence of history in fashion practice: The legacy of the silk road and Chinese-inspired culture-led design. Fash. Pract.-J. Des. Creat. Process Fash. Ind. 2021, 13, 275–295. [Google Scholar] [CrossRef]
- Ji, Z.; Huang, W.-H.; Lin, M. Design Mode Innovation of Local Color Cultures: A Case Study of the Traditional Female Costume of Yi Nationality. Designs 2020, 4, 56. [Google Scholar] [CrossRef]
- Huang, Y.; Pan, Y. Discovery and extraction of cultural traits in intangible cultural heritages based on Kansei engineering: Taking Zhuang brocade weaving techniques as an example. Appl. Sci. 2021, 11, 11403. [Google Scholar] [CrossRef]
- Chai, J.; Cui, R.; Niu, L. Study on the technological process and artistic characteristics of ancient Chinese Zhuanghua silk fabric. Fibres Text. East. Eur. 2021, 29, 105–111. [Google Scholar] [CrossRef]
- Wenji, Z.; Rongrong, C.; Li, N. The innovative practice of artificial intelligence in the inheritance of chinese xiangjin art. Sci. Program. 2022, 2022, 6557374. [Google Scholar] [CrossRef]
- Kmita, A. Decorative patterns and sets of colors inspired by folk and applied arts of Upper Silesia, a popularization of visual cultural heritage of the region. Color Res. Appl. 2018, 43, 942–950. [Google Scholar] [CrossRef]
- Lee, M.S.; Sa, J.K.; Chung, K.H. A comparative analysis of the characteristics and images of costume colors in the traditional plays of Korea, China, and Japan. Color Res. Appl. 2012, 37, 302–312. [Google Scholar] [CrossRef]
- Xing, L.; Zhang, J.; Liang, H.; Li, Z. Intelligent recognition of dominant colors for Chinese traditional costumes based on a mean shift clustering method. J. Text. Inst. 2018, 109, 1304–1314. [Google Scholar] [CrossRef]
- Hsu, M.Y.; Ou, L.C.; Guan, S.S. Colour preference for Taiwanese floral pattern fabrics. Color Res. Appl. 2016, 41, 43–55. [Google Scholar] [CrossRef]
- Zhao, L.; Wang, Z.; Zuo, Y.; Hu, D. Comprehensive evaluation method of ethnic costume color based on k-means clustering method. Symmetry 2021, 13, 1822. [Google Scholar] [CrossRef]
- Wang, M.F. A study on Fuzzy C-means application in Austronesian language cultural and creative product colors. Color Res. Appl. 2018, 43, 375–386. [Google Scholar] [CrossRef]
- Xu, B.; Liu, X.; Lu, C.; Hong, T.; Zhu, Y. Transferring the color imagery from an image: A color network model for assisting color combination. Color Res. Appl. 2019, 44, 205–220. [Google Scholar] [CrossRef]
- Hong, Y.; Zeng, X.; Cao, X.; Chen, Y.; Chen, Y.; Pan, Z. A framework of consumer perceived value on fashion products for female college students of France. Ind. Textila 2018, 69, 495–501. [Google Scholar]
- Nie, K.; Wen, R.; Mo, H.; Zhang, X.; Wang, Z.; Wang, G. An event-related potential study on the aesthetics of colour matching on silk fabric. Ind. Textila 2021, 72, 349–356. [Google Scholar] [CrossRef]
- Zhao, F.; Qi, D. New Designs with Western Influence on the Textiles of Silk Road from 4th Century to 8th Century; Shanghai Chinese Classics Publishing House: Shanghai, China, 2011; pp. 1–220. [Google Scholar]
- Hong, Y.; Zeng, X.; Wang, Y.; Bruniaux, P.; Chen, Y. CBCRS: An open case-based color recommendation system. Knowl.-Based Syst. 2018, 141, 113–128. [Google Scholar] [CrossRef]
- Hsiao, S.W.; Tsai, C.J. Transforming the natural colors of an image into product design: A computer-aided color planning system based on fuzzy pattern recognition. Color Res. Appl. 2015, 40, 612–625. [Google Scholar] [CrossRef]
- Qi, Y.; Fan, X.R.; Cui, R.R.; Wang, Q. Analysis of Color Symbology Focused on Folk Costume Colors in Northern and Southern Regions of China during Republic Period. Adv. Mater. Res. 2011, 331, 156–159. [Google Scholar] [CrossRef]
- Lei, T.; Jia, X.; Zhang, Y.; Liu, S.; Meng, H.; Nandi, A.K. Superpixel-based fast fuzzy C-means clustering for color image segmentation. IEEE Trans. Fuzzy Syst. 2018, 27, 1753–1766. [Google Scholar] [CrossRef]
- Xu, L.; Yan, Q.; Xia, Y.; Jia, J. Structure extraction from texture via relative total variation. ACM Trans. Graph. 2012, 31, 139. [Google Scholar] [CrossRef]
- Xu, P.; Mao, H.; Zhang, Y.; Gu, B.; Zhang, Y. Study on analysis method for color composition of ethnic costumes. J. Silk 2019, 56, 24–29. [Google Scholar]
- Sarawagi, S.; Thomas, S.; Agrawal, R. Integrating association rule mining with relational database systems: Alternatives and implications. ACM SIGMOD Rec. 1998, 27, 343–354. [Google Scholar] [CrossRef]
- Yanagida, T.; Okajima, K.; Mimura, H. Color scheme adjustment by fuzzy constraint satisfaction for color vision deficiencies. Color Res. Appl. 2015, 40, 446–464. [Google Scholar] [CrossRef]
- Lee, J.H.; Kim, Y.I. Analysis of color symbology from the perspective of cultural semiotics focused on Korean costume colors according to the cultural changes. Color Res. Appl. 2007, 32, 71–79. [Google Scholar] [CrossRef]
- Lu, L.; Chen, Y.; Wei, H. Research on the algorithm Apriori of mining association rules. J. Chin. Comput. Syst. 2000, 9, 940–943. [Google Scholar]


Disclaimer/Publisher’s Note: The statements, opinions and data contained in all publications are solely those of the individual author(s) and contributor(s) and not of MDPI and/or the editor(s). MDPI and/or the editor(s) disclaim responsibility for any injury to people or property resulting from any ideas, methods, instructions or products referred to in the content. |
© 2024 by the authors. Licensee MDPI, Basel, Switzerland. This article is an open access article distributed under the terms and conditions of the Creative Commons Attribution (CC BY) license (https://creativecommons.org/licenses/by/4.0/).