
Research on Indirect Influence-Line Identification Methods in the Dynamic Response of Vehicles Crossing Bridges


Abstract
:1. Introduction
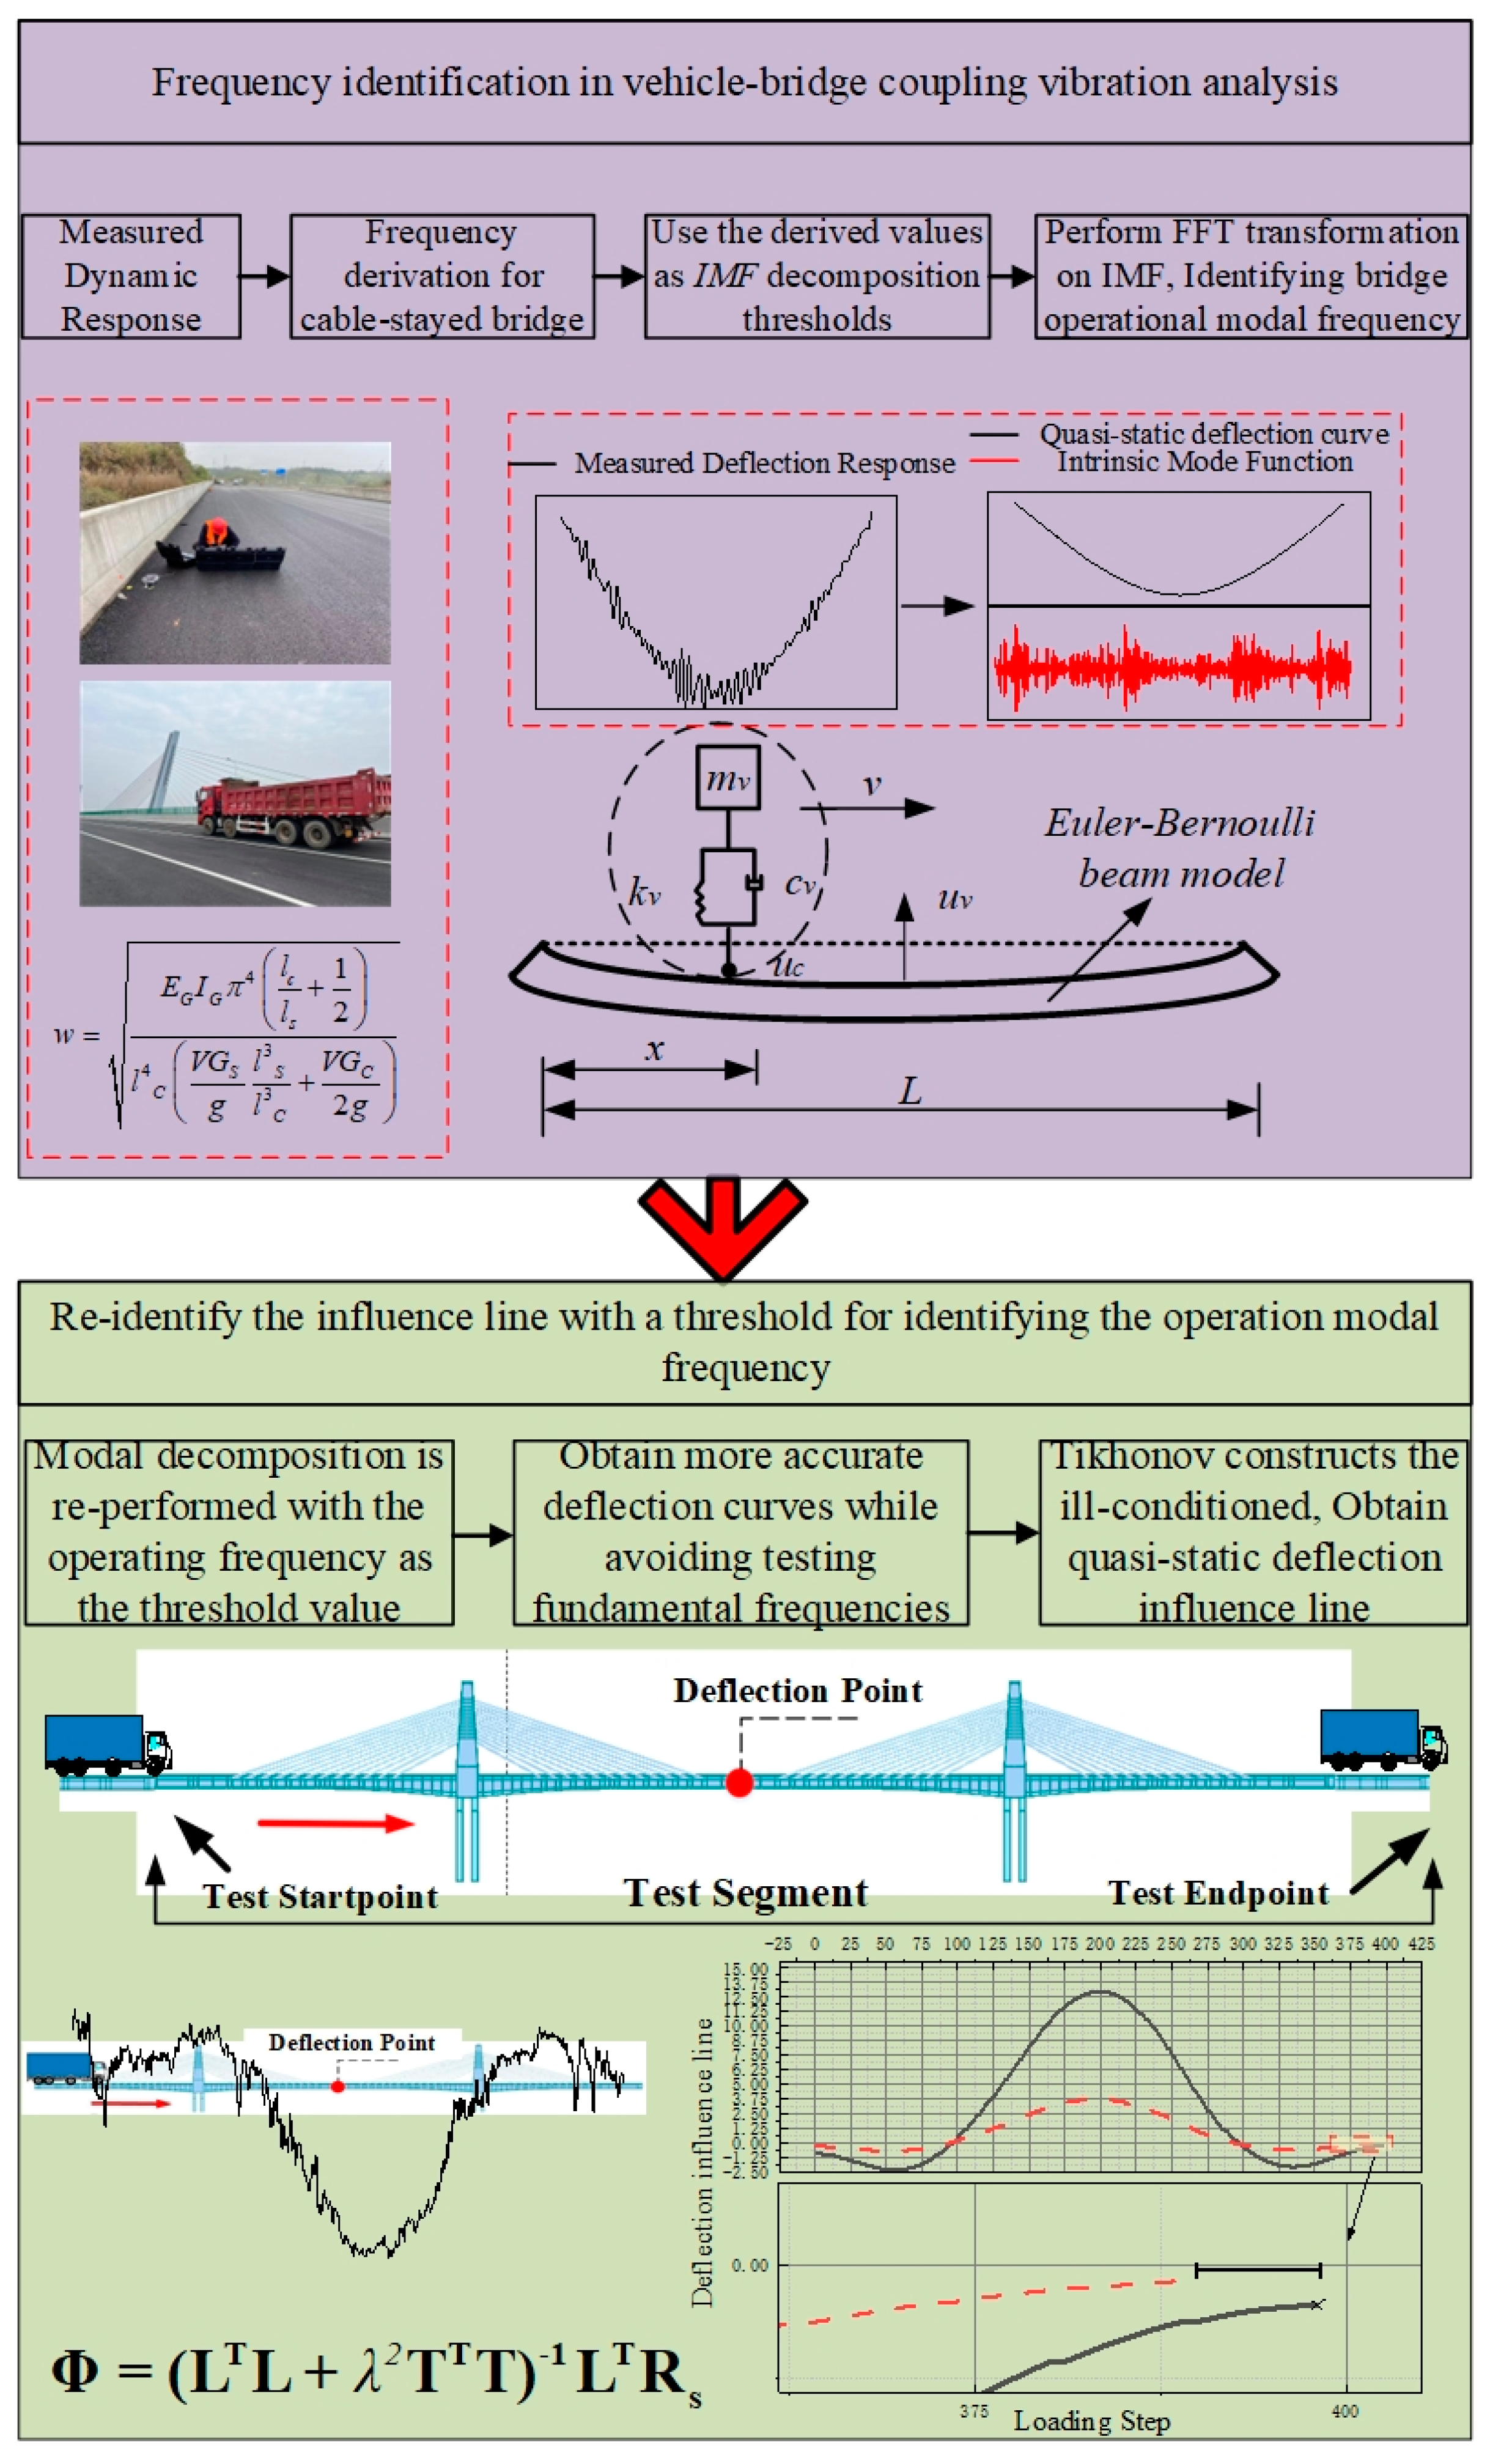
2. Theoretical Approach Establishment
2.1. Frequency Derivation Based on Rayleigh Method
2.2. Influence-Line Identification Methods
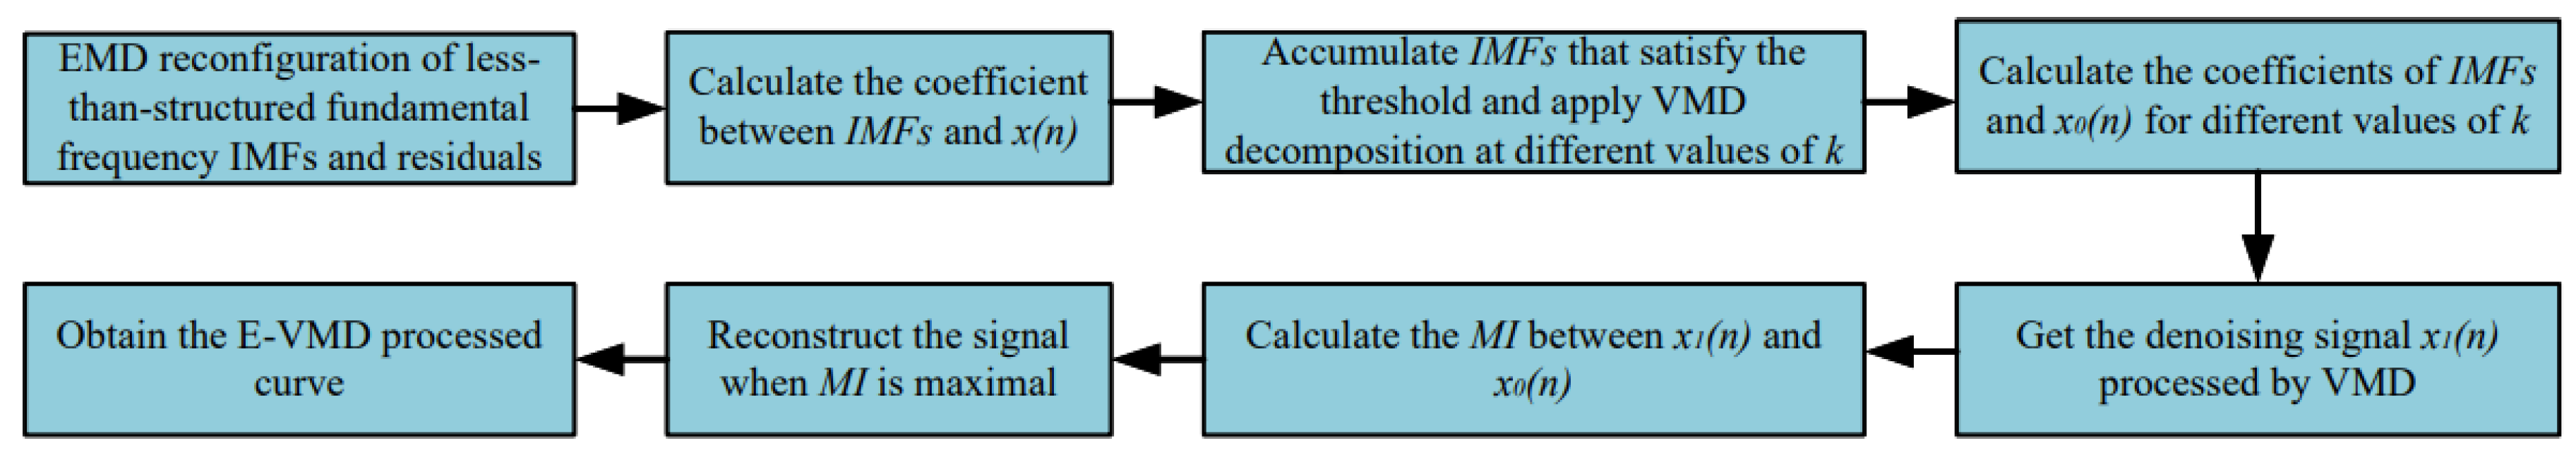
2.2.1. E-VMD Method Establishment
2.2.2. Rejection of Axle Effects
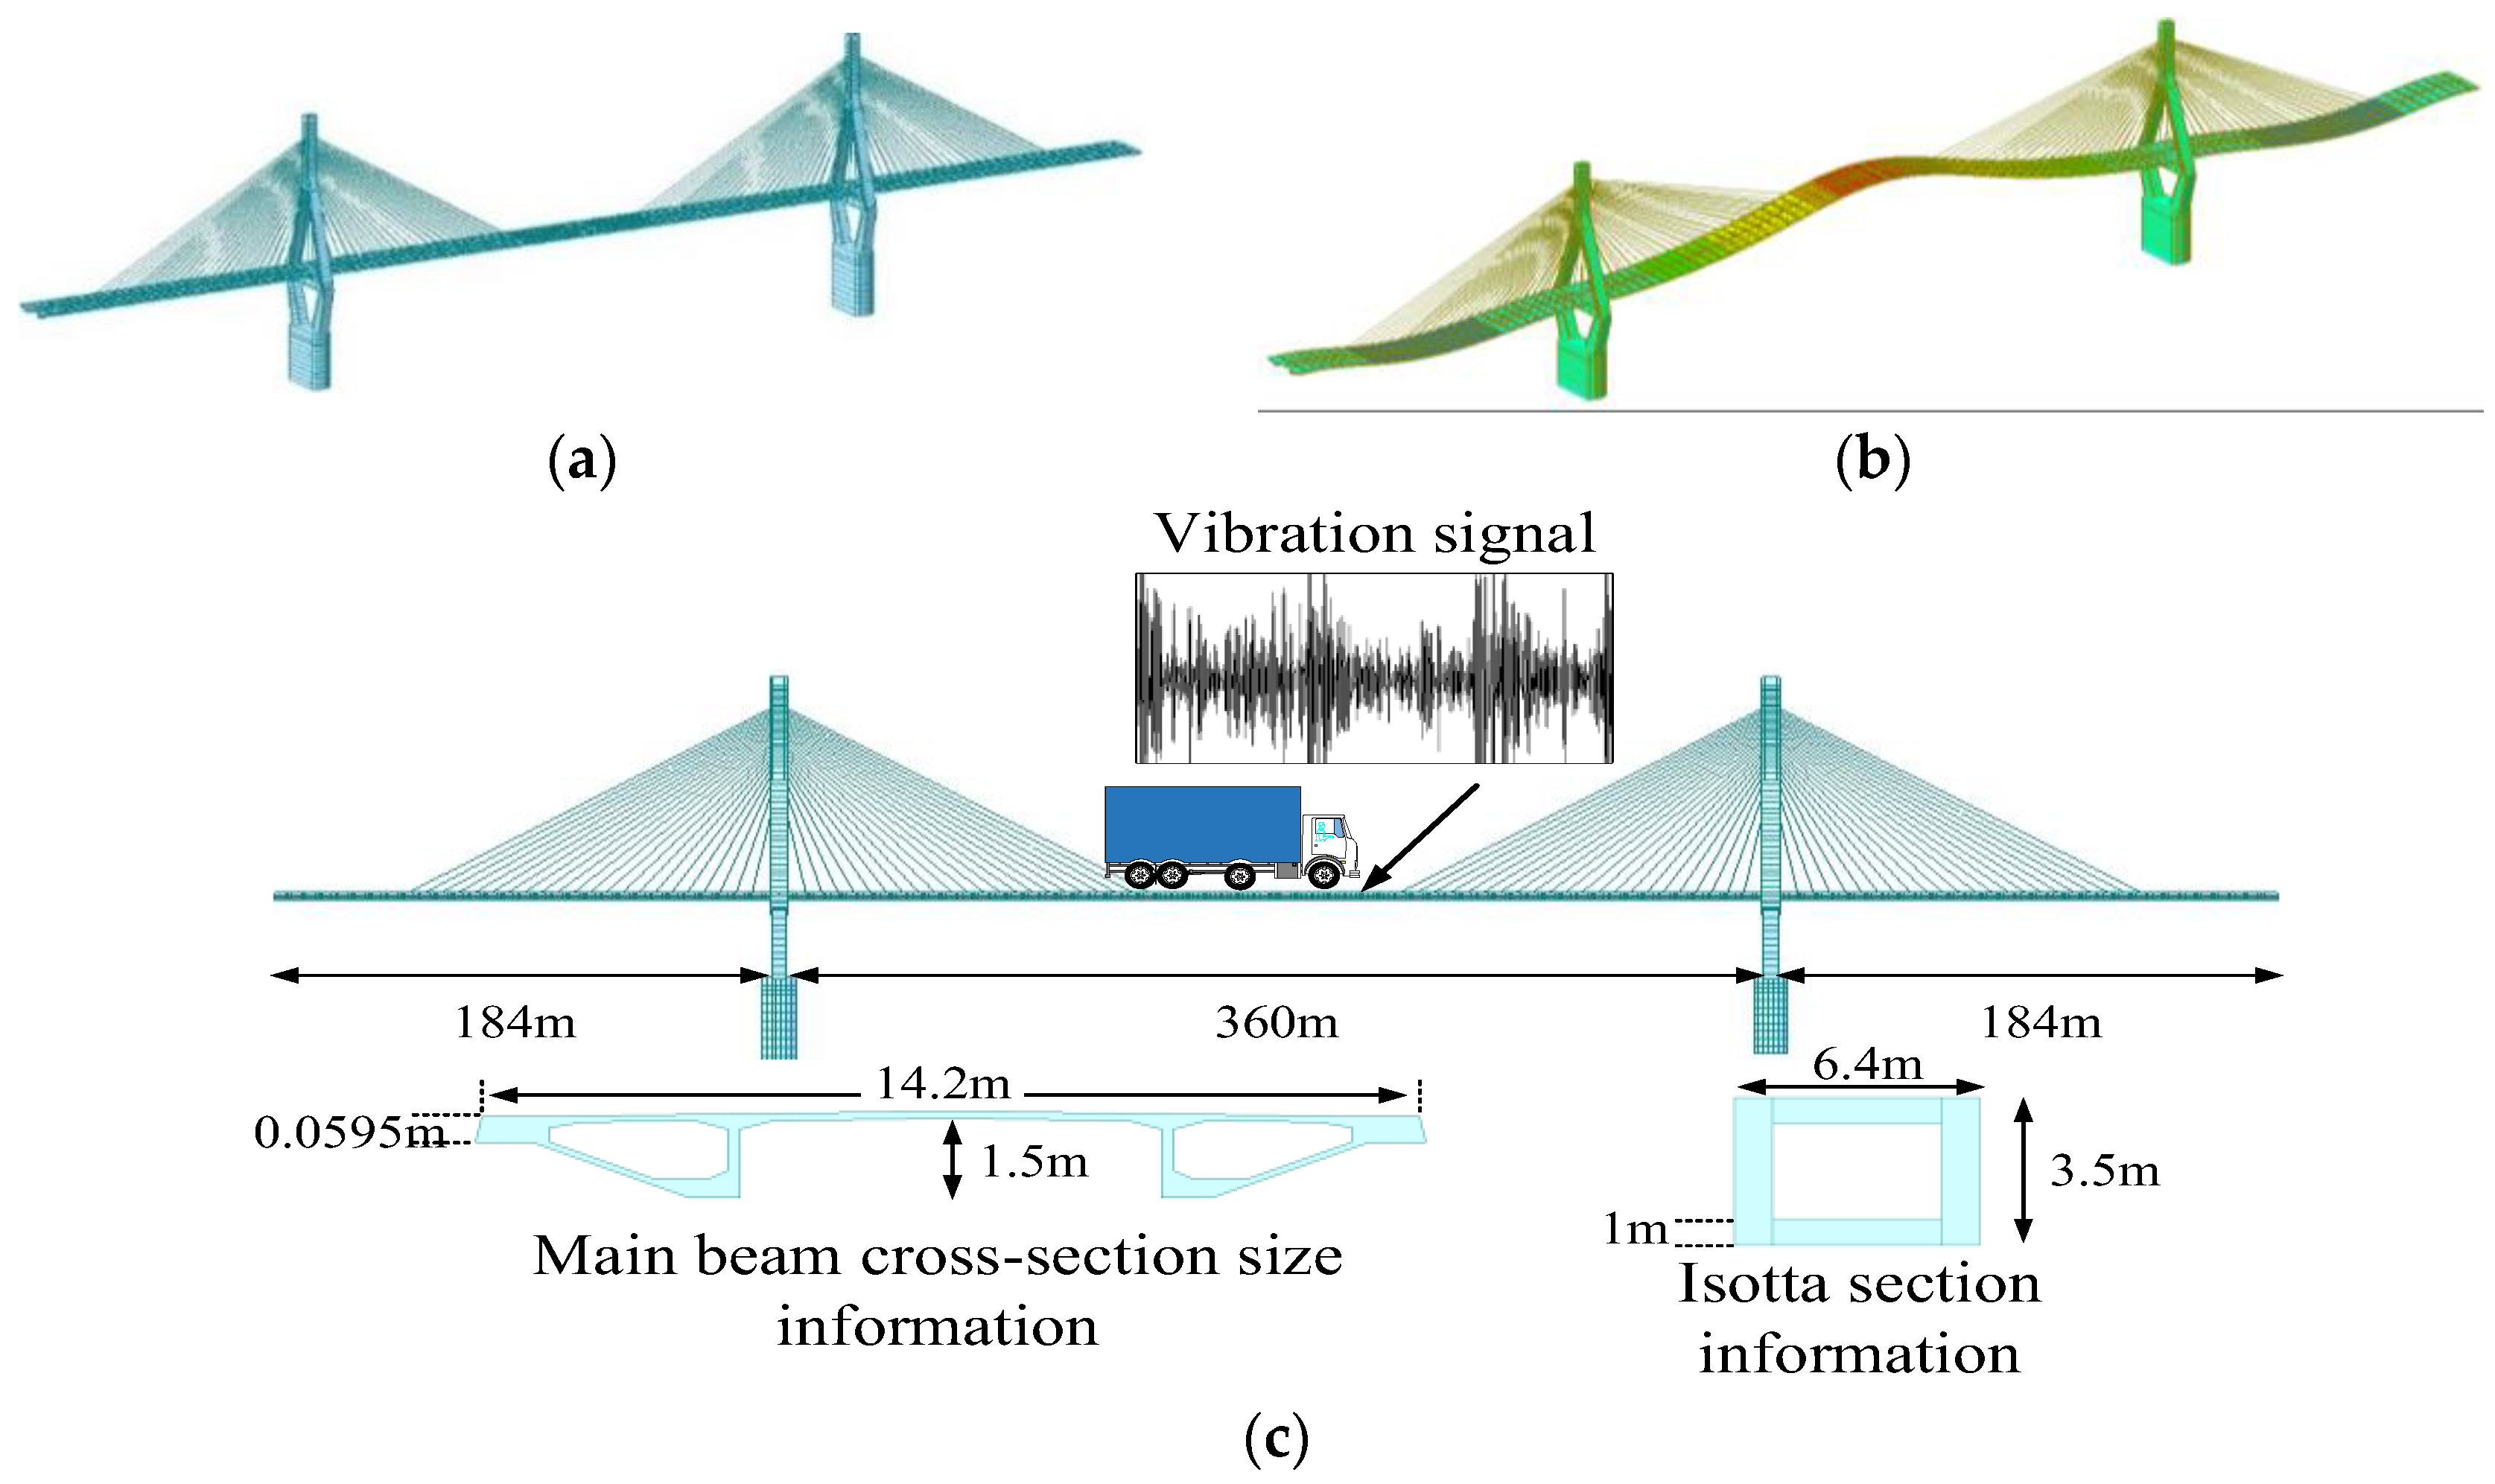
3. Numerical Simulation Analysis
3.1. Case I
3.2. Case II
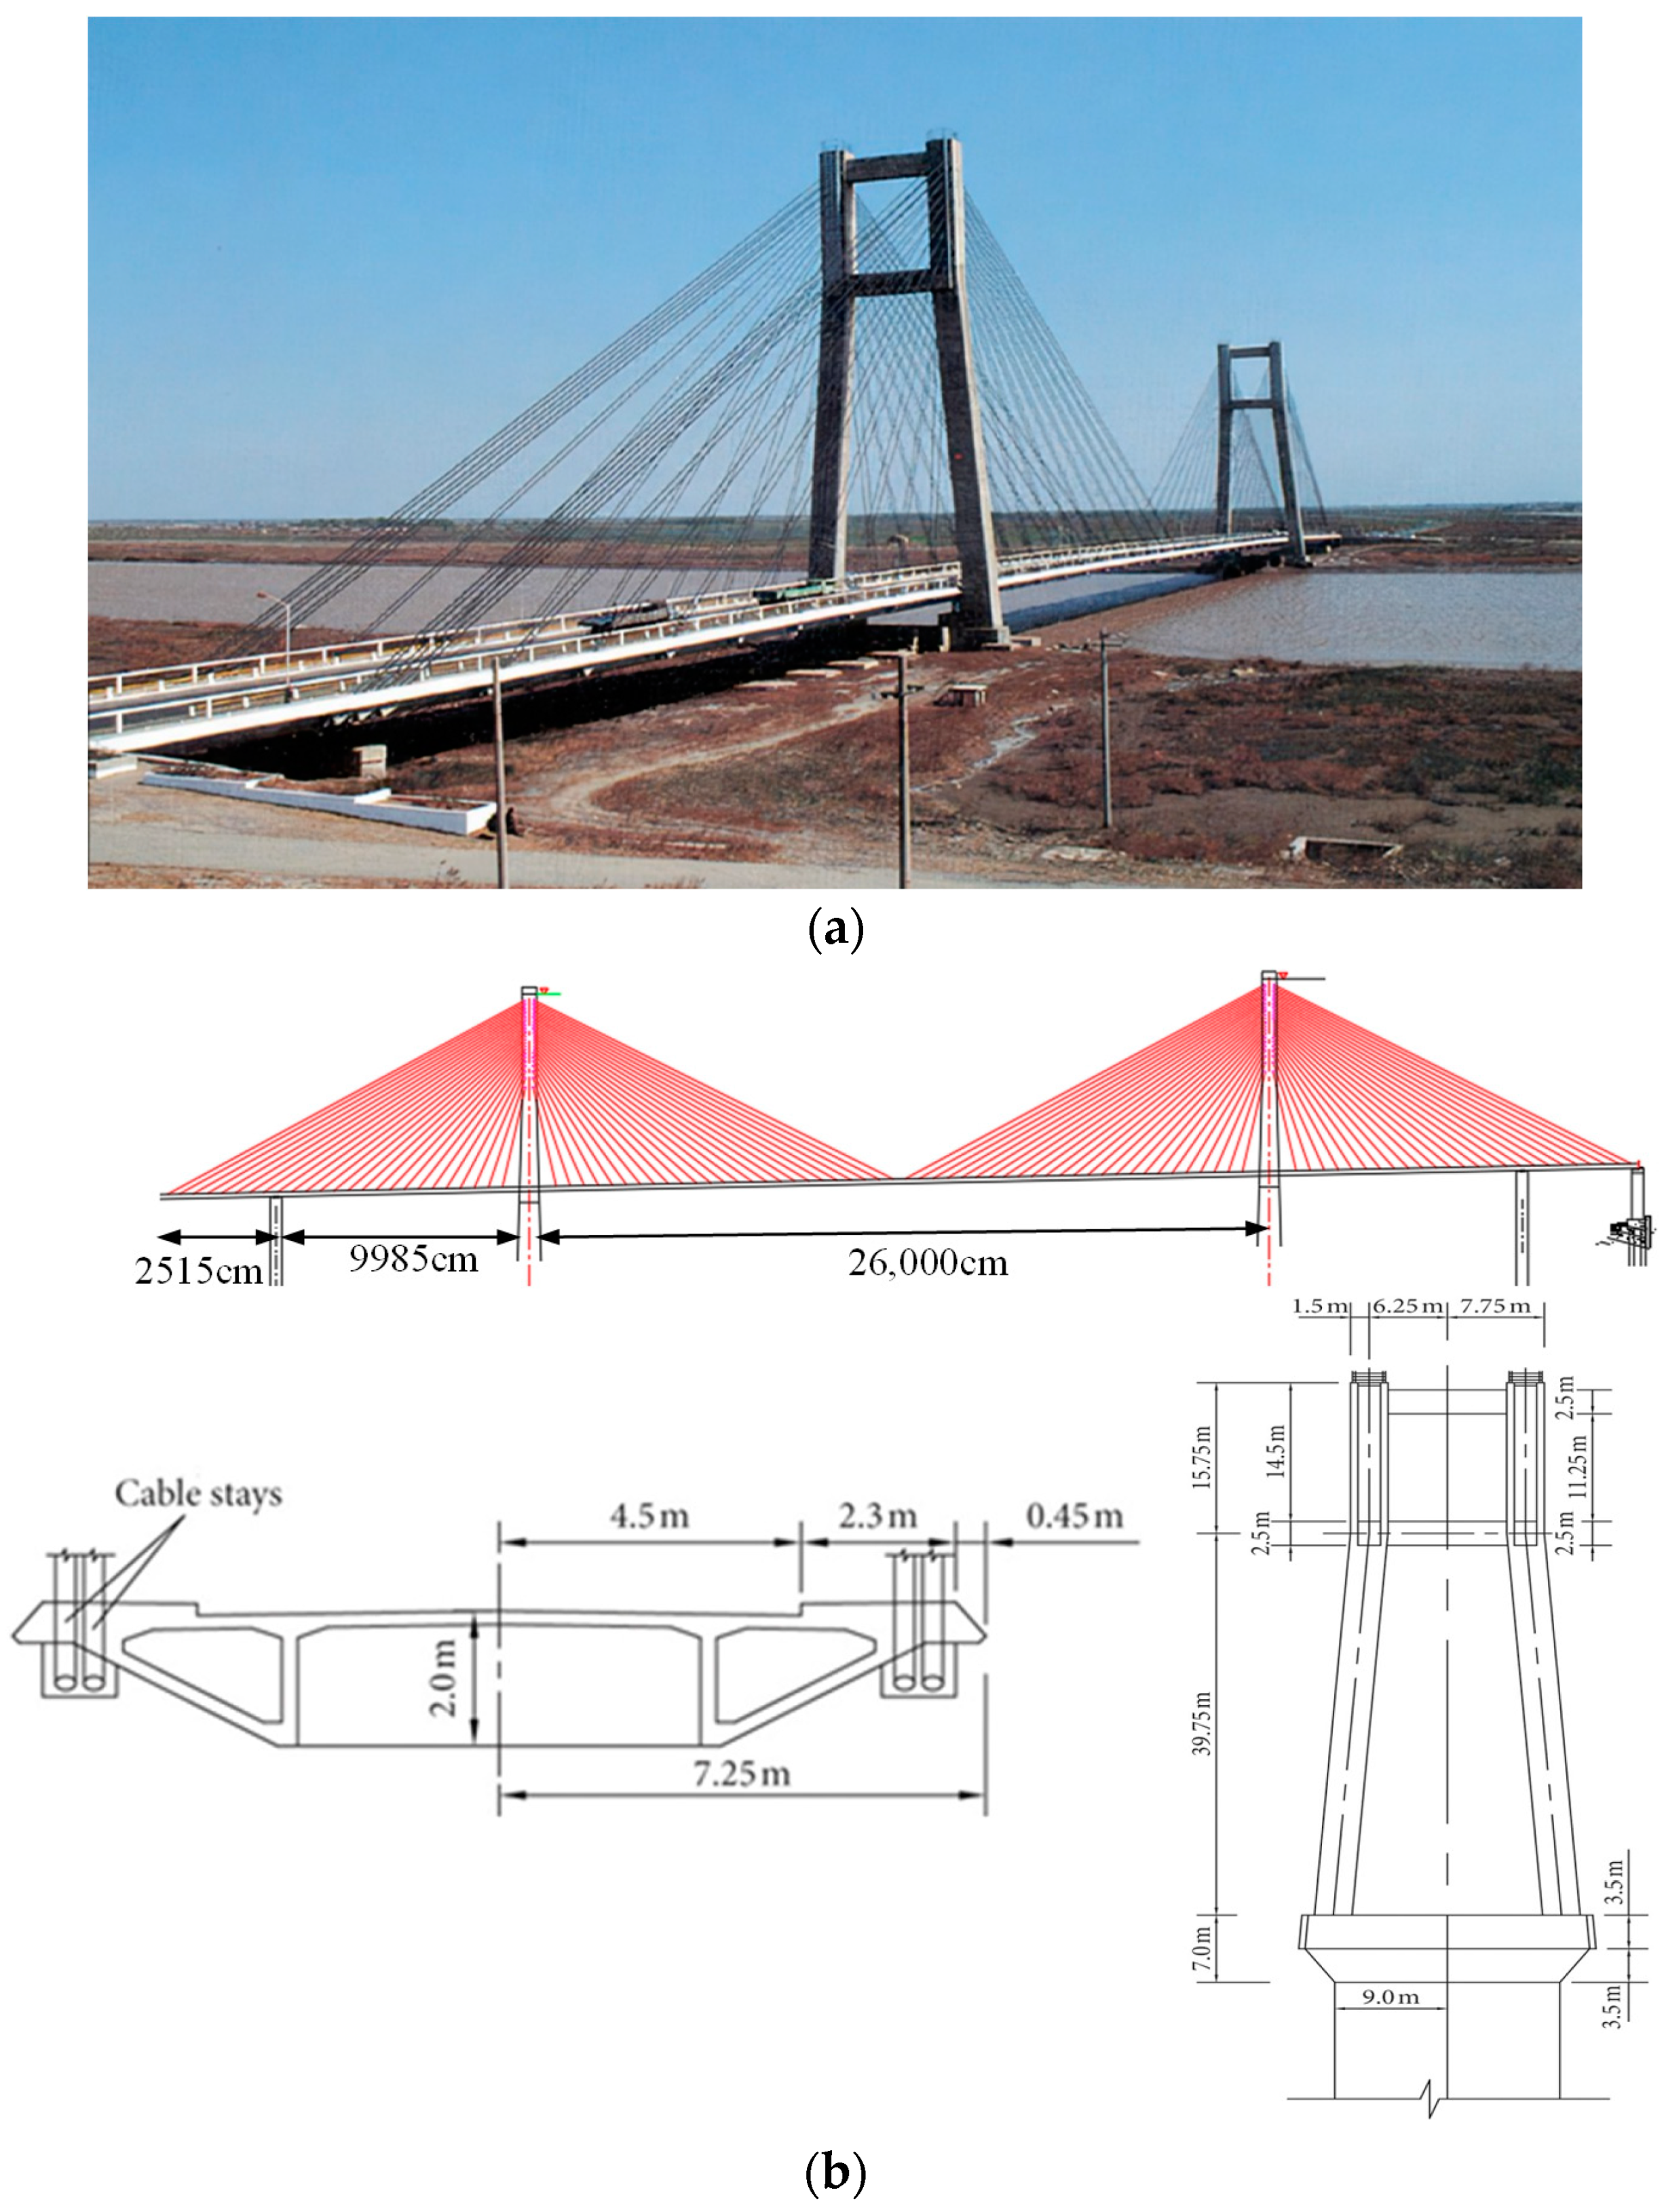
4. Engineering Examples
5. Bridge Influence-Line Identification
5.1. Measured Influence-Line Identification
5.2. Bridge Influence-Line Identification Update
6. Conclusions
Author Contributions
Funding
Data Availability Statement
Conflicts of Interest
References
- Chen, Z.W.; Guo, Z.C.; Ren, W.X.; Zhang, Y. A novel bridge influence line identification approach based on nonlinear frequency modulation signal reconstruction. Mech. Syst. Signal Process. 2024, 219, 111622. [Google Scholar] [CrossRef]
- Zhang, C.; Zhu, J.S.; Zhou, S. Integration of multi-point influence line information for damage localization of bridge structures. J. Civ. Struct. Health Monit. 2023, 14, 449–463. [Google Scholar] [CrossRef]
- Sheng, W.Q.; Xiang, H.J.; Gao, L.L.; Wang, J.J.; Liang, J.R.; Zhang, Z.W. Whole-process analysis and implementation of a self-powered wireless health monitoring system for railway bridges: Theory, simulation and experiment. Eng. Struct. 2024, 316, 118584. [Google Scholar] [CrossRef]
- Xia, Z.Y.; Shi, H.U.; Tang, B.; Wang, Y.; Chen, X.; Gu, S. Research on the performance of GMCBO methodology based on model updating of a pedestrian bridge. Mech. Syst. Signal Process. 2024, 220, 111686. [Google Scholar] [CrossRef]
- Liu, H.B.; Yang, Z.F.; Zhou, T.; Wang, L.X.; Chen, Z.H. Study on updating finite element model of steel truss structure based on knowledge-enhanced deep reinforcement learning. Eng. Struct. 2024, 316, 118576. [Google Scholar] [CrossRef]
- Zhou, Y.; Li, M.; Shi, Y.D.; Xu, C.C.; Zhang, D.W.; Zhou, M.Y. Research on Damage Identification of Arch Bridges Based on Deflection Influence Line Analytical Theory. Buildings 2023, 14, 6. [Google Scholar] [CrossRef]
- Xu, X.X.; Zhang, J.W.; Wang, C.; Wang, Z.H.; Wang, Y.J. Damage identification of simply-supported bridges using impact response-based recurrence graph. Structures 2024, 64, 106611. [Google Scholar] [CrossRef]
- Kim, H.; Kim, H.; Park, Y.J. Reliability-based Evaluation of Load Carrying Capacity for a Composite Box Girder Bridge. KSCE J. Civ. Eng. 2013, 17, 575–583. [Google Scholar] [CrossRef]
- Yazdani, M. Three-dimensional Nonlinear Finite Element Analysis for Load-Carrying Capacity Prediction of a Railway Arch Bridge. Int. J. Civ. Eng. 2021, 19, 823–836. [Google Scholar] [CrossRef]
- Lin, S.W.; Du, Y.L.; Yi, T.H.; Yang, D.H. Model Updating Using Bridge Influence Lines Based on an Adaptive Metamodel Global Optimization Method. J. Bridge Eng. 2022, 27, 04022003. [Google Scholar] [CrossRef]
- Wang, Z.; Yi, T.H.; Yang, D.H.; Zhou, P.; Sun, L. Early Warning Method of Structural Damage Using Localized Frequency Cointegration under Changing Environments. J. Struct. Eng. 2023, 149, 04022230. [Google Scholar] [CrossRef]
- Zheng, X.; Yi, T.H.; Yang, D.H.; Li, H.N. Multisection optimization-based target proof load determination method for bridge load testing. J. Bridge Eng. ASCE 2023, 28, 04023025. [Google Scholar] [CrossRef]
- Hu, F.; Zhi, L.H.; Zhou, K.; Li, Q.S.; Kong, F. A novel symplectic geometry-based modal decomposition technique for accurate modal identification of tall buildings with close-spaced modes. J. Build. Eng. 2024, 95, 110047. [Google Scholar] [CrossRef]
- Ye, X.J.; Sun, Z.; Chen, B.C. Research on modal parameters identification of bridge structure based on adaptive signal de-noising method. Clust. Comput. 2019, 22, 14377–14387. [Google Scholar] [CrossRef]
- Yang, Y.B.; Mo, X.Q.; Shi, K.; Gao, S.Y.; Tian, S.K. Bridge frequency identification using multi-contact responses computed from multi-DOF moving vehicle by nodal distribution method and enhanced integration algorithm. Comput. Struct. 2024, 299, 107397. [Google Scholar] [CrossRef]
- He, W.Y.; Ren, W.X.; Zou, X.H. Mass normalized mode shape identification method for bridge structures using parking vehicle induced frequency change. Struct. Control Health Monit. 2018, 25, e2174. [Google Scholar] [CrossRef]
- Zheng, H.W.; Yi, T.H.; Zheng, X.; Wei, Y.T.; Li, H.N. Operational Influence Line Identification of High-Speed Railway Bridge Considering Uncertainty of Train Load. ASCE-ASME J. Risk Uncertain. Eng. Syst. Part. A Civ. Eng. 2024, 10, 04024052. [Google Scholar] [CrossRef]
- Chen, Z.W.; Yang, W.B.; Li, J.; Yi, T.H.; Wu, J.C. Bridge influence line identification based on adaptive B-spline basis dictionary and sparse regularization. Struct. Control. Health Monit. 2019, 26, e2355. [Google Scholar] [CrossRef]
- Zheng, X.; Yang, D.H.; Yi, T.H.; Li, H.N. Development of bridge influence line identification methods based on direct measurement data: A comprehensive review and comparison. Eng. Struct. 2019, 198, 109539. [Google Scholar] [CrossRef]
- Zhou, Y.; Shi, Y.D.; Di, S.K.; Chen, D.; Sun, W.Z. Identification of deflection influence lines of cable-stayed bridges based on mixed modal decomposition. Eng. Mech. 2024, 1, 1–14. (In Chinese) [Google Scholar] [CrossRef]
- Song, T.; Song, Y.F.; He, S.H.; Wen, F. Practical formulas for estimating the frequency of vertical bending of short tower cable-stayed bridges by the energy method. J. Beijing Inst. Technol. 2016, 42, 521–526. (In Chinese) [Google Scholar] [CrossRef]
- Li, H.J. Replacement of Cable Stays in Yonghe Bridge in Tianjin, China. Adv. Civil. Eng. 2020, 2020, 6650393. [Google Scholar] [CrossRef]
- Li, H.J. The Second Maintenance and Strengthening of Yonghe Bridge. Appl. Mech. Mater. 2011, 1446, 1074–1081. [Google Scholar] [CrossRef]
- Zhang, Y.Y.; Xiao, R.C. Approximate calculation of self-oscillation frequency of double-tower cable-stayed bridge. Highw. Eng. 2009, 34, 72–76. (In Chinese) [Google Scholar] [CrossRef]
- Lan, Y.F.; Li, Z.K.; Koski, K.J.; Fülöp, L.D.; Tirkkonen, T.; Lin, W.W. Bridge frequency identification in city bus monitoring: A coherence-PPI algorithm. Eng. Struct. 2023, 296, 116913. [Google Scholar] [CrossRef]
- Sokolov, F.V. Optimal Error Quantification and Robust Tracking under Unknown Upper Bounds on Uncertainties and Biased External Disturbance. Mathematics 2024, 12, 197. [Google Scholar] [CrossRef]
- Zhao, N.; Wang, X.; Wu, Y. Nonstationary random vibration analysis of hysteretic systems with fractional derivatives by FFT-based frequency domain method. Mech. Syst. Signal Process. 2024, 220, 111666. [Google Scholar] [CrossRef]


| Material Parameter | Data | Material Parameter | Data |
|---|---|---|---|
| Modulus of elasticity of concrete | 3.45 × 10⁷ KN/m2 | Bending moment of inertia of main beam | 19.0956 m4 |
| Concrete capacity | 25 KN/m3 | Main beam section area | 14.1195 m2 |
| Poisson’s ratio | 0.2 | Main beam section height | 1.5 m |
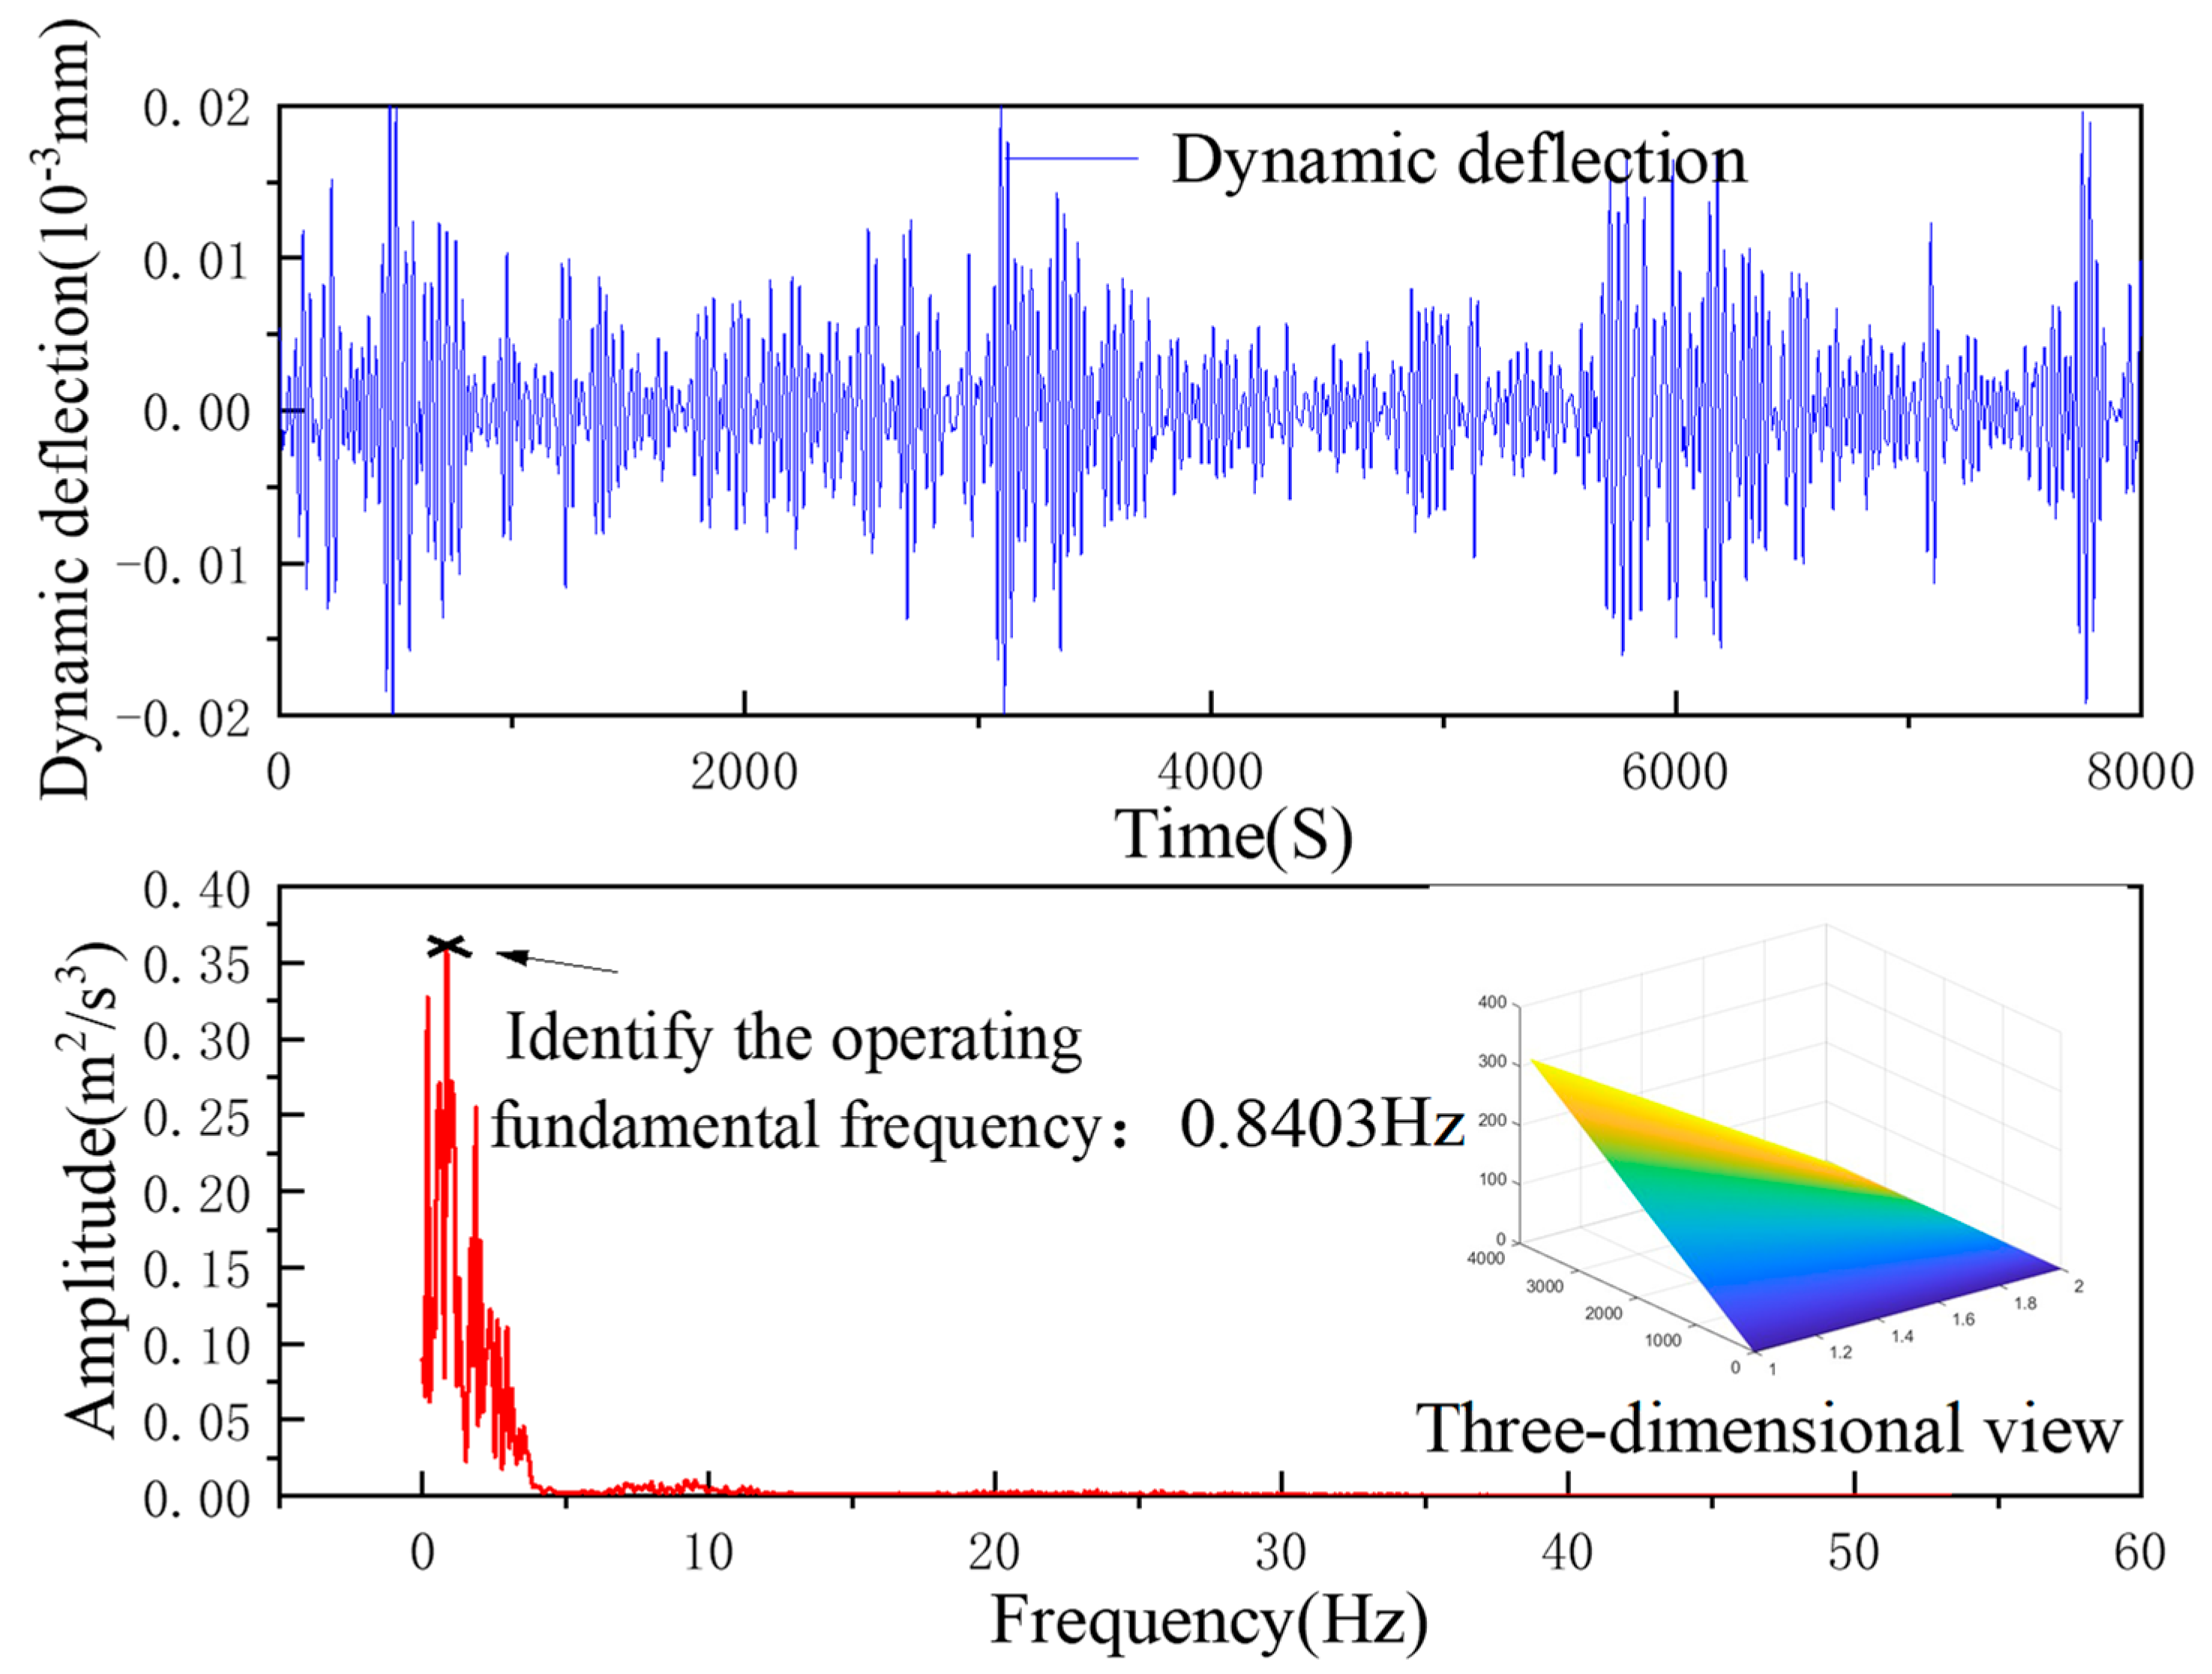
| Measured Frequency | Frequency of Finite-Element Model Calculations | Equation Resolution Frequency | The Method Proposed in This Paper Recognizes the Frequency | |
|---|---|---|---|---|
| Vibration fundamental frequency/Hz | 0.843 | 0.839 | 0.707 | 0.84034 |
| Relative error to measured fundamental frequency | 0 | 0.47% | 16.13% | 0.32% |
Disclaimer/Publisher’s Note: The statements, opinions and data contained in all publications are solely those of the individual author(s) and contributor(s) and not of MDPI and/or the editor(s). MDPI and/or the editor(s) disclaim responsibility for any injury to people or property resulting from any ideas, methods, instructions or products referred to in the content. |
© 2024 by the authors. Licensee MDPI, Basel, Switzerland. This article is an open access article distributed under the terms and conditions of the Creative Commons Attribution (CC BY) license (https://creativecommons.org/licenses/by/4.0/).
Share and Cite
Zhou, Y.; Shi, Y.; Di, S.; Han, S.; Wang, J. Research on Indirect Influence-Line Identification Methods in the Dynamic Response of Vehicles Crossing Bridges. Appl. Sci. 2024, 14, 7821. https://doi.org/10.3390/app14177821
Zhou Y, Shi Y, Di S, Han S, Wang J. Research on Indirect Influence-Line Identification Methods in the Dynamic Response of Vehicles Crossing Bridges. Applied Sciences. 2024; 14(17):7821. https://doi.org/10.3390/app14177821
Chicago/Turabian StyleZhou, Yu, Yingdi Shi, Shengkui Di, Shuo Han, and Jingtang Wang. 2024. "Research on Indirect Influence-Line Identification Methods in the Dynamic Response of Vehicles Crossing Bridges" Applied Sciences 14, no. 17: 7821. https://doi.org/10.3390/app14177821