Abstract
Improving the performance at signalized intersections can be achieved through different management styles or sensor technologies. It is crucial that we measure the real-time impact of these variables on intersection performance. This study introduces a Bluetooth-based real-time performance measurement system applicable to all signalized intersections. Additionally, the developed method serves as a feedback tool for adaptive intersection management systems, providing valuable data input for performance optimization. The method developed in the study is applied at the Refik Cesur Intersection in the Polatlı district of Ankara where delay values are calculated based on traffic flows and data from Bluetooth sensors positioned at strategic locations. Initially, the intersection operated under a fixed-time signaling system, followed by a fully adaptive signaling system the next day. The performance of these two systems is compared using the Bluetooth-based application. The results show that the average delay per vehicle per day is 58.1 seconds/vehicle for the fixed-time system and 45.3 seconds/vehicle for the adaptive system. To validate the Bluetooth-based performance measurement system, the intersection is modeled and simulated using Aimsun Simulation Software Next 20.0.4. The simulation results confirm the findings of the Bluetooth-based analysis, demonstrating the effectiveness of the adaptive signaling system in reducing delays.
1. Introduction
The primary purpose of traffic management is to ensure that people reach their destinations in the shortest possible time while prioritizing safety. To achieve this, parameters such as the delay, waiting time, number of stops, and average speed need to be optimized. Today, smart traffic systems are increasingly implemented or developed to enhance these parameters [1,2,3]. Evaluating the performance of these systems and using the results as feedback is crucial for improving their effectiveness and making informed decisions about the system.
Signalized intersections cause significant traffic delays. Various signaling systems have been developed to minimize delays caused by vehicles waiting at these intersections [4,5,6,7]. Measuring the performance of these systems is essential in order to refine them, increase their efficiency, and understand the impact of external factors on their performance.
The delay at intersections is a critical performance indicator in traffic engineering, directly affecting efficiency and user satisfaction. Adjusting signal times and phases can significantly impact delay times, and improperly set signal timings can lead to unnecessary waiting. The delay is often evaluated using data analysis, simulation models, or field tests to assess the performance of traffic signaling systems [8,9,10,11].
Fixed-time signaling systems are traffic management systems in which traffic signals operate on a predetermined schedule that does not change based on traffic volume or density. In these systems, traffic lights follow set intervals for red, yellow, and green lights and are generally used in areas with predictable traffic patterns [12,13]. Such systems are effective where the traffic volume is predictable and relatively constant, such as in small towns or areas with a low traffic density.
On the other hand, fully adaptive signaling systems are advanced traffic management solutions that continuously optimize and adjust traffic signal times based on real-time traffic conditions. These systems aim to maximize traffic flow and minimize congestion by instantly responding to changes in traffic. Real-time data on traffic volume, speed, vehicle type, and other variables are collected using various sensors such as magnetic loops, radars, video cameras, ultrasonic sensors, and LIDAR. Advanced software then analyzes these data and optimizes signal times using complex algorithms and models, resulting in reduced travel times, enhanced road safety, and environmental benefits due to decreased fuel consumption and emissions [14,15,16,17,18,19].
Bluetooth technology, a radio frequency communication method, is commonly used in short-range wireless communication. Bluetooth generally operates effectively within 10 m, although some advanced versions can communicate up to 100 m. It operates in the 2.4 GHz ISM band, which is used worldwide without a license for industrial, scientific, and medical applications [20]. Bluetooth is embedded in many devices, such as headphones, speakers, smartwatches, in-car entertainment systems, and phones. This widespread use enables data collection from passengers or drivers moving in traffic via Bluetooth signals. Bluetooth sensors calculate travel times between specific points by anonymously capturing the Media Access Control (MAC) addresses of devices and tracking their movements. These sensors help determine travel times, detect traffic density, and identify congestion [21,22,23].
In this study, performance analysis is carried out on Bluetooth data as a novelty. A method is developed based on the data received via Bluetooth and the delay parameters of the signalized intersection are determined. The developed method is applied to a real signalized intersection. The signalized intersection is operated with a fixed-time and fully adaptive signaling system and the delay parameters in two different operations are calculated. Thus, the performances of the signalized intersection in different operating types are demonstrated. The study offers a method to determine the effect of works on signalized intersections on performance. The method developed in this study determines how different operating types at intersections, changes in intersection geometry, and other safety systems installed at intersections affect the performance of the intersection.
In the study, a real-time systematic performance measurement is provided for signalized intersections by designing a Bluetooth-based traffic sensor. Monitoring the performance of the systems established for state authorities or local governments responsible for signalized intersections in countries is one of the most significant issues. The study contributes to science in this aspect. Additionally, the other most important science contribution in the study is a feedback system for fully adaptive signaling systems. After the Bluetooth traffic analysis sensor data are sent to the control center, the various results can be used in real time in the fully adaptive signaling system operating at the intersection. In other words, the results obtained from Bluetooth data will increase efficiency if used in a fully adaptive signaling system.
The Aimsun Next 20.0.4 traffic simulation software, widely used in traffic engineering and transportation planning, supports traffic modeling on various scales, including micro-, macro-, and meso-simulation [24,25,26]. In this study, the intersection where the Bluetooth-based performance measurement system is applied is also modeled using Aimsun. The simulation results are compared with the values obtained from the Bluetooth method to validate the developed approach.
2. Materials and Methods
2.1. Refik Cesur Intersection Structure
Polatlı is located in the western part of Ankara province and is the closest district to Ankara on the Eskişehir–Ankara State Highway. The methods in this study are applied at Refik Cesur Intersection in Polatlı district. Refik Cesur Intersection is a signalized intersection on the Eskişehir–Ankara State Highway. An average of 55,000 vehicles travel through Refik Cesur Intersection daily. The satellite photo of the intersection is seen in Figure 1.
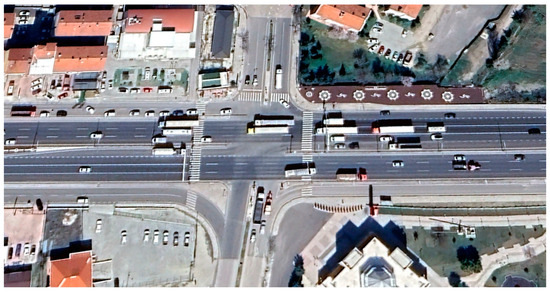
Figure 1.
Refik Cesur Intersection satellite image.
Refik Cesur Intersection has four directions. Eskişehir and Ankara directions consist of four and five lanes each. One of these lanes is a left-turn lane. The exit directions from Eskişehir and Ankara intersections are three lanes each. In addition, Refik Cesur Street and Selimiye Street directions consist of two lanes each. Refik Cesur Street and Selimiye Street exit directions from the intersection are two lanes each. The intersection directions and traffic flows are shown in Figure 2.
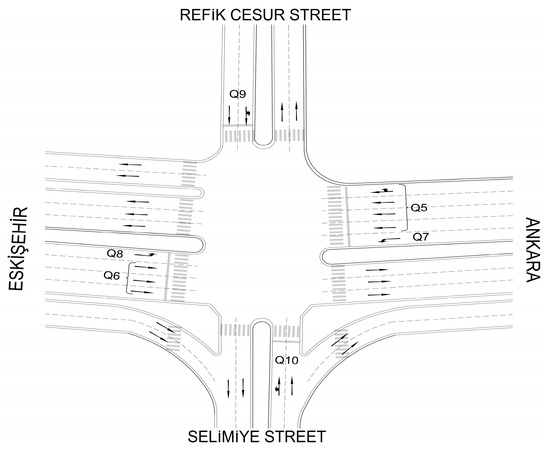
Figure 2.
Refik Cesur Intersection directions and traffic flows.
There are total of six traffic flows at Refik Cesur Intersection. These traffic flows are named Q5, Q6, Q7, Q8, Q9, and Q10. The methods in this study are applied on a traffic flow basis. Q5 and Q7 traffic flows are from Ankara direction. Similarly, Q6 and Q8 traffic flows are from Eskişehir direction, Q9 traffic flow is from Refik Cesur Street direction, and Q10 traffic flow is from Selimiye Street direction.
2.2. Refik Cesur Intersetion Signalization Operation Types
Refik Cesur Intersection is operated with two different signaling operation types. The intersection control device located at the intersection can operate in fixed-time and fully adaptive signaling. The fully adaptive signaling system was installed at the intersection in October 2023. One of the aims of this study is to reveal the effects of fixed-time and fully adaptive signaling systems on the performance of the intersection.
2.2.1. Fixed-Time Signaling Management
Refik Cesur Intersection fixed-time signaling system operates in five phases. Q5 and Q6 traffic flows constitute the first phase, Q5 and Q7 traffic flows constitute the second phase, Q6 and Q8 traffic flows constitute the third phase, Q9 traffic flow constitutes the fourth phase and Q10 traffic flow constitutes the fifth phase. The times of fixed-time signaling management are shown in Table 1. The total crossing time at the intersection is twelve seconds (four seconds yellow protection, four seconds protection, and four seconds red protection).

Table 1.
Fixed-time signaling management program and fixed times.
2.2.2. Fully Adaptive Signaling Management
Refik Cesur Intersection fully adaptive signaling system works with a camera and loop-sensor-based smart signaling system. The number of vehicles at the intersection, vehicle classes, queuing, average speed, and vehicle directions are determined by image processing technology through the fisheye camera placed at the intersection. In addition, detected data are supported by loop sensors placed at intersection directions. Both sensor types work in a hybrid manner. According to the detected traffic data, signal times for intersection directions are determined dynamically. The minimum and maximum times determined for Refik Cesur Intersection traffic flows are shown in Table 2.
Table 2.
Traffic flows minimum and maximum green times.
Phase patterns and signal times change automatically according to the traffic data obtained through the image-processing-based sensor and loop sensor at Refik Cesur Intersection. The image-processing-based sensor located at Refik Cesur Intersection is shown in Figure 3.
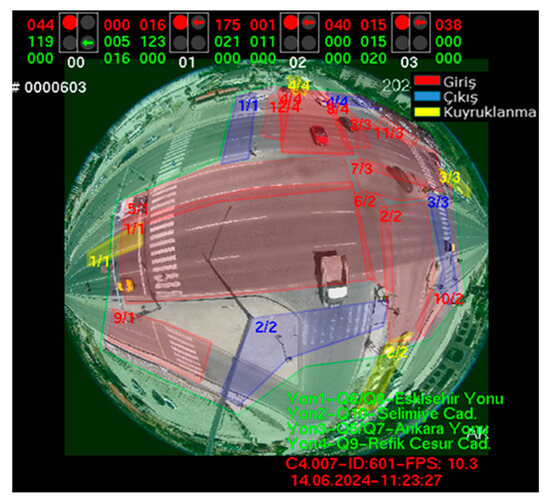
Figure 3.
Fully adaptive signaling system image-processing-based sensor.
Flexible structures are available in fully adaptive signaling operation. The phases formed by traffic flows change dynamically. The intersection control device at the intersection works in a matrix structure. Traffic flows that can work together are programmed into the intersection control device. As a result of the algorithms in its structure, the intersection control device automatically decides the phase structures according to the number of vehicles, vehicle classes, queuing, average speed, and neighboring intersection data coming from the sensors. Matrix phase structures of Refik Cesur Intersection according to traffic flows are shown in Table 3. For example, when Q6 traffic flow is turned on, Q5 or Q8 traffic flow can operate simultaneously. In other words, there are two different phase options: Q5–Q6 or Q6–Q8 phases. The intersection controller evaluates both options based on traffic data at the intersection.
Table 3.
Matrix phase structures according to traffic flows.
2.3. Bluetooth-Based Traffic Analysis Detector
Bluetooth-based traffic analysis detector is a sensor that includes a Bluetooth module, digital processor, peripheral equipment, communication module, and software. This sensor is designed to receive data, encode it, and transmit it to the data collection center via the communication module. The sensor detects the MAC addresses of the Bluetooth devices in its location and transmits them to the data collection center. The Bluetooth-based traffic analysis detector structure is seen in Figure 4.
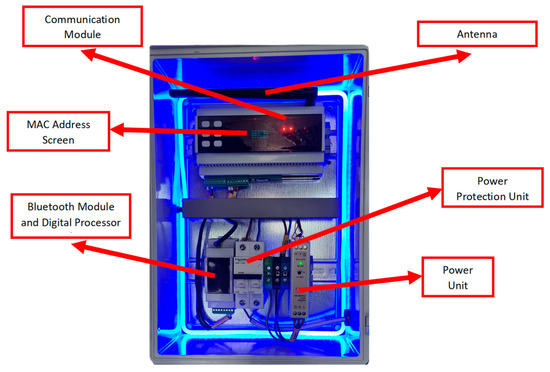
Figure 4.
Bluetooth-based traffic analysis detector structure.
Bluetooth traffic analysis sensor is a device designed to monitor and analyze traffic flow. These sensors track the movements of vehicles and road users using Bluetooth technology. By detecting devices that emit Bluetooth signals (mobile phones, wireless headsets, in-car Bluetooth devices, etc.), it collects information such as traffic volume, speed, direction, and travel time in a particular area.
The technical specifications of the designed Bluetooth traffic analysis sensor are given in Table 4.
Table 4.
The technical specifications of the designed Bluetooth traffic analysis sensor.
In Bluetooth traffic analysis sensors, the effective Bluetooth range and possible interferences are critical factors that directly affect the efficient operation of the sensors. Bluetooth sensors generally work effectively up to 100 m. This range can vary depending on the Bluetooth version used, the sensor’s power settings, and environmental factors. Bluetooth 5.0 and above versions can offer a wider range and transmit data over longer distances with low energy consumption. If the sensor is installed in an open area and there are no obstacles in front of the signal, the range can be reached at the maximum level. Physical obstacles such as buildings, vehicles, and trees can weaken the Bluetooth signal, causing the range to decrease. This weakening can be more pronounced, especially in densely populated areas such as urban areas. The installation of the sensors should be made by taking these factors into consideration. Bluetooth traffic analysis sensors can be exposed to various interferences caused by environmental and technological factors. Bluetooth operates in the 2.4 GHz ISM band, which is also used by many other devices such as Wi-Fi and Zigbee. This can cause radio frequency interference and can lead to signal loss, range reduction, and data transmission delays. Bluetooth signals can be suppressed, especially in areas with heavy Wi-Fi traffic. In areas with many reflective surfaces, such as urban areas, Bluetooth signals can reach the sensor by reflecting off surfaces such as buildings and vehicles via multiple paths. This is known as multipath propagation. The fact that signals reach the sensor at different times can reduce the quality of the signal and cause errors in distance measurements. In addition, the presence of many Bluetooth devices in a busy area (e.g., mobile phones, and in-car Bluetooth systems) can cause signal congestion. Environmental factors also affect Bluetooth signals. Weather conditions such as heavy rain, snow, or high humidity can affect Bluetooth signal strength. Although Bluetooth traffic analysis sensors can effectively collect data under suitable conditions, they can encounter various interferences that affect the propagation of the signal. In order to minimize the effect of these interferences, the designed Bluetooth traffic analysis sensors are placed in suitable locations. In addition, appropriate frequency management techniques are used in the designed sensor and additional software and hardware solutions are implemented.
Various strategies and solutions are implemented to minimize the effect of interferences in the designed Bluetooth traffic analysis sensors. There is Adaptive Frequency Hopping Spread Spectrum (AFH) in the designed sensor. Adaptive Frequency Hopping Spread Spectrum (AFH) ensures that the Bluetooth signal constantly changes frequency in the 2.4 GHz band. In this way, frequencies that create interference are detected and skipped, and communication is established over less intense frequencies. Thus, interferences are reduced, signal stability is increased, and data transmission is made more reliable. Bluetooth technology can skip frequencies 1600 times per second. This fast-hopping reduces the possibility of devices conflicting with other devices using the same frequency band. Another part used in the sensor to reduce interferences is the high-power antenna. The antenna used in the designed sensor is optimized and placed to increase the signal power. The effect of obstacles is reduced with the high-gain antenna. In the designed method, signal fusion is performed by using multiple sensors. In other words, after receiving the MAC address of a Bluetooth device passing through any direction of the intersection, this MAC address is detected and matched in any of the Bluetooth devices in the other directions. Thus, false data caused by interference are prevented. The designed Bluetooth sensor is designed in a case with a high degree of protection. Thus, the sensor is protected from environmental conditions such as extreme weather conditions and physical impact.
Apart from using Bluetooth signals, there are various techniques for real-time performance measurement at signalized intersections. One of these is inductive loop detectors. Inductive loop detectors are widely used and provide reliable data about vehicle presence and passage. They are cost-effective for long-term use. However, they have a costly maintenance process. Inductive loop detectors require an installation by closing the traffic during the application. They are also limited in their ability to capture detailed data such as vehicle speed or class. Another performance measurement technique is video image processing. Video image processing systems provide comprehensive data including vehicle numbers, speeds, and classifications. They can cover multiple lanes and provide high-accuracy real-time data. However, these systems are expensive to install and maintain. They can also be adversely affected by environmental conditions such as fog, rain, or poor lighting. One of the techniques used in performance measurement is infrared sensors. Infrared sensors are effective in measuring queue lengths and vehicle speeds. However, these sensors are sensitive to environmental factors such as extreme temperatures or heavy rain, which negatively affect their accuracy. They also have a limited detection range compared to other methods. Another technique used in performance measurement is radar-based systems. Radar systems provide accurate data on vehicle speed, distance, and direction. They are effective in various weather conditions and can cover more than one lane at a time. Radar systems are costly and their accuracy can be affected by large metal objects or other interferences in the environment. Bluetooth-signal-based systems, one of the techniques used in performance measurement, offer an ergonomic method for collecting travel time and delay data. They are easy to install and can provide real-time data without significant infrastructure changes. However, the accuracy of Bluetooth systems depends on the availability of Bluetooth-enabled devices rate in vehicles. When these technologies are compared, it becomes clear that Bluetooth-signal-based systems offer a cost-effective and traffic-free option for real-time performance measurement, while other methods may offer advantages in terms of data richness. The most appropriate technique must be selected according to the traffic management need or application area.
Bluetooth sensors can be used in certain areas of traffic and for certain purposes:
Traffic Data Collection: Bluetooth sensors anonymously capture the MAC addresses of Bluetooth devices located in a certain area. In this way, the passage times of vehicles and pedestrians at certain points are recorded [27].
Traffic Flow Analysis: The collected data are used to analyze traffic density, speeds, travel times, and route preferences. This information provides traffic management centers with state about the real-time traffic situation [28].
Travel Time Calculation: The travel time between two specific points is determined by calculating the time difference between the sensors located at these two points [29,30].
Traffic Density and Capacity Analysis: These sensors are used to determine the number of vehicles and density on a particular road section. Thus, information is obtained about the capacity of the roads and the current traffic density [31].
Traffic Management and Planning: The data collected are used by urban planners and traffic engineers to develop traffic management strategies, reduce traffic congestion, and improve road safety.
2.4. General Principles of Real-Time Performance Measurement Application via Bluetooth Signals
The method designed in this study can be applied to all signalized intersections. Signalized intersections are divided into types such as three-way intersections, four-way intersections, and rotary intersections. The number of lanes belonging to the arms may differ in each intersection. The method is designed to be applied to all signalized intersection geometric types. The designed system detects the travel times per vehicle with Bluetooth sensors placed at appropriate distances from the intersection arms and is associated with the real number of vehicles by fusion with the second sensor to be used at the intersection. Sensors that can count vehicles such as loop sensors, image-processing-based sensors, and radar sensors can be used as secondary sensors. Figure 5 shows an example application that can be carried out on a three-way intersection where the number of lanes belonging to directions are different. It is sufficient to use one of the loop sensors, image-processing-based sensors, or radar sensors as the second sensor.
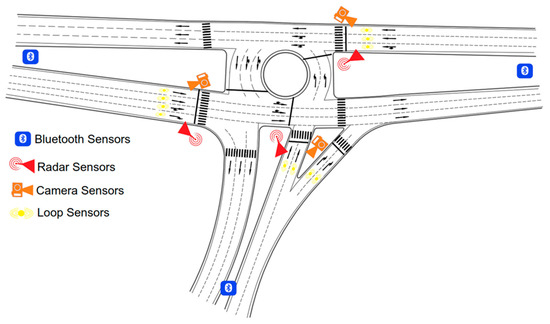
Figure 5.
Application on sample intersection.
As seen in the example application, Bluetooth sensors are placed back from the intersection directions. Thus, the travel times of vehicles between the intersection arms are determined. Delays per vehicle can be calculated based on the detected travel times and the total delay between the arms can be determined by multiplying them with the actual vehicle numbers coming from the second sensor. Thus, the intersection performance is measured in real time.
For Bluetooth sensors, some considerations should be made in positioning to obtain more secure data, optimize range, and reduce interference. Bluetooth sensors are best placed at the end of the intersection where maximum queuing occurs from the stop line. Therefore, it is recommended that sensors be placed approximately 100 m behind the intersection stop line.
Bluetooth sensors should be installed on roadsides. The location of the Bluetooth sensor should be near vehicle routes. The sensor can be mounted on existing poles or new poles can be erected if necessary. Bluetooth sensors can communicate well with devices in a suitable area radius within a 360-degree angle. Therefore, when choosing a location for Bluetooth sensors, the radius criterion, which is the area of effect, should be taken into account. Bluetooth signals use radio waves and can be affected by obstacles. Buildings, walls, trees, and large metal structures can block or reflect the spread of the signal. Sensors should be placed in places where there are no such obstacles and where there is a clear line of sight. The height of the sensors from the ground affects the signal coverage area and reception quality. It is recommended that the height at which Bluetooth sensors will be positioned is at least 3 m and at most 6 m. Sensors placed at a too-low height may cause signal loss or incorrect data due to reflections. The distance between the sensors should be adjusted to optimize coverage areas. Placing sensors too close to each other can lead to data redundancy and incorrect calculations. Sources of electromagnetic interference such as Wi-Fi routers and other Bluetooth devices should be avoided. These devices can interfere with Bluetooth signals. In order for sensors to work continuously, there must be a reliable power source nearby. For easy maintenance of sensors, they should be placed in easily accessible locations. This is important for periodic maintenance and troubleshooting.
In the designed method, a technology called Adaptive Frequency Hopping Spread Spectrum (AFH) is used in the Bluetooth sensor to ensure data security. This technology allows Bluetooth devices to communicate without being affected by interference from other devices using the same frequency band. Constantly changing frequencies make it difficult for the signal to be monitored and for unauthorized persons to intercept the signal, which increases the security of communication. In addition, all sensors and components used in the designed method are connected to a closed-circuit communication system. All data detected from the sensors are transferred to the server belonging to the system owner authority via the closed-circuit communication channel. All calculations, data, and monitoring are carried out through the server. All detected data are backed up on the server.
The excess of Bluetooth signals can have a negative effect on data security and interference. In order to prevent this situation from occurring in crowded traffic, some precautions are taken to minimize these effects in the method designed. Data are matched with multiple sensor combinations. The Bluetooth signal detected at any intersection arm is expected to leave the intersection from any of the Bluetooth sensors on the other arms. Unmatched Bluetooth signals are eliminated. In the application made at Refik Cesur Intersection, it is seen that the Bluetooth data in crowded traffic are more; therefore, the average delay calculation per vehicle is more reliable, because the accuracy rates of the delay values increase as the Bluetooth data increase. Refik Cesur Intersection is a crowded intersection with an average daily traffic of 55,000 vehicles. A crowded intersection is selected to observe the situations of the designed method in heavy traffic.
2.5. Bluetooth-Based Traffic Analysis Detector Application Layout Structures
In the method applied at Refik Cesur Intersection, Bluetooth traffic analysis sensors are placed as seen in Figure 6.
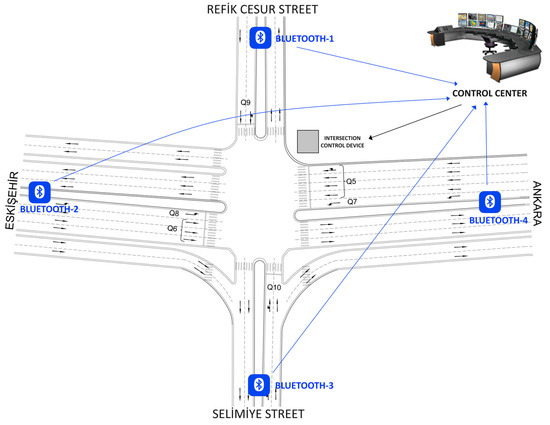
Figure 6.
Bluetooth traffic analysis sensor layouts.
Sensors are placed in the middle of the going and coming directions of the intersection arms. Thus, traffic data of vehicles from all traffic flows are obtained. Field installation of Bluetooth traffic analysis sensors is shown in Figure 7.
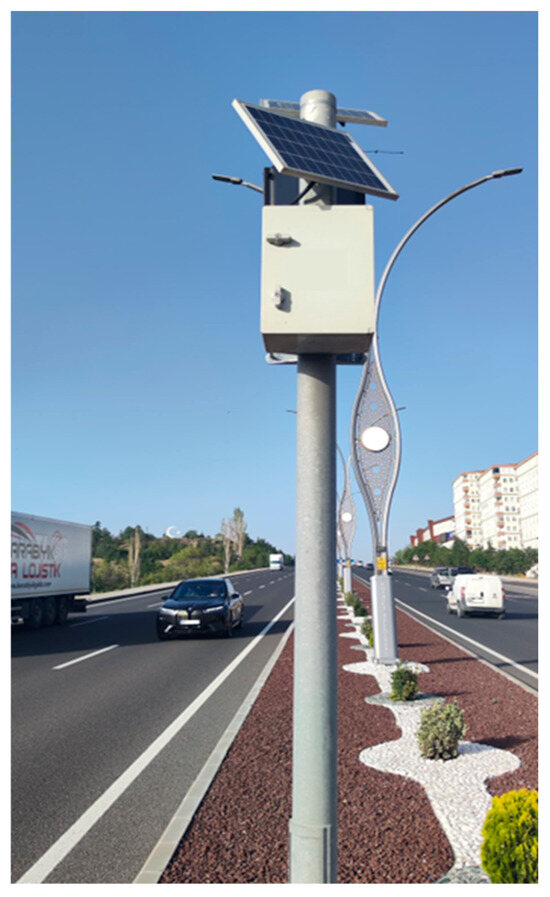
Figure 7.
Bluetooth traffic analysis sensor field installation.
Data can be detected for all traffic flows according to the layout plan of Bluetooth traffic analysis sensors. The detected MAC addresses are received by Bluetooth sensors and the data are sent to the center. MAC addresses sent to the center are matched according to the detected sensors. Thus, parameters such as vehicle routes, Bluetooth detection times, travel times, and delays can be determined. With this structure, a real-time performance measurement system is created. The scientifically biggest innovation of this structure is that it creates an infrastructure for performance-enhancing algorithms by using the detected parameters as feedback data in the fully adaptive signaling system. Since the performance measurement in this study is made in real time with real traffic data, it will make the management of fully adaptive signaling systems more efficient. As seen in Figure 6, Bluetooth data can be collected in the control center, and automatic results are detected and then sent as real-time feedback to the intersection control device that manages the fully adaptive signaling system.
Bluetooth traffic analysis sensor configurations corresponding to traffic flows are shown in Table 5.
Table 5.
Bluetooth sensor configuration corresponding to traffic flows.
2.6. Data Detected via Bluetooth
Bluetooth traffic analysis sensors detect the MAC addresses of open Bluetooth-based devices (headphones, speakers, smart watches, in-car entertainment systems, phones, etc.) passing through the location. The detection time is also recorded along with the MAC address. Thus, traffic data can be determined as a result of these data coming from all Bluetooth sensors.
Automatic data extraction is performed within the detected MAC addresses. For example, between two Bluetooth sensors located on a certain road, there may be people with MAC addresses who have shopped at the market. Such data are automatically screened by software filters. Table 6 shows sample data detected by Bluetooth sensors.
Table 6.
Sample data detected by Bluetooth traffic sensors.
3. Results
Delay values are determined with the real-time performance measurement system developed in this study. For performance measurement, the delay parameter, which is one of the most important parameters for efficiency in traffic, is used. The designed Bluetooth traffic sensors are placed at the Refik Cesur Intersection. Data received from Bluetooth sensors are collected in a single center via the communication line. Delay values are calculated based on the data in the center.
Normal conditions are first taken into consideration in the calculation. Road-based distances between Bluetooth traffic sensors are measured and the travel time of the vehicles at a constant speed of 50 km/h without any obstacles such as a signaling system or vehicle waiting was calculated; 50 km/h is the speed limit applied by the local government as a rule. Table 7 shows the distance between Bluetooth traffic sensors and travel times under normal conditions at a constant speed of 50 km/h.
Table 7.
Distance between Bluetooth sensors and travel time under normal conditions.
The Refik Cesur Intersection was operated with two different operating types. The intersection was operated as a fixed-time signaling system all day on 15 May 2024. The next day, the intersection was operated as a fully adaptive signaling system all day on 16 May 2024. Traffic data were taken from Bluetooth traffic sensors on both days, and delay times were calculated by subtracting it from the travel time under normal conditions. Thus, the real-time performance measurement of fixed-time and fully adaptive signaling systems was carried out all day. In Table 8, the determined and calculated values for the Q5 traffic flow are given as an example. In the delay calculation, travel times between Bluetooth sensors under normal conditions were taken as reference. The intersection control device at the Refik Cesur Intersection has image-processing-based and loop-based sensors that can detect vehicle counts in the directions. The total delay is calculated with the number of vehicles obtained from these sensors and the delay values per vehicle obtained from the Bluetooth sensors.
Table 8.
Data detected in Bluetooth traffic sensors and delay calculation results in fixed-time and fully adaptive signaling operations for Q5 traffic flow.
The determined values and calculations shown in Table 8 are made for all traffic flows. For example, the Q5 traffic flow hourly delay value per vehicle is calculated by adding the total delays from Bluetooth 4 to 2 and Bluetooth 4 to 1 in the same hour and dividing by the total number of vehicles at that hour. In Equation (1), an example calculation is given for the Q5 traffic flow fixed-time signaling system for the 13:00–14:00 interval.
Hourly delay per vehicle = (71665 + 6500)/(914 + 127) = 75.09 s/veh
Hourly delay graphs of fixed-time and fully adaptive signaling systems on 15 May 2024 and 16 May 2024, detected by the Bluetooth traffic sensors in the study, are given in Figure 8, Figure 9 and Figure 10. In these figures, it is observed how the delays in traffic flows change during the day. It is observed that the delays in traffic flows increase during the peak traffic hours in both management methods. However, as can be seen from the figures, traffic flows with high vehicle numbers show a better performance in fully adaptive signaling management.
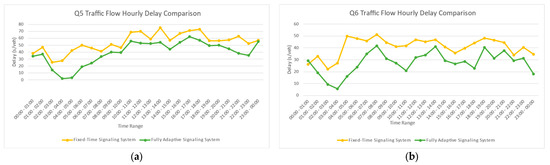
Figure 8.
Traffic flow hourly delay: (a) Q5 traffic flow hourly delay comparison; and (b) Q6 traffic flow hourly delay comparison.
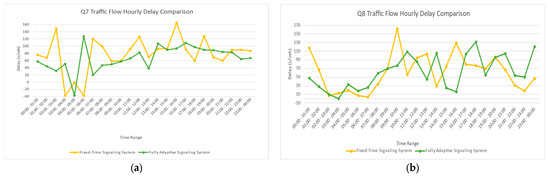
Figure 9.
Traffic flow hourly delay: (a) Q7 traffic flow hourly delay comparison; and (b) Q8 traffic flow hourly delay comparison.
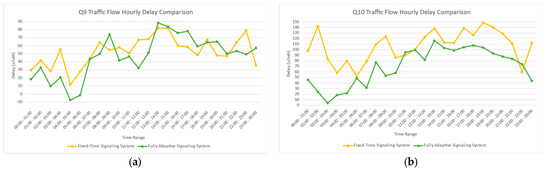
Figure 10.
Traffic flow hourly delay: (a) Q9 traffic flow hourly delay comparison; and (b) Q10 traffic flow hourly delay comparison.
The traffic-flow-based daily average delay per vehicle is calculated based on the total delay and total number of real vehicles in Table 8. The traffic-flow-based daily average delay per vehicle is found by dividing the total delay by the total number of real vehicles. The daily average delay per vehicle for the intersection is calculated by adding up the total delays of all traffic flows and dividing by the total daily real vehicle number of the intersection. The delay performances daily per vehicle at the intersection are shown in Table 9.
Table 9.
Daily delay performances per vehicle.
The performance measurement of fixed-time and fully adaptive signaling systems is carried out with the real-time performance measurement system designed in the study. According to the measurement results, the daily average delay per vehicle in the fixed-time signaling system is determined as 58.1 seconds/vehicle, and the daily average delay per vehicle in the fully adaptive signaling system is determined as 45.3 seconds/vehicle. According to the Bluetooth-based performance measurement results, an approximately 22.03% daily improvement in delay occurred with the installation of a fully adaptive signaling system at the Refik Cesur Intersection.
4. Discussion
After obtaining the results of the Bluetooth-based performance measurement system designed in the study, validation studies are carried out. The Aimsun simulation program is used in verification studies. Traffic data during the day are obtained from the sensors and intersection control device at the Refik Cesur Intersection. In the study, the Refik Cesur Intersection is operated with a fixed-time signaling system on 15 May 2024, and a fully adaptive signaling system on 16 May 2024. Bluetooth-based performance measurement system data are also examined for these days. Direction-based vehicle counts and signal times for the 18:00–19:00 time interval on 15 May 2024 and 16 May 2024 were obtained from the sensors and intersection control device at the Refik Cesur Intersection. These data between 18:00–19:00 for both days were entered into the Aimsun simulation program. Thus, the outputs of the Bluetooth-based performance measurement system and the Aimsun simulation program were compared using data between 18:00–19:00 on 15 May 2024 and 16 May 2024.
The Refik Cesur Intersection is modeled within this study. While creating the Aimsun model, many parameter entries and model drawing studies are carried out. Within the scope of the Aimsun model, inputs such as speed limits, turning lanes, number of lanes, lane and road capacity, road width, and signaling placement that affect traffic congestion are used. The calibration process of parameters such as driver reaction time, lane compliance level, driver behavior, and similar parameters for the driving model of the vehicles is carried out in line with the observations made at the intersection. In this study, inputs of other parameters used in the Aimsun simulation are also provided. The slopes of the roads joining at the intersection are assumed to be zero. In the simulations, the speed of vehicles entering the intersection is gradually reduced. Visible parking at the intersection is included in the simulation.
The vehicle counts entered as data into the Aimsun simulation are the arrival directions of the vehicles, the exit directions of the vehicles from the intersection, and the total number of vehicles. Traffic count data and signal times between 18:00–19:00 on 15 May 2024 and 16 May 2024 were processed into the Refik Cesur Intersection, which is modeled exactly in the Aimsun simulation program. The model was run with the fixed-time program for vehicle counts on 15 May 2024, given in Table 1. Vehicle counts on 16 May 2024 were also run with varying signal times according to traffic conditions received from the fully adaptive signaling system. The vehicle counts processed at the Refik Cesur Intersection, modeled in the Aimsun simulation program, are given in Table 10 as an example for the date of 16 May 2024.
Table 10.
Direction-based vehicle count data for the period between 18:00–19:00 on 16 May 2024.
The Aimsun model is modeled exactly with the previously explained inputs and operated as seen in Figure 11. Delay values for the Refik Cesur Intersection, which is operated in a one-to-one simulation environment with fixed-time and fully adaptive signal data, are taken as output from the Aimsun simulation program.
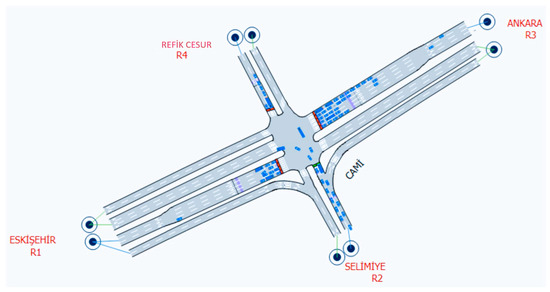
Figure 11.
Refik Cesur Intersection Aimsun simulation modeling.
The results of the Aimsun simulation program and Bluetooth-based performance measurement system for the hours between 18:00–19:00 on 15 May 2024 and 16 May 2024 are shown in Table 11. A comparison of the delay values per vehicle in the fixed-time signaling system and fully adaptive signaling systems of the intersection is made. Accordingly, it is determined that the outputs of the real-time Bluetooth-based performance measurement system designed in the study and the Aimsun simulation program are approximately the same. Thus, the verification of the real-time Bluetooth-based performance measurement system is carried out. The reason why the delay values in the Aimsun simulation program are slightly lower can be explained as the simulation programs simulate more ideal conditions. For example, since factors such as a pothole in the direction of the intersection or the effects of pedestrian behavior are not present in the simulation environment, it can be considered normal for the delay value to be slightly lower.
Table 11.
Aimsun simulation program and Bluetooth-based performance measurement system results.
Previously, various studies are carried out to measure the performance and efficiency for different algorithms or innovations at signalized intersections or specific routes. In a study, signalized intersection performance measurement is carried out via LIDAR sensor data and the control delay is determined with a weighted average control delay deviation of 1.39 s/veh [32]. In another study, algorithm experiments are carried out on traffic cellular automata (TCA) models and an efficiency increase of 9.21% to 36.98% is achieved compared to traditional solutions [33]. In a study on the efficient determination of maximum green time in traffic-actuated signaling management, performance analysis is carried out through the Aimsun simulation program [34]. In one study, travel times are measured with Bluetooth sensors placed on certain routes [35]. Later, with the optimization algorithms developed, the delay values of vehicles moving along the artery are determined more efficiently. In another study, the Cooperative Vehicle Intersection Control (CVIC) algorithm is developed and an analysis result is presented in the VISSIM simulation environment [36]. According to these results, the CVIC algorithm provided a 33% improvement in total travel time compared to traditional actuated signaling systems. In a study that presents a delay-tolerant smart intersection management protocol for multi-lane intersections, analyses are conducted on the SUMO simulation program [37]. The analysis results showed that intersections managed through the developed protocol showed better performance than smart signaling.
In signalized intersection performance analysis, instead of using costly solutions such as simulation programs or electronic sensors, analysis can be made by making visual counts at the intersection. In one study, the traffic counts and signal times in each direction at the Retteri Intersection in Chennai, India are monitored and noted by researchers. Then, the delay and intersection level of service values are determined using Webster’s theorem on these data [38]. In the other study, studies are carried out via camera to verify the analysis result of the developed adaptive traffic management model on the signalized intersection. The intersection entry and exit data of the vehicles monitored from the camera are recorded manually and delay values are calculated [39]. In another study, drone videos are used in the signalized intersection performance analysis and fuel savings and carbon dioxide emission reduction values are calculated based on the recorded data [40].
The study revealed that the fully adaptive signaling system at the Refik Cesur Intersection works more efficiently than the fixed-time signaling system. It is a normal result that fully adaptive signaling systems operate more efficiently than fixed-time signaling systems. However, it is important for municipalities and state traffic managers to identify and monitor performance in real time. It is also important for a comparison to determine how different systems or algorithms affect performance. This is one of the contributions of this study to science. Real-time detection and monitoring are possible with the Bluetooth-based performance measurement system designed in this study. Other studies on this subject generally include simulation studies on historical data or future calculation methods by obtaining traffic data for performance measurement [33,34,36,37,38,39,40]. The structure established in this study is based on producing real-time results with live traffic data.
Systems similar to this study can be established through different technologies. For example, similar performance measurement systems can be designed through vehicle-tracking systems or V2X technology. However, it is estimated that the accuracy rate of the study result will be low since the number of vehicles with vehicle-tracking systems or on-board units is low in traffic. However, it can be given as a future research proposal depending on future dissemination.
Another important scientific innovation of the performance measurement system designed in this study is that it can be used as feedback in fully adaptive signaling systems. Since the system makes real-time measurements, improvements in intersection performance can be achieved with real-time feedback to the adaptive control unit. Figure 9 and Figure 10 show that, in some time zones, the efficiency of the fully adaptive signaling system decreases compared to the fixed-time signaling system. If similar data are given as feedback to the adaptive control unit in real time, as seen in Figure 12, a better signalized intersection performance can be achieved with the algorithms to be developed for the adaptive control unit. At the same time, this aspect of the study is a future research proposal.
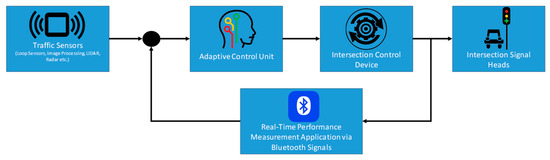
Figure 12.
Signalized intersection management feedback control structure.
After the installation of a fully adaptive signaling system, important outputs such as fuel savings and carbon dioxide emission reduction are achieved, as the efficiency increases compared to the fixed-time signaling system. It is possible to calculate fuel savings and carbon dioxide emission reduction values with the delay values per vehicle determined by the Bluetooth-based performance measurement system [41]. The study also provides the basis for calculating and determining savings amounts.
5. Conclusions
In the study, the Bluetooth-based real-time performance measurement system is developed and applied to a signalized intersection. The system demonstrates its effectiveness in providing valuable data for optimizing intersection management. The results show that the Bluetooth-based method accurately measured delay parameters and offered results into the performance differences between fixed-time and fully adaptive signaling systems. Key findings from the application at the Refik Cesur Intersection include the significant reduction in average delay per vehicle when using the fully adaptive signaling system compared to the fixed-time system. This highlights the potential of adaptive systems to improve traffic flow and reduce congestion at signalized intersections.
The Bluetooth-based system not only serves as a practical tool for monitoring and analyzing intersection performance but also as a feedback mechanism for adaptive signaling systems. The integration of this system with existing traffic management infrastructure can lead to more efficient and responsive traffic control, ultimately contributing to reduced delays, improved safety, and lower environmental impact.
In this study, the vehicle delay values obtain from the Bluetooth sensor are correlated with the vehicle count data obtained from the image-processing-based sensor. More efficient and functional systems can be produced by combining Bluetooth sensors with different sensor technologies. If a combination is created with sensors that can detect different features of vehicles such as radar or LIDAR, the accuracy rate and diversity of the outputs can be increased. The most important limitation in the applicability of the method is that Bluetooth data must be present in a certain amount. Since Bluetooth data will be insufficient at intersections with very little traffic, the accuracy of the system decreases.
The method can be applied to different types of signalized intersections. It is evaluated that, with the appropriate placement of sensors in three-way, four-way, or rotary signalized intersections, an accuracy similar to the performance obtained in this study will be obtained. Future studies could explore the scalability of this system to other intersections with different geometric and traffic conditions. The designed method is capable of determining the performance results in general traffic engineering studies. For example, the effects of a geometric change such as increasing the number of lanes in one direction of an unsignalized intersection on performance can be determined by the designed method. Overall, this study presents a robust framework for real-time traffic performance monitoring, with promising applications in smart city initiatives and advanced traffic management systems.
Author Contributions
Conceptualization, F.Y., B.A. and A.D.; methodology, F.Y., B.A. and A.D.; software, F.Y. and B.A.; validation, F.Y. and A.D.; formal analysis, F.Y.; investigation, F.Y., B.A. and A.D.; resources, F.Y. and A.D.; data curation, A.D.; writing—original draft preparation, F.Y. and B.A.; writing—review and editing, A.D.; visualization, B.A.; project administration, F.Y. All authors have read and agreed to the published version of the manuscript.
Funding
This research received no external funding.
Institutional Review Board Statement
Not applicable.
Informed Consent Statement
Not applicable.
Data Availability Statement
The data presented in this study are available upon request from the corresponding author.
Acknowledgments
We would like to thank the Republic of Turkey General Directorate of Highways and Mosaş Smart Transportation Technologies Inc. for supporting the realization of this study.
Conflicts of Interest
Author Fuat Yalçınlı was employed by the company Mosaş Smart Transportation Technologies Inc. The remaining authors declare that the research was conducted in the absence of any commercial or financial relationships that could be construed as a potential conflict of interest.
References
- Miyim, A.M.; Muhammed, M.A. Smart Traffic Management System. In Proceedings of the 2019 15th International Conference on Electronics, Computer and Computation (ICECCO), Abuja, Nigeria, 10–12 December 2019. [Google Scholar] [CrossRef]
- Frank, A.; Khamis Al Aamri, Y.S.; Zayegh, A. IoT Based Smart Traffic Density Control Using Image Processing. In Proceedings of the 2019 4th MEC International Conference on Big Data and Smart City (ICBDSC), Muscat, Oman, 15–16 January 2019. [Google Scholar] [CrossRef]
- Elsagheer Mohamed, S.A.; AlShalfan, K.A. Intelligent traffic management system based on the internet of vehicles (IoV). J. Adv. Transp. 2021, 2021, 4037533. [Google Scholar] [CrossRef]
- Shankaran, S.; Rajendran, L. Real-Time Adaptive Traffic Control System for Smart Cities. In Proceedings of the 2021 International Conference on Computer Communication and Informatics (ICCCI), Coimbatore, India, 27–29 January 2021. [Google Scholar] [CrossRef]
- Yalçınlı, F.; Akdemir, B.; Durdu, A.; Yıldız, Ö. Tam trafik uyarmalı sinyalizasyon sisteminin simülasyon modellemesi ve iyileştirme oranlarının saptanması. Int. J. Adv. Nat. Sci. Eng. Res. 2023, 7, 1–7. [Google Scholar] [CrossRef]
- Genser, A.; Makridis, M.A.; Yang, K.; Ambühl, L.; Menendez, M.; Kouvelas, A. Time-to-green predictions for fully-actuated signal control systems with supervised learning. IEEE Trans. Intell. Transp. Syst. 2024, 25, 7417–7430. [Google Scholar] [CrossRef]
- Ribeiro, I.M.; Simões, M.D.L.D.O. The fully actuated traffic control problem solved by global optimization and complementarity. Eng. Optim. 2015, 48, 199–212. [Google Scholar] [CrossRef]
- Saha, A.; Chandra, S.; Ghosh, I. Delay at signalized intersections under mixed traffic conditions. J. Transp. Eng. Part A Syst. 2017, 143, 04017041. [Google Scholar] [CrossRef]
- Andronov, R.; Leverents, E. Calculation of vehicle delay at signal-controlled intersections with adaptive traffic control algorithm. MATEC Web Conf. 2018, 143, 04008. [Google Scholar] [CrossRef]
- Preethi, P.; Varghese, A.; Ashalatha, R. Modelling delay at signalized intersections under heterogeneous traffic conditions. Transp. Res. Procedia 2016, 17, 529–538. [Google Scholar] [CrossRef]
- Shahpar, A.H.; Aashtiani, H.Z.; Faghri, A. Development of a delay model for unsignalized intersections applicable to traffic assignment. Transp. Plan. Technol. 2011, 34, 497–507. [Google Scholar] [CrossRef]
- Muralidharan, A.; Pedarsani, R.; Varaiya, P. Analysis of fixed-time control. Transp. Res. Part B Methodol. 2015, 73, 81–90. [Google Scholar] [CrossRef]
- Thunig, T.; Scheffler, R.; Strehler, M.; Nagel, K. Optimization and simulation of fixed-time traffic signal control in real-world applications. Procedia Comput. Sci. 2019, 151, 826–833. [Google Scholar] [CrossRef]
- Celtek, S.A.; Durdu, A. A novel adaptive traffic signal control based on cloud/fog/edge computing. Int. J. Intell. Transp. Syst. Res. 2022, 20, 639–650. [Google Scholar] [CrossRef]
- Chen, S.; Sun, D.J. An improved adaptive signal control method for isolated signalized intersection based on dynamic programming. IEEE Intell. Transp. Syst. Mag. 2016, 8, 4–14. [Google Scholar] [CrossRef]
- Zhou, B.; Cao, J.; Wu, H. Adaptive Traffic Light Control of Multiple Intersections in WSN-Based ITS. In Proceedings of the 2011 IEEE 73rd Vehicular Technology Conference (VTC Spring), Budapest, Hungary, 15–18 May 2011. [Google Scholar] [CrossRef]
- Li, D.; Wu, J.; Xu, M.; Wang, Z.; Hu, K. Adaptive traffic signal control model on intersections based on deep reinforcement learning. J. Adv. Transp. 2020, 2020, 6505893. [Google Scholar] [CrossRef]
- Midenet, S.; Boillot, F.; Pierrelée, J.C. Signalized intersection with real-time adaptive control: On-field assessment of CO2 and pollutant emission reduction. Transp. Res. Part D Transp. Environ. 2004, 9, 29–47. [Google Scholar] [CrossRef]
- Wang, Z.; Xu, L.; Ma, J. Carbon dioxide emission reduction-oriented optimal control of traffic signals in mixed traffic flow based on deep reinforcement learning. Sustainability 2023, 15, 16564. [Google Scholar] [CrossRef]
- Bluetooth. Available online: https://www.bluetooth.com/learn-about-bluetooth/ (accessed on 13 June 2024).
- Moghaddam, S.S.; Hellinga, B. Real-time prediction of arterial roadway travel times using data collected by Bluetooth detectors. Transp. Res. Rec. 2014, 2442, 117–128. [Google Scholar] [CrossRef]
- Friesen, M.R.; McLeod, R.D. Bluetooth in intelligent transportation systems: A Surve. Int. J. Intell. Transp. Syst. Res. 2015, 13, 143–153. [Google Scholar] [CrossRef]
- Erkan, İ.; Hastemoglu, H. Bluetooth as a traffic sensor for stream travel time estimation under Bogazici Bosporus conditions in Turkey. J. Mod. Transp. 2016, 24, 207–214. [Google Scholar] [CrossRef]
- Qian, G.; Chung, E. Evaluating Effects of Eco-driving at Traffic Intersections Based on Traffic Micro-simulation. In Proceedings of the 34th Australasian Transport Research Forum, Adelaide, Australia, 28–30 September 2011. [Google Scholar]
- Abedian, S.; Mirsanjari, M.M.; Salmanmahiny, A. Investigating the effect of suburban buses on traffic flow and carbon monoxide emission by Aimsun simulation software. J. Indian Soc. Remote Sens. 2021, 49, 1319–1330. [Google Scholar] [CrossRef]
- Ansariyar, A. Efficiency Improvement at Signalized Intersections: Investigating Smart Green Time Allocation with Two LiDAR Sensors and AIMSUN Microsimulation. Available online: https://www.researchgate.net/publication/375001334_Efficiency_Improvement_at_Signalized_Intersections_Investigating_Smart_Green_Time_Allocation_with_Two_LiDAR_Sensors_and_AIMSUN_Microsimulation?channel=doi&linkId=653acd3d73a2865c7ad3bec4&showFulltext=true (accessed on 1 August 2024).
- Díaz, J.J.V.; González, A.B.R.; Wilby, M.R. Bluetooth traffic monitoring systems for travel time estimation on freeways. IEEE Trans. Intell. Transp. Syst. 2015, 17, 123–132. [Google Scholar] [CrossRef]
- Bachmann, C.; Roorda, M.J.; Abdulhai, B.; Moshiri, B. Fusing a Bluetooth traffic monitoring system with loop detector data for improved freeway traffic speed estimation. J. Intell. Transp. Syst. 2013, 17, 152–164. [Google Scholar] [CrossRef]
- Namaki Araghi, B.; Skoven Pedersen, K.; Tørholm Christensen, L.; Krishnan, R.; Lahrmann, H. Accuracy of travel time estimation using Bluetooth technology: Case study Limfjord tunnel Aalborg. Int. J. Intell. Transp. Syst. Res. 2015, 13, 166–191. [Google Scholar] [CrossRef][Green Version]
- Day, C.M.; Haseman, R.; Premachandra, H.; Brennan, T.M., Jr.; Wasson, J.S.; Sturdevant, J.R.; Bullock, D.M. Visualization and Assessment of Arterial Progression Quality Using High Resolution Signal Event Data and Measured Travel Time. Automated Traffic Signal Performance Measures Workshop. 2016. Available online: https://docs.lib.purdue.edu/atspmw/2016/Posters/1/ (accessed on 1 August 2024).
- Barcelö, J.; Montero, L.; Marqués, L.; Carmona, C. Travel time forecasting and dynamic origin-destination estimation for freeways based on Bluetooth traffic monitoring. Transp. Res. Rec. 2010, 2175, 19–27. [Google Scholar] [CrossRef]
- Saldivar-Carranza, E.D.; Bullock, D.M. Deriving verified vehicle trajectories from LiDAR sensor data to evaluate traffic signal performance. Future Transp. 2024, 4, 765–779. [Google Scholar] [CrossRef]
- Cruz-Piris, L.; Lopez-Carmona, M.A.; Marsa-Maestre, I. Automated optimization of intersections using a genetic algorithm. IEEE Access 2019, 7, 15452–15468. [Google Scholar] [CrossRef]
- Shirvani Shiri, M.J.; Maleki, H.R. Maximum green time settings for traffic-actuated signal control at isolated intersections using fuzzy logic. Int. J. Fuzzy Syst. 2017, 19, 247–256. [Google Scholar] [CrossRef]
- Abbas, M.; Rajasekhar, L.; Gharat, A.; Dunning, J.P. Microscopic modeling of control delay at signalized intersections based on Bluetooth data. J. Intell. Transp. Syst. 2013, 17, 110–122. [Google Scholar] [CrossRef]
- Lee, J.; Park, B. Development and evaluation of a cooperative vehicle intersection control algorithm under the connected vehicles environment. IEEE Trans. Intell. Transp. Syst. 2012, 13, 81–90. [Google Scholar] [CrossRef]
- Zheng, B.; Lin, C.W.; Shiraishi, S.; Zhu, Q. Design and analysis of delay-tolerant intelligent intersection management. ACM Trans. Cyber-Phys. Syst. 2019, 4, 1–27. [Google Scholar] [CrossRef]
- Marisamynathan, S.; Lakshmi, S. Performance analysis of signalized intersection at metropolitan area. J. Adv. Res. Appl. Sci. Eng. Technol. 2020, 2, 19–29. [Google Scholar]
- Yalcinli, F.; Akdemir, B.; Durdu, A. Adaptive traffic management model for signalised intersections. Elektron. Elektrotechnika 2024, 30, 72–82. [Google Scholar] [CrossRef]
- Öztürk, E.A.; Balaban, S. Tam trafik uyarmalı sinyalizasyon sisteminde gecikmede sağlanan iyileşmeler. Kent Akad. 2022, 15, 564–577. [Google Scholar] [CrossRef]
- Calle-Laguna, A.J.; Du, J.; Rakha, H.A. Computing optimum traffic signal cycle length considering vehicle delay and fuel consumption. Transp. Res. Interdiscip. Perspect. 2019, 3, 100021. [Google Scholar] [CrossRef]


Disclaimer/Publisher’s Note: The statements, opinions and data contained in all publications are solely those of the individual author(s) and contributor(s) and not of MDPI and/or the editor(s). MDPI and/or the editor(s) disclaim responsibility for any injury to people or property resulting from any ideas, methods, instructions or products referred to in the content. |
© 2024 by the authors. Licensee MDPI, Basel, Switzerland. This article is an open access article distributed under the terms and conditions of the Creative Commons Attribution (CC BY) license (https://creativecommons.org/licenses/by/4.0/).