Article

Physiological Responses Related to Sitting Comfort Due to Changes in Seat Parameters

1
Institute of Industrial Science, The University of Tokyo, 4-6-1 Komaba, Meguro, Tokyo 153-8505, Japan
2
Department of Computer Engineering, Takushoku University, Tokyo 112-8585, Japan
3
TACHI-S Co., Ltd., Tokyo 198-0025, Japan
4
Department of Mechanical Engineering, Tokyo Institute of Technology, Tokyo 152-8550, Japan
*
Author to whom correspondence should be addressed.
Appl. Sci. 2024, 14(17), 7870; https://doi.org/10.3390/app14177870
Submission received: 31 July 2024 / Revised: 21 August 2024 / Accepted: 2 September 2024 / Published: 4 September 2024
(This article belongs to the Special Issue Seating Comfort and Biomechanical Application)

Abstract

:
The design of vehicle cabin seats is crucial in transportation, as it directly affects the safety and comfort of both drivers and passengers. To design seat parameters that enhance sitting comfort, a quantitative evaluation of sitting comfort involving an understanding of users’ physiological responses is necessary. This study aimed to assess users’ physiological responses to relaxation induced by changes in seat parameters using electroencephalography and electrocardiography. We examined the physiological responses and subjective evaluations of relaxation in fifteen participants, focusing on the effects of reclining, ottoman, and slab. The results demonstrated an improvement in the subjective level of relaxation with changes in all seat parameters set here. However, central nervous system responses and autonomic nervous system reactions varied based on alterations in posture angles and seat pressure distributions. This underscores the importance of physiological markers, encompassing indicators of autonomic and central nervous system responses, in evaluating relaxation in relation to changes in posture angles and seat pressure distribution.

1. Introduction

The interior of an automobile encompasses various environmental factors, including interior design, visibility for users, sound levels, thermal conditions, and seating. These environmental factors have been shown to impact the mental and physical state of the users [1,2,3]. Therefore, it is crucial to adequately control and design these factors to ensure safety and comfort within the vehicle cabin. Among these environmental factors, the seat, which directly interfaces with the user’s body, significantly influences tactile sensation and posture. It is considered a critical element strongly associated with user comfort. Sitting comfort is a primary research focus in the field of ergonomics, and it has been the subject of numerous studies. Furthermore, the demand for sitting comfort improvements is expected to grow as the number of passenger transport options increases in recent years.
The elements of sitting comfort can be divided into discomfort related to stiffness, numbness, soreness, and pain due to physical constraints, as well as comfort arising from feelings of well-being, space, and relaxation. The authors of [4,5] established the model of sitting comfort and discomfort, considering the interaction between the seat, the human, and the contextual factors. The combination of these seat, human, and contextual characteristics determines the physical constraints and influences the perception of sitting comfort and discomfort [6]. Regarding the relationship between human and contextual characteristics, several studies have investigated the effects of anthropometric factors such as gender, age, and BMI on passenger posture and movement [7,8,9,10]. Concerning the relationship between human and seat characteristics, research has explored the effects of anthropometry on indices related to seat pressure, including mean pressure, peak pressure, and contact area [11,12,13,14].
On the other hand, the effects of physical factors related to humans and seats on comfort and discomfort have been studied. Fasulo et al. [15] investigated the relationships between body movements, the center of pressure on the seat, and seat comfort using subjective evaluations related to sensations in different body parts. Carcone and Keir [16] explored the relationships between the contact area of the backrest, peak pressure on the backrest, and the ranking of backrest comfort. De Carvalho and Callaghan [17] examined subjective discomfort and spine posture during prolonged simulated driving with a self-selected amount of lumbar support.
In the studies mentioned above, the sitting comfort of users was primarily evaluated using subjective assessments of passengers’ physical and mental states, such as fatigue, comfort, and discomfort for various body parts. However, to establish design requirements for further enhancing sitting comfort, a method that allows for quantitative comfort evaluation is required. Analyzing bio-signals can provide a solution for the quantitative evaluation. Physiological measures, such as alterations in heart rate and brain function, have been recognized as concrete ways to gauge stress levels. These measurements provide additional evidence supporting results obtained from subjective evaluation [18]. Humans receive stimuli from the external environment, and these stimuli are transmitted to the brain through the sensory receptors. Psychological and physiological responses occur as the central nervous system processes these stimuli. Physiological responses also occur in reaction to activities of central nervous system. Motor organs may be activated as directed by the central nervous system. When it comes to sitting, the shape and stiffness of the seat and the way a person sits determine posture angles and the pressure exerted on the body. These stimuli trigger physiological and psychological responses, such as the feeling of well-being, relaxation, and discomfort, which in turn lead to further physiological responses. The flow of this physiological response process is depicted in Figure 1, reconstructed from the previous study [19].
For fatigue, several studies have focused on the reactions of the autonomic nervous system within the human body. Gyi and Porter [20]; Kolich and Taboun [21]; and Hirao et al. [22] have explored the relationship between posture angles, seat pressure distribution, and subjective evaluations using various parameters that constitute the seat, including studies on fatigue resulting from prolonged sitting. However, it is considered that there is still insufficient research on methods for evaluating the level of relaxation and positive comfort related to sitting comfort. Sitting comfort is considered to be influenced by higher-order-information-processing processes, such as relaxation, well-being, and psychosocial factors, as demonstrated in the previous study [6]. Therefore, it is necessary to assess the reactions not only of the autonomic nervous system but also of the central nervous system.
Based on the above consideration, the purpose of this study was to seek for a method for quantitatively evaluating relaxation while seated to further enhance sitting comfort. As a fundamental investigation, we examined the relationship between seat pressure characteristics and physiological indices that represent the activity of the human nervous system in response to changes in seat parameters. The psycho-physiological approach described previously was employed to test the hypothesis that the relaxation induced by alterations in seat parameters can be assessed using indicators of both the autonomic and central nervous systems, and that these indicators operate independently of each other. We measured the posture angle of users and the seat pressure distribution on the backrest and seat pan as the physical state of the human. Electroencephalograms (EEG) and electrocardiograms (ECGs) were conducted to investigate the physiological responses of the central nervous system and the autonomic nervous system, respectively.

2. Materials and Methods

2.1. Participants

Eleven males (29.5 y (S.D. = 9.2), 172.8 cm (S.D. = 4.2), 62.6 kg (S.D. = 6.7), body mass index (BMI): 20.9 (S.D. = 1.9)) and four females (35.0 y (S.D. = 8.8), 163.5 cm (S.D. = 5.8), 51.5 kg (S.D. = 4.4), BMI: 19.2 (S.D. = 0.7)) participated in the experiment. The participants were asked to refrain from intense exercise the day before the experiment and to avoid consuming caffeine and alcohol prior to the experiment.

2.2. Seat Conditions

To investigate the effects of postural angles and tactile changes on physiological and psychological states, four types of seating conditions were established as experimental conditions: Neutral, Reclining, Ottoman (Reclining state with ottoman), and Slab (Neutral state with slab urethane), as shown in Figure 2. The seat used in this study was a standard car seat manufactured by Tachi-S Co., Ltd. (Tokyo, Japan). In the experiment, the Neutral state was defined as the default position of a typical car seat, with a torso angle set at 25°. The angle between the seat pan and the ground was approximately 10°. Utilizing the reclining function commonly found in car seats, we established the Reclining state, in which the torso angle was reclined by an additional 12° from the Neutral state, resulting in a torso angle of 37°. Additionally, assuming usage in the passenger seat rather than the driver’s seat, an ottoman (a footrest supporting the legs from the calves) was included as an experimental condition. For the Ottoman state, the knee joint angle was increased by approximately 45° compared to the position where the feet remain on the floor. This condition was designed to investigate changes in physiological and psychological states due to improved blood flow in the lower limbs and reduced peak seating pressure on the hips. Furthermore, to examine the response to changes in the softness of the backrest rather than changes in posture angles, we established the Slab state. In this condition, a slab of urethane material was placed over the backrest, aiming to increase the contact area and reduce peak pressure.

2.3. Measurement

2.3.1. Musculoskeletal States

Markers were attached to the side of the head, shoulder, hip, knee, and ankle to measure participants’ joint angles for postural assessment. The neck-horizontal angle, torso angle, hip angle, knee angle, and foot-horizontal angle were determined based on images captured from the side using a camera. Additionally, to assess pressure distribution, pressure sensors (PX100, X SENSOR Technology Co., Calgary, AB, Canada) were mounted on the backrest (52 cm in width, 60 cm in length) and the seat pan (49 cm in width, 50 cm in length), and seat pressure distribution was recorded. As shown in Figure 3, the measurement area was divided into seven sections on the backrest and seven sections on the seat pan, with peak pressure and contact area calculated for each section.

2.3.2. Physiological States

Electroencephalograms (EEG) were recorded to calculate indices reflecting central nervous system activity using a 32-channel Brain Vision System (Brain Products GmbH, Hohenbrunn, Germany) with active electrodes based on the international 10/20 system [23]. Specifically, measurements were taken from regions of the frontal lobe (F3, Fz, F4) associated with information integration, the central region (C3, Cz, C4) related to somatosensation, and the parietal lobe (P3, Pz, P4) related to spatial information processing at a sampling frequency of 500 Hz. Artifacts derived from eye movements, muscle activity, and heartbeat [24,25] were removed using the EEGLAB program 2021.1, a MATLAB toolbox (version: 2021.1, [26]), and the Fast Fourier Transform (FFT) was performed. Subsequently, the power spectral density of theta (θ, 4~8 Hz), alpha (α, 8~13 Hz), and beta (β, 13~30 Hz) waves in the measured channels was computed, and the degree of central nervous inactivity (θ + α)/β [3,27,28] was determined for each region.
To compute indices reflecting autonomic nervous system activity, electrocardiograms (ECGs) and respiration rates were measured at a sampling rate of 1000 Hz using sensors (Biosignalplux, PLUX wireless biosignals S.A., Lisbon, Portugal). The R wave was detected by a MATLAB program from the ECG waveform, and the time series of the R wave interval (RRI) and the average of RRI was calculated. Furthermore, the power spectral density of the very-low-frequency (VLF, 0.001–0.04 Hz), low-frequency (LF, 0.04–0.15 Hz), and high-frequency (HF, 0.15–0.45 Hz) bands was extracted from the RRI time series using the FFT. For the HF component, the influence of respiratory variability was removed based on respiratory frequency data, the LF/HF value was calculated as an index of sympathetic activity, and the HF content was calculated as an index reflecting parasympathetic activity [29].

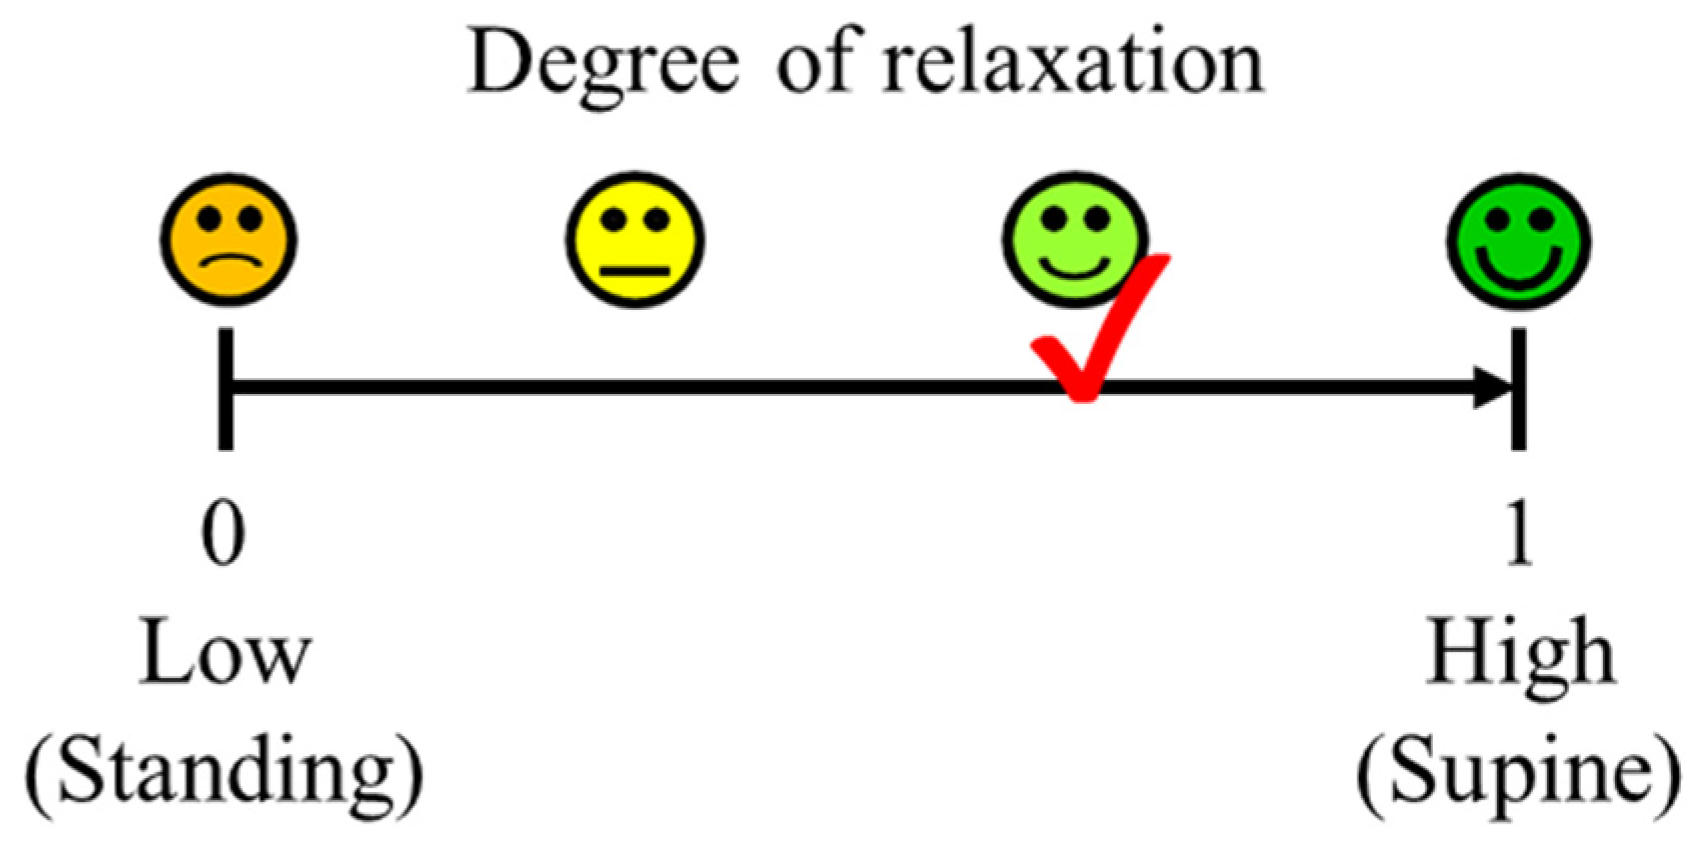
2.3.3. Questionnaire for Relaxation

To assess the psychological state related to sitting comfort, participants were instructed to rate the level of relaxation for each condition using a visual analog scale, with the standing position designated as 0 and the supine position designated as 1. The participants were asked to mark their responses on the questionnaire sheet using the scale shown in Figure 4, after the physiological measurements.

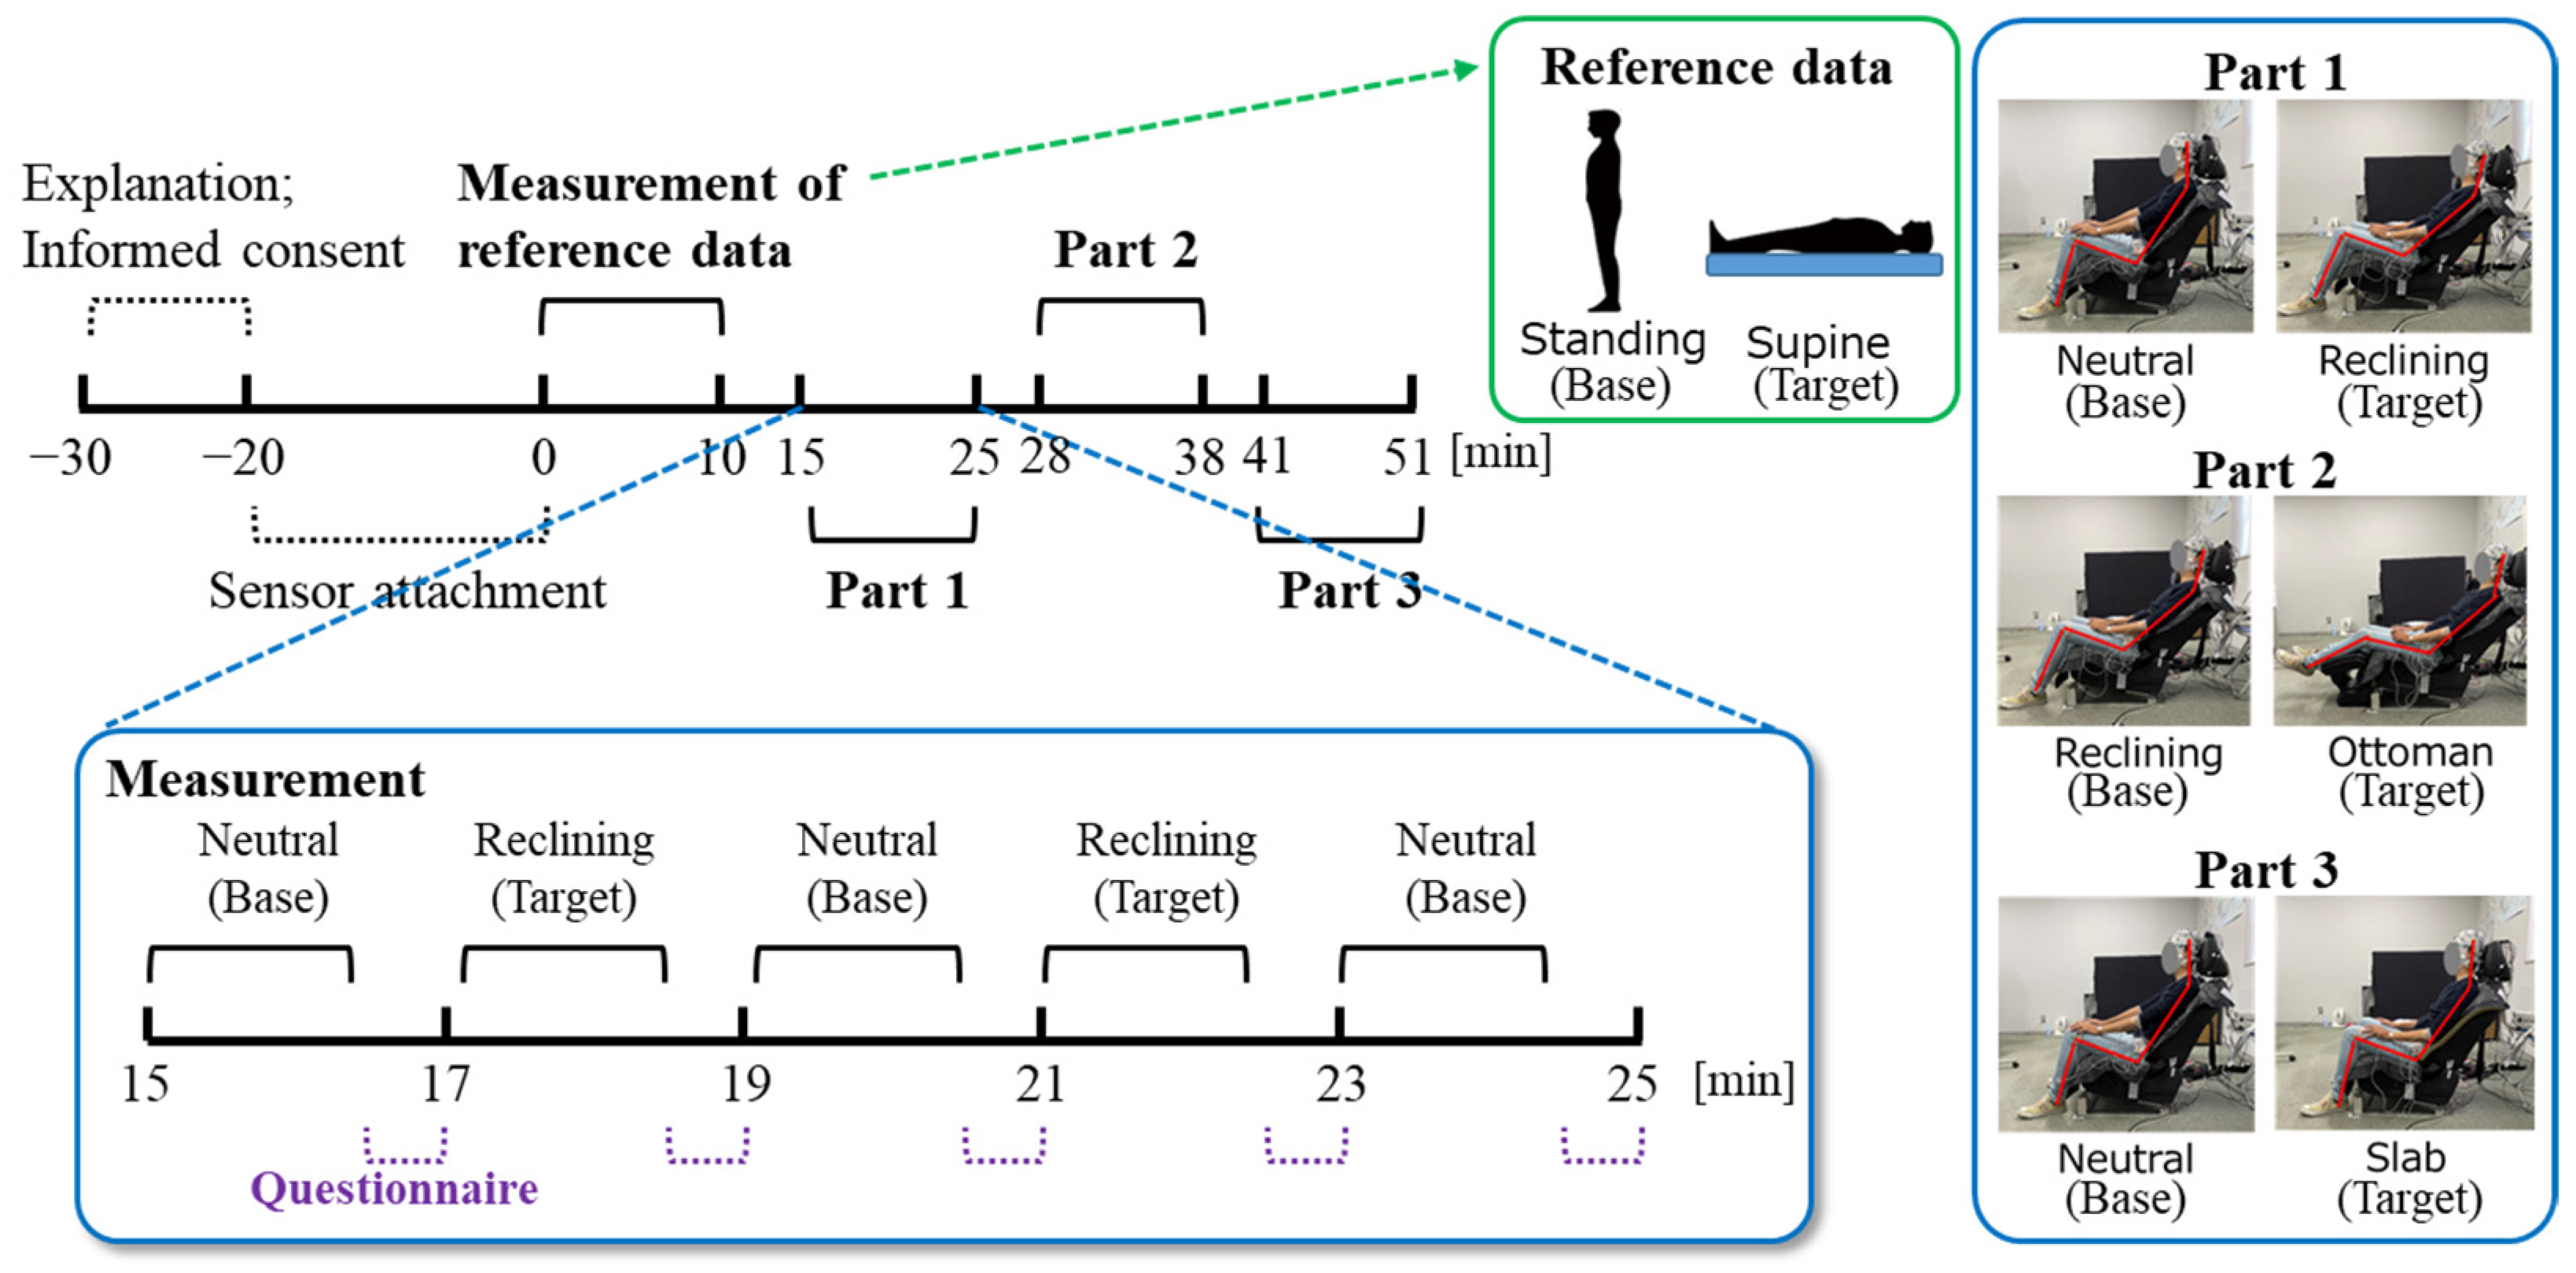
2.4. Experimental Procedure
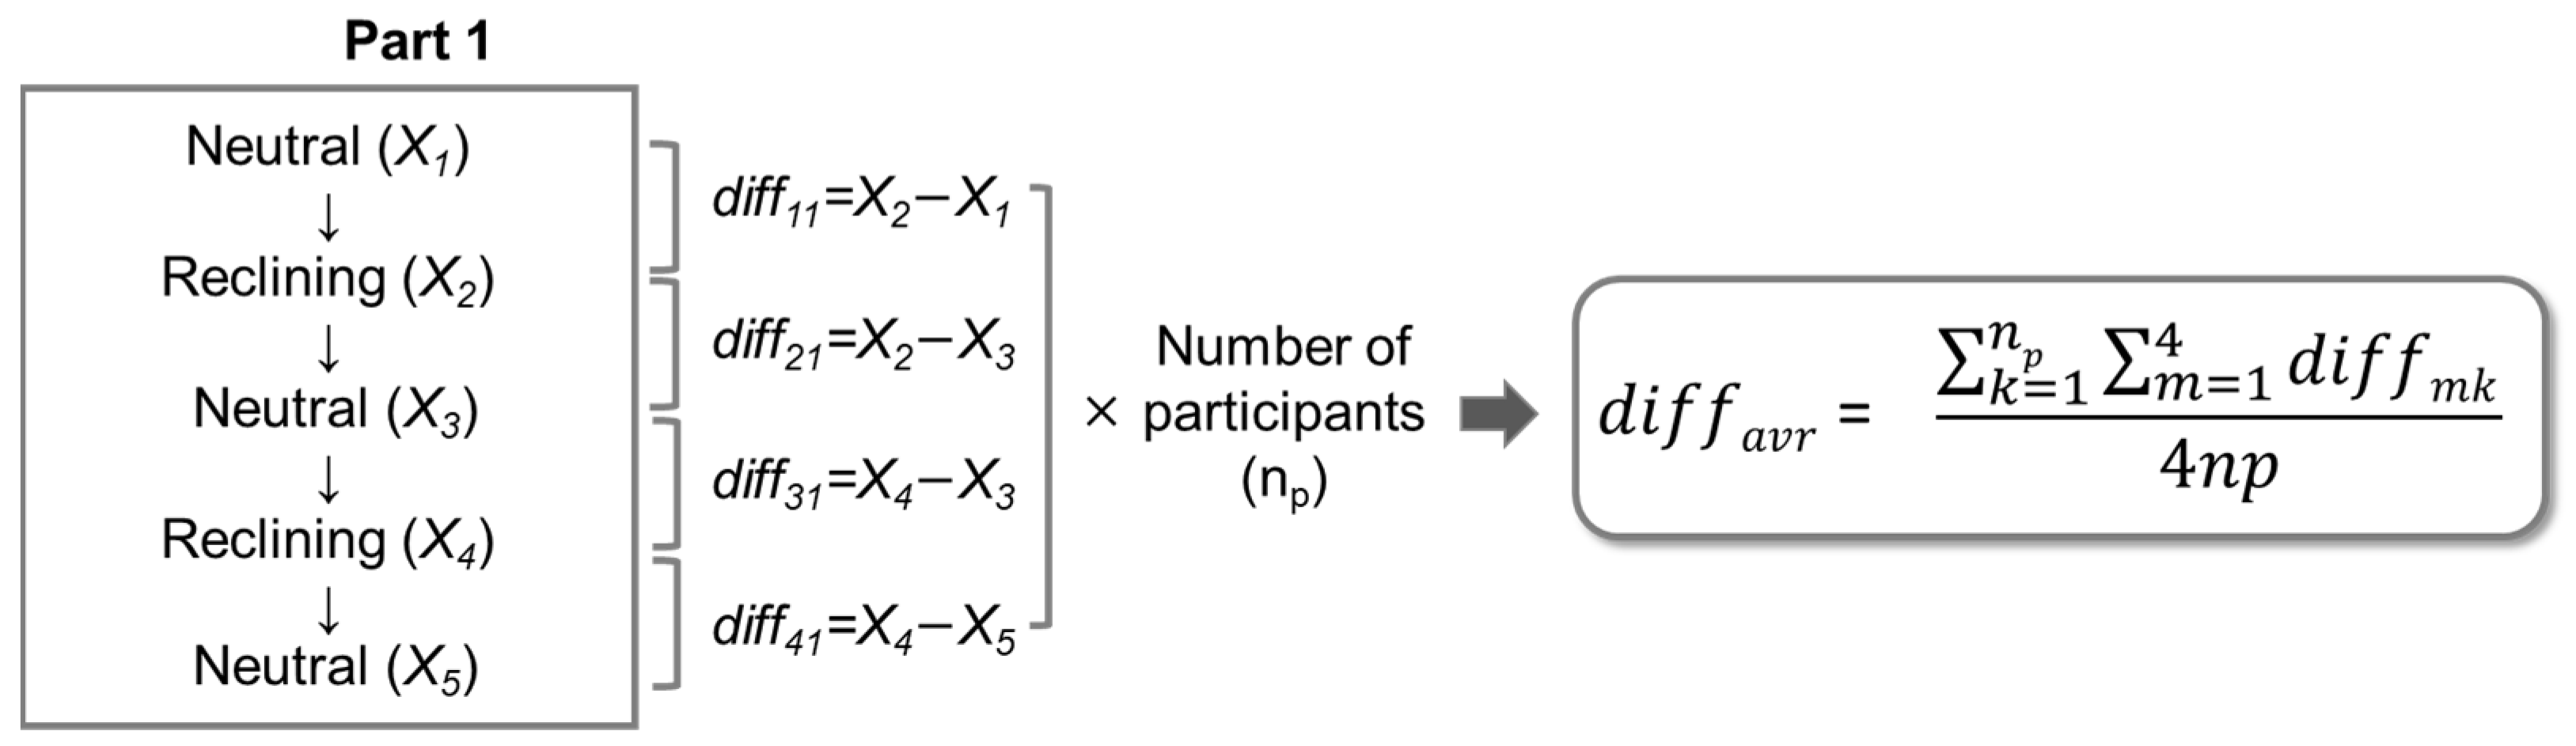
The experiment commenced after explaining the experiment’s details to the participants and obtaining their informed consent. Initially, physiological responses during the standing and supine positions were recorded three times to establish reference data. The duration of measurement in the standing and supine positions was 90 s each. To assess the impact of changes in seat parameters on physiological responses, the experimental procedure was divided into three parts: Neutral and Reclining (Part 1), Reclining and Reclining with Ottoman (Part 2), and Neutral and Slab (Part 3), with the base and target conditions set accordingly in each part. Physiological measurements were conducted for 90 s, followed by a subjective evaluation of the level of relaxation. The seat parameters were first set to the base condition, and then the conditions were alternated between the target and base conditions four times in each part. The experimental procedure is shown in Figure 5.

2.5. Data Analysis

Using the physiological indices calculated from the 90 s measurements in each condition, the difference in physiological indices between the altered conditions was calculated as shown in Figure 6. To assess significant differences in physiological responses related to changes in seat parameters, Student’s one-sample t-test was conducted using the values of differences in physiological indices.

3. Results

3.1. Spine Posture

The results of postural angles are summarized in Table 1. One-way ANOVAs were performed for the postural angles, revealing a significant main effect of the seat condition. A post hoc test (multiple comparison test using the Bonferroni method) showed that the neck-horizontal angle in the Reclining state was significantly smaller than that in the Neutral state (p < 0.001), and that the torso and hip angle in the Reclining state was significantly larger than that in a Neutral state (p < 0.001). The test also demonstrated that the knee angle in the Ottoman state was significantly larger than that in the other states (p < 0.001), and that the foot-horizontal angle in the Ottoman state was significantly smaller than that in the other states (p < 0.001).

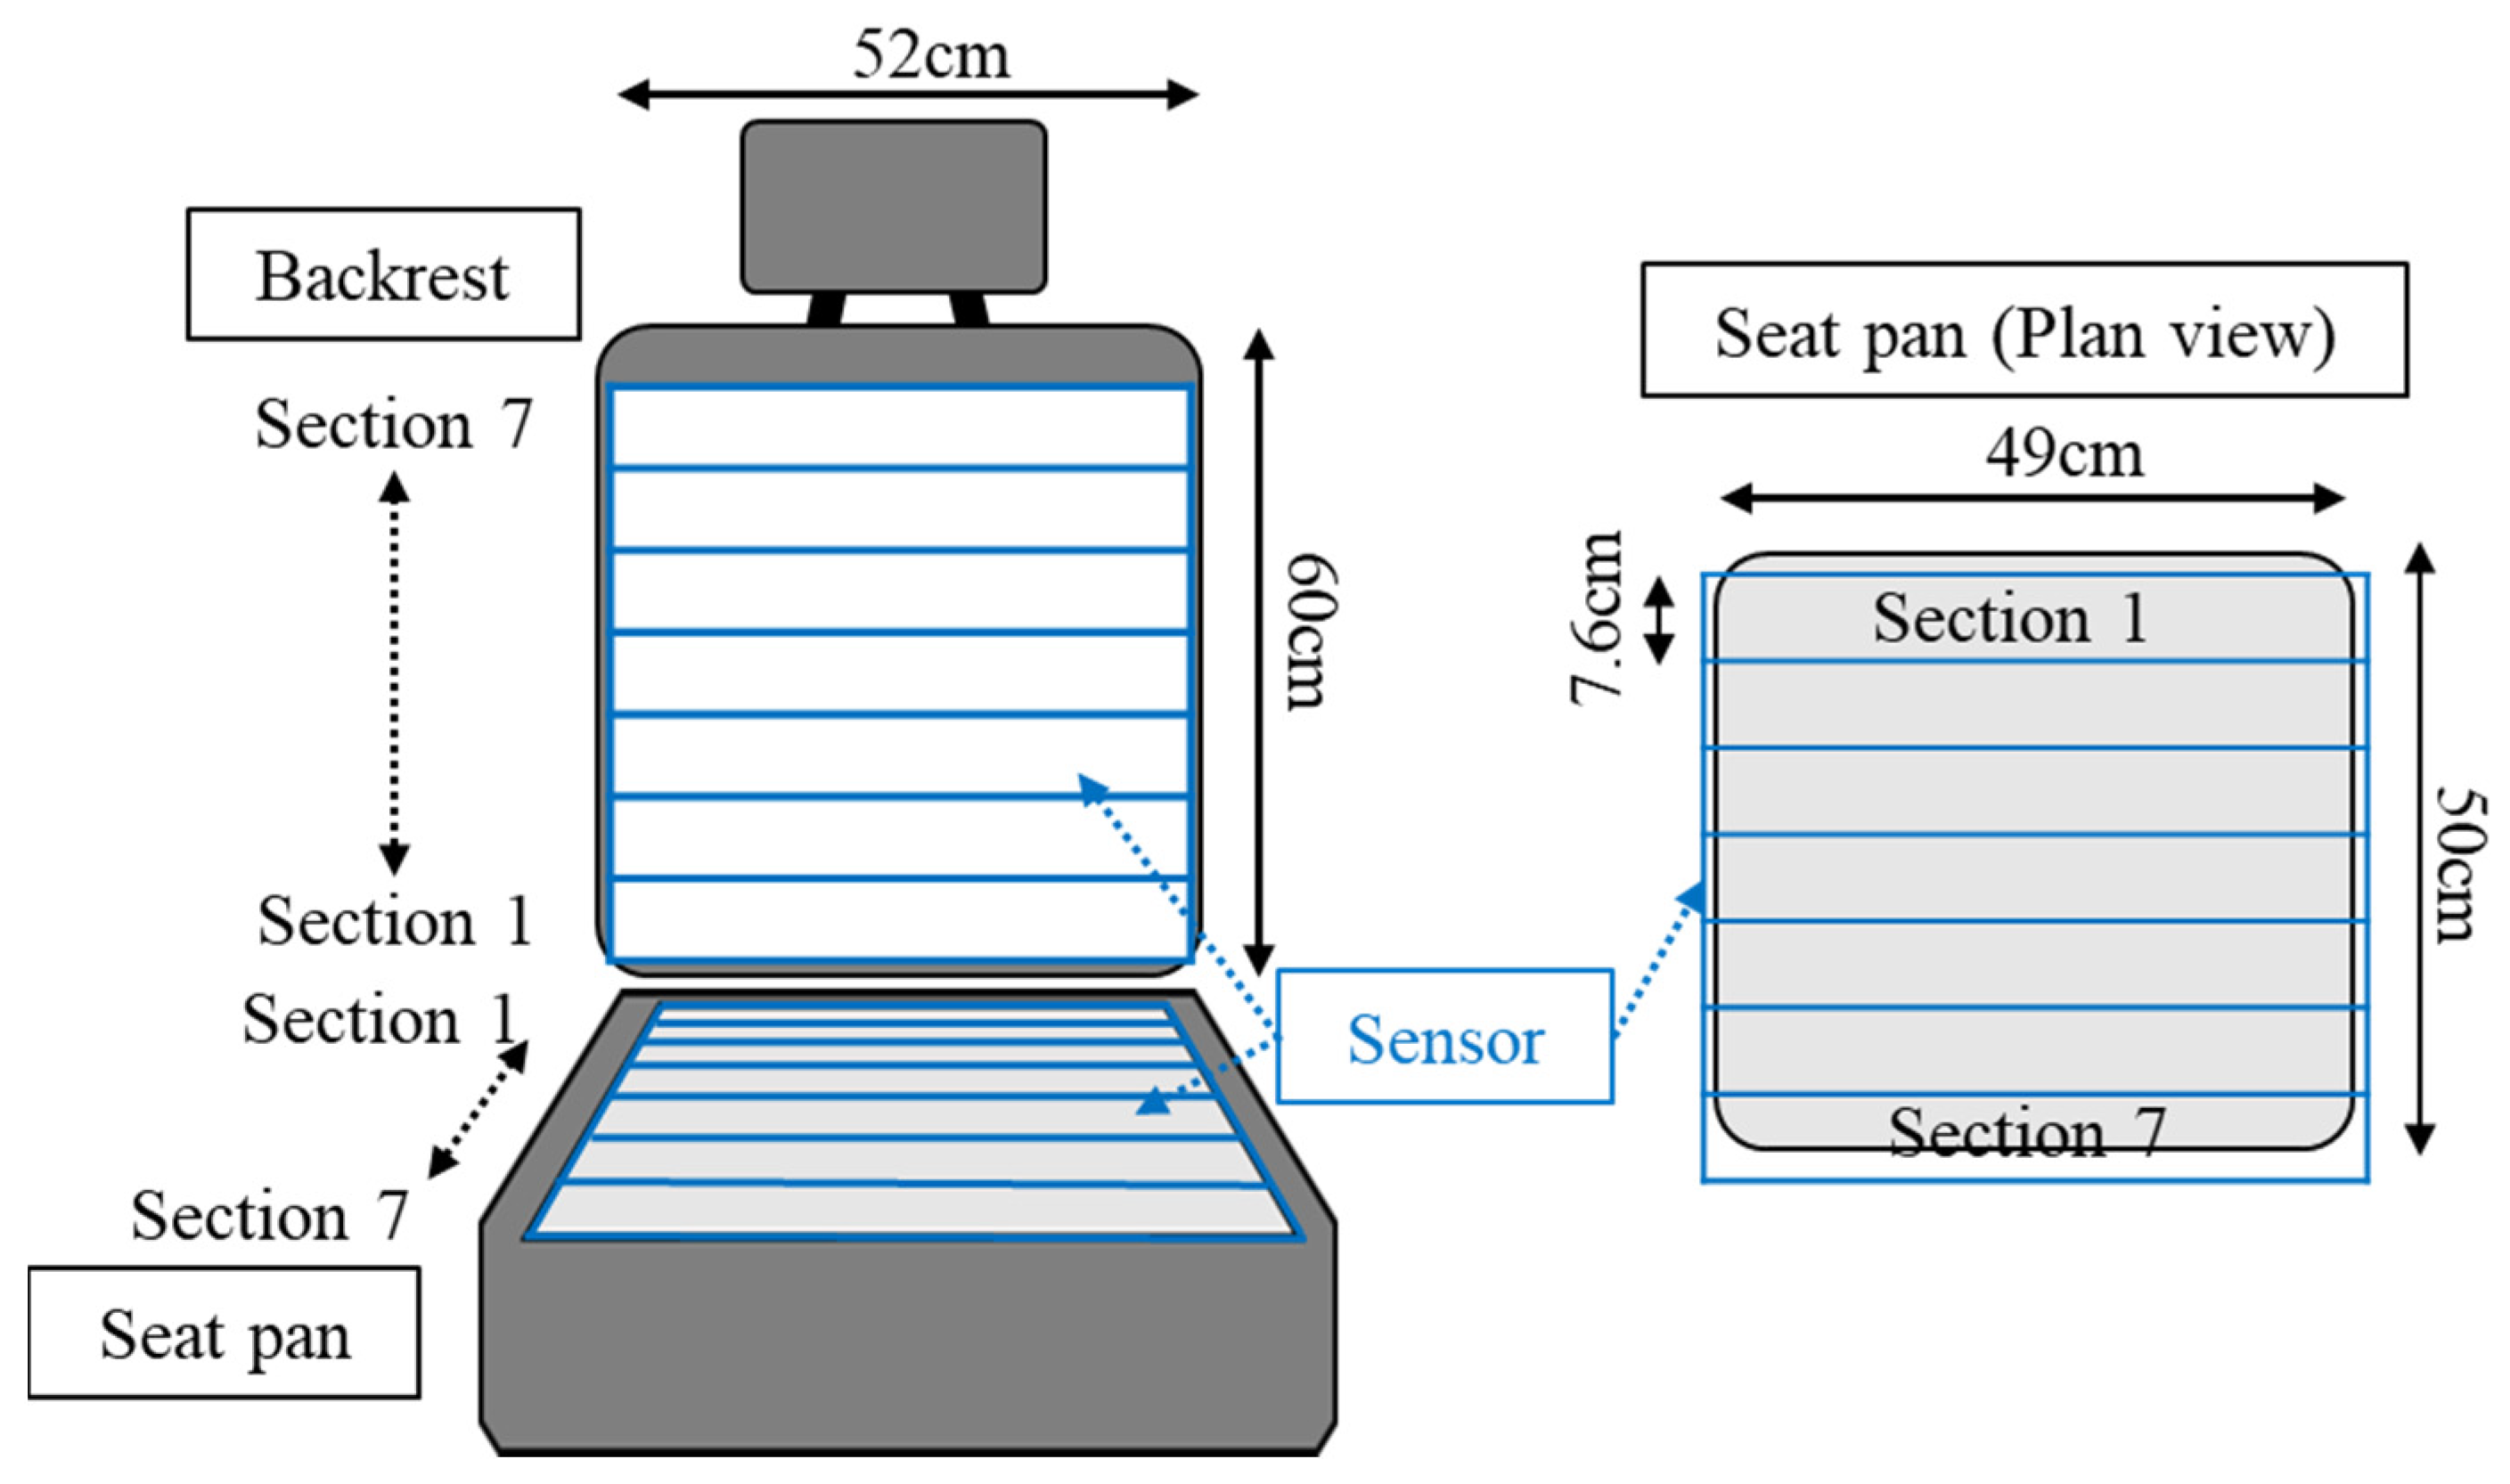
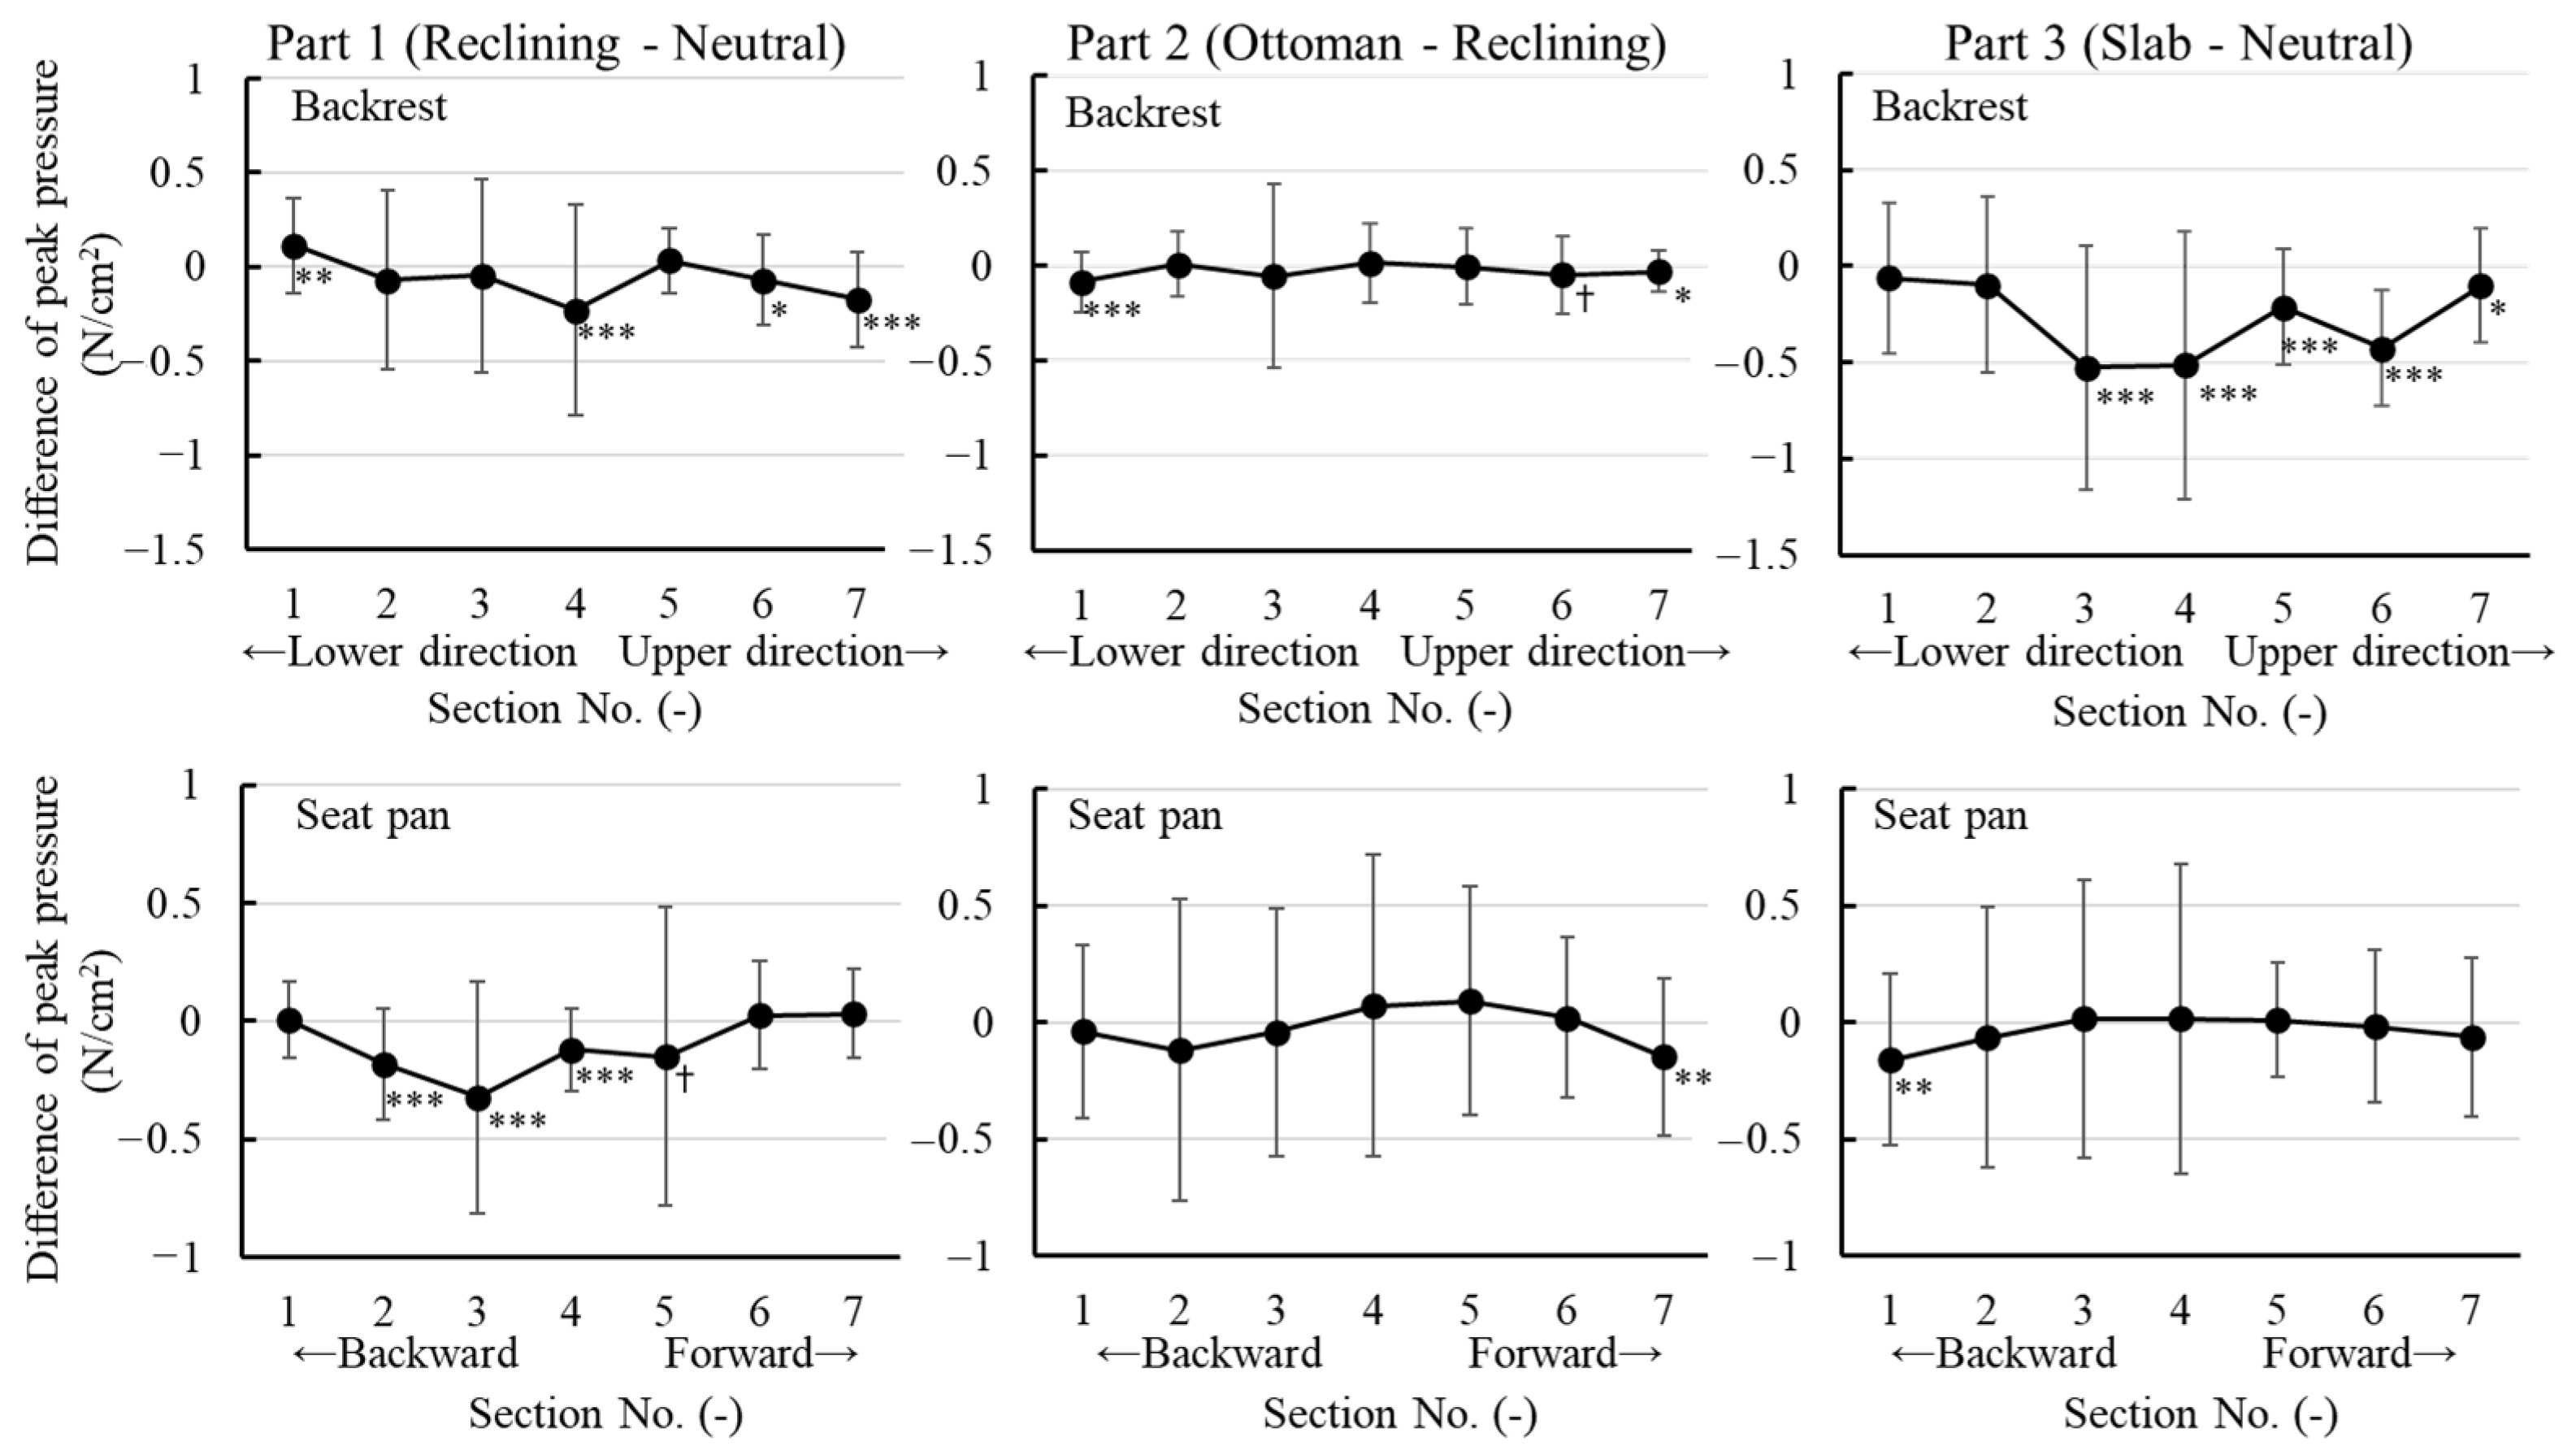
3.2. Pressure Variables

The results of differences in peak pressure of each section are shown in Figure 7. In Part 1 (Reclining-Neutral), a one-sample t-test revealed that the peak pressure on the middle and upper sections of the backrest was significantly decreased, while that on the lower section was significantly increased. The peak pressure on the middle and backward zones of the seat pan was significantly decreased due to reclining. In Part 2 (Ottoman-Reclining), the peak pressure on the lower and upper sections of the backrest was significantly decreased. The peak pressure on the forward zones of the seat pan was significantly decreased due to the ottoman. In Part 3 (Slab-Neutral), the peak pressure on the middle and upper sections of the backrest was significantly decreased. The peak pressure on the backward zone of the seat pan was significantly decreased due to the slab.
The results of differences in the contact area of the backrest and seat pan in each part are shown in Figure 8. In Part 1 (Reclining-Neutral), a one-sample t-test revealed that the contact area on the lower and middle sections of the backrest was significantly increased, while that on the upper section was significantly decreased. The contact area on the backward and middle zones of the seat pan was significantly decreased, but that on the forward zones was significantly increased due to reclining. In Part 2 (Ottoman-Reclining), the contact area on the lower section of the backrest was significantly decreased. The contact area on the backward zones of the seat pan was significantly decreased, but that on the forward zones was significantly increased due to the ottoman. In Part 3 (Slab-Neutral), the contact area on all sections of the backrest was significantly increased. The contact area on the backward zones of the seat pan was significantly decreased due to the slab.

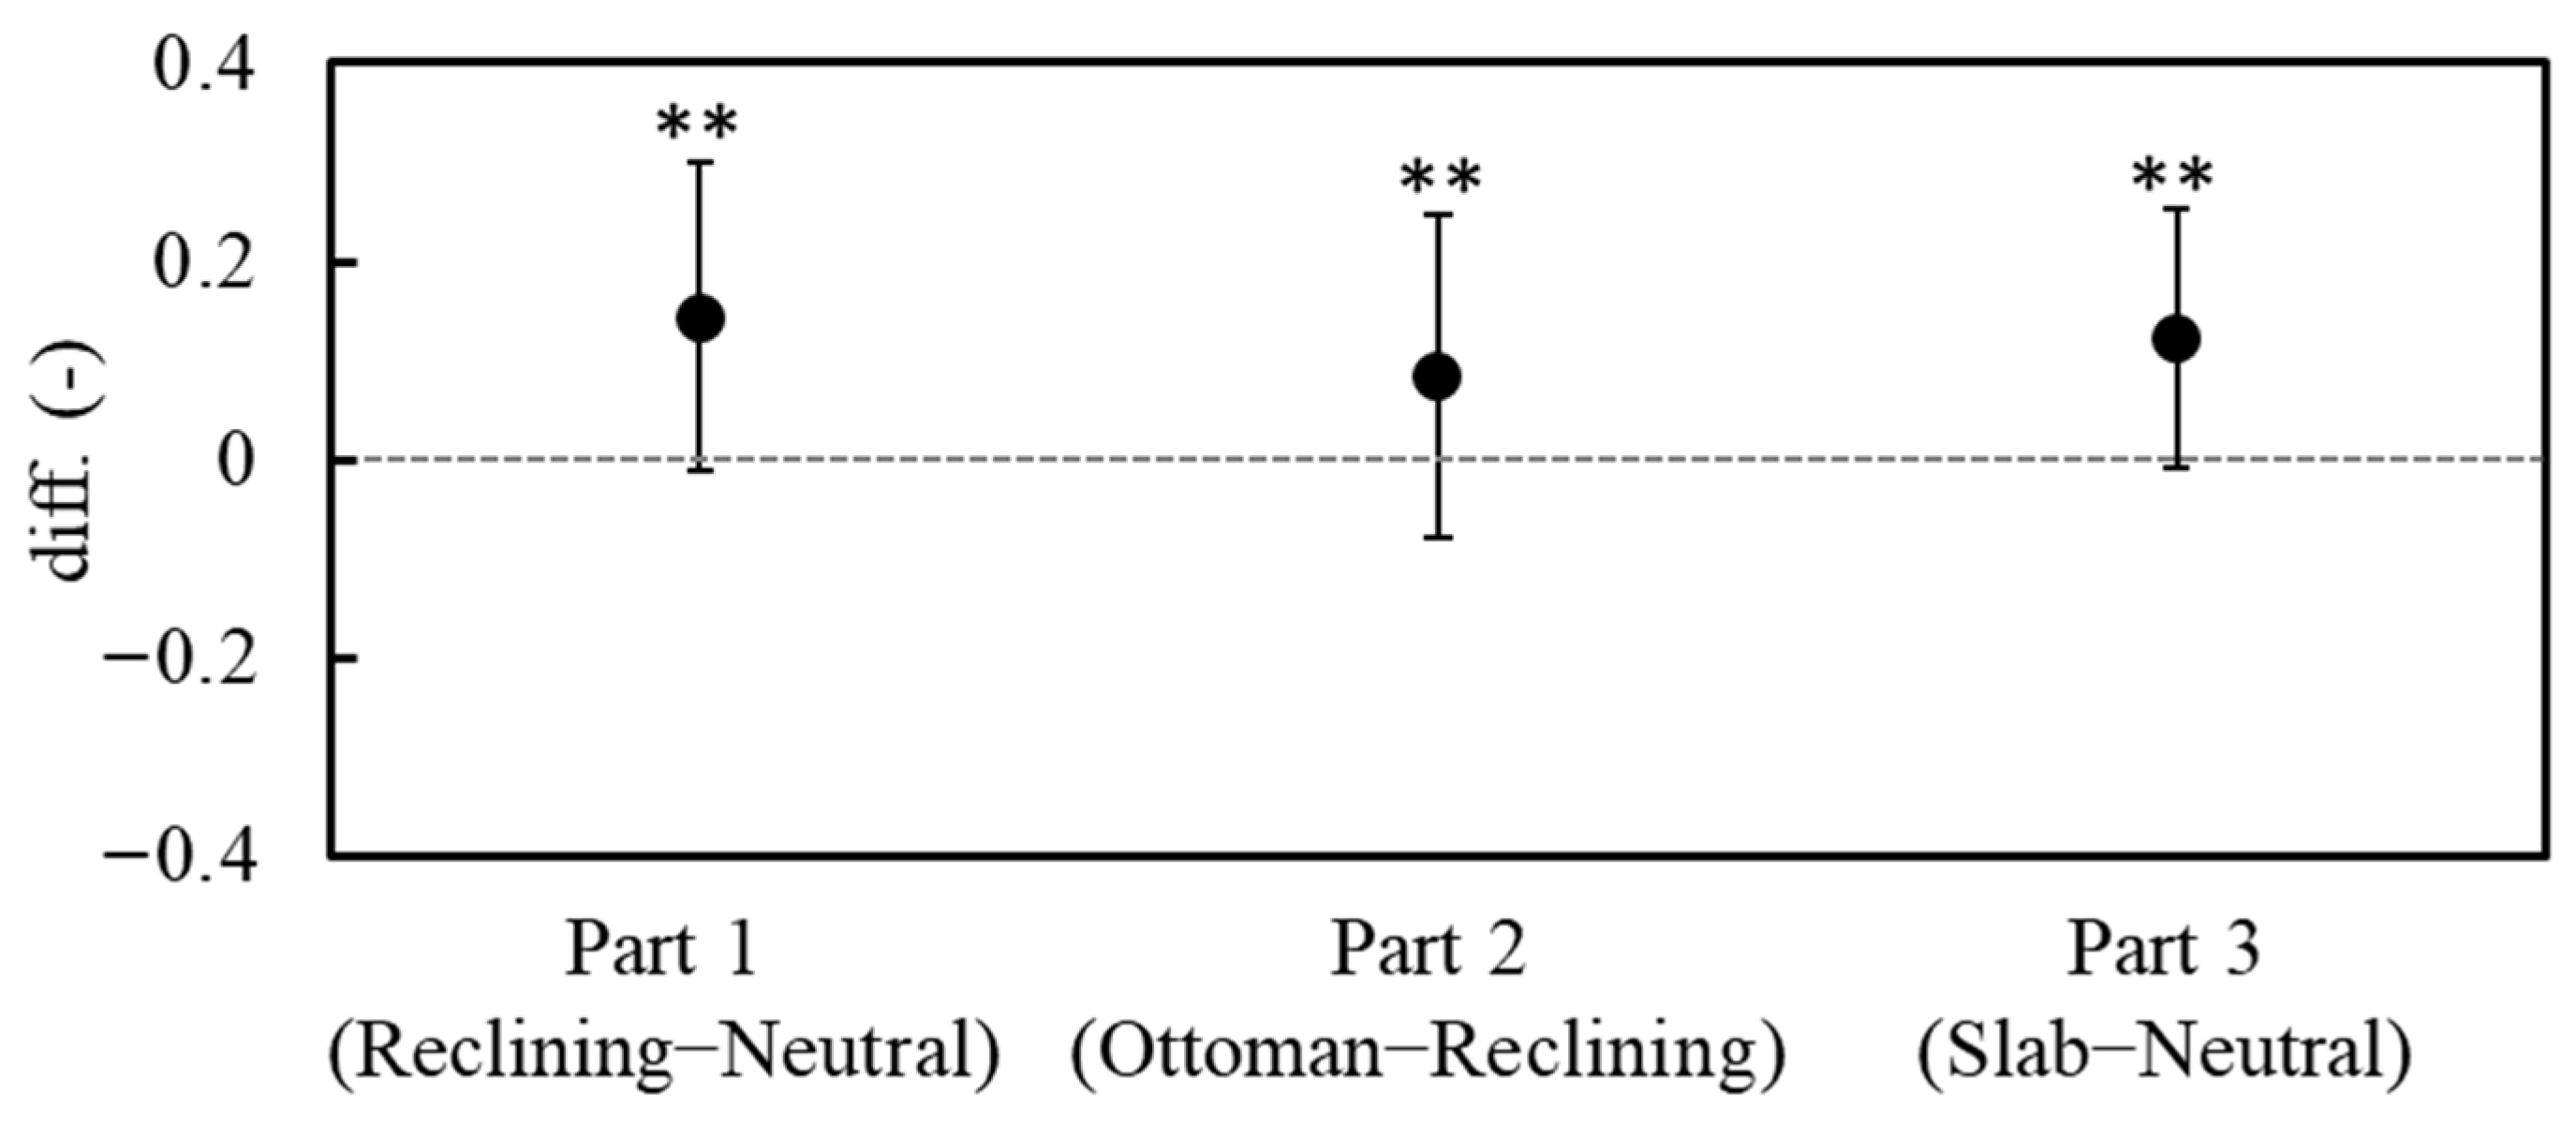
3.3. Subjective Evaluation for Relaxation

After calculating the VAS values for each trial from the questionnaire results, the average of the differences when changing the conditions was calculated. The results of differences in the subjective evaluation value for relaxation are shown in Figure 9. A one-sample t-test revealed that the relaxation value in the target conditions (Reclining, Ottoman, and Slab) was significantly higher than that in the base conditions in all parts (p < 0.01).

3.4. Physiological Responses

The values of differences in physiological indices and the results of the statistical analysis in each part are summarized in Table 2. Regarding changes between the supine and standing positions, a one-sample t-test revealed that the values of (θ + α)/β in the central and peripheral lobes were significantly increased by the supine position, along with a significant increase in RRI and HF content, and a significant decrease in LF/HF. In Part 1 (Reclining-Neutral), the RRI significantly increased, while the respiration rate significantly decreased. There were no significant differences in the indices related to EEGs due to reclining. In Part 2 (Ottoman-Reclining), the values of (θ + α)/β in the central lobe were significantly decreased. Additionally, there was a significant increase in RRI and HF content, and a decrease in LF/HF due to the ottoman. In Part 3 (Slab-Neutral), there was a marginally significant increase in the values of (θ + α)/β in the central and peripheral lobe due to the slab, but there were no significant differences in the indices related to ECGs and the respiration rate.

4. Discussion

The current study examined the relationship between seat pressure characteristics and physiological indices representing the reaction of the human nervous system in response to changes in several seat parameters. Indices calculated from EEGs and ECGs were used to investigate the activity of the central and autonomic nervous system in response to the influences of Reclining, Ottoman, and Slab as target conditions. Significant differences in brain activity and heart rate variability indices were found when comparing the control and target conditions. Although subjective ratings of relaxation were significantly higher in all target conditions compared to the base conditions, the specific physiological indices with significant differences varied for each condition.
In terms of seat pressure distribution, significant differences were observed in peak pressure and contact area for all conditions tested in this study. Specifically, reclining increased the contact area of the backrest while decreasing peak pressure on the seat pan. This similar trend of reduced peak pressure on the seat pan due to reclining aligns with the findings of Aissaoui et al. [30]. Using the ottoman reduced peak pressure on the front side of the seat pan, and the slab increased the contact area of the backrest while also reducing peak pressure. These relationships, combined with changes in joint angles, are believed to have triggered psychological and physiological responses, leading to changes in various indices.
As for the central nervous system response, the results from the reference data (Supine-Standing) indicated a significant increase in the values of (θ + α)/β in the central and parietal lobes during the supine position. This suggests that the supine position may induce a relaxation response in the central nervous activity across various brain regions. Similar brain responses were observed during the use of the slab, as demonstrated in Part 3 (Slab-Neutral). Conversely, reclining had no discernible effect on the differences in the value of (θ + α)/β in the central and parietal lobes, as shown in Part 1 (Reclining-Neutral). Moreover, the values of (θ + α)/β in the central and parietal lobes decreased due to the ottoman. This indicates that the ottoman led to an activation of brain activity, contrary to the effects observed in the supine position and with the slab. Among the various brain activities, central and parietal lobe activity is associated with motor function and somatosensory processing [31,32]. Therefore, the activation of brain response by the ottoman was likely attributed to pressure on the lower extremities, especially the calves. Furthermore, it can be inferred that the slab increased the contact area of the user’s back region and distributed the pressure, resulting in reduced peak pressure on the back and a subsequent decrease in central brain activity.
As for the autonomic nervous system response, the results from the reference data (Supine-Standing) indicated a significant increase in RRI and HF content, along with a significant decrease in LF/HF during the supine position, which aligns with findings from related studies [33,34]. This suggests that the supine position may elicit parasympathetic activity as part of the regulatory mechanism for maintaining circulatory balance [34]. Both reclining and using the ottoman also led to increase in RRI, although to a lesser extent compared to the supine position. Furthermore, reclining led to decrease in the respiration rate. However, the slab had no significant influence on autonomic activities. These findings suggest that autonomic activity may be more influenced by joint angle and postural angle relative to the ground than by pressure distribution on the user’s body.
Our findings have important implications for the evaluation of relaxation and seat design. In general, when people experience relaxation, theta and alpha waves in brain activity increase, while beta waves decrease [35,36]. Additionally, it is known that parasympathetic nervous activity becomes more dominant than sympathetic activity during relaxation [19,37,38]. The present study suggests that even when users experience an overall sense of relaxation due to changes in seat parameters, brain activity, and autonomic activity function independently depending on whether it is a result of tactile stimulation to the body or a change in the body’s postural angle. Therefore, it has become evident that comprehensive evaluation of both the user’s central nervous system activity and autonomic nervous system activity is necessary when designing seat parameters to enhance the user’s level of relaxation.
The restricted physical condition of participants is one of the limitations of this study. Differences in the participants’ physical characteristics, such as height, weight, and body mass index, could potentially lead to variations in seat pressure distribution and posture angles, even when the same seat parameters are applied. These variations, in turn, may result in changes in autonomic and brain activity. Moreover, the present study was limited in terms of the number of seat parameters examined. To address these limitations, future studies should consider the user’s physical condition as a factor and investigate the effects of additional parameters, such as armrests, backrest folds, and combination of those parameters.

5. Conclusions

To search for a method to quantitatively evaluate relaxation to further enhance sitting comfort, we investigated the effects of varying seat parameters on pressure distribution, subjective relaxation ratings, and physiological responses. The results revealed that autonomic activities were influenced by joint angle and postural angle, whereas brain activities were influenced by pressure distribution when users felt relaxed due to alterations in seat parameters. This suggests that the indicators of autonomic and central nervous system responses are valuable for assessing relaxation resulting from changes in postural angle and pressure distribution independently. In future studies, it is imperative to explore the impact of the users’ physical conditions and additional seat parameters on physiological responses to establish a methodology for evaluating relaxation and seat design.

Author Contributions

Conceptualization, J.G. and Y.S.; methodology, J.G., K.A., T.Y., and H.T.; software, J.G. and K.A.; validation, J.G., K.A., T.Y., and H.T.; formal analysis, J.G.; investigation, J.G., K.A., T.Y., and H.T.; resources, K.A., T.Y., H.T., M.S., and Y.S.; data curation, J.G.; writing—original draft preparation, J.G.; writing—review and editing, J.G., K.A., T.Y., H.T., M.S., and Y.S.; visualization, J.G.; supervision, Y.S.; project administration, Y.S.; funding acquisition, Y.S. All authors have read and agreed to the published version of the manuscript.

Funding

This research was funded by TACHI-S Co., Ltd., Tokyo, Japan.

Institutional Review Board Statement

The study was conducted in accordance with the Declaration of Helsinki and approved by the Ethics Committee of the Office for Life Science Research Ethics and Safety of the University of Tokyo (approval code: 22-304, 16 November 2022).

Informed Consent Statement

Informed consent was obtained from all subjects involved in the study.

Data Availability Statement

The datasets presented in this article are not readily available because the data are part of an ongoing study.

Conflicts of Interest

Kazuyoshi Arata, Takumi Yamakawa, and Hideo Tobata are employees of TACHI-S Co., Ltd., who provided funding and technical support for the work. The funder had no role in the design of the study; in the collection, analysis, or interpretation of data; in the writing of the manuscript; or in the decision to publish the results.

References

  1. Crundall, D.E.; Underwood, G. Effects of experience and processing demands on visual information acquisition in drivers. Ergonomics 1998, 41, 448–458. [Google Scholar] [CrossRef]
  2. Nahvi, H.; Fouladi, M.H.; Nor, M.J.M. Evaluation of whole-body vibration and ride comfort in a passenger car. Int. J. Acoust. Vib. 2009, 14, 143–149. [Google Scholar] [CrossRef]
  3. Gwak, J.; Yoshinami, Y.; Hirao, A.; Shino, M. Repeated Thermal Stimulation by Cabin Temperature for Keeping Arousal and Thermal Comfort of Driver. Int. J. Automot. Eng. 2022, 13, 83–88. [Google Scholar] [CrossRef]
  4. Zhang, L.; Helander, M.G.; Drury, C.G. Identifying Factors of Comfort and Discomfort in Sitting. Hum. Factors 1996, 38, 377–389. [Google Scholar] [CrossRef]
  5. De Looze, M.P.; Kuijt-Evers, L.F.M.; Van Dieën, J.H. Sitting Comfort and Discomfort and the Relationships with Objective Measures. Ergonomics 2003, 46, 985–997. [Google Scholar] [CrossRef] [PubMed]
  6. Hiemstra-van Mastrigt, S.; Groenesteijn, L.; Vink, P.; Kuijt-Evers, L.F.M. Predicting passenger seat comfort and discomfort on the basis of human, context and seat characteristics: A literature review. Ergonomics 2017, 60, 889–911. [Google Scholar] [CrossRef] [PubMed]
  7. Vincent, A.; Bhise, V.D.; Mallick, P. Seat Comfort as a Function of Occupant Characteristics and Pressure Measurements at the Occupant-Seat Interface; SAE Technical Paper; SAE International: Warrendale, PA, USA, 2012; pp. 1–18. [Google Scholar] [CrossRef]
  8. Ciaccia, F.; Sznelwar, L. An Approach to Aircraft Seat Comfort Using Interface Pressure Mapping. Work 2012, 41, 240–245. [Google Scholar] [CrossRef]
  9. Greve, J.M.; Cuğ, M.; Dülgeroğlu, D.; Brech, G.C.; Alonso, A.C. Relationship between anthropometric factors, gender, and balance under unstable conditions in young adults. BioMed Res Int. 2013, 2013, 850424. [Google Scholar] [CrossRef]
  10. Park, J.; Choi, Y.; Lee, B.; Sah, S.; Jung, K.; You, H. Sitting Strategy Analysis based on Driving Postures and Seating Pressure Distributions. Proc. Hum. Factors Ergon. Soc. Annu. Meet. 2013, 57, 1983–1986. [Google Scholar] [CrossRef]
  11. Kyung, G.; Nussbaum, M.A. Age-related Difference in Perceptual Responses and Interface pressure Requirements for Driver Seat Design. Ergonomics 2013, 56, 1795–1805. [Google Scholar] [CrossRef]
  12. Moes, C.C.M. Variation in Sitting Pressure Distribution and Location of the Points of Maximum Pressure with Rotation of the Pelvis, Gender and Body Characteristics. Ergonomics 2007, 50, 536–561. [Google Scholar] [CrossRef]
  13. Paul, G.; Daniell, N.; Fraysse, F. Patterns of Correlation between Vehicle Occupant Seat Pressure and Anthropometry. Work 2012, 41, 2226–2231. [Google Scholar] [CrossRef] [PubMed]
  14. Kyung, G.; Nussbaum, M.A. Driver Sitting Comfort and Discomfort (Part II): Relationships with and Prediction from Interface Pressure. Int. J. Ind. Ergon. 2008, 38, 526–538. [Google Scholar] [CrossRef]
  15. Fasulo, L.; Naddeo, A.; Cappetti, N. A study of classroom seat (dis)comfort: Relationships between body movements, center of pressure on the seat, and lower limbs’ sensations. Appl. Ergon. 2019, 74, 233–240. [Google Scholar] [CrossRef] [PubMed]
  16. Carcone, S.M.; Keir, J.K. Effects of Backrest Design on Biomechanics and Comfort during Seated Work. Appl. Ergon. 2007, 38, 755–764. [Google Scholar] [CrossRef]
  17. De Carvalho, D.E.; Callaghan, J.P. Spine Posture and Discomfort during Prolonged Simulated Driving With Self-Selected Lumbar Support Prominence. Hum. Factors 2015, 57, 976–987. [Google Scholar] [CrossRef]
  18. Giannakakis, G.; Grigoriadis, D.; Giannakaki, K.; Simantiraki, O.; Roniotis, A.; Tsiknakis, M. Review on psychological stress detection using biosignals. IEEE Trans. Affect. Comput. 2019, 13, 440–460. [Google Scholar] [CrossRef]
  19. Gwak, J.; Yoshitake, H.; Shino, M. Effects of visual factors during automated driving of mobility scooters on user comfort: An exploratory simulator study. Transp. Res. Part F Psychol. Behav. 2021, 81, 608–621. [Google Scholar] [CrossRef]
  20. Gyi, D.E.; Porter, J.M. Interface pressure and the prediction of car seat discomfort. Appl. Ergon. 1999, 30, 99–107. [Google Scholar] [CrossRef]
  21. Kolich, M.; Taboun, S.M. Ergonomics modelling and evaluation of automobile seat comfort. Ergonomics 2007, 841–863. [Google Scholar] [CrossRef]
  22. Hirao, A.; Kato, K.; Kitazaki, S.; Yamazaki, N. Qualitative and Quantitative Evaluations of Physical Fatigue during Long-term Driving. J. JSAE 2008, 39, 153–158. [Google Scholar] [CrossRef]
  23. Sharbrough, F.; Chatrian, G.E.; Lesser, R.P.; Luders, H.; Nuwer, M.; Picton, T.W. American Electroencephalographic Society guidelines for standard electrode position nomenclature. J. Clin. Neurophysiol. 1991, 8, 200–202. [Google Scholar]
  24. Coburn, K.L.; Moreno, M.A. Facts and artifacts in brain electrical activity mapping. Brain Topogr. 1988, 1, 37–45. [Google Scholar] [CrossRef] [PubMed]
  25. Fatourechi, M.; Bashashati, A.; Ward, R.K.; Birch, G.E. EMG and EOG artifacts in brain computer interface systems: A survey. Clin. Neurophysiol. 2007, 118, 480–494. [Google Scholar] [CrossRef] [PubMed]
  26. Delorme, A.; Makeig, S. EEGLAB: An open source toolbox for analysis of single-trial EEG dynamics including independent component analysis. J. Neurosci. Methods 2004, 134, 9–21. [Google Scholar] [CrossRef]
  27. Brookhuis, K.A.; De Waard, D. The use of psychophysiology to assess driver status. Ergonomics 1993, 39, 1099–1110. [Google Scholar] [CrossRef]
  28. Eoh, H.J.; Chung, M.K.; Kim, S.H. Electroencephalographic study of drowsiness in simulated driving with sleep deprivation. Int. J. Ind. Ergon. 2005, 35, 307–320. [Google Scholar] [CrossRef]
  29. Deits-Lebehn, C.; Smith, T.W.; Williams, P.G.; Uchino, B.N. Heart rate variability during social interaction: Effects of valence and emotion regulation. Int. J. Psychophysiol. 2023, 190, 20–29. [Google Scholar] [CrossRef]
  30. Aissaoui, R.; Lacoste, M.; Dansereau, J. Analysis of sliding and pressure distribution during a repositioning of persons in a simulator chair. IEEE Trans. Neural Syst. Rehabil. Eng. 2001, 9, 215–224. [Google Scholar] [CrossRef]
  31. Gazzaniga, M.S.; Ivry, R.B.; Mangun, G.R. Cognitive Neuroscience: The Biology of the Mind, 3rd ed.; W. W. Norton & Company: New York, NY, USA, 2009; pp. 71–77. [Google Scholar]
  32. Brodoehl, S.; Klingner, C.; Stieglitz, K.; Witte, O.W. Age-related changes in the somatosensory processing of tactile stimulation—An fMRI study. Behav. Brain Res. 2013, 238, 259–264. [Google Scholar] [CrossRef]
  33. Radhakrishna, R.K.; Dutt, D.N.; Yeragani, V.K. Nonlinear measures of heart rate time series: Influence of posture and controlled breathing. Auton. Neurosci. 2000, 83, 148–158. [Google Scholar] [CrossRef] [PubMed]
  34. Siebert, J.; Drabik, P.; Lango, R.; Szyndler, K. Stroke volume variability and heart rate power spectrum in relation to posture changes in healthy subjects. Med. Sci. Monit. 2004, 10, MT31–MT37. [Google Scholar] [PubMed]
  35. Rahman, J.S.; Gedeon, T.; Caldwell, S.; Jones, R. Brain Melody Informatics: Analysing Effects of Music on Brainwave Patterns. In Proceedings of the International Joint Conference on Neural Networks (IJCNN), Glasgow, UK, 19–24 July 2020; pp. 1–8. [Google Scholar] [CrossRef]
  36. Hima, C.S.; Asheeta, A.; Chithra, C.N.; Sandhya, M.J.N.; Fathima, B.U. A Review on Brainwave Therapy. World J. Pharm. Sci. 2020, 8, 59–66. Available online: https://wjpsonline.com/index.php/wjps/article/view/review-brainwave-therapy (accessed on 30 July 2024).
  37. Grossman, P.; Svebak, S. Respiratory sinus arrhythmia as an index of parasympathetic cardiac control during active coping. Int. J. Psychol. 1987, 24, 228–235. [Google Scholar] [CrossRef] [PubMed]
  38. Ruediger, H.; Seibt, R.; Scheuch, K.; Krause, M.; Alam, S. Sympathetic and parasympathetic activation in heart rate variability in male hypertensive patients under mental stress. J. Hum. Hypertens. 2004, 18, 307–315. [Google Scholar] [CrossRef]
Figure 1. The flow of the physiological response process during sitting. (Adapted from with permission from Ref. [19]. 2021, Elsevier).
Applsci 14 07870 g001
Figure 2. Experimental conditions of seat.
Applsci 14 07870 g002
Figure 3. Segmentation of the measurement area.
Applsci 14 07870 g003
Figure 4. An example of a visual analog scale to evaluate the feeling of relaxation (range of 0 to 1). If the participant marked a point with the red checkmark in the figure, the value of 0.67 is determined based on the ratio of the length on the scale from 0 to 1.
Applsci 14 07870 g004
Figure 5. Experimental procedure.
Applsci 14 07870 g005
Figure 6. An example of the process to calculate the difference in physiological indices: Xi indicates the value calculated from the measurement data in each trial, such as (θ + α)/β, the average of RRI, the value of LF/HF, or the subjective evaluation value of the relaxation, etc.
Applsci 14 07870 g006
Figure 7. Differences in peak pressure of backrest and seat pan in each part. The upper graph represents the results for the backrest, while the lower graph represents those for the seat pan. Asterisks indicate significances: ✝, *, **, and *** for p < 0.10, 0.05, 0.01, and 0.001, respectively.
Applsci 14 07870 g007
Figure 8. Differences in contact area of backrest and seat pan in each part. The upper graph represents the results for the backrest, while the lower graph represents those for the seat pan. Asterisks indicate significances: ✝, *, **, and *** for p < 0.10, 0.05, 0.01, and 0.001, respectively.
Applsci 14 07870 g008
Figure 9. Differences in relaxation value in each part. Asterisks indicate significances: ** for p < 0.01.
Applsci 14 07870 g009
Table 1. Mean of postural angles in each condition. The value in parentheses indicates the standard deviation (S.D.).
NeutralRecliningOttomanSlab
Neck-horizontal angle (deg.)84.8 (3.1)71.6 (3.3)69.6 (3.7)81.6 (3.7)
Torso angle (deg.)36.7 (3.6)48.0 (2.8)51.0 (3.6)36.0 (4.0)
Hip angle (deg.)112.1 (4.8)124.0 (5.6)126.7 (6.0)109.8 (5.5)
Knee angle (deg.)97.1 (14.5)98.3 (15.3)141.2 (4.9)91.7 (14.8)
Foot-horizontal angle (deg.)68.3 (12.1)67.8 (11.2)24.4 (3.8)72.1 (11.0)
Table 2. Summary of the differences in physiological indices in each part.
IndexReference (Supine-Standing)Part 1 (Reclining-Neutral)
Mean of Difference (SD)tp-ValueMean of Difference (SD)tp-Value
(θ + α)/β of Cz−0.04 (0.47)−0.610.5470.11 (0.85)0.980.331
(θ + α)/β of C30.27 (0.53)3.370.0020.10 (0.49)1.530.131
(θ + α)/β of C40.15 (0.51)2.030.0480.00 (0.79)0.020.983
(θ + α)/β of Pz0.34 (1.24)1.820.0750.01 (0.90)0.110.916
(θ + α)/β of P30.51 (1.40)2.440.0190.03 (1.03)0.190.851
(θ + α)/β of P40.38 (1.59)1.610.114−0.03 (0.89)−0.260.797
RRI (ms)186 (94)13.21<0.00113 (27)3.93<0.001
LF/HF−2.26 (2.89)−5.25<0.001−0.03 (1.25)−0.180.862
HF content0.36 (0.22)10.80<0.001−0.01 (0.18)−0.550.583
Respiration rates (Hz)−0.005 (0.042)−0.860.393−0.009 (0.026)−2.510.015
IndexPart 2 (Ottoman-Reclining)Part 3 (Slab-Neutral)
Mean of Difference (SD)tp-ValueMean of Difference (SD)tp-Value
(θ + α)/β of Cz−0.19 (0.63)−2.290.0260.11 (0.45)1.890.063
(θ + α)/β of C3−0.02 (0.46)−0.300.762−0.01 (0.60)−0.070.947
(θ + α)/β of C4−0.15 (0.43)−2.630.0110.12 (0.63)1.440.155
(θ + α)/β of Pz−0.24 (1.04)−1.770.0810.29 (1.12)1.830.072
(θ + α)/β of P3−0.16 (0.96)−1.280.2040.13 (1.10)0.900.374
(θ + α)/β of P4−0.19 (1.00)−1.500.1400.27 (1.12)1.900.062
RRI (ms)21 (33)4.96<0.0010 (29)0.060.953
LF/HF−0.36 (1.17)−2.220.030−0.09 (1.51)−0.460.646
HF content0.07 (0.20)2.630.0110.03 (0.20)1.290.202
Respiration rates (Hz)0.007 (0.028)1.800.0780.005 (0.028)1.480.145
Disclaimer/Publisher’s Note: The statements, opinions and data contained in all publications are solely those of the individual author(s) and contributor(s) and not of MDPI and/or the editor(s). MDPI and/or the editor(s) disclaim responsibility for any injury to people or property resulting from any ideas, methods, instructions or products referred to in the content.

