Article

Vital Views into Drone-Based GPR Application: Precise Mapping of Soil-to-Rock Boundaries and Ground Water Level for Foundation Engineering and Site-Specific Response

1
Geo-Scope Ltd., Rosmarine 17, Beer Sheva 8465041, Israel
2
Civil Engineering Department, Sami Shamoon College of Engineering, Jabotinsky 84, Ashdod 77245, Israel
*
Author to whom correspondence should be addressed.
Appl. Sci. 2024, 14(17), 7889; https://doi.org/10.3390/app14177889
Submission received: 22 June 2024 / Revised: 31 August 2024 / Accepted: 2 September 2024 / Published: 5 September 2024
(This article belongs to the Special Issue Ground Penetrating Radar (GPR): Theory, Methods and Applications)

Abstract

:
The primary objective of this case study is to evaluate the effectiveness of drone-based ground penetrating radar (GPR) in detecting and mapping underground water levels and soil-to-rock boundaries. This knowledge is crucial for accurate structural engineering analyses, including foundation engineering and site-specific response evaluations. The paper also considers drone-based GPR to overcome common urban obstacles, topographic variations, and environmental factors by simply flying over them, offering a promising solution to these challenges. The research utilized drone-based GPR equipped with an unshielded 150 MHz dipole antenna and employed filtering procedures to diminish the effect of above-ground obstacles on the interpretation of our results. The study unequivocally demonstrated the feasibility and effectiveness of drone-based GPR in these applications, reassuring the civil engineering community. The findings of this study significantly advance our understanding of drone-based GPR technology for mapping disturbed soil boundaries and water table levels in foundation engineering and site response applications and provide valuable recommendations for optimizing its performance in complicated terrains, thereby inspiring and guiding future research and practice in this field.

1. Introduction

Ground penetrating radar (GPR) has emerged as a vital technology for subsurface investigation [1]. While conventional surveying methods usually include local 1D borehole drilling and manual 2D geophysical surveys (e.g., electrical resistivity tomography), they face limitations in coverage, cost, and time efficiency, especially in challenging terrains [2,3,4,5,6,7].
While a foundation design is directly related to the soil-to-rock depth, especially if the soil is disturbed, the depth of the groundwater level (GWL) essentially affects the stability of shallow foundations (consolidation, liquefaction, etc.) [8,9,10,11,12,13,14,15,16,17,18,19,20]. In transportation infrastructure assessment, railway and highway stability also directly depend on these two properties. The numerous applications of GPR for road pavement assessment were reviewed in [21]. For example, the railway/highway vehicle-based GPR studies are held above the ground at a fixed distance, mapping underground infrastructure, including pavement thickness, disturbed soil, soil moisture, and gravel inventories, as was used to assess the condition of Croatia’s old railway underground infrastructure [22,23].
Similarly, in site response analyses, the thickness of the soil column directly affects amplification factors and nonlinear effects, which are critical for understanding how the ground will behave during seismic events [24,25]. The presence of GWL relatively close to the ground surface significantly impacts the characteristics of ground motions [26,27,28,29,30]. Although GPR has not yet been used for site response-related applications, knowing the precise location of the soil-to-rock boundary and the WL depth can significantly enhance the accuracy of ground motion prediction models and the design of foundation systems.
Traditional ground-based GPR has been used in similar attempts to measure the distributed soil-to-rock depth and GWL [31].
For instance, Ortuani et al. [6] explored soil water content using electrical resistivity imaging and GPR methods. They compared these findings with variability maps, revealing a promising correlation between the geophysical and hydrological data. Benedetto et al. [7] employed two GPR methodologies for observing underground moisture: one by evaluating dielectric permittivity from signal attenuation and the other by using Rayleigh scattering to analyze frequency spectrum peak shifts. Both methods showed significant potential for large-scale moisture mapping [7].
Cheng et al. [32] used ground-based GPR for mapping nonlinear boundaries between covering clayey soil and natural soil for agricultural purposes. Additionally, Guo et al. [33] utilized land-based GPR to study the 3D sedimentary architecture of recent sediments in the Yun-gang braided river study area in Datong (China), emphasizing the need to characterize unstable, disturbed ground quantitatively. Traditional land-based GPR has already found applications in agriculture in monitoring soil water content during irrigation in clay-disturbed soils [3]. Sass et al. [2] applied ground-based GPR to gain knowledge about the thickness and internal structure of the Öschingen landslide in Germany, detecting near-surface sediment structures despite signal attenuation and reflections.
Abdulraheem et al. [34] explored the response of various geophysical methods, such as time-domain reflectometry, frequency-domain reflectometry, GPR, remote sensing, and capacitance, to soil moisture content. They highlighted the need to calibrate dielectric models used in measurement techniques based on desired precision and field conditions. This aligns with the conclusions by [35,36,37], who noted that integrating GPR with other methods and additional collected on-site information can improve accuracy in estimating soil properties and enhance the investigation of various soil characteristics to understand soil relationships better.
Bayarri et al. [38] investigated the factors contributing to the deterioration of art in the Cave of Altamira, particularly in the Polychrome Hall. By combining GPR with geospatial analysis, they comprehensively characterized moisture distribution.
However, a few of these examples directly relate to construction engineering [37]. They are applicable only with limited measurement lines in relatively flat and accessible areas convenient for traditional land GPR measurement.
On the other hand, airborne-based GPR emerges as a cutting-edge technology, utilizing electromagnetic waves to penetrate the subsurface and capture detailed geological information [39]. In contrast to traditional ground-based GPR, drone-based GPR offers several advantages over conventional ground-based methods [40]. Uncrewed aerial vehicles (UAVs) equipped with GPR sensors can rapidly and non-invasively cover large and inaccessible areas, offering a three-dimensional perspective of the subsurface boundaries with their geotechnical properties and achieving heightened spatial resolution [41]. Applying real-time kinematic (RTK) GPS positioning enables precise survey paths to be repeated and opens new opportunities for 4D data acquisition [42].
The UAV-mounted GPR system, equipped with advanced signal processing techniques such as cross-correlation-based background subtraction and interference suppression [43,44], ensures accurate detection of underground targets. Frid and Frid [45], for example, demonstrate a good fit between the results by comparing land-based GPR and drone-based GPR, both operating with a 500 MHz antenna, to map archaeological artifacts at a clayey soil site in Northern Israel. Despite the potential advantages, it also addressed how to overcome specific physical challenges related to drone-based GPR, such as increased above-ground interference, signal decay in air, and drone stability issues, by presenting analytical formulations [45].
A drone-based GPR application helps examine areas with limited accessibility, e.g., the regions with sharply changed topography, rough, stony, muddy soil/rock surfaces, etc. For example, Ruols et al. [46] demonstrated the effectiveness of drone-borne controlled-source electromagnetic (CSEM) systems in capturing detailed 3D datasets over alpine glaciers. Vergnano et al. [47] used drone-borne GPR with a 900 MHz antenna to map snow cover depth in the Alps, proving the readiness of drone technology for high-altitude GPR applications. Saponaro et al. [48] showed how drone-mounted GPR with 120 MHz antennas can optimize mining operations by mapping geological structures in a quarry in Falconara Albanese, Italy. Edemsky et al. [49] highlighted using airborne GPR in clay soils, identifying subsurface objects despite challenges with electromagnetic wave decay, an issue also managed by Cheng et al. [32] using land GPR in agricultural fields.
This study addresses the critical challenge of accurately identifying subsurface boundaries, such as soil-to-rock interfaces and groundwater levels, in areas with complex topography and limited accessibility. These features are crucial for structural engineering analyses, especially in foundation engineering applications [13,14,15] and site-specific response evaluations [18,19,20]. Hence, it is essential to identify them accurately. Traditional geophysical methods, including ground-based GPR and borehole drilling, often face coverage, cost, and efficiency limitations, particularly in challenging terrains [4,5,6,7,50,51,52]. This research introduces an innovative approach by utilizing drone-based GPR technology, which offers a non-invasive, rapid, and precise method for mapping subsurface features, even in densely obstructed urban environments. The study’s significance lies in its potential to revolutionize structural engineering analyses and site-specific response evaluations by offering a more accurate and practical solution for assessing subsurface conditions in environments where conventional methods fall short. Additionally, the exploration of unshielded, low-frequency GPR antennas in urban settings further underscores the innovative nature of this work, promising to extend the applicability of GPR technology in diverse and demanding contexts.

2. Materials and Methods

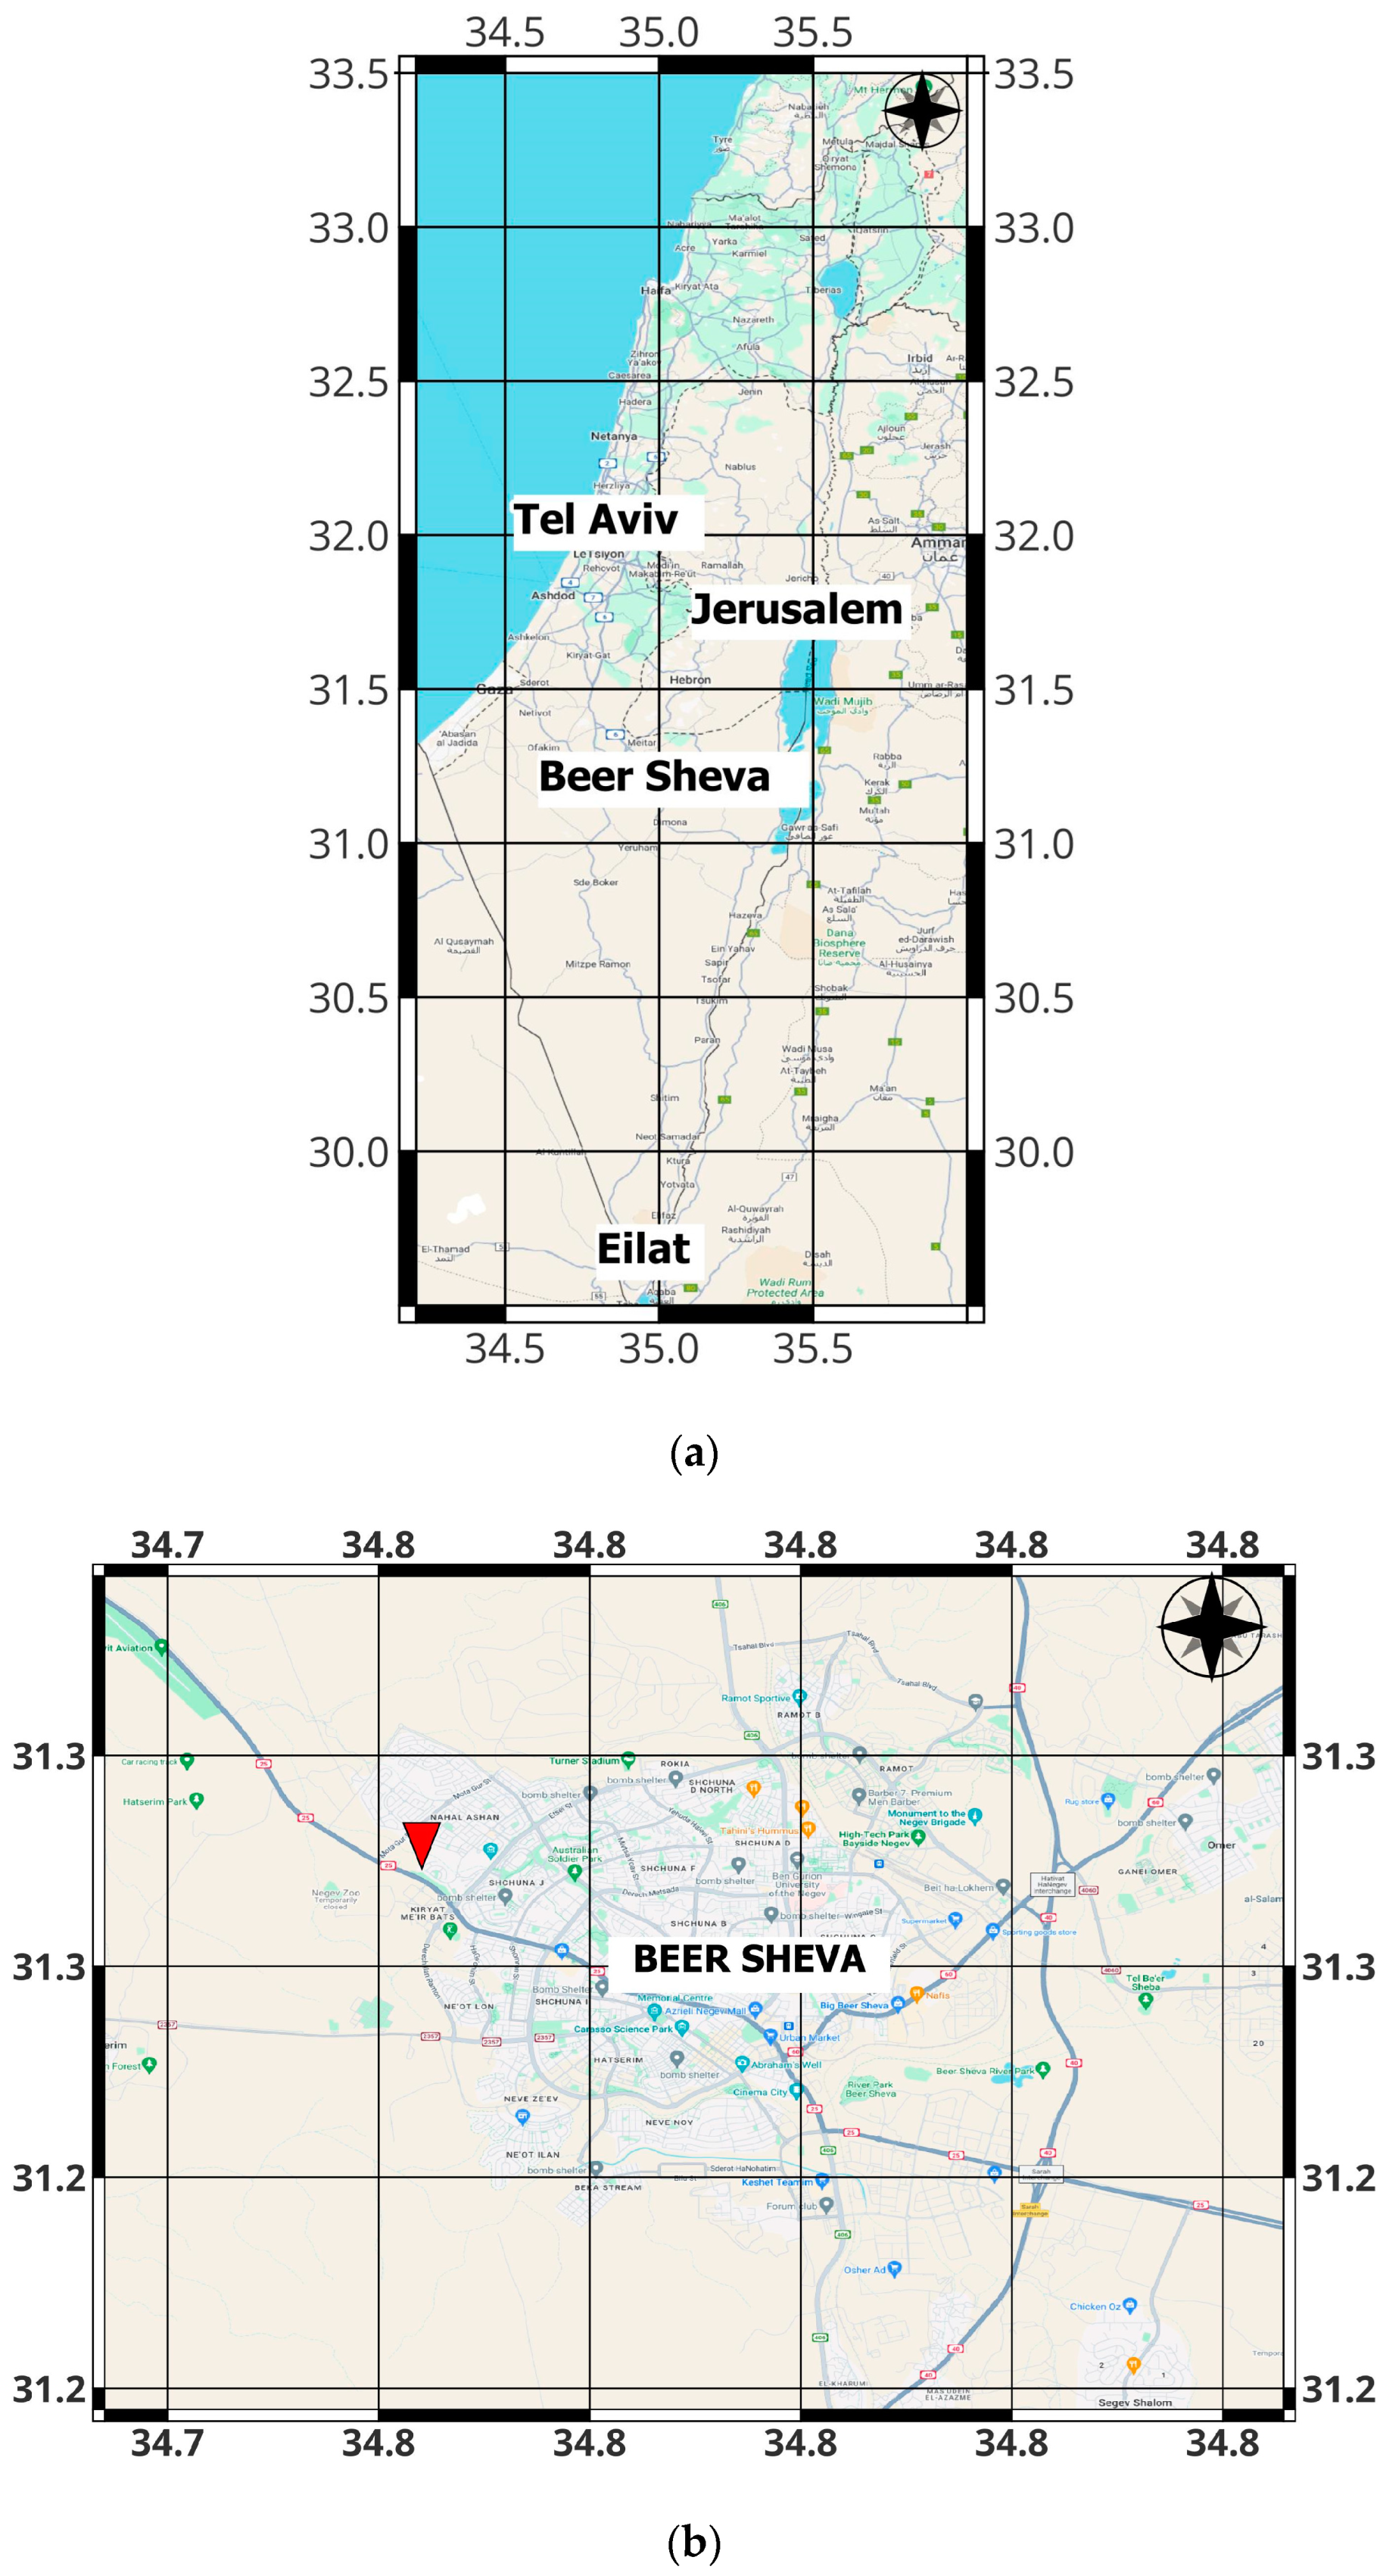
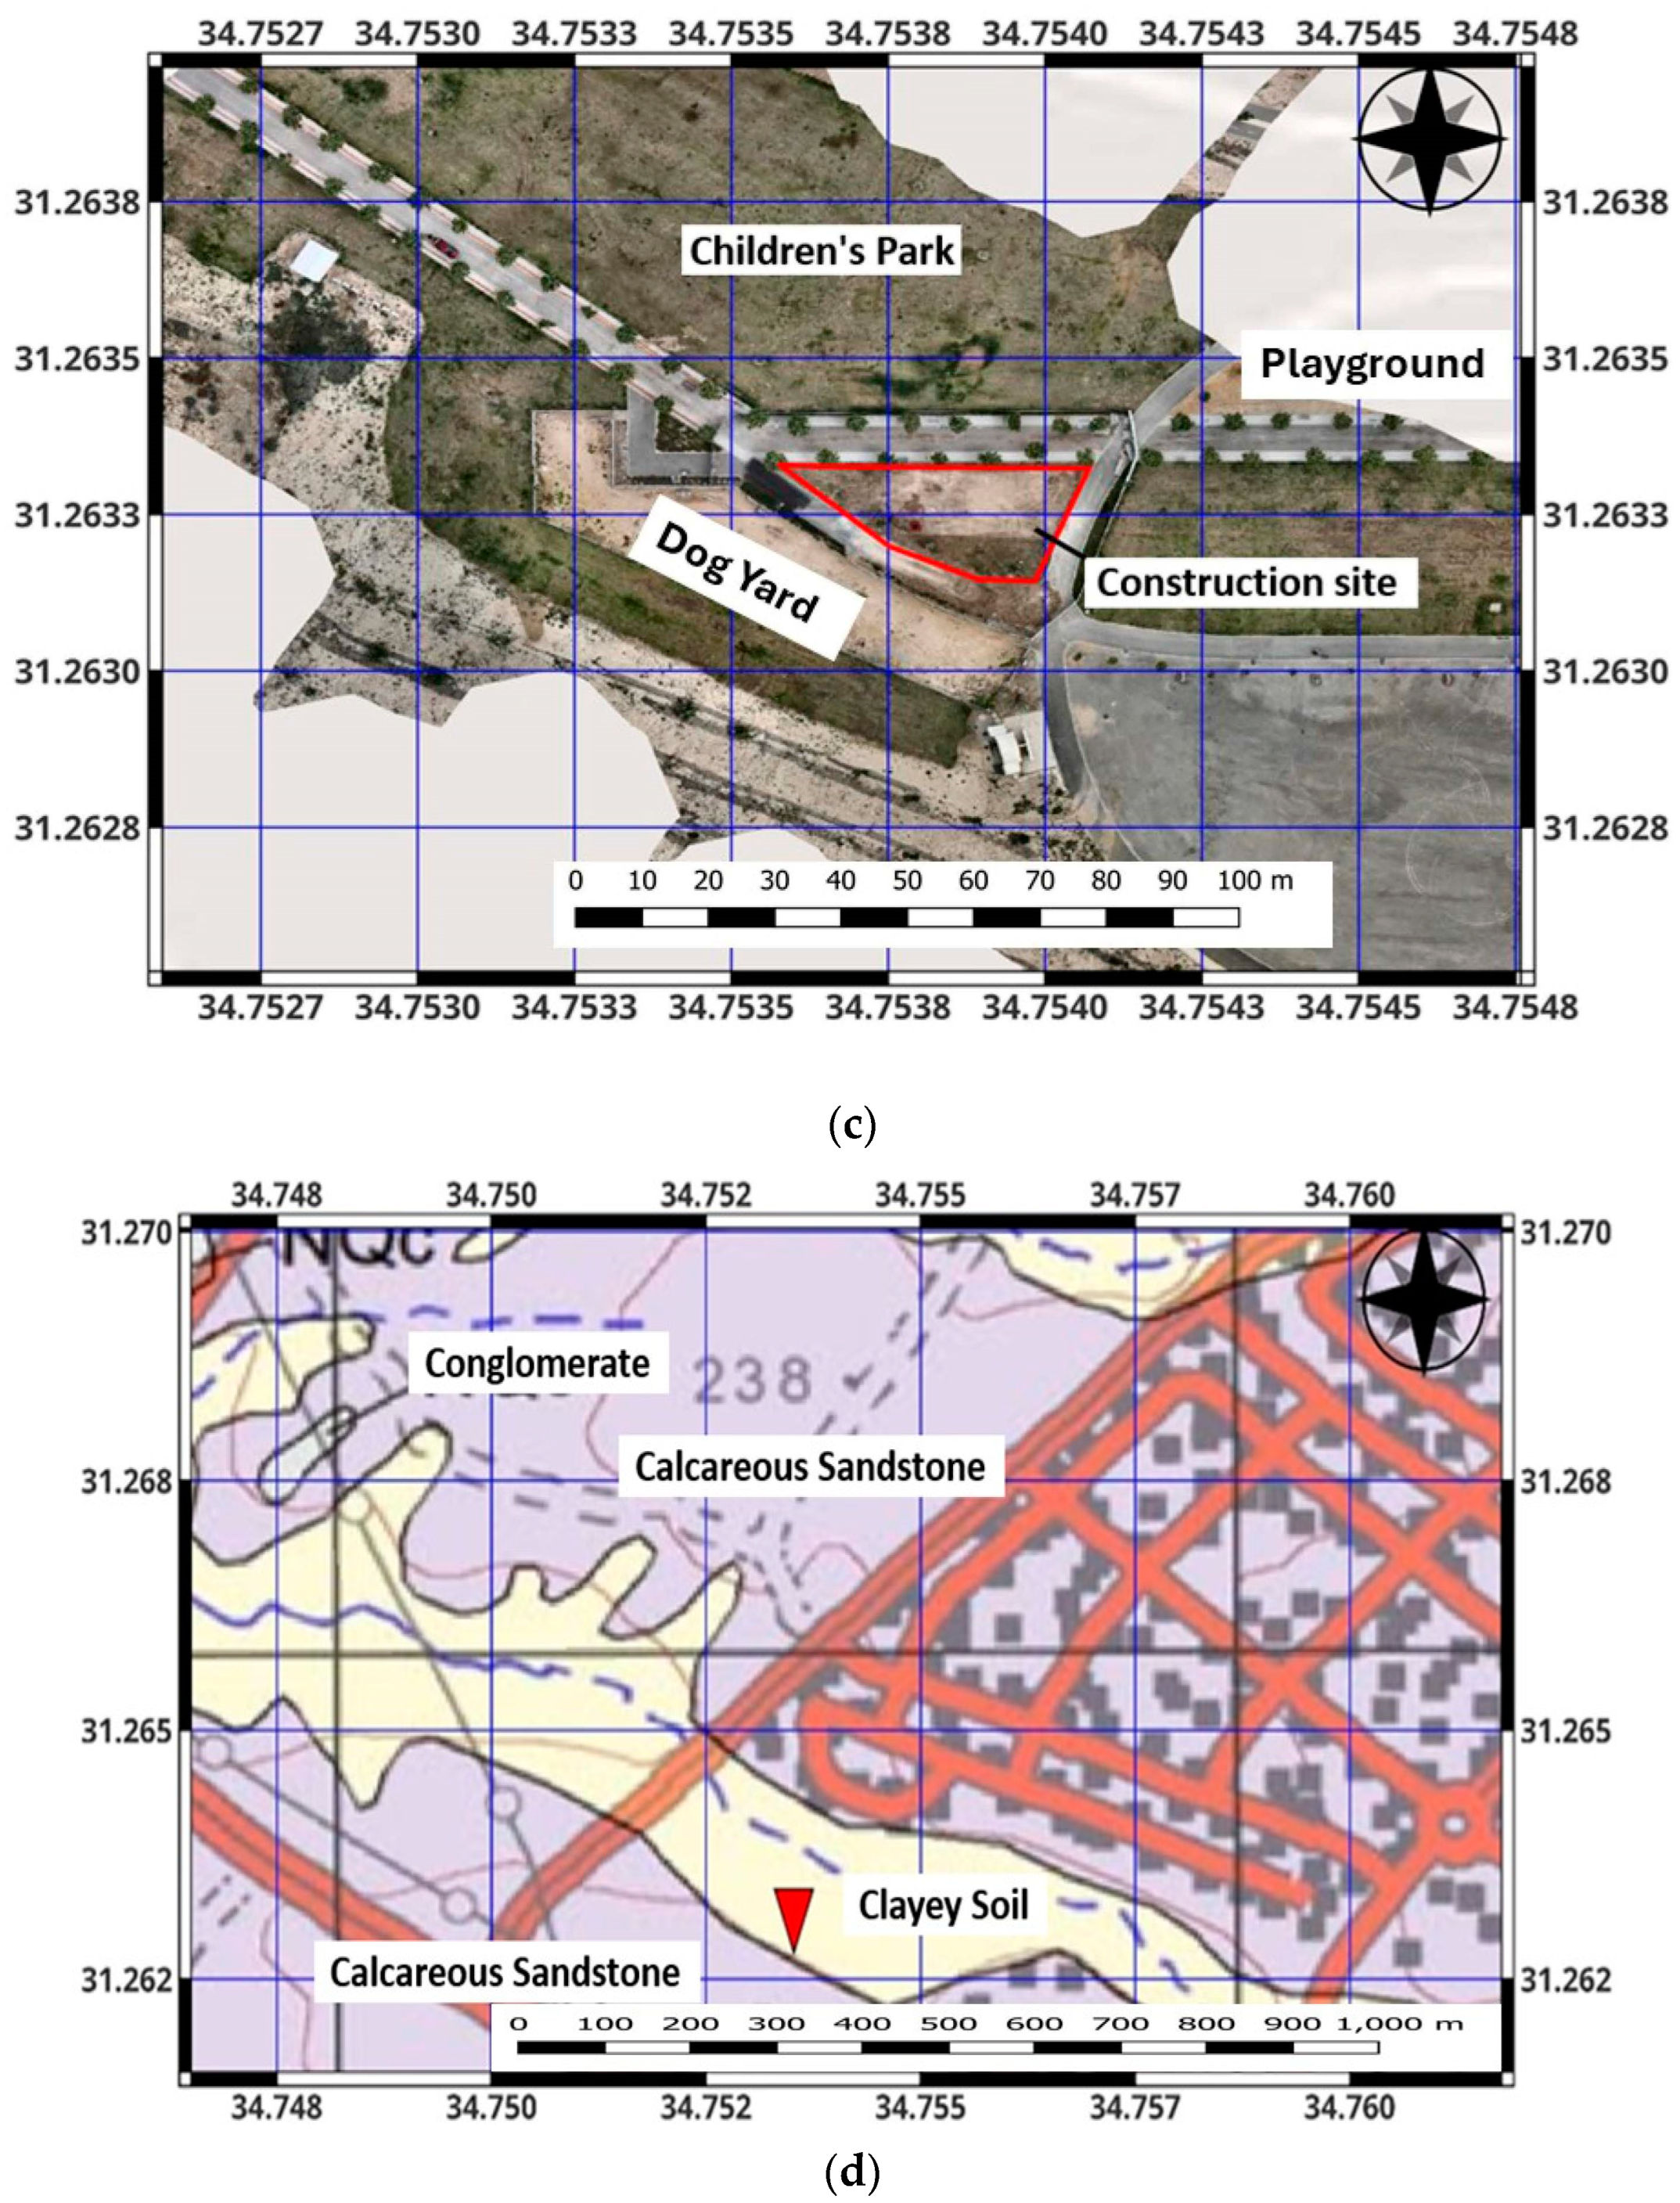
2.1. The Site under Study

The construction site under study is located in Beer Sheva city on the northern edge of the Negev desert, approximately 115 km southeast of Tel Aviv and 120 km southwest of Jerusalem. The town is positioned along the primary route from the central and northern parts of the country to Eilat in the far south (Figure 1a). Specifically, the site is located in the northwestern part of the city (Figure 1b) within the boundaries of the old Wadi, filled by disturbed clayey soil during the construction of a nearby Children’s Park (Figure 1c). The filling soil is classified as low plastic inorganic clay up to silty clay (CL/ML indexes following the Unified Soil Classification System [53]). This soil is a matrix for carbonate pebble-size material overlaying calcareous sandstone from the Pliocene period (Figure 1d). Antecedent government topographic data for the region indicated the presence of natural rock or soil surfaces at depths ranging from 8 to 15 m, lacking precise details.
The site under study was chosen as an emergent need for the foundation engineers to assess the WL depth and the disturbed soil-to-rock boundary to plan the deep foundation for the new community center appropriately and cost-efficiently. Except for the knowledge about the disturbed soil, no data was available regarding the subsurface structure or the presence of underground water. To receive a linear cross-section of the old Wadi, it was necessary to scan it perpendicularly. However, local fences surrounding the construction site, the nearby dog yard, and the slopes prevented performing ground-based GPR and limited the mission to only a drone-based GPR solution, which could easily overcome other urban obstacles on site, such as lines of benches, trees, streetlights, the children’s playground, etc.

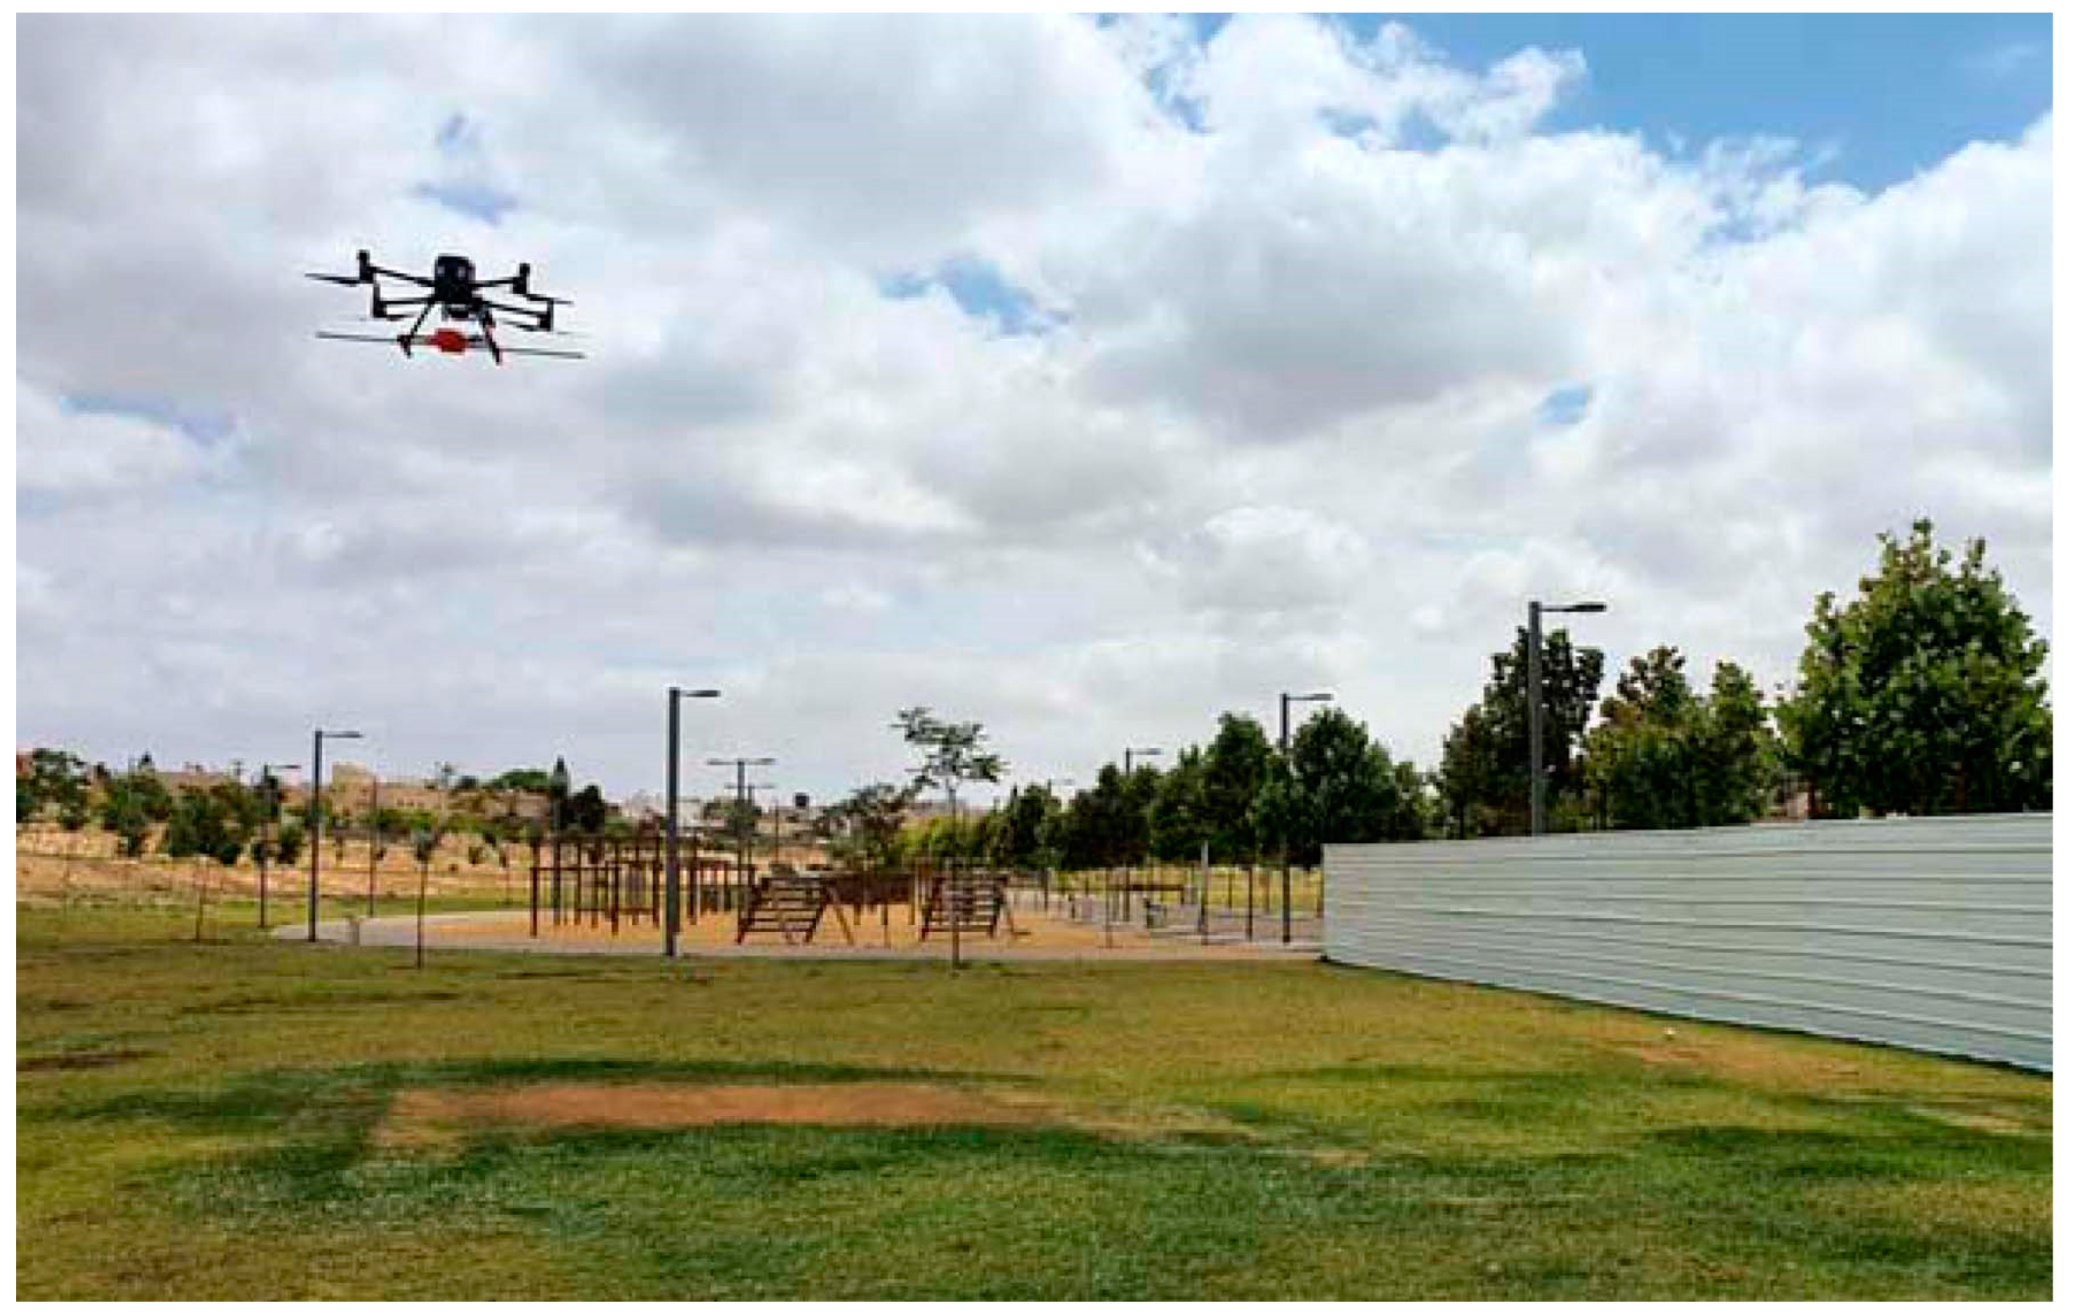
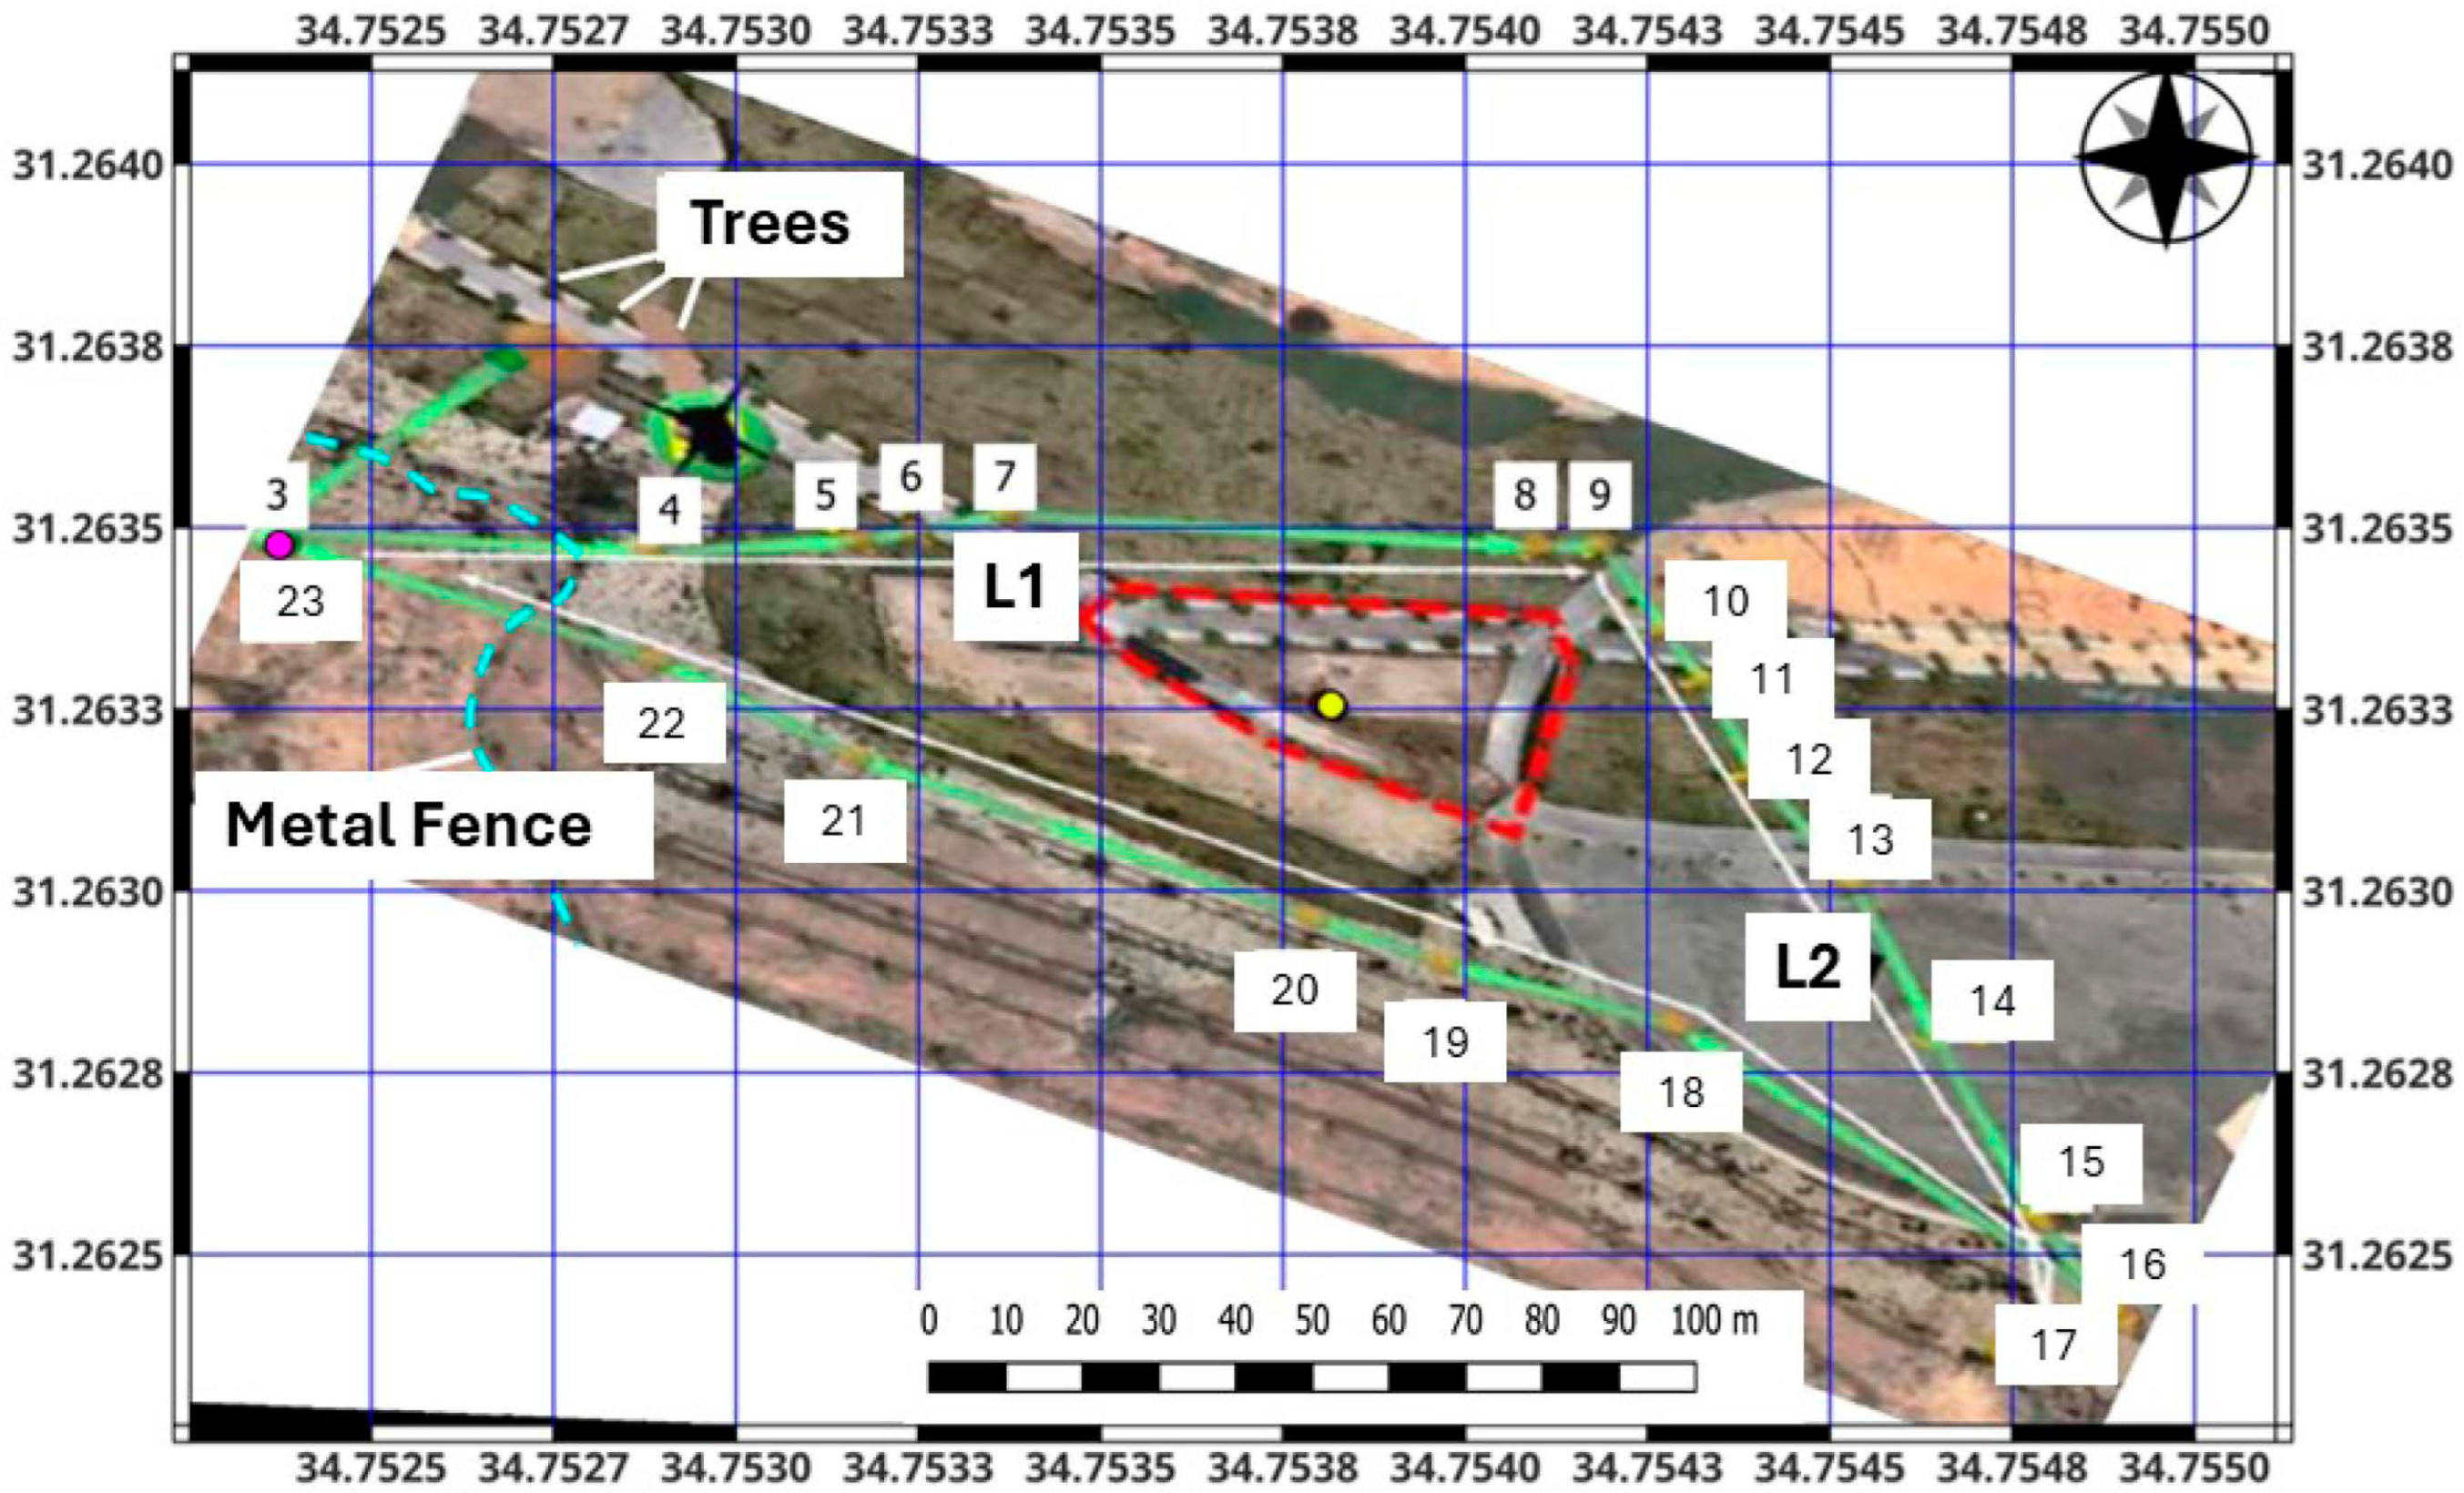
2.2. The Design of the Drone-Based GPR System

A drone-based GPR system includes essential components, each crucial for ensuring accuracy and functionality. At the core is the GPR unit from RADAR Systems, Inc. (Riga, Latvia), which combines the radar transmitter and receiver antennas to emit and capture electromagnetic waves. Antenna selection, based on desired penetration depth and resolution, is critical for the application.
Combining GPR technology with drones creates a powerful tool for foundation engineering surveys. As shown in Figure 2, the GPR unit is mounted beneath the drone, with the dipole antenna positioned for optimal ground distance, ensuring accurate data acquisition. Real-time kinematic (RTK) technology provides precise georeferencing, and the SKYHUB computer (SPH Engineering, Riga, Latvia) synchronizes data between the DJI M300 drone and the GPR unit for coherent information collection.
A drone-based GPR system was configured with a central frequency of 150 MHz to address the uncertainty in geological exploration and optimize subsurface penetration. The chosen operating bandwidth spans from 50 to 300 MHz, with a scan resolution of 512 to 1024 samples per scan. This GPR configuration aims to provide detailed insights into the subsurface composition, contributing to a comprehensive understanding of the geological structure near the construction site. Furthermore, the drone’s capacity and flight time affect the system’s overall usability. A well-balanced drone with sufficient payload capacity ensures the secure mounting of the GPR unit without compromising flight stability.
Drones present a distinctive advantage in their adeptness at efficiently covering expansive areas while effortlessly navigating urban impediments such as fences, trees, bushes, and streetlights, thereby maintaining a constant and stable flight pattern around the area of interest. Given the prevalence of high trees and fences encircling the construction site at the Children’s Park (Figure 1c and Figure 3), the drone’s flying altitude was restricted to 5 m above the surface. To optimize data acquisition over the undulating terrain of the park, the selected flight path commenced at the hilltop, descending around the construction site’s center, aligning with the natural surface of the hills beneath the distributed soil. Leveraging SKYHUB technology, the drone’s trajectory is pre-programmed to follow a designated pattern, often composed of parallel flight lines or a grid configuration tailored to the research objectives. These predefined patterns enable the GPR sensors to capture data precisely across the entire survey area. Figure 3 visually represents the specific flight pattern executed in the park around the places of interest.
Despite the grid scheme commonly used for geophysical studies, e.g., [6,7,45], drone-based GPR measurements, especially in areas with dense subsurface obstacles such as metal fences and trees, benefit significantly from a “circular” scheme of measurements where the beginning and the end of measurements are at the same point. This “circular” approach helps avoid many challenges and allows safer navigation around obstacles. Additionally, while the grid scheme is helpful for interpolating data to identify small underground objects, this study aimed to evaluate the geological section and determine the groundwater level. Given the relatively small size of the study area, a dense grid scheme was unnecessary, making the “circular” scheme more advantageous.
The flight altitude and speed of the drone impact the flight path design, as they affect the sensor’s effective field of view. Like ground-based GPR, slow velocity scanning is preferable for underground features [55,56]; therefore, the flight velocity was set to 1 m/s. The drone’s flight altitude was optimized to maintain a consistent ground clearance for data accuracy—following the comparison in [45] of the techniques used between ground-based and drone-based GPR for target depth calculation.

2.3. A Brief Description of the Theoretical Principles of Drone-Based GPR Measurements

The width of the explored area depends on the radiation pattern of the transmitting antenna, the EM wave transmission (soil properties), and the drone’s height, namely on the radius of the First Fresnel Zone (FFZ) [57,58]. In short, Fresnel zones are determined as concentric ellipses with the transmitter (Tx) and receiver (Rx) as the two focal points. The innermost ellipse, the First Fresnel Zone (FFZ), transfers over 70% of the signal energy to the receiver [59]. The problem of electromagnetic wave penetration in soils caused by a GPR antenna, as explained by Fresnel theory, has been extensively analyzed in [7,60].
Here, we present a simplified approach to estimate the GPR survey parameters.
The study area features dense tree growth and fences on the surface (Figure 3). With trees estimated to be about 4 m tall, the drone flight altitude (H) was set at 5 m. Three additional input parameters for the calculation are the target depth (D), the soil’s cross-sectional content (soil dielectric permittivity), and the center frequency f of the GPR antenna.
As mentioned earlier (Section 2.1), the study’s target depth is 15 m, and the subsurface is composed of clayey soil with a dielectric permittivity ε of approximately 15 [44].
Our previous study [45] demonstrated that conducting a GPR survey using antennas with 300–500 MHz center frequencies at a flight altitude exceeding 3 m does not yield high-quality data. The other three antennas included in the unmanned GPR kit have frequencies of 50, 100, and 150 MHz, which were considered for survey planning (see below).
Using these three parameters, a six-step procedure can be used to determine the main exploration parameters for the GPR survey. The calculation scheme is shown in Figure 4.
In Equations (1)–(3), R1 is a function of the drone’s altitude (H = 5), V is the speed of the electromagnetic wave in the material, and f is the radar center frequency [45,46,47,48,49].
V = 300 mm ns / ε ,
λ = V / f ,
R 1 = λ 4 + H · λ 2 ,
where λ is the wavelength and ε is the value of material dielectric permittivity [55,56]. Considering the dielectric permittivity of air ( ε a ~1), Equation (1) returns Vair of 300 mm/ns. Based on Equation (2) and frequency f ranging 50–150 MHz, the λ value is 2–6 m (Table 1). Hence, considering the flight altitude H = 5 m, the value of R1 (for the frequency range 50–150 MHz) equals ~2–4.2 m.
To estimate the radius R2 of the maximum exposure area under the drone at a depth under the earth’s surface (Figure 4) and additional parameters such as vertical resolution (DR) and minimum size (Amin) of a detectable object, additional equations are required as follows [44,45,48,49]:
R 2 = R 1 + D · λ 2 ;
D R = λ / 2 ;
A m i n = D + H / 10 , D + H / 10 > D R D R / 2 , D + H / 10 D R .
Considering the local clayey-saturated soil (Section 2.1), the estimated dielectric permittivity (ε) is approximately 15 [44,61]. According to Equation (1), the velocity in clay (Vclay) is 77.546 mm/ns. For a target depth (D) of 15 m, the estimated radius of the object at this depth (R2) is approximately 3.5–6.7 m, with a vertical resolution (DR) of 0.26–0.77 m for the frequency range of 50–150 MHz. The minimum detectable object size (Amin) is 2 m (Table 1).
As previously noted, three antenna frequencies were considered for the survey planning. Table 1 indicates that the resolution of the 50 MHz antenna is roughly half that of the 100 MHz antenna. Moreover, the 50 MHz antenna’s large dipole size (3 m in length) and the dense tree locations make it unsafe for flight, providing further justification for excluding it from the survey.
Analysis of the calculation results for the 100 MHz and 150 MHz antennas shows that the latter offers slightly higher resolution. However, the 150 MHz antenna’s dipole is shorter (1 m) than the 100 MHz antenna’s (1.5 m), making it safer for flight in dense vegetation. Therefore, the 150 MHz antenna was chosen so that flight safety and data quality were not compromised.

2.4. The Processing of Data Collected by Drone-Based GPR

The collected data were processed using Prism 2 software (RADAR Systems Inc., Riga, Latvia). Table 2 shows the list of filters applied during data processing. Despite the unique challenges posed by drone-based GPR, such as increased above-ground interference, signal decay in the air and underground, and drone vibration anomalies, based on our previous results [45], the list of filters can be the same as ground-based GPR.

3. Results

Figure 5 shows the entire unprocessed profile of GPR data with only the corrected topography and two cut sections from/to the drone base station. The meticulously planned flight path, strategically designed to optimize the capture of subsurface features, is depicted in Figure 3 (green lines with numbers that are the same waypoints as in Figure 5). The drone commenced its survey from the hilltop (the purple circle in Figure 3), where the natural rock layer is about at the Earth’s surface, and followed a perpendicular direction to the dip of the hill. The flight was organized into distinct sections. The initial section, from west to east (waypoints 3 to 9), aimed to circumvent urban obstacles such as 4 m trees, a 1.5 m fence, and 4.5 m streetlights while maintaining a low altitude of 5 m above the ground.
The second section, traversing from northwest to waypoints 10 to 17 (Figure 3 and Figure 5), mirrored the first but in the opposite direction, mapping the sub-rock natural surface to the hills’ natural surface. The third section examined underground variations in the east–west direction, investigating whether the slope exhibited drastic changes or maintained a consistent formation beneath the surface (waypoints 18 to 25, Figure 3 and Figure 5).
As detailed above, the minimum penetration depth for the aerial survey was established at 20 m, slightly more profound than the desired depth of the investigation (15 m). This parameter ensured comprehensive subsurface data collection, allowing for a thorough exploration of the geological structure beneath the clayey soil.
Figure 6 presents the zoomed-in part of the processed radargram from the first survey section (waypoints 7–8, as illustrated in Figure 3 and Figure 5), offering detailed insight into subsurface structures. The horizontal and vertical axes denote path and depth distances in meters.
The radargram’s distinct features were identified by carefully interpreting the processed data (Figure 6a). The dashed black line representing the surface was determined by calibrating the radar signal with known surface markers. Variations in the distributed soils, marked (for example) by the yellow dashed line, were discerned based on their differing dielectric properties, which cause variations in radar signal reflections. Note the existence of several such layers above and below the yellow dashed line. At approximately 5 m deep, the red dashed line indicates a saturated water layer, identified through the reflection patterns common in water-saturated zones. The purple dashed line representing the top of the weathered/erosive rock at approximately 8 m depth was distinguished by a significant change in signal amplitude and continuity. In comparison, the continuous purple line highlighting the natural hard rock surface was identified around 10 m below the ground level by the robust amplification of reflected signals. Additionally, the hyperbolic reflections from fences and trees were recognized based on their distinctive typical shapes and adjusting their slope to the wave velocity in the air.
The interpretation of the GPR results proposed above was validated using in situ drilling tests as an evaluation method. The drilling point, marked with a yellow dot in Figure 3, was in the middle of the construction site. As shown in Figure 7, water was encountered at approximately 5 m depth. The presence of water at the bottom of the borehole caused internal collapse of the soil from the sides of the borehole, and the release of pressure from the trapped water led to flooding within the borehole. This finding was crucial as it provided direct evidence of the water table depth, a critical factor for foundation engineering.
Additionally, the photo in Figure 8 reveals the presence of yellow sandstone fragments at the drilling bottom, representing the natural rock layer at an estimated depth of about 10 m beneath the construction site’s surface. This observation aligns with the subsurface composition revealed in the GPR results (e.g., Figure 6). The consistency between the field observations and GPR findings substantiates the accuracy and reliability of the applied aerial GPR technology, showcasing its potential for real-world applications in foundation engineering. Furthermore, additional hydro-geological analysis of GPR findings showed that they correlated with the natural water flow direction of the park’s Wadi, descending from east to west (general water flow direction in Israel from hills at the east to Mediterranean sea at the west). This correlation reinforces the utility of GPR in not only mapping subsurface structures but also understanding hydro-geological properties.
Figure 8 provides an updated photo capturing the process of drilling 14 m pile foundations at the construction site. The pervasive brown, wet, and distributed clayey soil is evident throughout the image, reflecting the challenges posed by the water table at around 5 m depth. To counter the risk of collapsing drilling pits, a bentonite mixture was employed during the drilling process to stabilize the surrounding soil. Yellow sandstone fragments at the drilling bottom, representing the natural rock layer, align with the GPR results, confirming the technology’s accuracy. This comprehensive validation through drilling underscores the potential of aerial GPR for effective subsurface investigation in foundation engineering projects.

4. Discussion

Our study demonstrates the ability of drone-based ground penetrating radar (GPR) to accurately map the natural rock surface beneath a substantial layer of clayey soil at the construction site in Beer Sheva’s Children’s Park. The conventional challenges faced by traditional surveying methods, such as spot-wise borehole drilling, were overcome by leveraging the unique capabilities of drone-based GPR. Quantitative data supporting the efficiency claims of drone-based GPR reveal that it significantly reduces surveying time by 40% compared to traditional methods, including land-based GPR acquisition [45]. Our conclusion aligns with that of [62], highlighting that drone-based GPR is a cost-effective solution that covers large and difficult-to-access areas, significantly reducing the effort required for measurements.
The practical challenges commonly associated with drone-based GPR systems, such as flight instability (sensitivity to wind gusts), reduced signal penetration compared to ground-based GPR, and clutter (artificial reflections interfering with subsurface target echoes), were thoroughly addressed in [62]. The data acquisition avoided the first issue during the day when wind gusts in our regions were rare. The calculation results presented in Section 2.3, corroborated by borehole data, confirmed that the penetration depth was sufficient for this study. The most popular method for clutter mitigation is using the Background Removal and Dewow filters, which were successfully applied (Section 2.4).
Combining aerial platforms with subsurface sensing capabilities enabled a comprehensive understanding of the complex subsurface structure, which was crucial for foundation engineering. Our choice of a 150 MHz central frequency is a successful compromise between the subsurface dielectric properties (clayey soil in the case under study), which proved effective in penetrating and revealing the underlying natural rock formations. Specifically, using an unshielded low-frequency dipole antenna, generally not recommended in urban environments due to the effect of above-ground obstacles (e.g., fences, trees, etc.; see Figure 2, Figure 3 and Figure 7a), allowed us to distinguish natural subsurface features (Figure 6) successfully.
The flight path planning, illustrated in Figure 3, strategically considered urban obstacles like trees, fences, and streetlights, allowing the drone to navigate efficiently at a low altitude of 5 m above the ground. This meticulous planning and collected GPR data enabled accurate identification of the transition from clayey soil to natural rock surfaces. The validation process, involving the general geological mapping and on-site observations during foundation drilling, consistently affirmed the accuracy of our GPR-based mapping. The success in differentiating soil types and identifying the natural rock surface at varying depths showcases the potential of drone-based GPR as a transformative tool in subsurface characterization for foundation engineering applications.
The successful correlation between the GPR observations and the actual subsurface structure validates the technology’s efficacy and underscores its significance in overcoming challenges associated with waterlogged clayey soil during construction activities. Additionally, the decision not to use ground-based GPR was justified by the presence of too many obstacles, hindering effective data collection. The insights provided by the radargram compensate for the limitations encountered during the drilling test, offering valuable data for informed decision-making in construction planning. Moreover, quantitative analysis is invaluable in ensuring foundation structures’ stability and effectiveness in varying geological conditions. This information is crucial for engineering considerations, aiding in planning appropriate foundation pile lengths for future structures.
In summary, this study’s results reveal the effectiveness of drone-based GPR technology in accurately identifying subsurface clayey soil boundaries and groundwater depth. Additionally, the findings underscore the potential of deploying unshielded, low-frequency GPR antennas in complex urban environments, marking a significant advancement in the application of this technology.

5. Conclusions

The application of drone-based GPR was an effective tool in identifying the boundaries between disturbed clay soil and rock formations along the old Wadi stream. The methodology of its application in generally unfavorable conditions, clayey soil, and above-ground obstacles (trees, metal fences, etc.) was considered. The potential of using uncrewed ground penetrating radar (GPR) equipped with an unshielded dipole antenna as a transformative tool in geospatial analysis has been successfully demonstrated. The study contributes to understanding drone-based ground penetrating radar technology for mapping disturbed soil boundaries as an integral part of foundation design in complex environments.

Author Contributions

Conceptualization, M.F. and V.F.; methodology, M.F. and V.F.; software, M.F.; validation, M.F. and V.F.; formal analysis, M.F.; investigation, M.F. and V.F.; resources, V.F.; data curation, V.F.; writing—original draft preparation, M.F. and V.F.; writing—review and editing, M.F. and V.F.; visualization, M.F.; supervision, V.F.; project administration, M.F. All authors have read and agreed to the published version of the manuscript.

Funding

V.F. acknowledges the support from the European Union’s Horizon 2020 research and innovation program under the Marie Sklodowska-Curie RISE project EffectFact, grant agreement No. 101008140.

Institutional Review Board Statement

Not applicable.

Informed Consent Statement

Not applicable.

Data Availability Statement

The original contributions presented in the study are included in the article; further inquiries can be directed to the corresponding author.

Conflicts of Interest

Author Michael Frid was employed by Geo-Scope Ltd. The remaining authors declare that the research was conducted without commercial or financial relationships that could be construed as a potential conflict of interest.

References

  1. Solla, M.; Pérez-Gracia, V.; Fontul, S. A review of GPR application on transport infrastructures: Troubleshooting and best practices. Remote Sens. 2021, 13, 672. [Google Scholar] [CrossRef]
  2. Sass, O.; Friedmann, A.; Haselwanter, G.; Wetzel, K.-F. Investigating thickness and internal structure of alpine mires using conventional and geophysical techniques. Catena 2010, 80, 195–203. [Google Scholar] [CrossRef]
  3. Algeo, J.; Van Dam, R.L.; Slater, L. Early-Time GPR: A Method to Monitor Spatial Variations in Soil Water Content during Irrigation in Clay Soils. Vadose Zone J. 2016, 15, 1–9. [Google Scholar] [CrossRef]
  4. Bersezio, R.; Giudici, M.; Mele, M. Combining sedimentological and geophysical data for high-resolution 3-D mapping of fluvial architectural elements in the Quaternary Po plain (Italy). Sediment. Geol. 2007, 202, 230–248. [Google Scholar] [CrossRef]
  5. Mele, M.; Bersezio, R.; Giudici, M. Hydrogeophysical imaging of alluvial aquifers: Electrostratigraphic units in the quaternary Po alluvial plain (Italy). Int. J. Earth Sci. 2012, 101, 2005–2025. [Google Scholar] [CrossRef]
  6. Ortuani, B.; Benedetto, A.; Giudici, M.; Mele, M.; Tosti, F. A non-invasive approach to monitor variability of soil water content with electromagnetic methods. Procedia Environ. Sci. 2013, 19, 446–455. [Google Scholar] [CrossRef]
  7. Benedetto, A.; Tosti, F.; Ortuani, B.; Giudici, M.; Mele, M. Mapping the spatial variation of soil moisture at the large scale using GPR for pavement applications. Near Surf. Geophys. 2015, 13, 269–278. [Google Scholar] [CrossRef]
  8. Das, B.M. Principles of Foundation Engineering, 7th ed.; Cengage: Boston, MA, USA, 2016. [Google Scholar]
  9. Ranjan, G.; Rao, A.S. Basic and Applied Soil Mechanics, 3rd ed.; New Age International Publication: New Delhi, India, 2016. [Google Scholar]
  10. Murthy, V.N.S. Textbook of Soil Mechanics and Foundation Engineering; Marcel Dekker. Inc.: New York, NY, USA, 2005. [Google Scholar]
  11. Terzaghi, K. Theoretical Soil Mechanics, 1st ed.; John Wiley & Sons, Inc.: Hoboken, NJ, USA, 1943. [Google Scholar] [CrossRef]
  12. Meyerhof, G.G. The Ultimate Bearing Capacity of Foundations. Géotechnique 1951, 2, 301–332. [Google Scholar] [CrossRef]
  13. Šepac, Z. Foundation engineering structure. In Proceedings of the 7th International Conference on Road and Rail Infrastructure, Cavtat, Croatia, 15–17 May 2024. [Google Scholar]
  14. Ngo, V.L.; Lee, C.; Kim, J.M. Effects of stratification on soil–foundation–structure interaction: Centrifugal observation and numerical simulation. Appl. Sci. 2021, 11, 623. [Google Scholar] [CrossRef]
  15. Patil, N.N.; Rajashekar Swamy, H.M.; Shivashankar, R. Effect of Reinforced Soil–Structure Interaction on Foundation Settlement Characteristics of a Three-Dimensional Structure. In Innovations in Soft Computing and Information Technology: Proceedings of ICEMIT 2017; Springer: Singapore, 2019; Volume 3, pp. 135–161. [Google Scholar]
  16. Hasheminezhad, A.; Bahadori, H. Deep soil mixing columns improved the seismic response of shallow foundations over liquefiable soils. Comput. Geotech. 2019, 110, 251–273. [Google Scholar] [CrossRef]
  17. Mehrzad, B.; Haddad, A.; Jafarian, Y. Centrifuge and numerical models to investigate liquefaction-induced response of shallow foundations with different contact pressures. Int. J. Civ. Eng. 2016, 14, 117–131. [Google Scholar] [CrossRef]
  18. Borghei, A.; Ghayoomi, M.; Turner, M. Effects of Groundwater Level on Seismic Response of Soil–Foundation Systems. J. Geotech. Geoenviron. Eng. 2020, 146, 04020110. [Google Scholar] [CrossRef]
  19. Demir, S. Effect of Groundwater Level on Site Response Behavior of a One-Layered Liquefiable Soil. J. Eng. Sci. Des. 2021, 9, 796–808. [Google Scholar] [CrossRef]
  20. Yoshikawa, T.; Noda, T.; Kodaka, T.; Takaine, T. Analysis of the effect of groundwater level on the seismic behavior of an unsaturated embankment on clayey ground. Soil Dyn. Earthq. Eng. 2016, 85, 217–230. [Google Scholar] [CrossRef]
  21. Frid, A.; Frid, V. Moisture effect on asphalt dielectric permittivity: Simulating, sensitivity analysis, and experimental validation. Int. J. Pavement Res. Technol. 2024, 17, 999–1013. [Google Scholar] [CrossRef]
  22. Bekić, G. Railroad Survey Application. Application Notes. Available online: www.geoscanners.com (accessed on 5 March 2015).
  23. Kovacevic, M.S.; Gavin, K.; Stipanovic Oslakovic, I.; Bacic, M. A new methodology for assessment of railway infrastructure condition. Transp. Res. Procedia 2016, 14, 1930–1939. [Google Scholar] [CrossRef]
  24. Frid, M.; Kamai, R. Characterizing Nonlinear Effects in Vertical Site Response of Dry Soils Using KiK-Net Data. J. Earthq. Eng. 2023, 27, 2570–2586. [Google Scholar] [CrossRef]
  25. Frid, M.; Kamai, R. An analytical approach for estimating the spectral P/S ratio within ground motions. Comput. Geotech. 2020, 119, 103379. [Google Scholar] [CrossRef]
  26. Allen, N.F.; Woods, R.D.; Richart, F.E., Jr. Fluid wave propagation in saturated and nearly saturated sands. J. Geotech. Eng. Div. 1980, 106, 235–254. [Google Scholar] [CrossRef]
  27. Beresnev, I.A.; Nightengale, A.M.; Silva, W.J. Properties of vertical ground motions. Bull. Seismol. Soc. Am. 2002, 92, 3152–3164. [Google Scholar] [CrossRef]
  28. Han, B.; Zdravkovic, L.; Kontoe, S. Numerical and analytical investigation of compressional wave propagation in saturated soils. Comput. Geotech. 2016, 75, 93–102. [Google Scholar] [CrossRef]
  29. Liu, H.-W.; Tsai, C.-C. Site effect of vertical motion amplification behavior observed from downhole arrays. J. GeoEng. 2018, 13, 39–48. [Google Scholar]
  30. Gülerce, Z.; Kamai, R.; Abrahamson, N.A.; Silva, W.J. Ground motion prediction equations for the vertical ground motion component based on the NGA-W2 database. Earthq. Spectra 2017, 33, 499–528. [Google Scholar] [CrossRef]
  31. ASTM D6429-99; Standard Guide for Selecting Surface Geophysical Methods. ASTM International: West Conshohocken, PA, USA, 2017. [CrossRef]
  32. Cheng, Q.; Su, Q.; Binley, A.; Liu, J.; Zhang, Z.; Chen, X. Estimation of surface soil moisture by a multi-elevation UAV-based ground penetrating radar. Water Resour. Res. 2023, 59, e2022WR032621. [Google Scholar] [CrossRef]
  33. Guo, W.; Dong, C.; Lin, C.; Zhang, T.; Zhao, Z.; Li, J. 3D Sedimentary Architecture of Sandy Braided River, Based on Outcrop, Unmanned Aerial Vehicle and Ground Penetrating Radar Data. Minerals 2022, 12, 739. [Google Scholar] [CrossRef]
  34. Abdulraheem, M.I.; Chen, H.; Li, L.; Moshood, A.Y.; Zhang, W.; Xiong, Y.; Zhang, Y.; Taiwo, L.B.; Farooque, A.A.; Hu, J. Recent Advances in Dielectric Properties-Based Soil Water Content Measurements. Remote Sens. 2024, 16, 1328. [Google Scholar] [CrossRef]
  35. Lombardi, F.; Ortuani, B.; Facchi, A.; Lualdi, M. Assessing the Perspectives of Ground Penetrating Radar for Precision Farming. Remote Sens. 2022, 14, 6066. [Google Scholar] [CrossRef]
  36. Lombardi, F.; Podd, F.; Solla, M. From Its Core to the Niche: Insights from GPR Applications. Remote Sens. 2022, 14, 3033. [Google Scholar] [CrossRef]
  37. Klewe, T.; Strangfeld, C.; Kruschwitz, S. Review of moisture measurements in civil engineering with ground penetrating radar—Applied methods and signal features. Constr. Build. Mater. 2021, 278, 122250. [Google Scholar] [CrossRef]
  38. Bayarri, V.; Prada, A.; García, F.; De Las Heras, C.; Fatás, P. Remote Sensing and Environmental Monitoring Analysis of Pigment Migrations in Cave of Altamira’s Prehistoric Paintings. Remote Sens. 2024, 16, 2099. [Google Scholar] [CrossRef]
  39. Zayed, T.; Dawood, T.; Abouhamad, M.; Alsharqawi, M. Special Issue “Ground Penetrating Radar (GPR) Applications in Civil Infrastructure Systems”. Remote Sens. 2022, 14, 5682. [Google Scholar] [CrossRef]
  40. Altdorff, D.; Schliffke, N.; Riedel, M.; Schmidt, V.; van der Kruk, J.; Vereecken, H.; Becken, M. UAV-borne electromagnetic induction and ground-penetrating radar measurements: A feasibility test. Water Resour. Res 2014, 42, W11403. [Google Scholar]
  41. Eröss, R.; Stoll, J.B.; Bergers, R.; Tezkan, B. Three-component VLF using an unmanned aerial system as sensor platform. First Break 2013, 31. [Google Scholar] [CrossRef]
  42. Booth, A.D.; Koylass, T.M. Drone-mounted ground-penetrating radar surveying: Flight-height considerations for diffraction-based velocity analysis. Geophysics 2022, 87, WB69–WB79. [Google Scholar] [CrossRef]
  43. Shin, Y.H.; Shin, S.Y.; Rastiveis, H.; Cheng, Y.T.; Zhou, T.; Liu, J.; Habib, A. UAV-Based Remote Sensing for Detection and Visualization of Partially-Exposed Underground Structures in Complex Archaeological Sites. Remote Sens. 2023, 15, 1876. [Google Scholar] [CrossRef]
  44. Wu, S.; Wang, L.; Zeng, X.; Wang, F.; Liang, Z.; Ye, H. UAV-Mounted GPR for Object Detection Based on Cross-Correlation Background Subtraction Method. Remote Sens. 2022, 14, 5132. [Google Scholar] [CrossRef]
  45. Frid, M.; Frid, V. A Case Study of the Integration of Ground-Based and Drone-Based Ground-Penetrating Radar (GPR) for an Archaeological Survey in Hulata (Israel): Advancements, Challenges, and Applications. Appl. Sci. 2024, 14, 4280. [Google Scholar] [CrossRef]
  46. Ruols, B.; Baron, L.; Irving, J. High-density 3D and 4D GPR data acquisitions over alpine glaciers using a newly developed drone-based system (No. EGU23-9619). In Proceedings of the Copernicus Meetings, Vienna, Austria, 23–28 April 2023. [Google Scholar]
  47. Vergnano, A.; Franco, D.; Godio, A. Drone-Borne Ground Penetrating Radar for Snow Cover Mapping. Remote Sens. 2022, 14, 1763. [Google Scholar] [CrossRef]
  48. Saponaro, A.; Dipierro, G.; Cannella, E.; Panarese, A.; Galiano, A.M.; Massaro, A. A UAV-GPR Fusion Approach for the Characterization of a Quarry Excavation Area in Falconara Albanese, Southern Italy. Drones 2021, 5, 40. [Google Scholar] [CrossRef]
  49. Edemsky, D.; Popov, A.; Prokopovich, I.; Garbatsevich, V. Airborne ground penetrating radar, field test. Remote Sens. 2021, 13, 667. [Google Scholar] [CrossRef]
  50. Sulaiman, N.; Nordiana, M.M.; Azwin, I.N.; Taqiuddin, Z.M.; Maslinda, U.; Hisham, H.; Nordiana, A.N. Integration of Ground Penetrating Radar (GPR) and 2-D Resistivity Imaging methods for soil investigation. In IOP Conference Series: Earth and Environmental Science, Proceedings of the Southeast Asian Conference on Geophysics, Bali, Indonesia, 31 August–3 September 2016; IOP Publishing Ltd.: Bristol, UK, 2017; Volume 62, p. 012007. [Google Scholar]
  51. Zhang, M.; Feng, X.; Bano, M.; Xing, H.; Wang, T.; Liang, W.; Zhang, Y. Review of ground penetrating radar applications for water dynamics studies in unsaturated zone. Remote Sens. 2022, 14, 5993. [Google Scholar] [CrossRef]
  52. Klotzsche, A.; Jonard, F.; Looms, M.C.; van der Kruk, J.; Huisman, J.A. Measuring soil water content with ground penetrating radar: A decade of progress. Vadose Zone J. 2018, 17, 1–9. [Google Scholar] [CrossRef]
  53. ASTM D2487-00; Standard Practice for Classification of Soils for Engineering Purposes (Unified Soil Classification System). ASTM International: West Conshohocken, PA, USA, 2000.
  54. Zilberman, E. Geological Map of Israel, Beer Sheva, Sheet 14-IV, 1:50,000; Israel Geological Survey: Jerusalem, Israel, 2018. [Google Scholar]
  55. Annan, A.P. Electromagnetic principles of ground penetrating radar. In Ground Penetrating Radar: Theory and Applications; Jol, H.M., Ed.; Elsevier Science: Amsterdam, The Netherlands; The Boulevard: Oxford, UK, 2009. [Google Scholar]
  56. Daniels, D. Ground Penetrating Radar; The Institute of Electrical Engineers: London, UK, 2004. [Google Scholar]
  57. Huisman, J.A.; Hubbard, S.S.; Redman, J.D.; Annan, A.P. Measuring soil water content with ground penetrating radar: A review. Vadose Zone J. 2003, 2, 476–491. [Google Scholar] [CrossRef]
  58. Benedetto, A.; Pajewski, L. Civil Engineering Applications of Ground Penetrating Radar; Springer: Cham, Switzerland; Berlin/Heidelberg, Germany; New York, NY, USA; Dordrecht, The Netherlands; London, UK, 2015; 373p. [Google Scholar] [CrossRef]
  59. Zhang, D.; Zeng, Y.; Zhang, F.; Xiong, J. Contactless Vital Signs Monitoring. In WiFi CSI-Based Vital Signs Monitoring; Elsevier Inc.: Amsterdam, The Netherlands, 2022; Chapter 11; pp. 231–255. [Google Scholar] [CrossRef]
  60. Benedetto, A. Water content evaluation in unsaturated soil using GPR signal analysis in the frequency domain. J. Appl. Geophys. 2010, 71, 26–35. [Google Scholar] [CrossRef]
  61. Wu, K.; Rodriguez, G.A.; Zajc, M.; Jacquemin, E.; Clément, M.; De Coster, A.; Lambot, S. A new drone-borne GPR for soil moisture mapping. Remote Sens. Environ. 2019, 235, 111456. [Google Scholar] [CrossRef]
  62. Noviello, C.; Gennarelli, G.; Esposito, G.; Ludeno, G.; Fasano, G.; Capozzoli, L.; Soldovieri, F.; Catapano, I. An Overview on Down-Looking UAV-Based GPR Systems. Remote Sens. 2022, 14, 3245. [Google Scholar] [CrossRef]
Figure 1. The maps of the construction site under study. (a) The zoomed-out map of Israel, (b) The map of Beer Sheva city with a superimposed red triangle indicating the location of the site under study, (c) The orthophoto of the Children’s Park with the community center construction site under study marked with a red line, made right before the survey, (d) The zoomed-in fragment of the geological map of the region [54] with a superimposed red triangle indicating the location of the site under study.
Applsci 14 07889 g001aApplsci 14 07889 g001b
Figure 2. A DJI M300 drone (SZ DJI Technology Co., Ltd., Nanshan, Shenzhen, China) with a GPR 150 MHz dipole antenna at the bottom provides subsurface sensing capabilities up to 15 m below the surface. The SKYHUB computer, which is positioned on the right side, is responsible for controlling automatic flight operations. At the front of the drone, a small radar (altimeter) measures the distance from the ground, maintaining a constant flight altitude of 5 m. The survey took place around the construction site at the Children’s Park in Beer Sheva City, Israel (Figure 1c).
Applsci 14 07889 g002
Figure 3. The community center construction site (dashed red line) is enclosed by a white fence (Figure 2). The drone’s precise flight path begins and ends at the west corner of the hilltop (purple circle), capturing changes in the natural surface under the distributed clayey soil. Obstacles like streetlights, trees (marked white), and a metal fence (marked blue) are visible on the map. The numbers show the straight section of the drone flight. The yellow point in the center marks the drilling test.
Applsci 14 07889 g003
Figure 4. Airborne GPR footprint calculation, modified from [40].
Applsci 14 07889 g004
Figure 5. The unprocessed radargram with topography correction.
Applsci 14 07889 g005
Figure 6. The zoomed-in part of the processed radargram from the first survey section (waypoints 7–8, as illustrated in Figure 3 and Figure 5) offers detailed insight into subsurface structures. The horizontal and vertical axes denote path and depth distances in meters. (a) The processed radargram with clearly seen underground structures (the nearly horizontal reflections and amplification at the bottom of the radargram), (b) The dashed and full lines show the underground boundaries between layers discussed in the text.
Applsci 14 07889 g006aApplsci 14 07889 g006b
Figure 7. The photographs of the drilling campaign. (a) The drilling machine used for the campaign aborted midway, (b) The closer view around the drilling borehole reveals a distributed soil (filling) composition, primarily consisting of approximately 90% CL/ML matrix [44] and 10% random concentrations of white chalk pebbles, (c) A zoomed-in image inside the drilling borehole, depicting the presence of water at a depth of 5 m and evident collapse in the pit’s sides.
Applsci 14 07889 g007
Figure 8. This is a photograph of the construction site under study during the pile drilling campaign. Wet, brown clayey soil, stabilized with bentonite, is visible on the surface. Extracted yellow sandstone at 10 m corresponds accurately to GPR findings (Figure 6), affirming the reliability of aerial GPR for subsurface mapping in foundation engineering.
Applsci 14 07889 g008
Table 1. The list of calculated GPR parameters.
ParameterEq.Frequency, MHz
50100150
1Wavelength in air, m2632
2Speed velocity in clay, mm/ns177.5
3Wavelength in clay, m21.550.780.52
4Footprint at Earth’s surface R1, m34.242.72.1
5Footprint at target depth R2, m46.74.43.5
6Vertical resolution, m50.770.390.26
7Minimum size of a detectable object, m6222
Table 2. The list of filters applied to GPR raw data.
Filter Type
1Data Editing
2Dewow
3Static Correction
4Background Removal
5X-Interpolation by GPS Coordinates
6Median Filter
7Automatic Gain Control
8Stolt (f-k domain) Migration
Disclaimer/Publisher’s Note: The statements, opinions and data contained in all publications are solely those of the individual author(s) and contributor(s) and not of MDPI and/or the editor(s). MDPI and/or the editor(s) disclaim responsibility for any injury to people or property resulting from any ideas, methods, instructions or products referred to in the content.

