Article

Does the Transcranial Direct Current Stimulation Selectively Modulate Prefrontal Cortex Hemodynamics? An Immediate Effect-Controlled Trial on People with and without Depression

by
Laura Oliveira Campos
1,
Maria de Cassia Gomes Souza Macedo
1,
Vheyda Katheleen Vespasiano Monerat
1,
Kariny Realino do Rosário Ferreira
1,
Mayra Evelise Cunha dos Santos
1,
Arthur Ferreira Esquirio
1,
Ana Luiza Guimarães Alves
1,
Gabriela Lopes Gama
1,
Michelle Almeida Barbosa
2 and
Alexandre Carvalho Barbosa
1,*
1
Department of Physical Therapy, Laboratory of Non-Invasive Neuromodulation—LANN, Federal University of Juiz de Fora, Av. Moacir Paleta 1167, São Pedro, Governador Valadares, Juiz de Fora 36036-900, MG, Brazil
2
Department of Basic Sciences, Laboratory of Non-Invasive Neuromodulation—LANN, Federal University of Juiz de Fora, Av. Moacir Paleta 1167, São Pedro, Governador Valadares, Juiz de Fora 36036-900, MG, Brazil
*
Author to whom correspondence should be addressed.
Appl. Sci. 2024, 14(17), 7901; https://doi.org/10.3390/app14177901
Submission received: 9 August 2024 / Revised: 28 August 2024 / Accepted: 3 September 2024 / Published: 5 September 2024
(This article belongs to the Special Issue New Insights into Neurorehabilitation)

Abstract

:
Despite the recommendation to treat depression using transcranial direct current stimulation (tDCS), novel findings raise doubts over the tDCS’s efficacy in managing depressive episodes. Neurophysiologic approaches to understanding the specificities of brain responses to tDCS in patients with depression remain to be explored. Objective: Our aim was to compare immediate hemodynamic responses to tDCS on the left dorsolateral prefrontal cortex (DLPFC; F3-Fp2 montage) in patients with depressive disorder and in controls (no additional stimuli). Methods: Sixteen participants were allocated to the depression group and sixteen to the control group. Both groups received 2 mA tDCS for 20 min, using the F3-Fp2 montage. The hemodynamic effect over the DLPFC was assessed using functional near-infrared intracranial spectroscopy (fNIRS) positioned on the left supraorbital region (Fp1). Mean, minimal, and maximal values of baseline and post-stimulation rates of oxygen saturation (SatO2) were recorded. The oxygenated hemoglobin rates (HbO) were extracted. Results: Between-group differences were detected for minimal baseline rates of SatO2 and HbO levels. The depression group showed lower results compared to the control group at baseline. After the protocol, only the depression group showed increased minimal rates of SatO2 and HbO. The post-tDCS minimal rates were equal for both groups. Conclusions: The findings showed immediate anodal tDCS effects over DLPFC hemodynamics. The effects were exclusive to the lowest baseline rate group and did not affect the normal oxygen rate group. The minimal increase in SatO2 and HbO rates after the protocol in the depression group suggests that those with reduced cerebral perfusion may be more affected by tDCS.

1. Introduction

The latest evidence-based guideline for the use of tDCS in neurological and psychiatric disorders recommends anodal left dorsolateral prefrontal cortex stimulation with tDCS as definitely effective in treating depression [1]. Another network meta-analysis showed anodal tDCS over the frontal lobe (F3-F4 montage), significantly improving depressive symptoms compared to sham controls, with higher response rates than other types of non-invasive brain stimulation [2]. However, novel findings of two large sample randomized controlled studies raised doubts over tDCS’s efficacy [3,4]. Unsupervised home-use tDCS was used alone or combined with a digital psychological intervention or digital placebo. Both studies found that tDCS was not superior to sham controls in managing major depressive episodes. These findings are in line with other reviews, arguing that the effectiveness of tDCS on treatment-resistant depression is limited [5,6]. Some possible explanations for conflicting results may be the inadequacy of dose–response, the sample anatomy’s variability in terms of individual vascular complexity, or even the high heterogeneity among the interventions and assessment protocols used in distinct studies. As consensus has not yet been achieved, the mechanistic and neurophysiologic approach to understanding specificities of brain responses to tDCS stimuli in patients with depression compared to controls continues to stand as a key feature for continuous basic and clinical research.
The effects of tDCS on cortical neurovascular tissue go beyond the impacts on neuronal activity [7]. Instead, there is evidence that tDCS neurovascular modulation targets the entire tissue: the neurons, glia, endothelial cells, and the extracellular processes involved in brain transport, such as changes in viscosity accompanied by changes in the osmotic flow [8,9]. The complex interaction among these factors would provoke specific responses in each person, mainly driven by the subject’s baseline characteristics or even by the type of disorder affecting the neural system [10].
Neurovascular modulation is a widely discussed topic concerning cortical response to tDCS in patients with depression [8]. Marked abnormalities were found in patients with depression compared to those without depression, mainly in blood oxygen rates of the bilateral ventrolateral prefrontal cortex and bilateral dorsolateral prefrontal cortex (DLPFC) [11]. As these patients exhibit dysregulated cerebral blood flow [12]—which is a major and distinctive pattern compared to people without depression, hemodynamic balance would be essential to provide tissue homeostasis followed by disease-associated behavioral improvements.
Functional near-infrared spectroscopy (fNIRS) is a non-invasive optical imaging technique that relies on the difference in the absorption of NIR light between oxyhemoglobin (HbO) and deoxyhemoglobin (HbR) [13]. The technique quantifies the hemoglobin concentration changes using variations in the absorbed light intensity measured by emitting continuous wave light through the skull into the brain [11,14]. The fNIRS technique has been proposed as a less expensive alternative over fMRI to assess brain blood flow [13]. However, fNIRS has usually been used in combination with cognitive or motor tasks in order to activate specific cortical regions of interest without isolating the tDCS effect itself. Other approaches to clarify the tDCS’s effects on brain hemodynamics in people with and without depression would allow clearer clinical perspectives on tDCS’s usefulness in patients with depression.
SatO2 refers to the percentage of hemoglobin that is saturated with oxygen relative to the total hemoglobin (both oxygenated and deoxygenated). It provides a snapshot of the efficiency of oxygen delivery and utilization in the brain. High oxygen saturation levels generally indicate adequate oxygenation, while low levels may signal hypoxia or impaired oxygen delivery. SatO2 also indicates the proportion of oxygenated hemoglobin, but it does not give information about the actual amount of oxygen being transported. A high saturation percentage could be misleading if the total hemoglobin is low, resulting in insufficient oxygen supply despite high saturation [10,11,15,16,17].
The HbO level indicates the absolute concentration of oxygenated hemoglobin in the blood, providing information about the total amount of oxygen being carried by the blood to the brain, which is crucial for understanding the brain’s oxygen supply. High levels of oxyhemoglobin reflect good oxygen delivery, while low levels may indicate inadequate oxygenation. HbO is the absolute amount of oxygen available in the blood, which is crucial for understanding the actual oxygen delivery capacity. It can also indicate adequate or inadequate oxygen delivery regardless of the saturation percentage. For instance, high oxyhemoglobin levels ensure adequate oxygen supply even if saturation varies within normal limits [10,11,15,16,17].
Thus, the primary aim of the present study was to compare the immediate differences in response to applying tDCS over the left DLPFC (F3-Fp2 montage) in patients with depressive disorder and without (controls) with no additional stimuli. Secondarily, the current study aimed to compare between-group baseline differences in both people with and without depression.

2. Materials and Methods
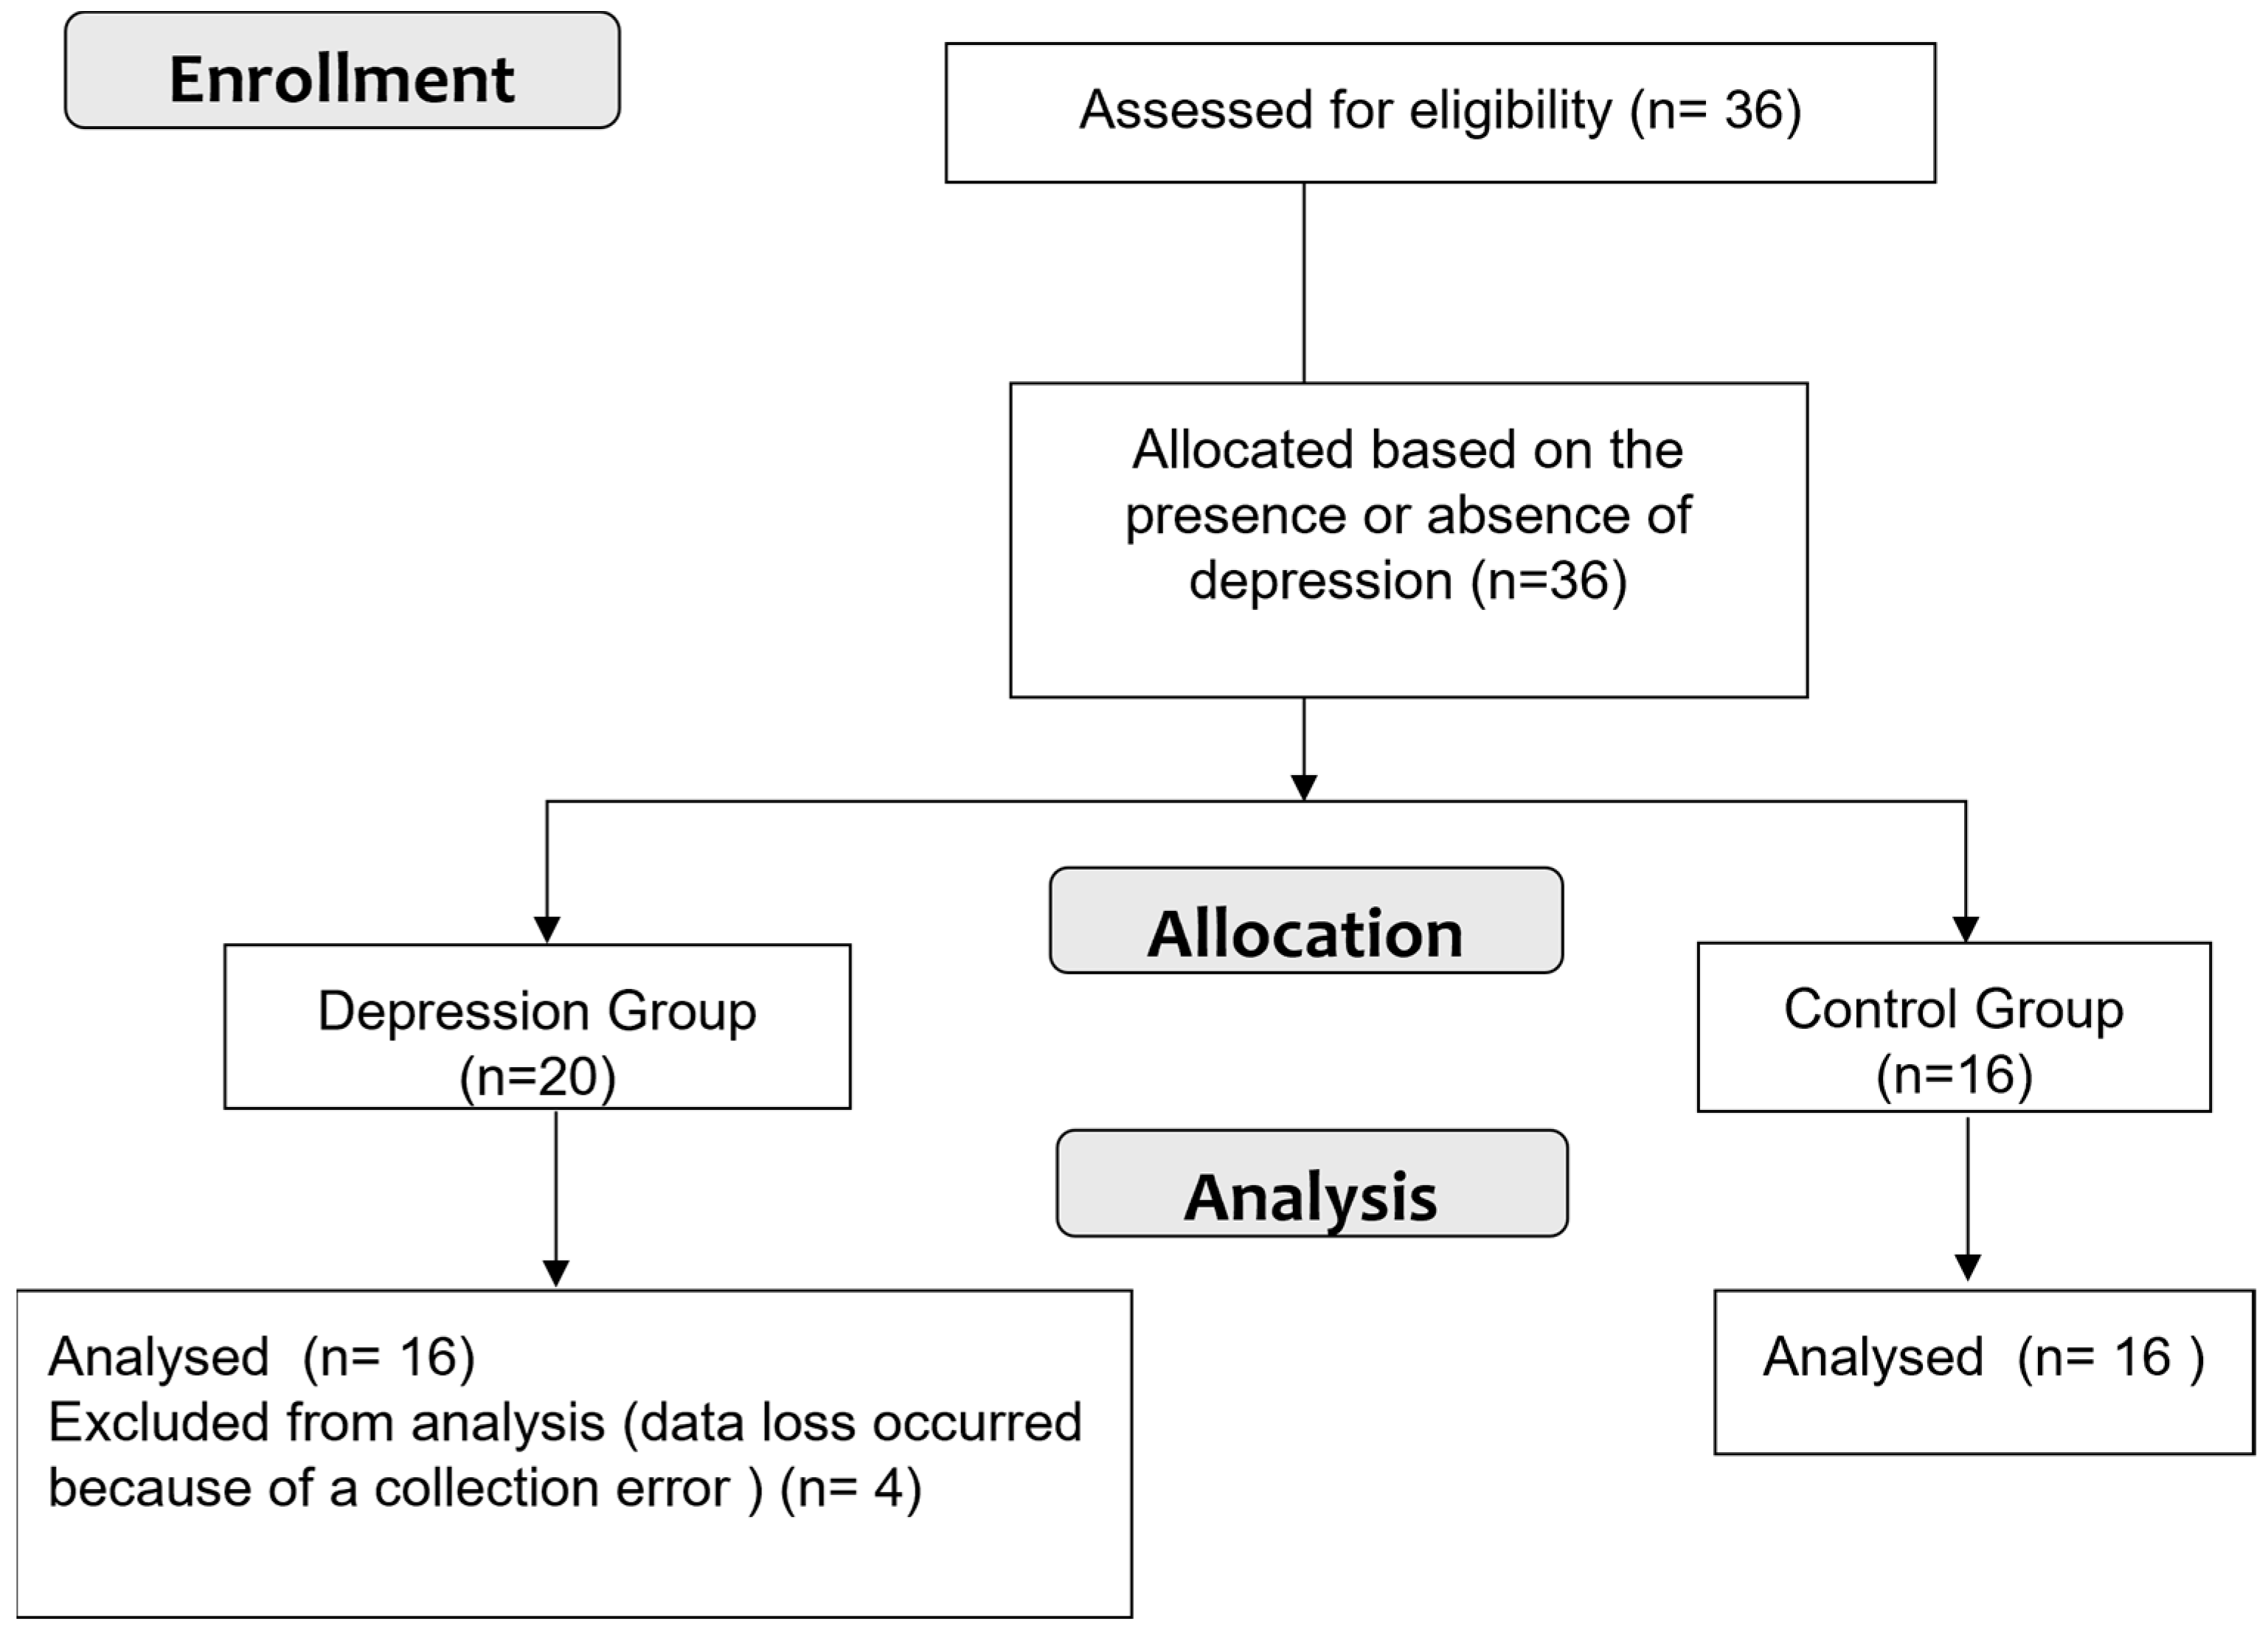
2.1. Participants

Thirty-two participants of both sexes were enrolled in this study. A two-tailed a priori sample calculation was performed with an α level of 0.05, an expected power (1 − β) of 0.80, and an effect size of 0.66, obtained from the effect size for major depression disorder from a previous study [1]. Considering a potential sample loss of 30%, the final sample was divided into 2 groups: the depression group (n = 16) and the control group (n = 16), both receiving tDCS. Figure 1 shows the flowchart. The participants provided their informed consent to participate in the study, conducted in accordance with the Declaration of Helsinki and approved by the Ethics Committee of the Federal University of Juiz de Fora (number 67611823.0.0000.5147). The trial was registered in the Brazilian clinical trials registry (number RBR-42xvqrz). Inclusion criteria were as follows: For the depression group, participants had to be aged between 18 and 45 years, with a diagnosis of mild-to-moderate depressive disorder reported by a psychiatrist and/or psychologist (the Beck depression inventory was used to establish the presence of depressive symptoms along with the rater’s anamnesis). For the control group, the participants had to be between 18 and 45 years old, with no symptoms or diagnosis of any neuropsychiatric or neurological disorders, and were also assessed by a certified psychologist and physical therapist. Exclusion criteria were set as follows: participants with epilepsy, those using anticonvulsant medication and/or experiencing sleep deprivation, patients with metallic implants inside or near the head (e.g., cochlear implant, implanted/stimulator electrodes, aneurysm clips or coils, projectile fragments, jewelry, and hair clips), patients with cardiac pacemakers, stents, or other active devices whose interaction with the electric field may interfere with their functioning, and patients with eczema of the head.
All participants were assessed to determine their adherence to inclusion and exclusion criteria. Personal information and contacts were also collected during the anamnesis process. All data were collected at the Laboratory of Non-Invasive Neuromodulation—LANN—of the Federal University of Juiz de Fora.

2.2. Transcranial Direct Current Stimulation (tDCS)

The tDCS was performed using a continuous current of 2 mA, delivered for 20 min through two rubber electrodes wrapped in a saline solution-soaked sponge (5 cm × 7 cm = 35 cm2 each) to improve contact between the electrodes and the scalp. The positioning of the electrodes followed the 10–20 EEG coordinates system [2]. The anode was positioned over the left DLPFC (F3), and the cathode was positioned over the right supraorbital region (Fp2). A 30 s ramp-up started the current until the 2 mA target was achieved. The current remained constant for 20 min and then gradually faded to 0 mA with a 30 s ramp-down.

2.3. fNIRS Recording

The effect of tDCS on brain cortical activity was assessed using a functional near-infrared intracranial spectroscopy (fNIRS) system (Humon Hex, Dynometrics Inc., Boston, MA, USA). This is a 60.5 × 57 × 13.8 mm device weighting ~32 g that wirelessly connects through Bluetooth to a smartphone (Humon Hex, Dynometrics Inc., Boston, MA, USA, retrieved from http://humon.es) and it shows the automatically calculated and real-time O2 saturation level as a percentage (SatO2). The equipment has infrared light emitters and sensors that capture the differences in the spectrum between oxyhemoglobin (HbO) and deoxyhemoglobin (HbR), which have different levels of light absorption. Previous studies have demonstrated that HbO concentration changes are more sensitive than other Hb concentration changes in reflecting alterations in regional cerebral blood flow [18,19]. Thus, the HbO concentration was chosen as the main outcome for hemodynamic changes. The raw data obtained by the Humon sensor were extracted, and the averages of the baseline and post-stimulation periods were calculated.

2.4. Experimental Testing

The fNIRS sensor was positioned on the left supraorbital region (Fp1), and the electrodes were placed in the F3 (anode) and Fp2 (cathode) regions, fastened with a headband for the tDCS intervention. The fNIRS sensor was then activated, and the SatO2 baseline was recorded. After 2 min, tDCS was applied for 20 min. Following the intervention, tDCS was switched off while the SatO2 levels were continuously monitored for an additional 2 min (post-stimulation period).

2.5. Statistical Analysis

Data were presented as mean and standard deviations. The average, minimal, and maximal rates of oxygen saturation (SatO2) and oxyhemoglobin (HbO) from pre- and post-tDCS intervals were analyzed. The Shapiro–Wilk and Levene’s tests were used to assess the normality and the homogeneity, respectively. As data were normally distributed, factorial ANOVA with repeated measures was used to track between-group and within-group differences. When applicable, Bonferroni’s post hoc test was applied for pairwise comparisons, avoiding multiple testing. The standardized differences for the comparisons of all variables were obtained using Cohen’s d effect sizes (ES). The magnitude of ES was qualitatively interpreted using the following thresholds: <0.2, trivial; 0.2–0.6, small; 0.6–1.2, moderate; 1.2–2.0, large; 2.0–4.0, very large; and >4.0, nearly perfect [20]. The JAMOVI software (JAMOVI project [2020]. Version 2.4.11) was used for all testing analyses. The significance level was set at p < 0.05.

3. Results

According to the sample size calculation, 16 participants would be allocated to each group (n = 32 participants, Table 1). A total of 36 participants were recruited. Four participants were excluded from the depression group, as shown in Figure 1. Another four participants were then allocated in order to reach the minimal sample size. Thus, each group was composed of 16 participants. Participants were recruited from March to December 2023.

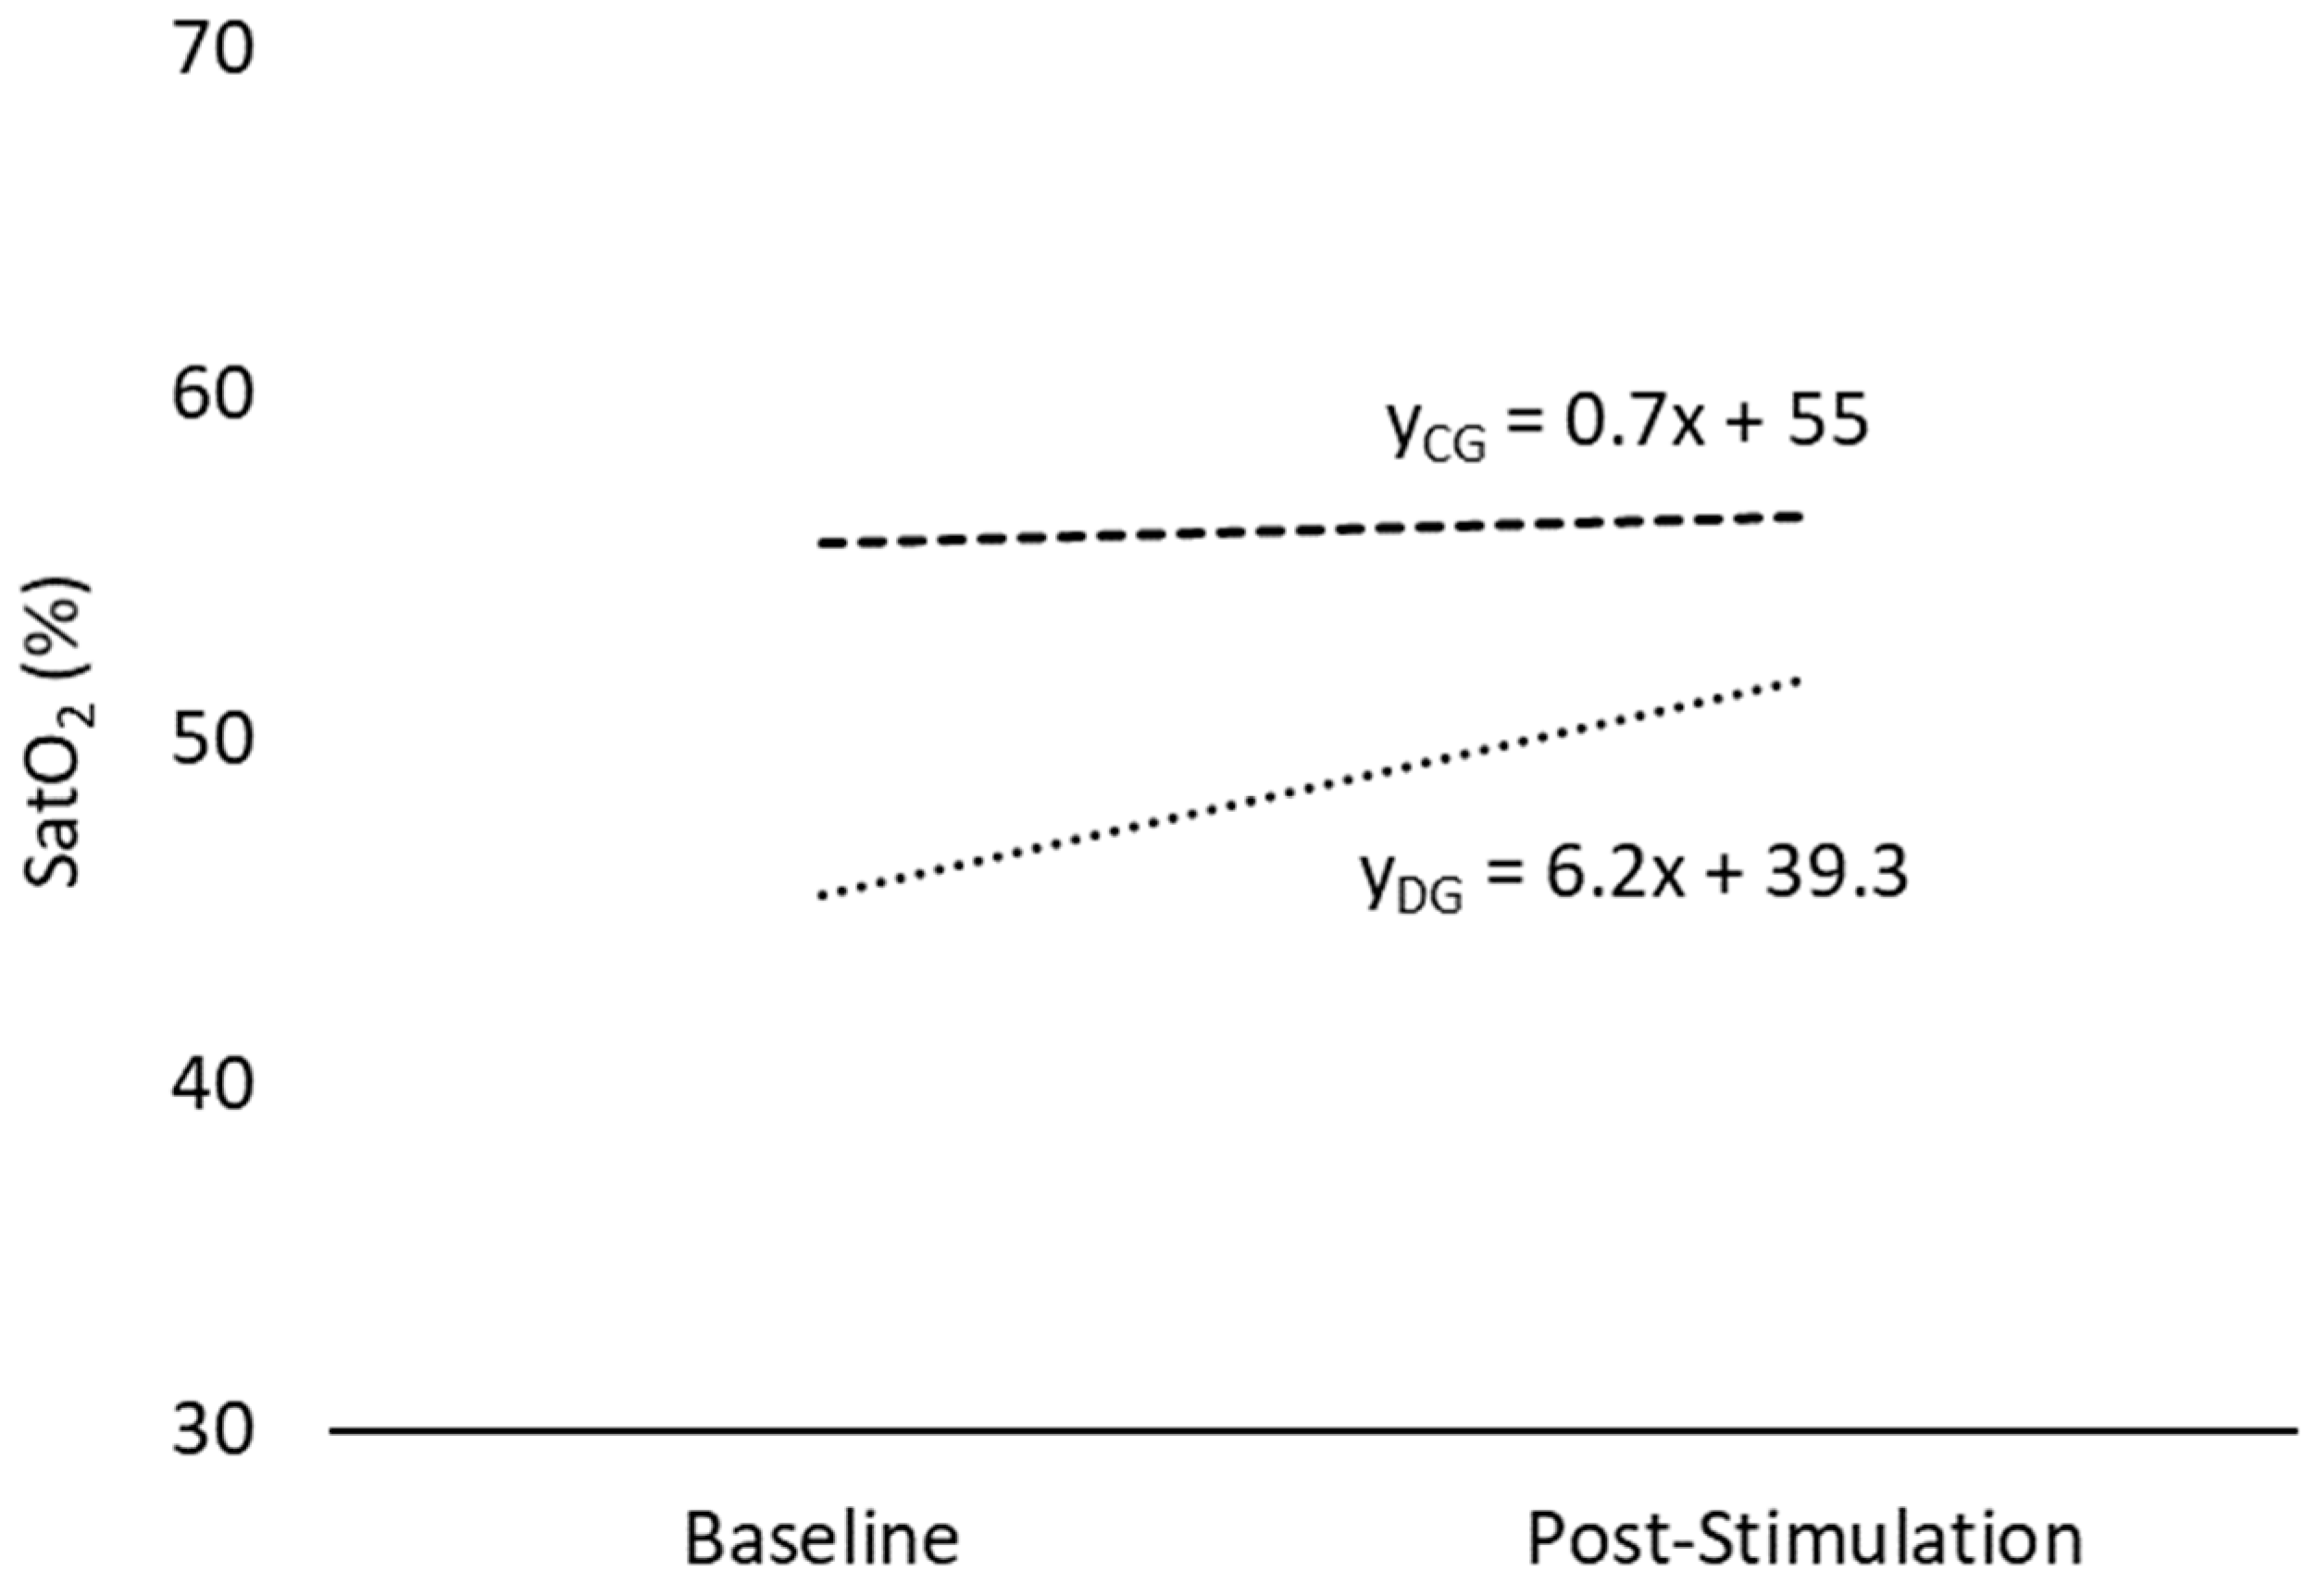
3.1. Oxygen Saturation (SatO2)

Table 2 summarizes the SatO2 pairwise comparisons. Only the minimum rate of SatO2 showed a significant factor difference (F = 4.39, p = 0.04). The post hoc analysis showed that the depression group’s baseline rate was different from that of the baseline control group (ES = 0.88 [moderate]) and also from the depression group’s post-tDCS rates (ES = 0.80 [moderate]). However, no difference was found when comparing the depression post-tDCS rate with the control post-tDCS rate (ES = 0.43 [small]). Figure 2 illustrates the trend for both groups considering the regression equation between the assessments. As expected, the depression group slope showed a relevant positive value (6.2) compared to the control group (0.7). The result indicates that the depression group’s minimum SatO2 rate was equalized to the control levels after the tDCS protocol.

3.2. Oxyhemoglobin (HbO)

The HbO results are presented in Table 3. Conversely to SatO2, the control group had higher levels of minimal HbO compared to the depression group at baseline (F = 4.62, p = 0.04), with a moderate ES of 0.97. However, both groups showed the same levels of HbO after tDCS, as no differences were detected in any variable. The control group showed no within-group differences, as the HbO levels did not change after tDCS for any variable. The maximal levels of HbO were also the same for both groups at any time point.

4. Discussion

The present findings confirm the previously postulated hypothesis: as the depression group was the only group affected by the tDCS protocol, it suggests that the participants’ baseline characteristics drive their cortical hemodynamic response to tDCS. The baseline minimum rates of SatO2, along with the minimum HbO values, were significantly lower in the depression group compared to the control group. Additionally, after the protocol, only the depression group showed increased levels of minimal SatO2, while the control group’s SatO2 and HbO responses remained unchanged during the intervention, with a relevant positive trend for the depression group. Using minimum, maximum, and mean values of brain oxygen saturation in fNIRS analysis provides a more comprehensive understanding of the brain’s oxygenation status. The mean values offer a general indication of the brain’s overall oxygenation status and can be useful for identifying baseline oxygen levels or changes due to an intervention. However, the minimum rates can help identify periods of potential hypoxia or critical low points that could indicate issues such as impaired blood flow, metabolic demand exceeding supply, or other pathological conditions. Understanding the minimum oxygenation level is crucial for assessing the safety and potential risks to brain health. On the other hand, maximum rates are able to highlight periods of hyperoxia or peak oxygenation. This information is valuable for understanding the upper limits of oxygenation and ensuring that they are within safe physiological ranges. It can also indicate the brain’s capacity to increase oxygen supply when needed [17,21].
The present study reinforces the idea that anodal stimulation may increase the cortex hemodynamic response. An fMRI-based study showed that a range of anodal intensities applied over the primary motor cortex increased the cerebral blood flow under the electrode, with 2 mA increasing the greatest (15.3%) compared to sham controls [22]. In fact, pre-clinical studies have already shown that both vasodilation and increased blood flow could be the primary responses of the vessels to tDCS [14,23]. The increase in neuronal resting membrane potentials could be then a secondary response, along with the increased likelihood of neuron depolarization. In turn, increased neuronal activity would also require some neurovascular coupling adaptations mediated by brain perfusion [24].
Contradictory to the present findings, an fNIRS-based study of local cerebral oxygenation during tDCS in patients with mild traumatic brain injury found that tDCS leads to a decrease in the local brain oxygenation values on the anodal side of between 8 and 12 min in 3–5 days post-injury [25]. Conversely, another study showed that anodal tDCS did not elicit any consistent, instantaneous, or dose-dependent cerebral blood flow increases in the specific targeted hand primary motor cortex at conventional intensity ranges [26]. On the other hand, a study showed that tDCS had positive effects on people with depression with cerebral vascular impairments compared to sham controls [27]. This particular type of depression is often less responsive to drug treatment. The results showed that 58% of inpatients achieved remission when receiving two daily sessions of tDCS. The same group had a response rate of 68%, whereas the sham group had no response at all. Conversely, a systematic review with meta-analysis showed improved cognitive performance and increased HbO in response to tDCS intervention [24], although some potential confounders had to be pointed out, such as the moderate heterogeneity for HbO responses and the large variation in the tasks used to assess cognitive performance. Another study applied tDCS 1 mA bilaterally on the prefrontal cortex (anode left on Fp1 and cathode right on Fp2) [28]. The results showed a peak of HbO in the bilateral prefrontal region 4 min after the end of stimulation and before returning to baseline levels. The effect was more pronounced under the left anode when 15 min of stimulation was preferred over 10 min.
The present baseline hemodynamic response of the group with depression showed lower levels of SatO2 and HbO compared to controls, suggesting that people with depression have marked abnormalities of the prefrontal cortex oxygenation. A recent case–control meta-analysis and meta-regression showed decreased cerebral blood flow in the inferior frontal gyrus, insula, middle occipital gyrus, and bilateral superior temporal gyrus in all patients with major depressive disorder [29]. Another study compared controls with no prior history of psychiatric disorder to a database of SPECT scans of suicidal patients, all diagnosed with the major depressive disorder [30]. The results showed hypoperfusion bilaterally in the superior/medial prefrontal cortex in the cohort of completed suicides compared to controls. Depression is considered a strong comorbid factor, with potential deficits in tasks associated with this region, including attention, memory, and executive function. Finally, in accordance with the present findings, another previous study showed the abnormal resting state of corticolimbic blood flow in unmedicated patients with depression [30]. In this particular cited study, the resting blood flow in patients with depression was correlated with the severity of depression based on Hamilton’s scale scores.
Some limitations must be addressed. The present study was designed to produce immediate results in a specific cohort of patients and controls. Distinct baseline characteristics, such as the level of impairment, age, and sex distribution, may alter the observed outcomes. The present study also lacked a sham group. The groups were not age-homogeneous. Nevertheless, when age was applied as a covariate, no changes were detected in the present results. The findings were restricted to the assessed prefrontal area. Thus, other interactions among cortical areas were not considered in discussing the results. The electrode positioning was the same for all patients. The 10–20 system was the only adopted setting to account for skull variability. Procedures such as neuro navigation or computational modeling were not available in the laboratory’s facilities. fNIRS primarily measures hemodynamic responses in the cortical surface of the brain, as near-infrared light cannot penetrate deeply into brain tissue. This means that limited sensitivity to activity occurring in deeper brain structures is evident, such as the hippocampus or thalamus. fNIRS also relies on hemodynamic responses, which are slower than the actual neuronal activity they reflect. Thus, a delay between the neuronal event and its detection is expected, limiting its temporal resolution. Variations in skull thickness can also affect the absorption and scattering of near-infrared light, potentially leading to differences in signal quality and reliability. Nevertheless, the acquired data followed the same protocol for all participants, which minimizes the effect of all the above-mentioned limitations. Caution must be taken when extrapolating the present findings to clinical implications. The immediate effects only allow physiological inferences, and longer prospective studies would be more feasible to assess the symptoms outcomes. Finally, conventional tDCS was chosen for this study due to its wider availability in clinical settings. Other devices and montages, such as HD-tDCS or individualized HD-tDCS, may produce different results.

5. Conclusions

The current findings highlight the anodal tDCS’s immediate effect when applied to the DLPFC. The impacts of the minimal SatO2 rate right after the protocol for the group with depression only suggest that people with decreased perfusion may be selectively more affected than those without impaired brain hemodynamics. The present findings suggest a selective effect on those with altered minimum SatO2 levels, identifying potential hypoxia or critical low points, which could signal issues such as impaired blood flow, an imbalance between metabolic demand and supply, or other pathological conditions.

Author Contributions

Conceptualization, L.O.C., M.d.C.G.S.M., K.R.d.R.F., M.E.C.d.S., G.L.G., M.A.B. and A.C.B.; methodology, L.O.C., M.d.C.G.S.M., K.R.d.R.F., M.E.C.d.S., G.L.G., M.A.B. and A.C.B.; formal analysis, L.O.C. and A.C.B.; investigation, L.O.C., V.K.V.M., A.F.E. and A.L.G.A.; data curation, V.K.V.M., A.F.E. and A.L.G.A.; writing—original draft preparation, L.O.C., M.d.C.G.S.M., V.K.V.M., K.R.d.R.F., M.E.C.d.S., A.F.E., A.L.G.A., G.L.G., M.A.B. and A.C.B.; writing—review and editing, L.O.C., M.d.C.G.S.M., K.R.d.R.F., M.E.C.d.S. and A.C.B.; visualization, L.O.C.; supervision, L.O.C. and A.C.B.; project administration, L.O.C., G.L.G. and M.A.B. All authors have read and agreed to the published version of the manuscript.

Funding

This study was supported, in part, by the Coordenação de Aperfeiçoamento de Pessoal deNível Superior—Brasil (CAPES)—Finance Code 001 and by the Fundação de Amparo à Pesquisade Minas Gerais (FAPEMIG)—number APQ 02040/18. This research was funded by the Federal University of Juiz de Fora.

Institutional Review Board Statement

The study was conducted in accordance with the Declaration of Helsinki and approved by Ethics Committee of the Federal University of Juiz de Fora on 12 April 2023 (protocol code 67611823.0.0000.5147). The trial was registered in the Brazilian clinical trials registry (number RBR-42xvqrz).

Informed Consent Statement

Informed consent was obtained from all subjects involved in this study.

Data Availability Statement

The data presented in this study are openly available in Mendeley Data at [31].

Conflicts of Interest

The authors declare no conflicts of interest.

References

  1. Fregni, F.; El-Hagrassy, M.M.; Pacheco-Barrios, K.; Carvalho, S.; Leite, J.; Simis, M.; Brunelin, J.; Nakamura-Palacios, E.M.; Marangolo, P.; Venkatasubramanian, G.; et al. Evidence-Based Guidelines and Secondary Meta-Analysis for the Use of Transcranial Direct Current Stimulation in Neurological and Psychiatric Disorders. Int. J. Neuropsychopharmacol. 2021, 24, 256–313. [Google Scholar] [CrossRef] [PubMed]
  2. Hsu, C.-W.; Chou, P.-H.; Brunoni, A.R.; Hung, K.-C.; Tseng, P.-T.; Liang, C.-S.; Carvalho, A.F.; Vieta, E.; Tu, Y.-K.; Lin, P.-Y.; et al. Comparing Different Non-Invasive Brain Stimulation Interventions for Bipolar Depression Treatment: A Network Meta-Analysis of Randomized Controlled Trials. Neurosci. Biobehav. Rev. 2024, 156, 105483. [Google Scholar] [CrossRef]
  3. Borrione, L.; Cavendish, B.A.; Aparicio, L.V.M.; Luethi, M.S.; Goerigk, S.; Carneiro, A.M.; Valiengo, L.; Moura, D.O.; de Souza, J.P.; Baptista, M.; et al. Home-Use Transcranial Direct Current Stimulation for the Treatment of a Major Depressive Episode. JAMA Psychiatry 2024, 81, 329–337. [Google Scholar] [CrossRef] [PubMed]
  4. Kim, J.; Park, S.; Kim, H.; Roh, D.; Kim, D.H. Home-Based, Remotely Supervised, 6-Week TDCS in Patients With Both MCI and Depression: A Randomized Double-Blind Placebo-Controlled Trial. Clin. EEG Neurosci. 2023, 55, 15500594231215847. [Google Scholar] [CrossRef]
  5. Meron, D.; Hedger, N.; Garner, M.; Baldwin, D.S. Transcranial Direct Current Stimulation (TDCS) in the Treatment of Depression: Systematic Review and Meta-Analysis of Efficacy and Tolerability. Neurosci. Biobehav. Rev. 2015, 57, 46–62. [Google Scholar] [CrossRef]
  6. Palm, U.; Hasan, A.; Strube, W.; Padberg, F. TDCS for the Treatment of Depression: A Comprehensive Review. Eur. Arch. Psychiatry Clin. Neurosci. 2016, 266, 681–694. [Google Scholar] [CrossRef]
  7. Khadka, N.; Bikson, M. Neurocapillary-Modulation. Neuromodulation 2022, 25, 1299–1311. [Google Scholar] [CrossRef]
  8. Bikson, M. Transcranial Direct Current Stimulation and Neurovascular Modulation. Eur. J. Neurol. 2023, 30, 802–803. [Google Scholar] [CrossRef]
  9. Gellner, A.; Frase, S.; Reis, J.; Fritsch, B. Direct Current Stimulation Increases Blood Flow and Permeability of Cortical Microvasculature in Vivo. Eur. J. Neurol. 2023, 30, 362–371. [Google Scholar] [CrossRef]
  10. Yang, D.; Shin, Y.-I.; Hong, K.-S. Systemic Review on Transcranial Electrical Stimulation Parameters and EEG/FNIRS Features for Brain Diseases. Front. Neurosci. 2021, 15, 629323. [Google Scholar] [CrossRef]
  11. Chao, J.; Zheng, S.; Wu, H.; Wang, D.; Zhang, X.; Peng, H.; Hu, B. FNIRS Evidence for Distinguishing Patients With Major Depression and Healthy Controls. IEEE Trans. Neural Syst. Rehabil. Eng. 2021, 29, 2211–2221. [Google Scholar] [CrossRef]
  12. Kang, L.; Wang, W.; Nie, Z.; Gong, Q.; Yao, L.; Xiang, D.; Zhang, N.; Tu, N.; Feng, H.; Zong, X.; et al. Dysregulated Cerebral Blood Flow, Rather than Gray Matter Volume, Exhibits Stronger Correlations with Blood Inflammatory and Lipid Markers in Depression. Neuroimage Clin. 2024, 41, 103581. [Google Scholar] [CrossRef] [PubMed]
  13. Lu, H.; Zhang, Y.; Qiu, H.; Zhang, Z.; Tan, X.; Huang, P.; Zhang, M.; Miao, D.; Zhu, X. A New Perspective for Evaluating the Efficacy of tACS and tDCS in Improving Executive Functions: A Combined tES and fNIRS Study. Hum. Brain Mapp. 2024, 45, e26559. [Google Scholar] [CrossRef] [PubMed]
  14. Wachter, D.; Wrede, A.; Schulz-Schaeffer, W.; Taghizadeh-Waghefi, A.; Nitsche, M.A.; Kutschenko, A.; Rohde, V.; Liebetanz, D. Transcranial Direct Current Stimulation Induces Polarity-Specific Changes of Cortical Blood Perfusion in the Rat. Exp. Neurol. 2011, 227, 322–327. [Google Scholar] [CrossRef] [PubMed]
  15. Sato, H.; Yahata, N.; Funane, T.; Takizawa, R.; Katura, T.; Atsumori, H.; Nishimura, Y.; Kinoshita, A.; Kiguchi, M.; Koizumi, H.; et al. A NIRS–FMRI Investigation of Prefrontal Cortex Activity during a Working Memory Task. Neuroimage 2013, 83, 158–173. [Google Scholar] [CrossRef]
  16. Poorzargar, K.; Pham, C.; Ariaratnam, J.; Lee, K.; Parotto, M.; Englesakis, M.; Chung, F.; Nagappa, M. Accuracy of Pulse Oximeters in Measuring Oxygen Saturation in Patients with Poor Peripheral Perfusion: A Systematic Review. J. Clin. Monit. Comput. 2022, 36, 961–973. [Google Scholar] [CrossRef]
  17. Tsukuda, J.; Fujitani, S.; Rahman, M.; Morisawa, K.; Kawaguchi, T.; Taira, Y. Monitoring Tissue Oxygenation Index Using Near-infrared Spectroscopy during Pre-hospital Resuscitation among Out-of-hospital Cardiac Arrest Patients: A Pilot Study. Scand. J. Trauma. Resusc. Emerg. Med. 2021, 29, 42. [Google Scholar] [CrossRef]
  18. Pizzagalli, D.A.; Roberts, A.C. Prefrontal Cortex and Depression. Neuropsychopharmacology 2022, 47, 225–246. [Google Scholar] [CrossRef] [PubMed]
  19. Cheng, Y.C.; Kuo, P.H.; Su, M.I.; Huang, W.L. The Efficacy of Non-Invasive, Non-Convulsive Electrical Neuromodulation on Depression, Anxiety and Sleep Disturbance: A Systematic Review and Meta-Analysis. Psychol. Med. 2022, 52, 801–812. [Google Scholar] [CrossRef]
  20. Hopkins, W.G.; Marshall, S.W.; Batterham, A.M.; Hanin, J. Progressive Statistics for Studies in Sports Medicine and Exercise Science. Med. Sci. Sports Exerc. 2009, 41, 3–13. [Google Scholar] [CrossRef]
  21. Hamaoka, T.; McCully, K.K. Review of Early Development of Near-Infrared Spectroscopy and Recent Advancement of Studies on Muscle Oxygenation and Oxidative Metabolism. J. Physiol. Sci. 2019, 69, 799–811. [Google Scholar] [CrossRef]
  22. Jamil, A.; Batsikadze, G.; Kuo, H.; Meesen, R.L.J.; Dechent, P.; Paulus, W.; Nitsche, M.A. Current Intensity- and Polarity-specific Online and Aftereffects of Transcranial Direct Current Stimulation: An FMRI Study. Hum. Brain Mapp. 2020, 41, 1644–1666. [Google Scholar] [CrossRef]
  23. Hu, S.; Zheng, T.; Dong, Y.; Du, J.; Liu, L. Effect of Anodal Direct-Current Stimulation on Cortical Hemodynamic Responses With Laser-Speckle Contrast Imaging. Front. Neurosci. 2018, 12, 503. [Google Scholar] [CrossRef]
  24. Figeys, M.; Zeeman, M.; Kim, E.S. Effects of Transcranial Direct Current Stimulation (TDCS) on Cognitive Performance and Cerebral Oxygen Hemodynamics: A Systematic Review. Front. Hum. Neurosci. 2021, 15, 623315. [Google Scholar] [CrossRef]
  25. Trofimov, A.O.; Agarkova, D.I.; Sergeev, D.; Dubrovin, A.; Trofimova, K.A.; Novosadova, O.; Martynov, D.; Lidji-Goryaev, K.; Bragin, D.E. NIRS-Based Study of Local Cerebral Oxygenation During Transcranial Direct Current Stimulation in Patients with Mild Traumatic Brain Injury. In Advances in Experimental Medicine and Biology; Springer International Publishing: Cham, Switherland, 2022; Volume 1395, pp. 59–63. ISBN 9783031141904. [Google Scholar]
  26. Liu, M.L.; Karabanov, A.N.; Piek, M.; Petersen, E.T.; Thielscher, A.; Siebner, H.R. Short Periods of Bipolar Anodal TDCS Induce No Instantaneous Dose-Dependent Increase in Cerebral Blood Flow in the Targeted Human Motor Cortex. Sci. Rep. 2022, 12, 9580. [Google Scholar] [CrossRef]
  27. Zanardi, R.; Poletti, S.; Prestifilippo, D.; Attanasio, F.; Barbini, B.; Colombo, C. Transcranial Direct Current Stimulation: A Novel Approach in the Treatment of Vascular Depression. Brain Stimul. 2020, 13, 1559–1565. [Google Scholar] [CrossRef]
  28. Merzagora, A.C.; Foffani, G.; Panyavin, I.; Mordillo-Mateos, L.; Aguilar, J.; Onaral, B.; Oliviero, A. Prefrontal Hemodynamic Changes Produced by Anodal Direct Current Stimulation. Neuroimage 2010, 49, 2304–2310. [Google Scholar] [CrossRef]
  29. Wang, Y.; Yang, Z. Aberrant Pattern of Cerebral Blood Flow in Patients with Major Depressive Disorder: A Meta-Analysis of Arterial Spin Labelling Studies. Psychiatry Res. Neuroimaging 2022, 321, 111458. [Google Scholar] [CrossRef]
  30. Willeumier, K.; Taylor, D.V.; Amen, D.G. Decreased Cerebral Blood Flow in the Limbic and Prefrontal Cortex Using SPECT Imaging in a Cohort of Completed Suicides. Transl. Psychiatry 2011, 1, e28. [Google Scholar] [CrossRef]
  31. Barbosa, A. Does tDCS Selectively Modulate the Pre-Frontal Cortex Hemo-Dynamics? An Immediate Effect-Controlled Trial on Depressed and Healthy People. Mendeley Data, V1. 2024. Available online: https://data.mendeley.com/datasets/vgpm3sx7pz/1 (accessed on 1 August 2024).
Figure 1. Flowchart of participant enrollment, allocation, and analysis in accordance with CONSORT guidelines. In the depression group, 16 participants were analyzed, with 4 participants excluded due to data loss caused by a collection error. All 16 participants in the control group were analyzed.
Applsci 14 07901 g001
Figure 2. Oxygen saturation (SatO2) group trends with regression equations. Legend: DG = depression group; CG = control group.
Applsci 14 07901 g002
Table 1. Participants’ characteristics.
CharacteristicsDepression GroupControl Groupp-Value
Mean ± SDn (%)Mean ± SDn (%)
Sex
   Male 4 (25) 3 (18.75)ns
   Female 12 (75) 13 (81.25)
Age (years)36.4 ± 18.9 24.1 ± 2.29 <0.001 *
Weight (kg)69.4 ± 16.8 71.1 ± 14.1 ns
Height (m)1.65 ± 0.07 1.67 ± 0.04 ns
(BMI)25.5 ± 5.5 25.3 ± 4.10 ns
Legend: BMI = body mass index; ns = non-significant * Significant difference assigned. Note: sex frequency differences were assessed using the chi-square test.
Table 2. Within- and between-group differences for oxygen saturation (SatO2).
Outcome (%)Depression Group (n = 16)
Mean ± SD
Within-Group
Differences
Control Group (n = 16)
Mean ± SD
Within-Group
Differences
Between-Group
Differences
BaselinePost-StimulationBaselinePost-StimulationBaselinePost-Stimulation
Mean51.1 ± 7.3553.7 ± 10.0ns57.3 ± 5.4657.8 ± 5.52nsnsns
Minimum45.5 ± 14.351.7 ± 10.80.006 *55.7 ± 5.2956.4 ± 6.31ns0.012 *ns
Maximum54.5 ± 7.1855.6 ± 9.87ns58.6 ± 5.6358.5 ± 5.56nsnsns
* Significant differences assigned. Legend: ns = non-significant.
Table 3. Comparison of HbO levels between and within groups.
Outcome (g/dL)Depression Group (n = 16)
Mean ± SD
Within-Group DifferencesControl Group (n = 16)
Mean ± SD
Within-Group
Differences
Between-Group
Differences
BaselinePost-StimulationBaselinePost-StimulationBaselinePost-Stimulation
Mean5.94 ± 0.976.29 ± 1.35ns6.76 ± 0.756.84 ± 0.76nsnsns
Minimum5.25 ± 1.746.04 ± 1.430.002 *6.54 ± 0.726.64 ± 0.86ns0.04 *ns
Maximum6.39 ± 0.966.55 ± 1.35ns6.94 ± 0.786.93 ± 0.77nsnsns
* Significant difference assigned. Legend: ns = non-significant.
Disclaimer/Publisher’s Note: The statements, opinions and data contained in all publications are solely those of the individual author(s) and contributor(s) and not of MDPI and/or the editor(s). MDPI and/or the editor(s) disclaim responsibility for any injury to people or property resulting from any ideas, methods, instructions or products referred to in the content.

