Article

A Method to Estimate Dynamic Pore Water Pressure Growth of Saturated Sand-Gravel Materials

1
Department of Geotechnical Engineering, Nanjing Hydraulic Research Institute, Nanjing 210024, China
2
College of Civil and Transportation Engineering, Hohai University, Nanjing 210098, China
3
Key Laboratory of Failure Mechanism and Safety Control Techniques of Earth-Rock Dams, Ministry of Water Resources, Nanjing 210024, China
*
Author to whom correspondence should be addressed.
Appl. Sci. 2024, 14(17), 7909; https://doi.org/10.3390/app14177909
Submission received: 21 July 2024 / Revised: 22 August 2024 / Accepted: 2 September 2024 / Published: 5 September 2024

Abstract

:
The liquefaction of saturated sand-gravel material samples from the Xinjiang valley were investigated under cyclic loading. A series of large-scale dynamic triaxial tests were used to determine the dynamic characteristics of the sand-gravel sample under different confining pressures, consolidation stress ratios, and stress levels. A suitable pore water pressure growth model is proposed for the sand-gravel and sand materials. The number of cycles required to cause liquefaction was an important parameter in the dynamic pore water pressure growth model. A method to determine the number of cycles was proposed and verified by a large number of experimental data. The presentation of the pore water pressure simulation results demonstrates that the proposed pore water pressure growth model accurately characterizes the dynamic pore water pressure development in sand-gravel under cyclic loading and is also applicable to sand. The proposed pore water pressure growth model can be used to study the anti-liquefaction characteristics of foundation and dam materials of high earth-rock dams and high sand-gravel dams on deep overburdens.

1. Introduction

Soil liquefaction is a globally significant and typical seismic damage phenomenon that has become a prominent research topic in the field of soil dynamics and geotechnical earthquake engineering [1]. Sand-gravel materials are widely distributed in southwest and northwest China, which are also strong earthquake areas. Some high earth-rock dams are directly built on deep sand-gravel overburdens, and some dams are built with sand-gravel materials. The liquefaction properties of sand-gravel materials in these regions have drawn significant attention from researchers [2,3,4].
The study of sand liquefaction can be traced back to the 1930s, when Casagrand [5] first proposed the concept of critical void ratio and explained the liquefaction behavior of sand at the hand of the relationship between changes in the pore water pressure and the critical void ratio during the shear deformation of saturated loose sand. Seed [6] and Booker et al. [7] used the saturated sand isotropic consolidation cyclic triaxial test to establish the relationship between the dynamic pore water pressure and the number of load cycles. Finn et al. [8] modified Seed and Idriss’s pore water pressure stress model by considering the influence of initial anisotropic consolidation on the dynamic pore water pressure. Xu [9] also proposed an anisotropic consolidation pore water pressure calculation model that considered the effect of the initial shear stress ratio on the liquefaction of saturated sand. Zhang [10] defined three types of pore water pressure growth processes in saturated sand: A (the convex type), B (the concave–convex change microminiature), and C (the concave type). They also proposed corresponding calculation models for different dynamic pore water pressure growth processes. Apart from the above stress models, the pore water pressure model also includes a strain model [11], a transient model [12], an energy model [12,13], an endochronic theory model [14], and an effective stress path model [15]. Table 1 lists the commonly used pore water pressure growth models.
Traditional research on soil dynamic liquefaction mainly focused on saturated sand and silt materials [1,16,17,18,19], and less on sand-gravel materials. It is generally believed that sand-gravel materials with coarser grain sizes are less likely to liquefy [20]. Some research [21,22,23,24] has, however, shown that saturated sand-gravel materials will also liquefy under cyclic loading. In 2008, a magnitude 8.0 earthquake caused a large liquefaction area in Wenchuan, Sichuan. The gravel liquefaction area covered as much as 85% of the total liquefaction area [2,3,25]. After the Wenchuan earthquake, some scholars began to research the liquefaction characteristics of sand-gravel materials. Xu [26] used Seed’s pore water pressure model to propose a pore water pressure curve fitting model for sand-gravel materials. This model used the symmetry characteristics of the sand-gravel material relationship curve between the pore pressure ratio and the cyclic number ratio. Zhang [27] found that the normalized pore water pressure growth curve was close to the hyperbolic curve and proposed a hyperbolic pore water pressure growth model. In studying the dynamic pore water pressure model of sand-gravel materials, two problems must still be solved. First, the method for determining liquefaction NL for most pore water pressure models is not standardized, even though most use the number of cycles required to cause liquefaction NL to normalize the cyclic loading numbers N. Secondly, compared with sand, there is not sufficient liquefaction test data on sand-gravel materials, and the pore water pressure growth model needs to be further verified. Studying the liquefaction characteristics of sand-gravel materials is, therefore, necessary to provide a basis for the analysis of the liquefaction resistance of dam foundations and dam bodies.
This paper used the GCTS large-scale dynamic triaxial apparatus to carry out a series of undrained cyclic triaxial tests on sand-gravel materials at different initial confining pressures σ 3 c and consolidation stress ratios K c . The paper proposes a method for determining the number of cycles required to cause liquefaction NL that considers the relative density D r . The pore water pressure growth model of saturated sand-gravel materials was established and its applicability was verified.
The main research objectives of this paper are as follows: (1) To enrich the experimental data on sand-gravel material liquefaction, a series of undrained cyclic triaxial tests were conducted on sand-gravel materials using a GCTS large-scale dynamic triaxial apparatus under varying initial confining pressures and consolidation stress ratios. (2) To propose a method for determining the number of cycles required to cause liquefaction that considers relative density. (3) To establish a pore water pressure growth model for saturated sand-gravel materials and verify its applicability.
The remainder of this paper is organized as follows: Section 2 presents an overview of the test design. Section 3 details the experimental data. Section 4 discusses the estimation model for NL. Section 5 introduces the pore water pressure growth model for saturated sand-gravel materials. Section 6 provides the conclusions.

2. Test Design

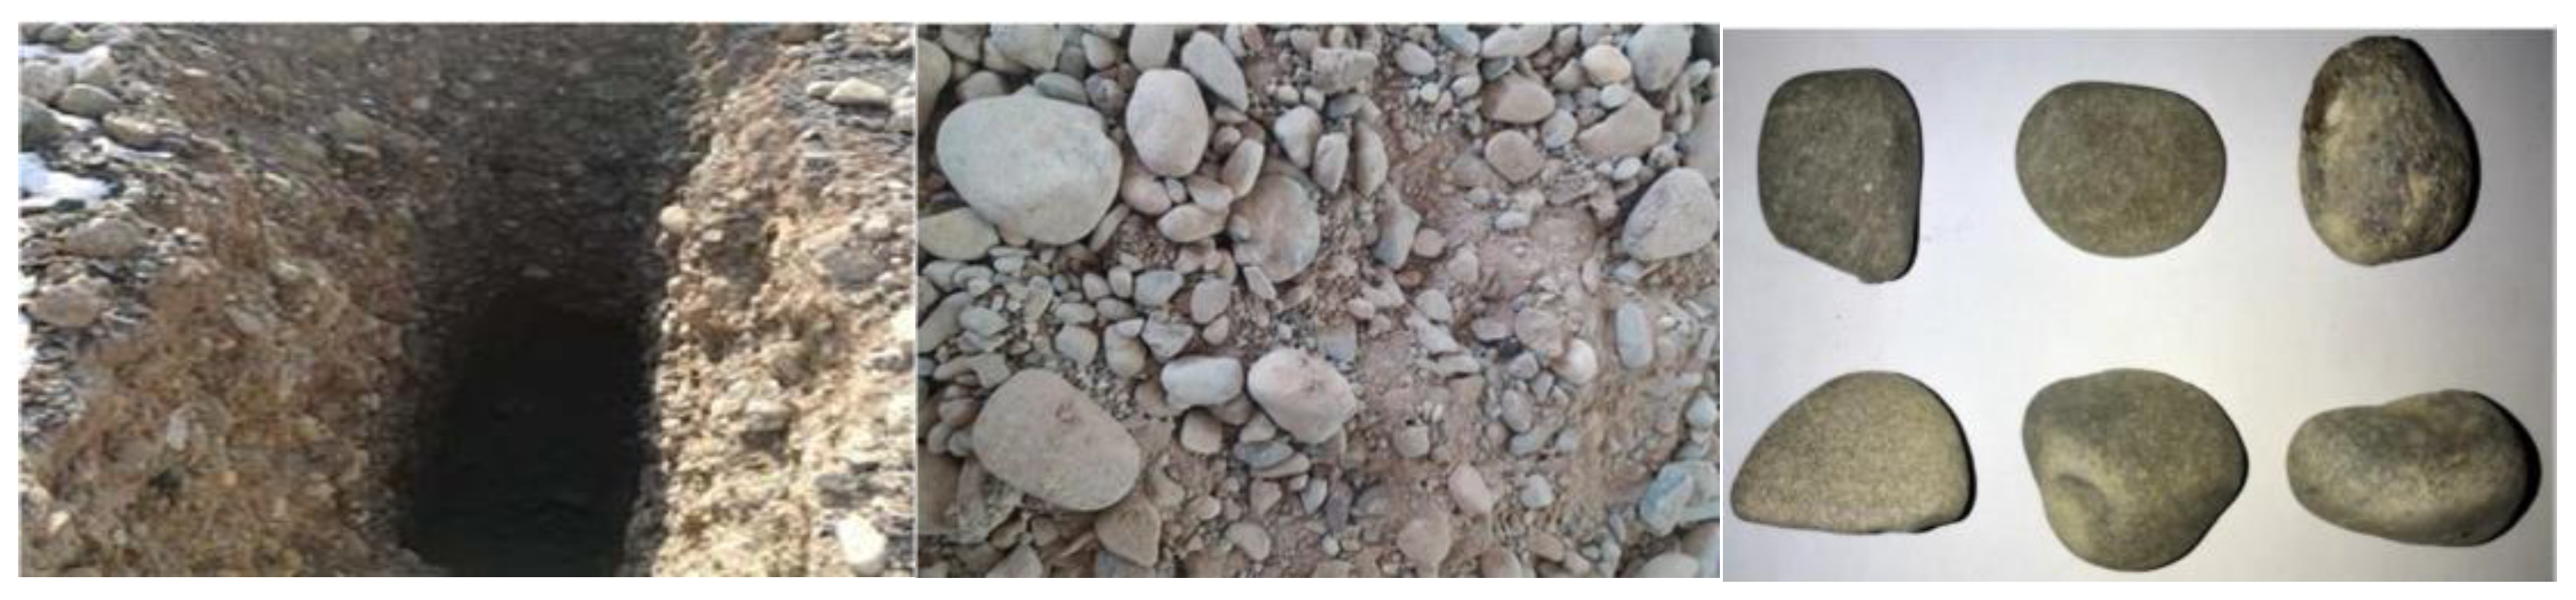
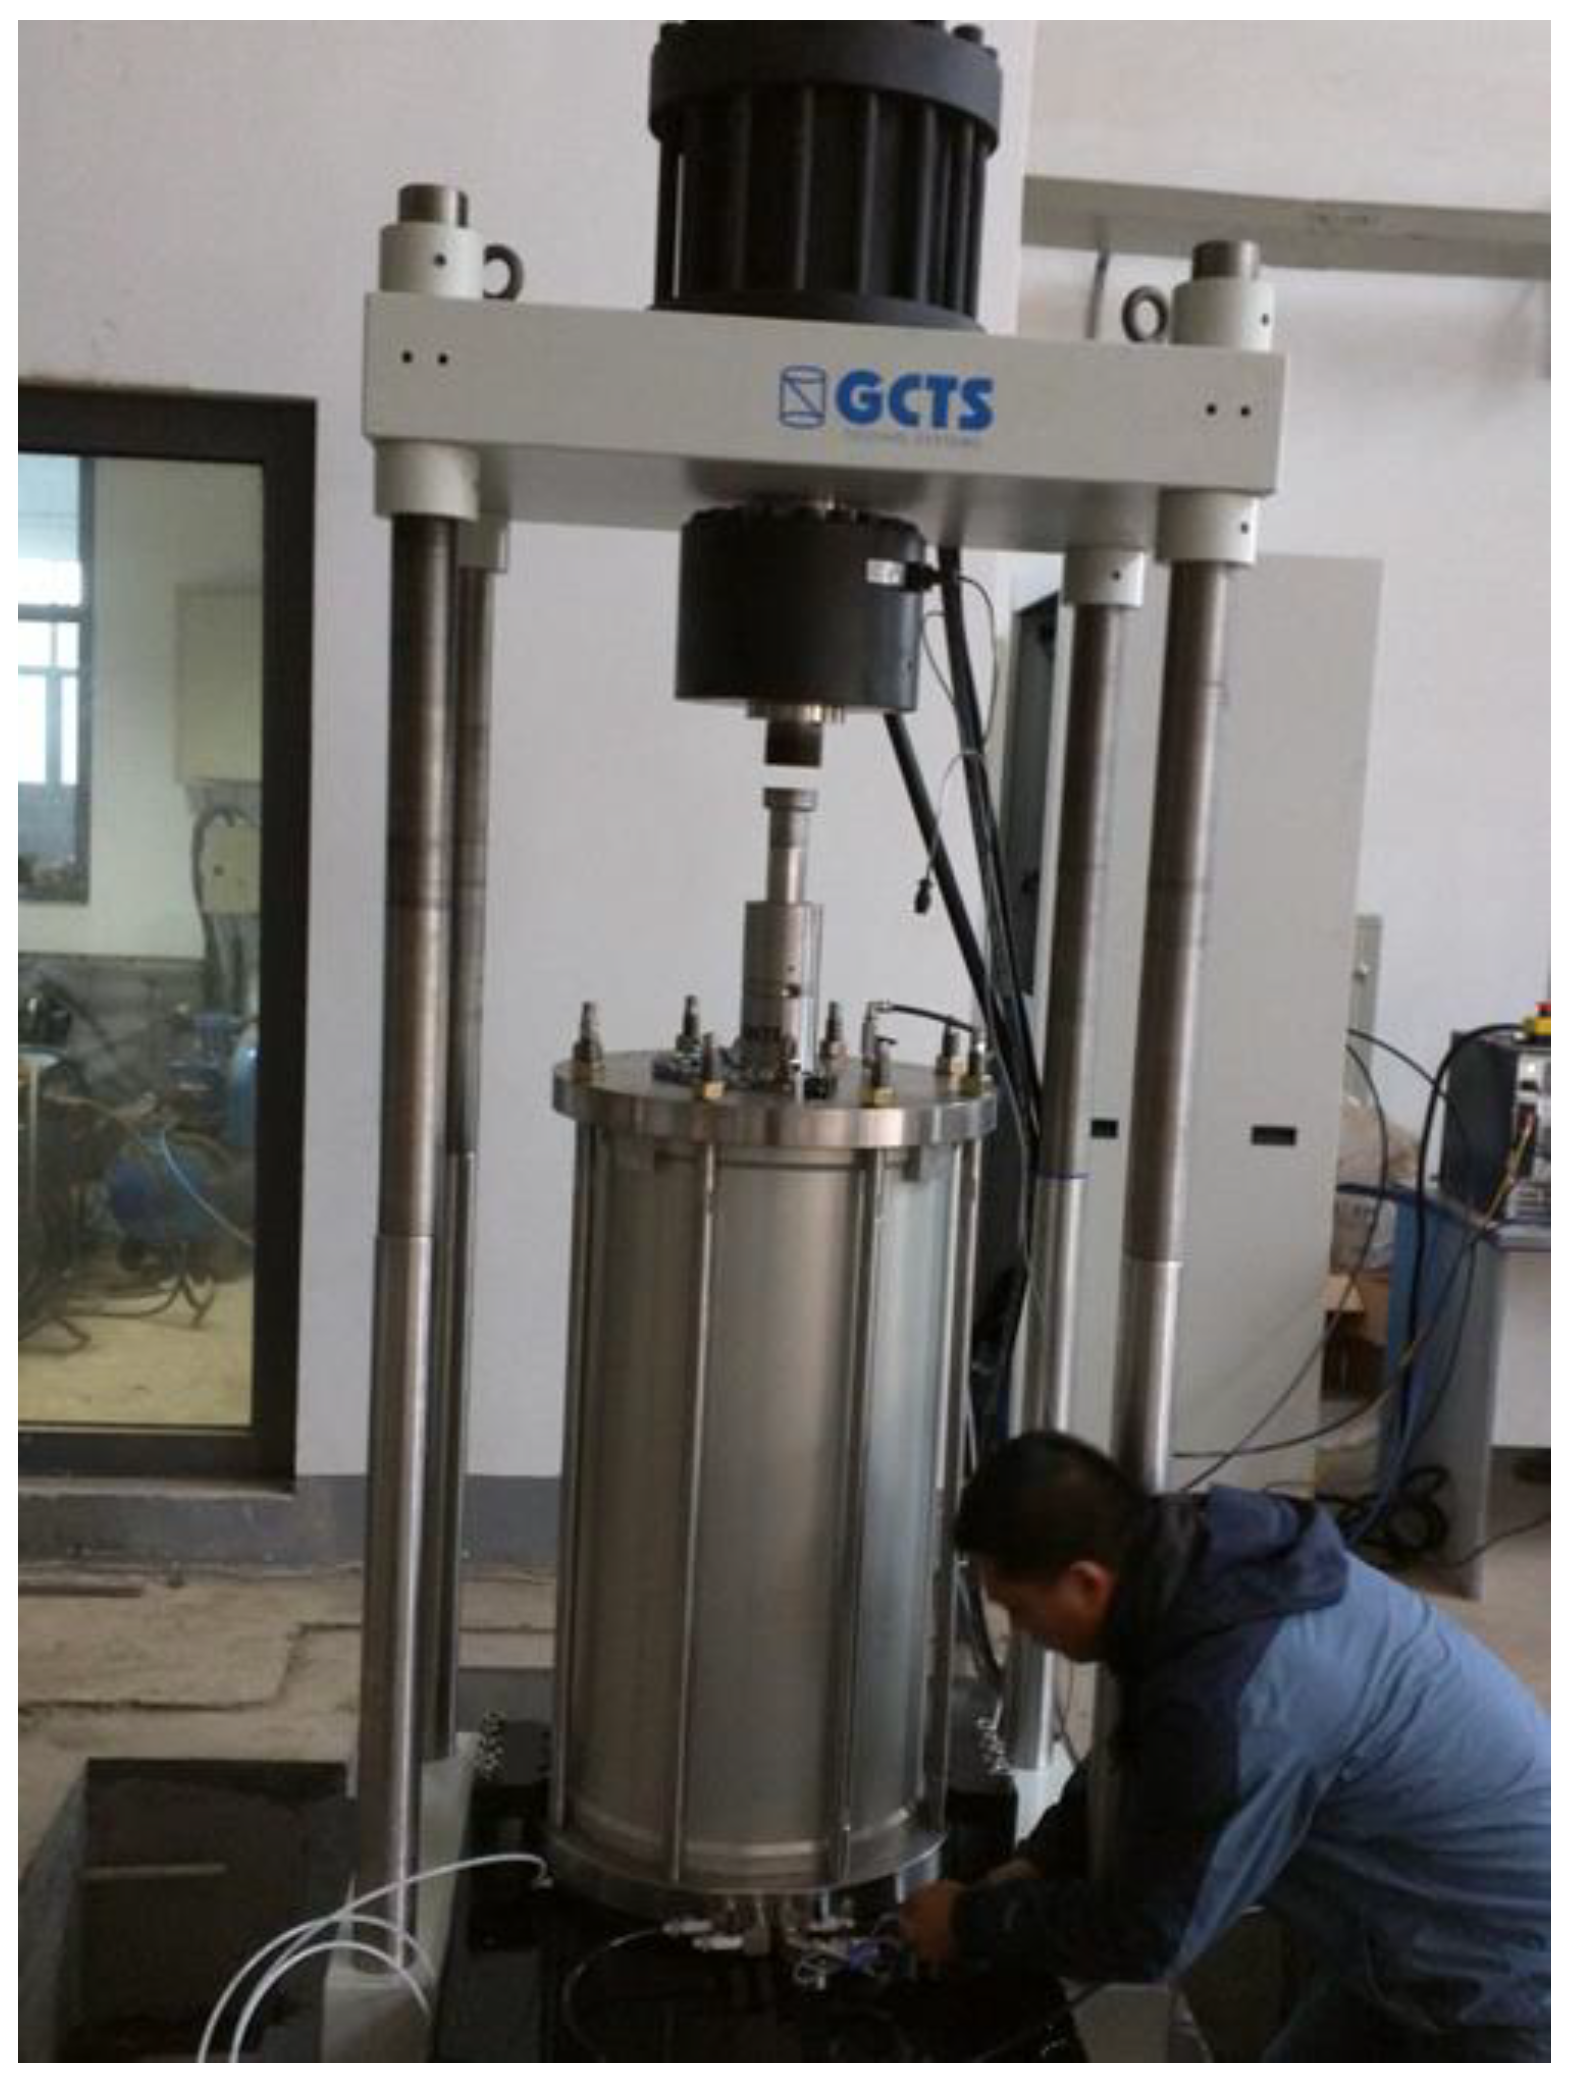
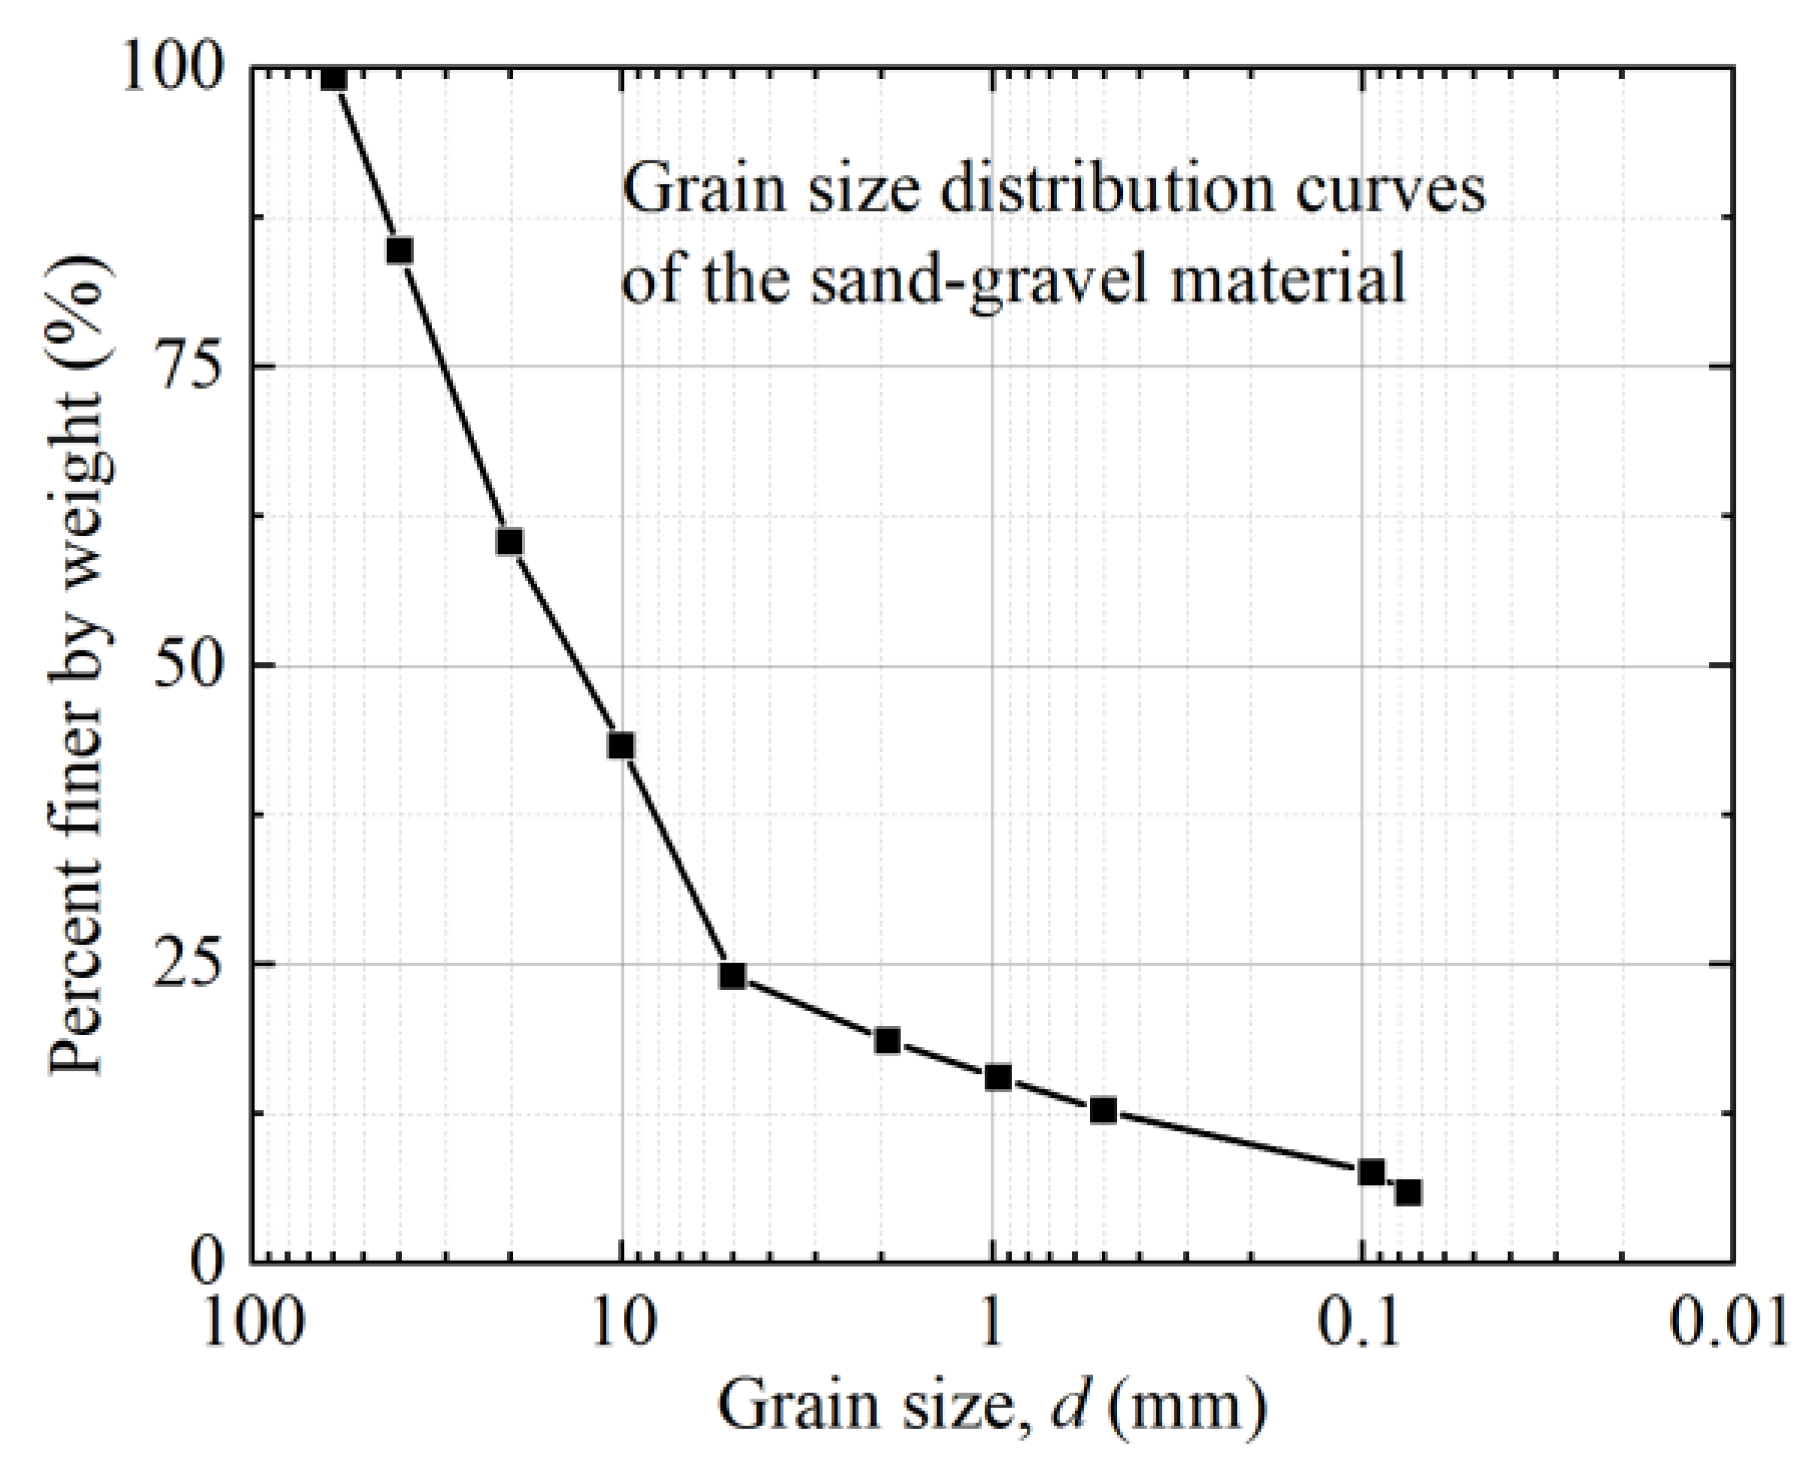
2.1. Test Apparatus and Sample Preparation

The sand-gravel material, which is composed of limestone and was used in the test, originates from a valley in Xinjiang. These materials are rounded and exhibit some degree of cementation, as shown in Figure 1. This study tested a series of sand-gravel materials under undrained conditions through cyclic triaxial tests conducted with the GCTS Instruments large-scale dynamic triaxial apparatus, as illustrated in Figure 2. The test sample diameter D is 300 mm and the height H is 700 mm. For this experiment, the sand-gravel material was prepared using the equivalent substitution method to achieve the desired gradation, with a maximum allowable particle size of 60 mm. The grain size distribution is shown in Figure 3 and the basic physical properties of the prepared material are shown in Table 2. The sample preparation was divided into five layers and is based on the surface vibration method.
The water head method was used to saturate the specimen. In this method, the water slowly infiltrates from the bottom of the specimen until the water at the top of the specimen seeps out. First, the inlet valve was opened, and 35 kPa lateral pressure was applied to the sample. Thereafter, lateral pressure and axial pressure were applied in a stepwise fashion until the lateral pressure and axial pressure reached the predetermined consolidation stress ratio of each test. The drain valve was then opened to drain and consolidate the sample, after which the drain valve was closed when the sample was consolidated. When the seeped water is stable and no bubbles are generated, the saturation of the specimen is deemed to exceed 95%, which meets the test requirements.

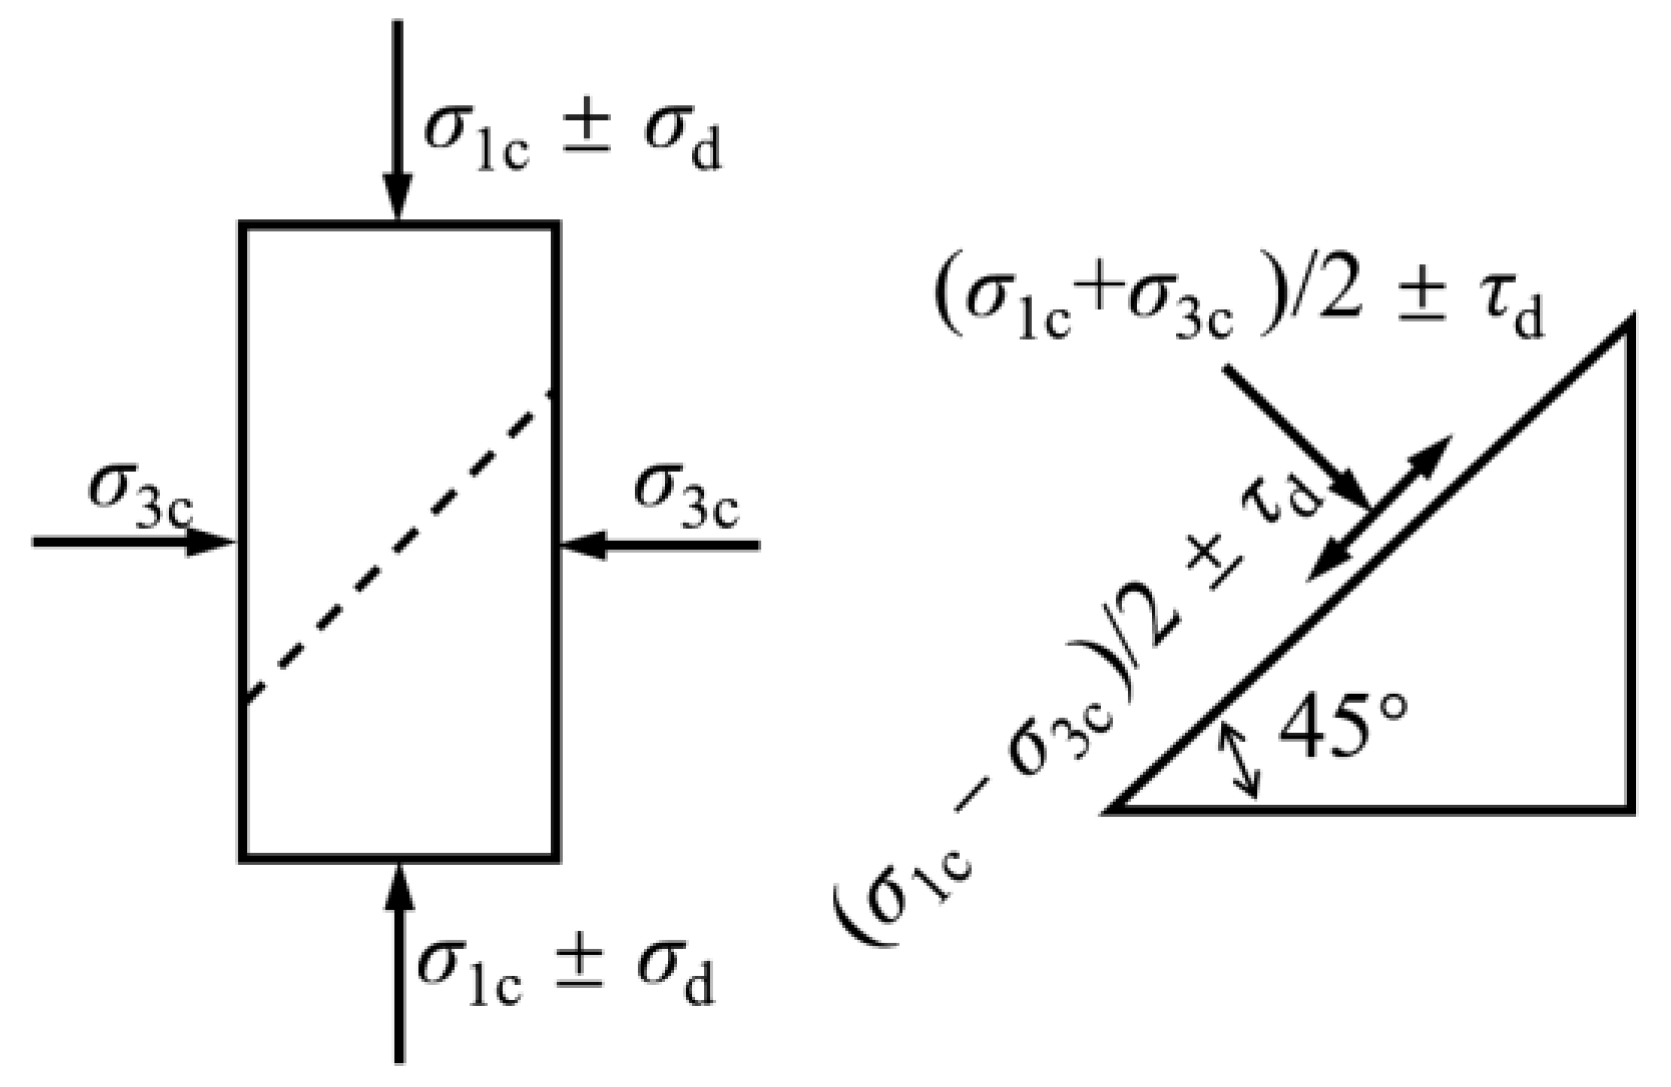
2.2. Test Conditions

For this study, sand-gravel materials with a relative density Dr of 0.9 were consolidated under pressures of 50, 100, 200, and 300 kPa. A sine wave with a loading frequency of 0.33 Hz was employed to apply dynamic stress through vibration until failure occurred. Failure was defined as either an axial strain of 5% or excess pore water pressure reaching the confining pressure. This was performed to study the dynamic characteristics of the sand-gravel materials under different initial effective confining pressures σ 3 c , consolidation stress ratios K c , and stress levels. Table 3 lists static and dynamic stress control conditions of this test. In dynamic triaxial tests, initial dynamic stress values are determined based on empirical experience. Once the samples meet the failure criteria, σ d for each condition is recorded in Table 3. In general engineering practice, the minimum principal stress of dam materials is estimated based on the dam height, and the maximum experimental confining pressure is set to exceed this value. This research aims to investigate the dynamic pore pressure of sand-gravel materials under low confining pressures; therefore, confining pressures σ 3 c are set at 50, 100, 200, and 300 kPa. Most natural soils are in an anisotropic consolidation state; thus, soil strength parameters derived from such conditions are more reflective of real-world scenarios. Accordingly, the consolidation stress ratios, K c , are set at 1.5 and 2.0.
Undrained cyclic triaxial tests were carried out under different cyclic stress ratios (CSRs) after consolidation. The CSR is the ratio of the dynamic shear stress on the 45° slope of the triaxial specimen to its initial normal stress; the formulas are as follows:
K c = σ 1 c σ 3 c σ 0 = 1 + K c 2 σ 3 c τ d = σ d 2 CSR = τ d σ 0 = σ d 1 + K c σ 3 c
where σ 1 c is axial stress, σ 3 c is the initial effective confining pressure, K c is the initial consolidation stress ratio, σ 0 is the initial normal stress, τ d represents the dynamic shear stress, σ d is the axial cyclic stress, and CSR is cyclic stress ratio.
During the test, the sample is consolidated under the stresses σ 1 c and σ 3 c . At this point, the initial normal stress, σ 0 , on the sample’s 45° slope is ( σ 1 c + σ 3 c ) / 2 , and the initial shear stress is ( σ 1 c σ 3 c ) / 2 . Subsequently, under undrained conditions, ± σ d is applied, resulting in an additional dynamic shear stress and normal stress of σ d / 2 on the 45° slope. The stress state of the sample during vibration is illustrated in Figure 4.

3. Analysis of Dynamic Triaxial Test Results of Saturated Sand-Gravel Material

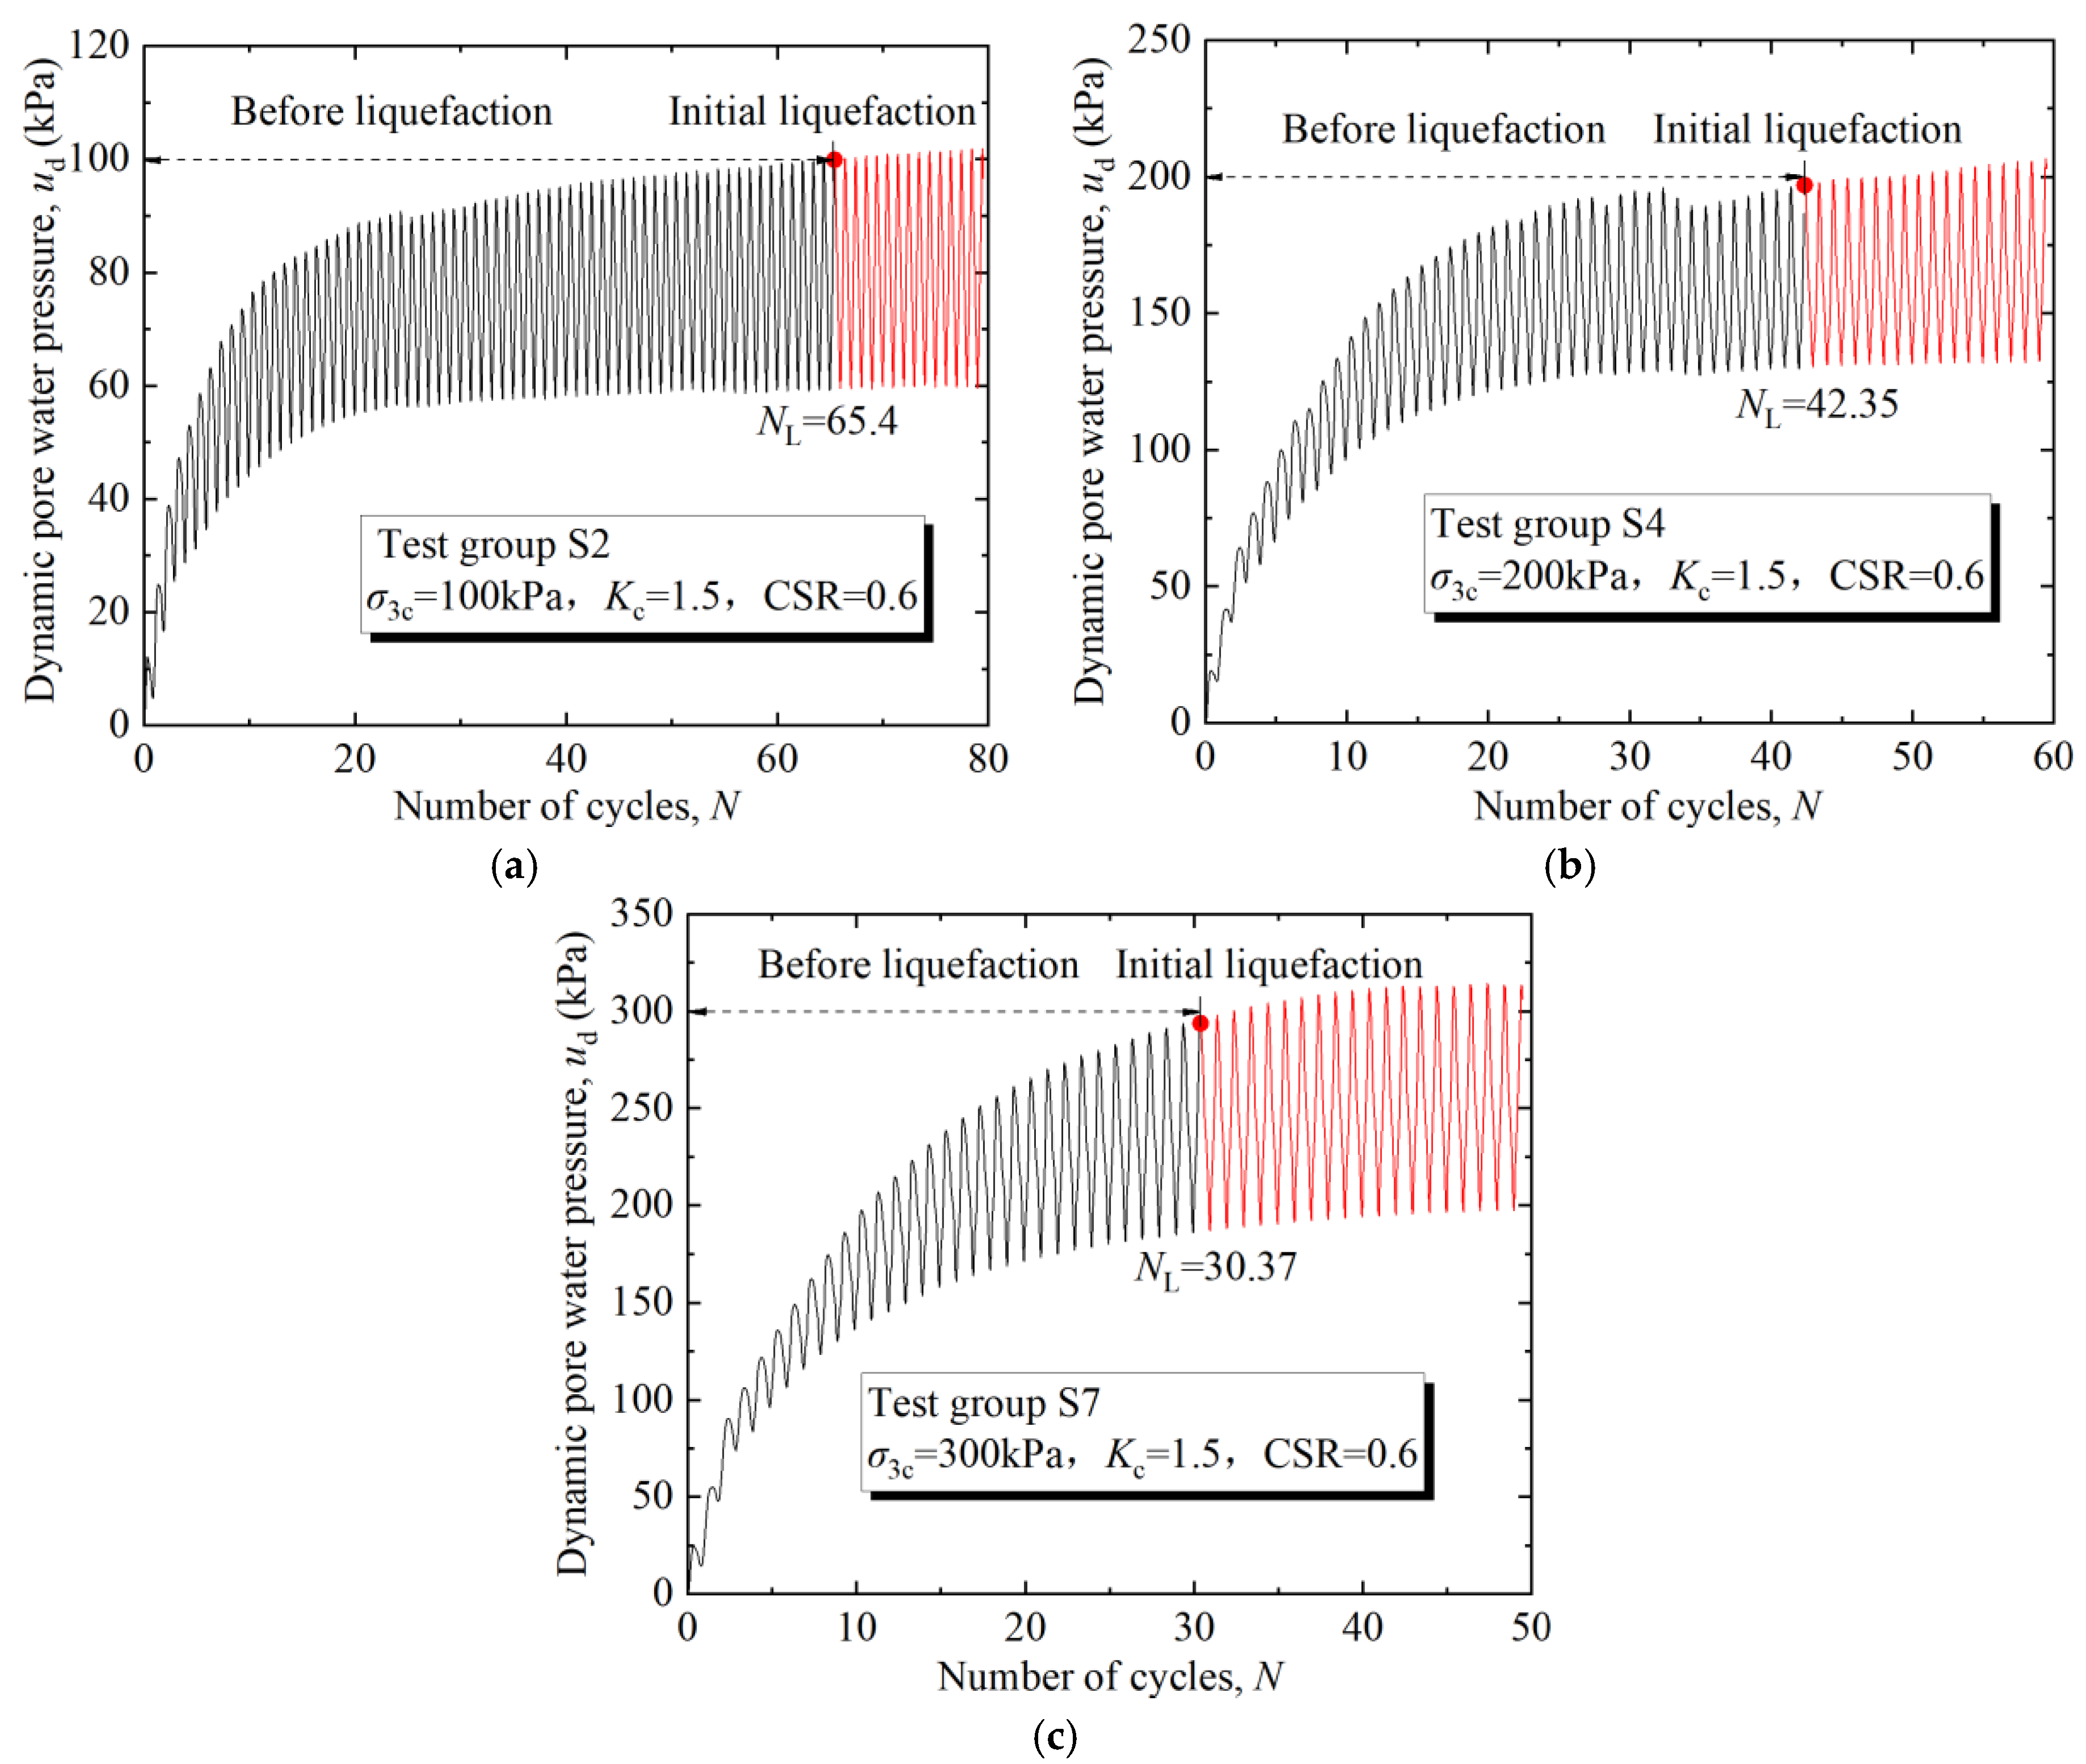
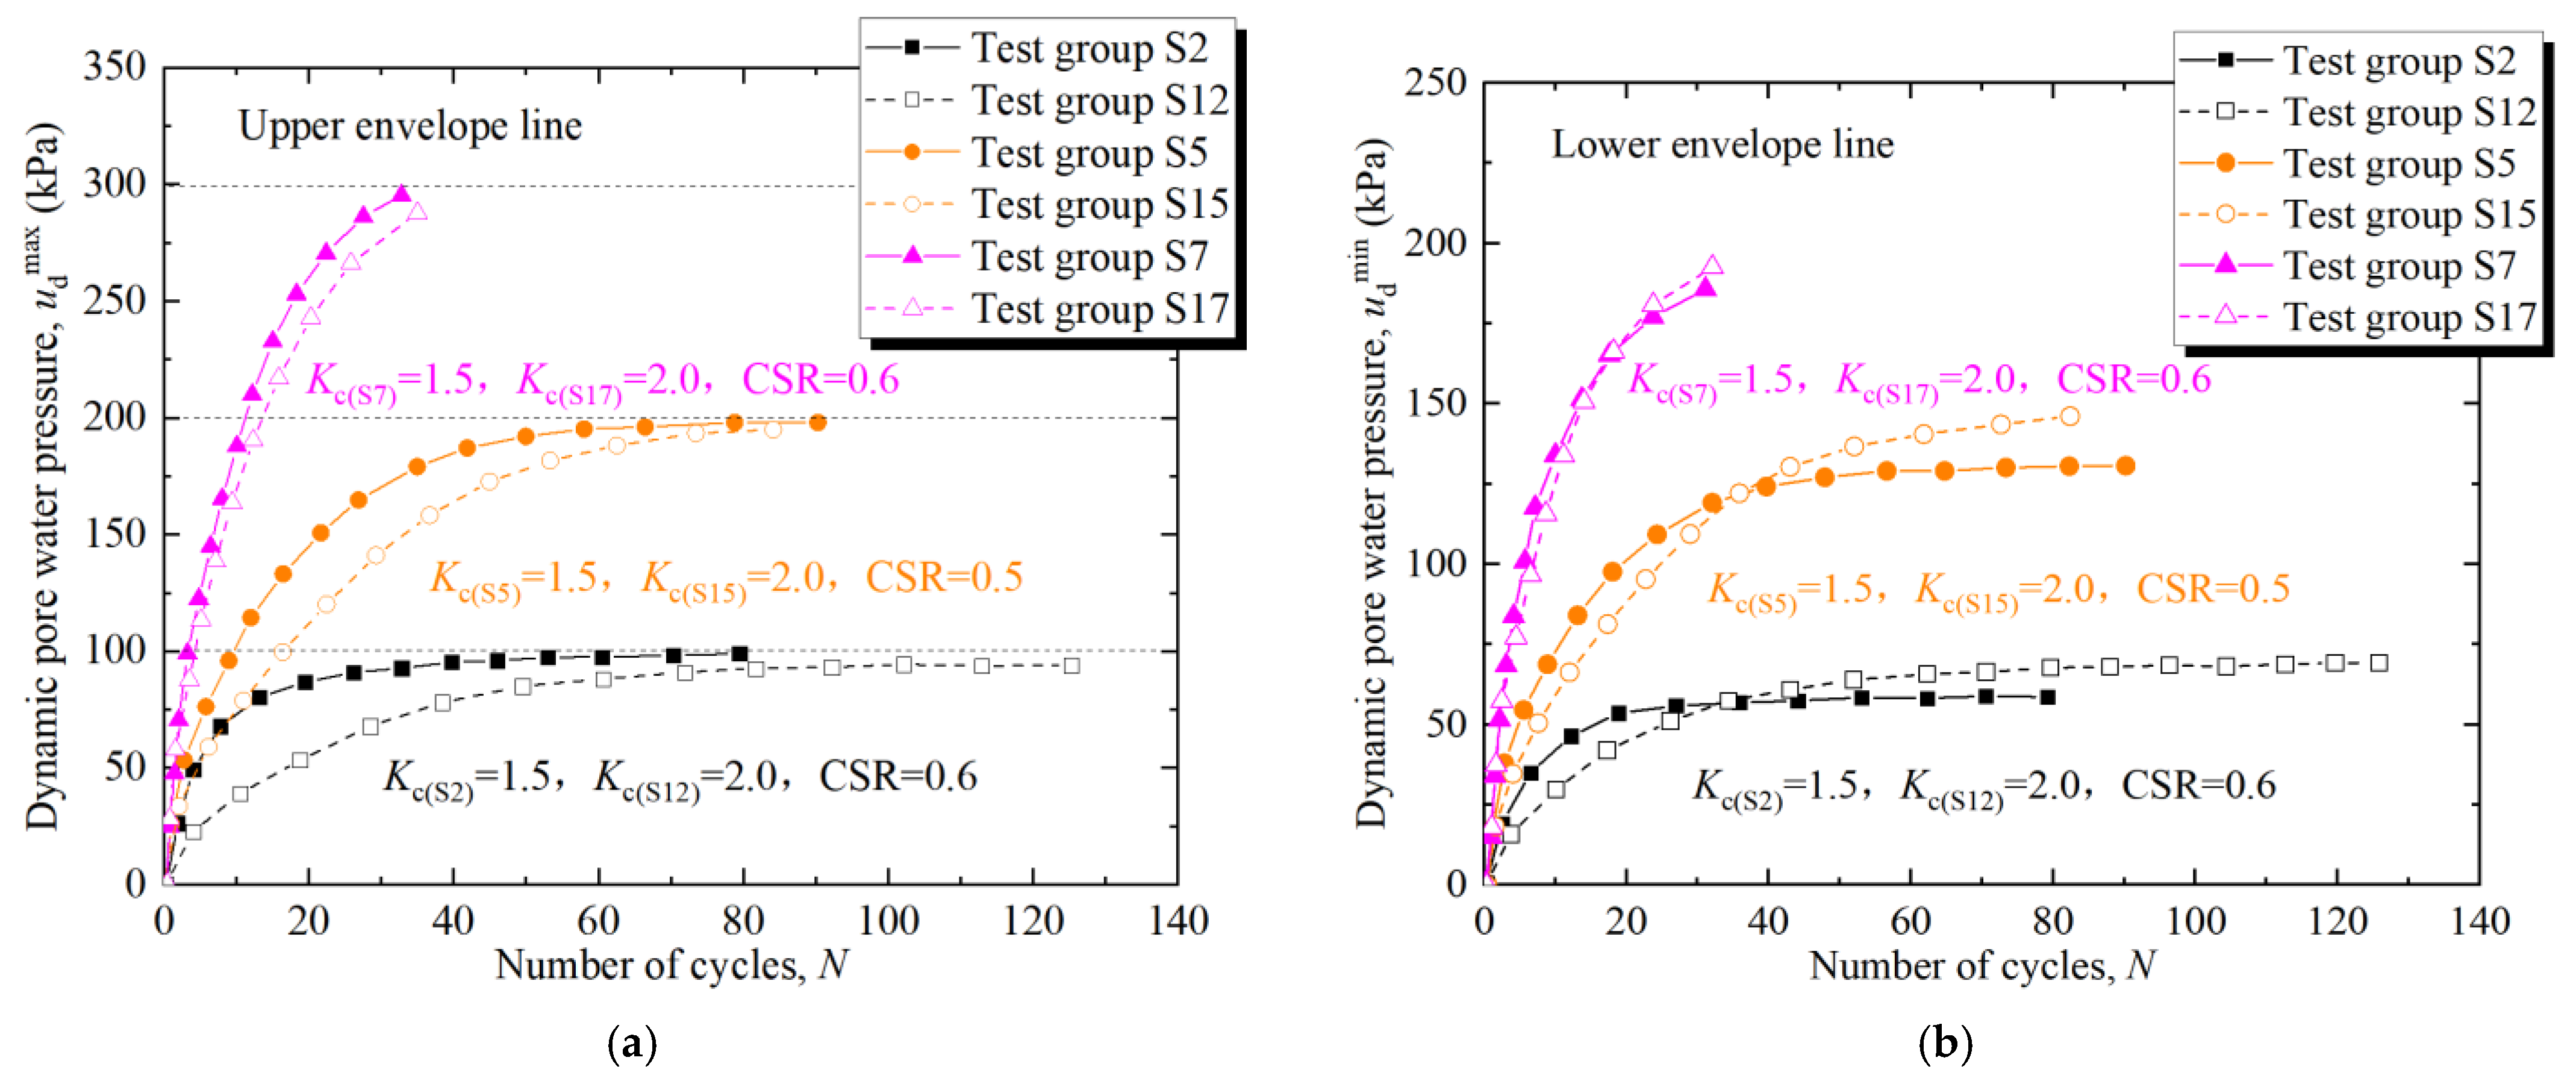
3.1. Dynamic Pore Water Pressure Curve

The dynamic pore water pressure of saturated sand-gravel material increased and periodically fluctuated with periodic increases in the cyclic loading. At the initial stages of increased loading, the dynamic pore water pressure fluctuated slightly but thereafter rose steadily. With an increase in the cyclic numbers, the amplitude of the dynamic pore water pressure increased, but in general, the growth rate of the pore water pressure seemed to decrease. The dynamic pore water pressure of the saturated sand-gravel material was close to the initial effective confining pressure after reaching a certain level of loading. This level of loading was determined by the initial liquefaction of the soil, as illustrated in Figure 5. The black and red lines represent the dynamic pore water pressure of the sand-gravel material prior to and following initial liquefaction, respectively. The number of cycles required for initial liquefaction in each test (S1 to S18) and the excess pore water pressure at 5% axial strain are presented in Table 4.
Shamoto Y et al. [28] and Zhang [29] explained pore water pressure growth in saturated sand. The volumetric strain of saturated sand is composed of a volumetric strain ε v c due to a change in the mean effective principal stress, and a volumetric strain ε v d caused by shear stress. The soil grains are broken during the shearing process so that the mean porosity decreases and the large pores disappear. This changes the soil’s irreversible dilatancy component ε v d , i r . The slip and dislocation between the soil grains also cause a change in the soil’s reversible dilatancy component ε v d , r e . To meet the volume consistency conditions, ε v c must correspondingly change, which causes the effective mean principal stress to change and cause excess pore water pressure. The monotonic increase ε v d , i r causes a monotonic increase in the irreversible dynamic pore water pressure and the generation and dissipation of ε v d , r e causes a fluctuation in the reversible dynamic pore water pressure. The grain size distribution of the sand-gravel material is wider than sand and has larger pores between the soil grains. Slip and dislocation are, therefore, more likely to occur between the gravel and the fine sand materials, causing a monotonic increase in the pore water pressure and larger amplitudinal increases in the dynamic pore water pressure during cyclic loading of the saturated sand-gravel.
Figure 6 shows the upper and lower envelope lines of the pore water pressure growth in the saturated sand-gravel. The sample achieves a smaller maximum pore water pressure at the same number of cycles due to the larger consolidation stress ratio before cyclic loading. This happens because the saturated sand-gravel becomes denser under the larger consolidation stress ratio, and the volume shrinkage of the soil during the shear stress is small while the volume expansion is large, which to a certain extent inhibits the accumulation of pore water pressure.

3.2. Relationship between the Strain and the Cyclic Numbers

The dislocation and slip between the saturated grains of sand and gravel generate an axial strain after cyclic loading, which increases and changes with the periodic change in the loading. The amplitude of the axial strain is small during the initial stages of loading but increases gradually with an increase in the number of dynamic cycles. This is because the pore water pressure accumulates during the dynamic loading process, which reduces the mean effective stress of the sample and reduces the dynamic shear modulus of the material. The dynamic strain of the material, therefore, increases accordingly under the same cyclic loading conditions. Under the same confining pressure and cyclic stress conditions, samples with a higher initial consolidation stress ratio and a smaller dynamic strain amplitude experience less pore water pressure growth when the consolidation stress is relatively high. The deviatoric consolidation also causes a significant axial residual deformation of the soil sample, as shown in Figure 7. The black and red lines denote the axial strain of the sand-gravel material before and after reaching initial liquefaction, respectively.

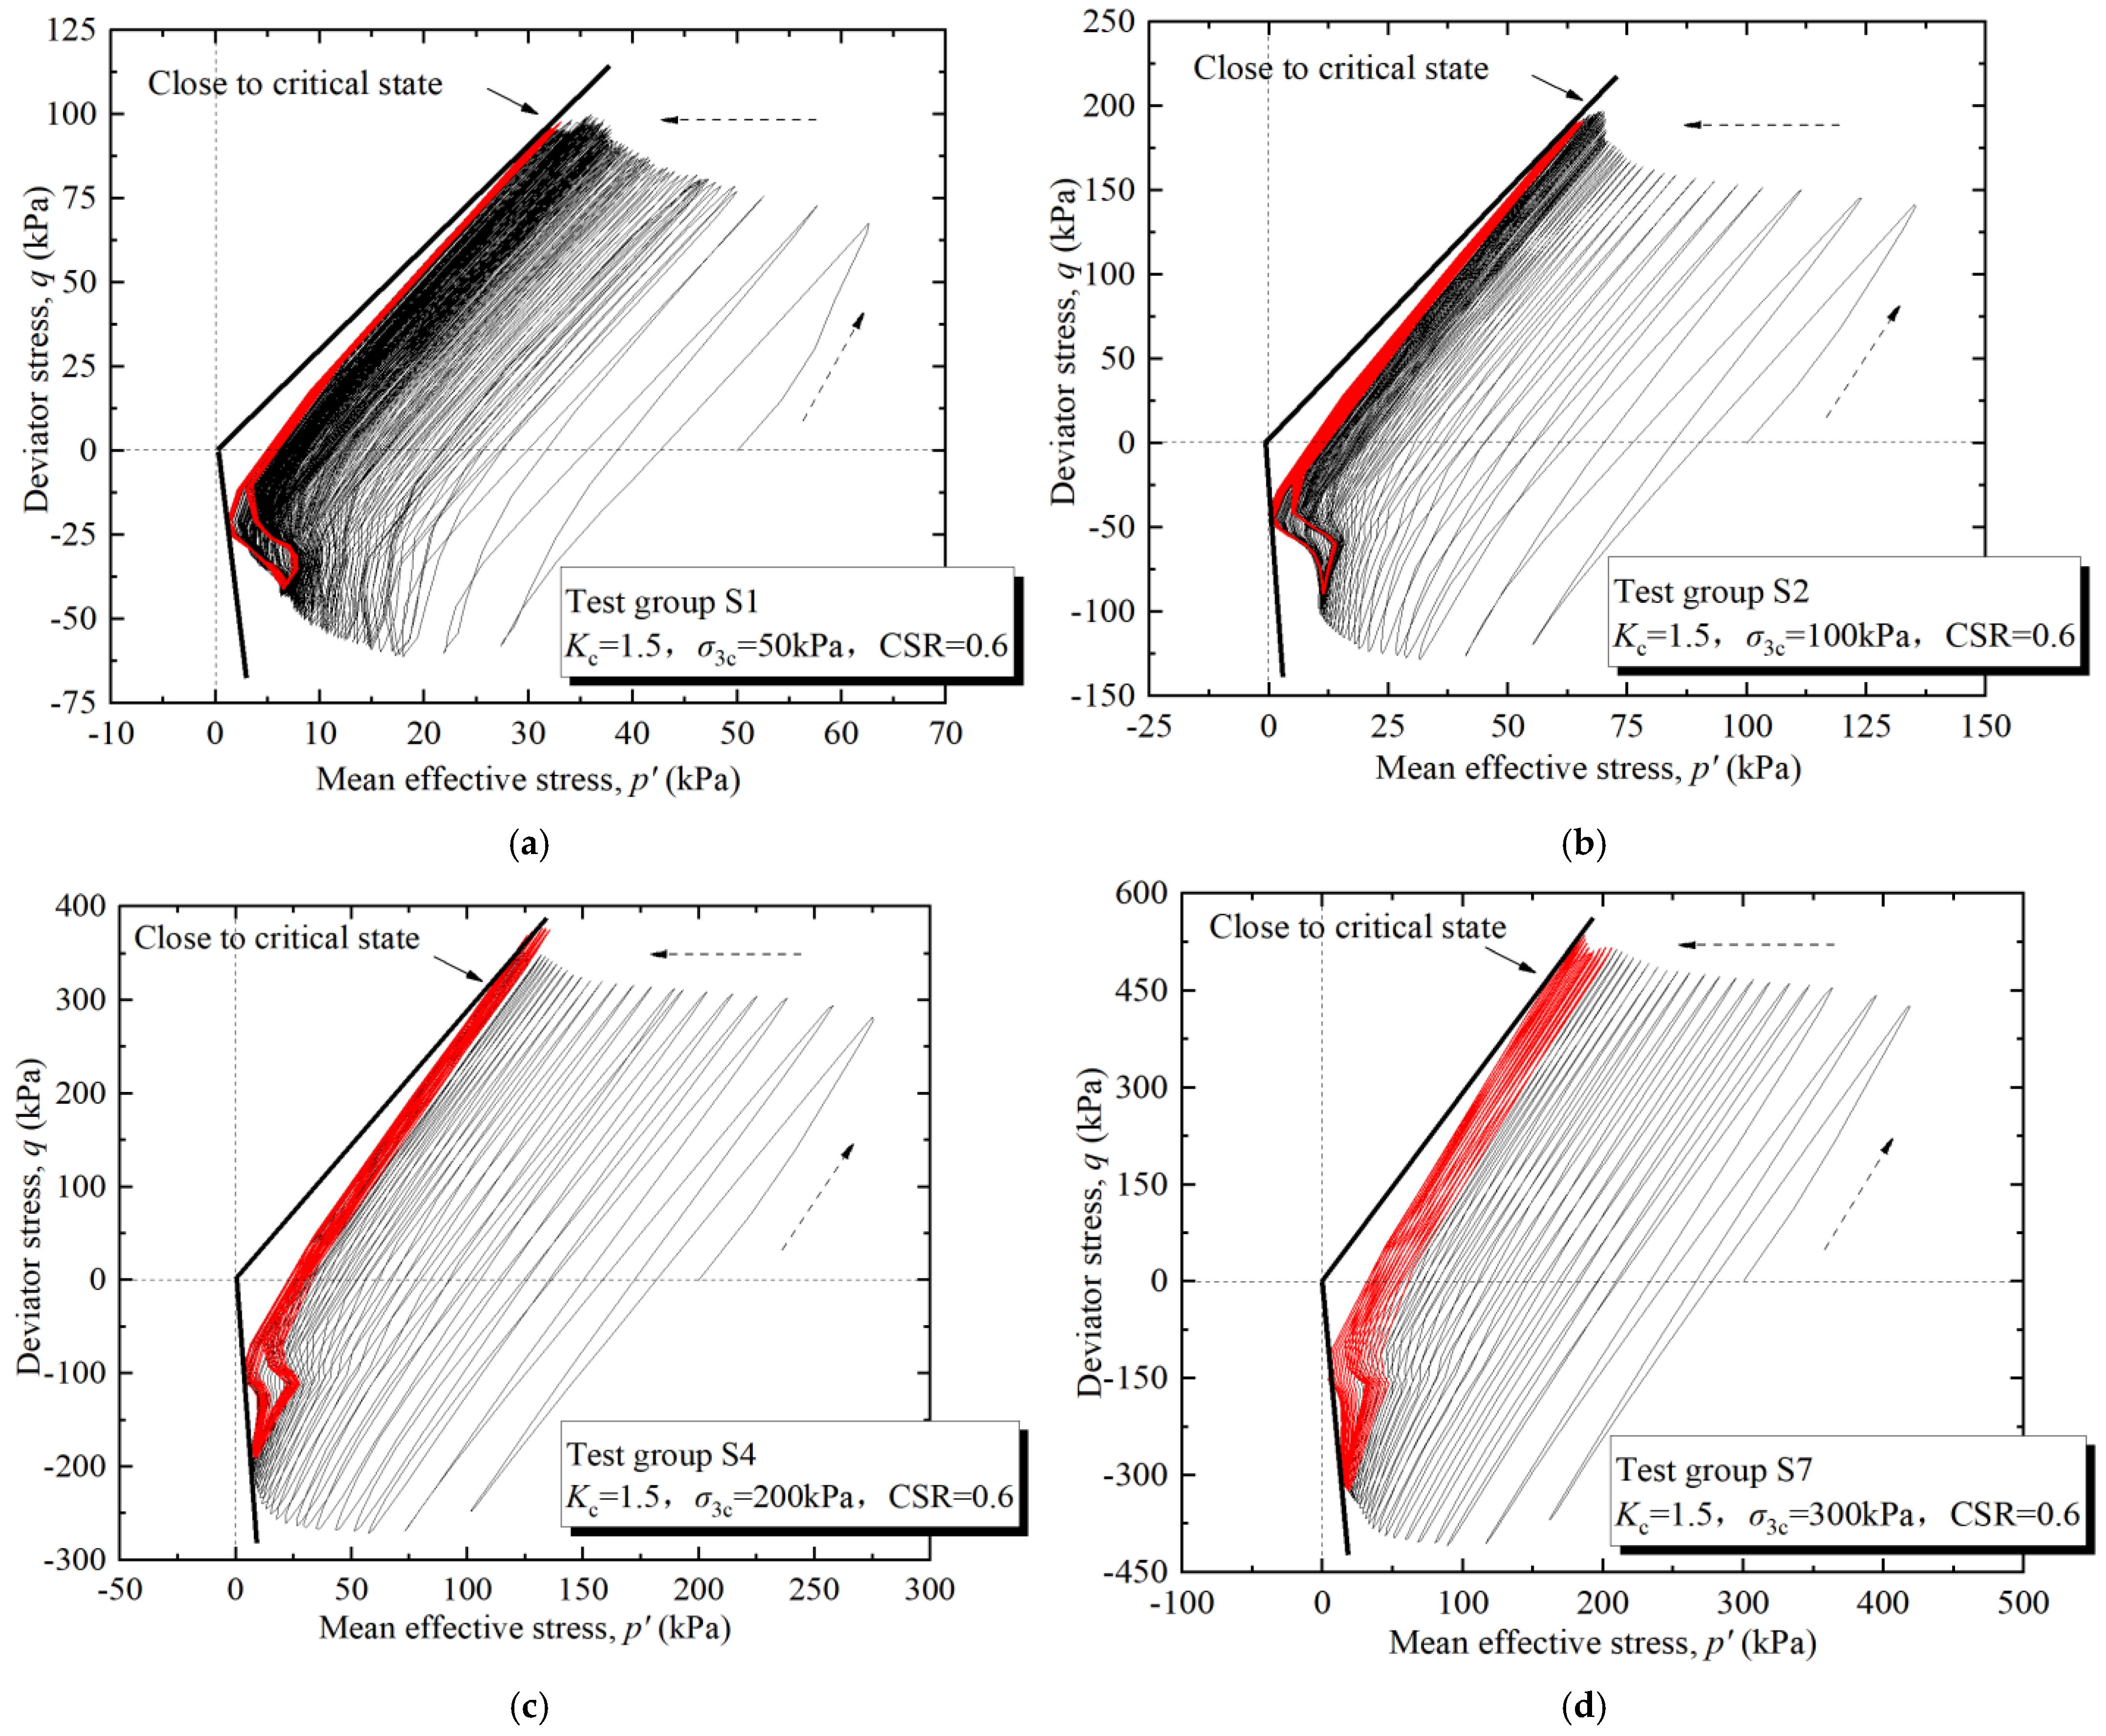
3.3. Effective Stress Path

Studying the stress paths of sand-gravel material liquefaction allows for an understanding of the developmental process of saturated sand-gravel materials. The parameters in Figure 8 are as follows:
p = ( σ 1 + 2 σ 3 c ) / 3 ; q = ( σ 1 σ 3 c ) / 2
where p represents the mean effective stress, q represents the deviator stress, σ 1 is the effective axial stress, and σ 3 c is the initial effective confining pressure.
Figure 8 shows the effective stress path of sand-gravel material as the number of loading cycles increases. The arrows illustrate the direction of development for the mean effective stress path of the sand-gravel materials, while the red line shows the final 10 cycles of the p′-q curve as it approaches the critical state. Cyclic loading causes a dense and undrained soil sample, which in turn causes an increase in the pore water pressure and a decrease in mean effective stress. There is, however, a stage during which the mean effective stress increases during each stress cycle. This is due to the volume shrinkage and expansion of the dense sand-gravel material that occurs during the cyclic loading process. The pore water pressure tends to be stable during the later stages of dynamic loading. The effective stress path of the next loading cycle is close to the previous cycle path, while the effective stress paths tend to overlap.

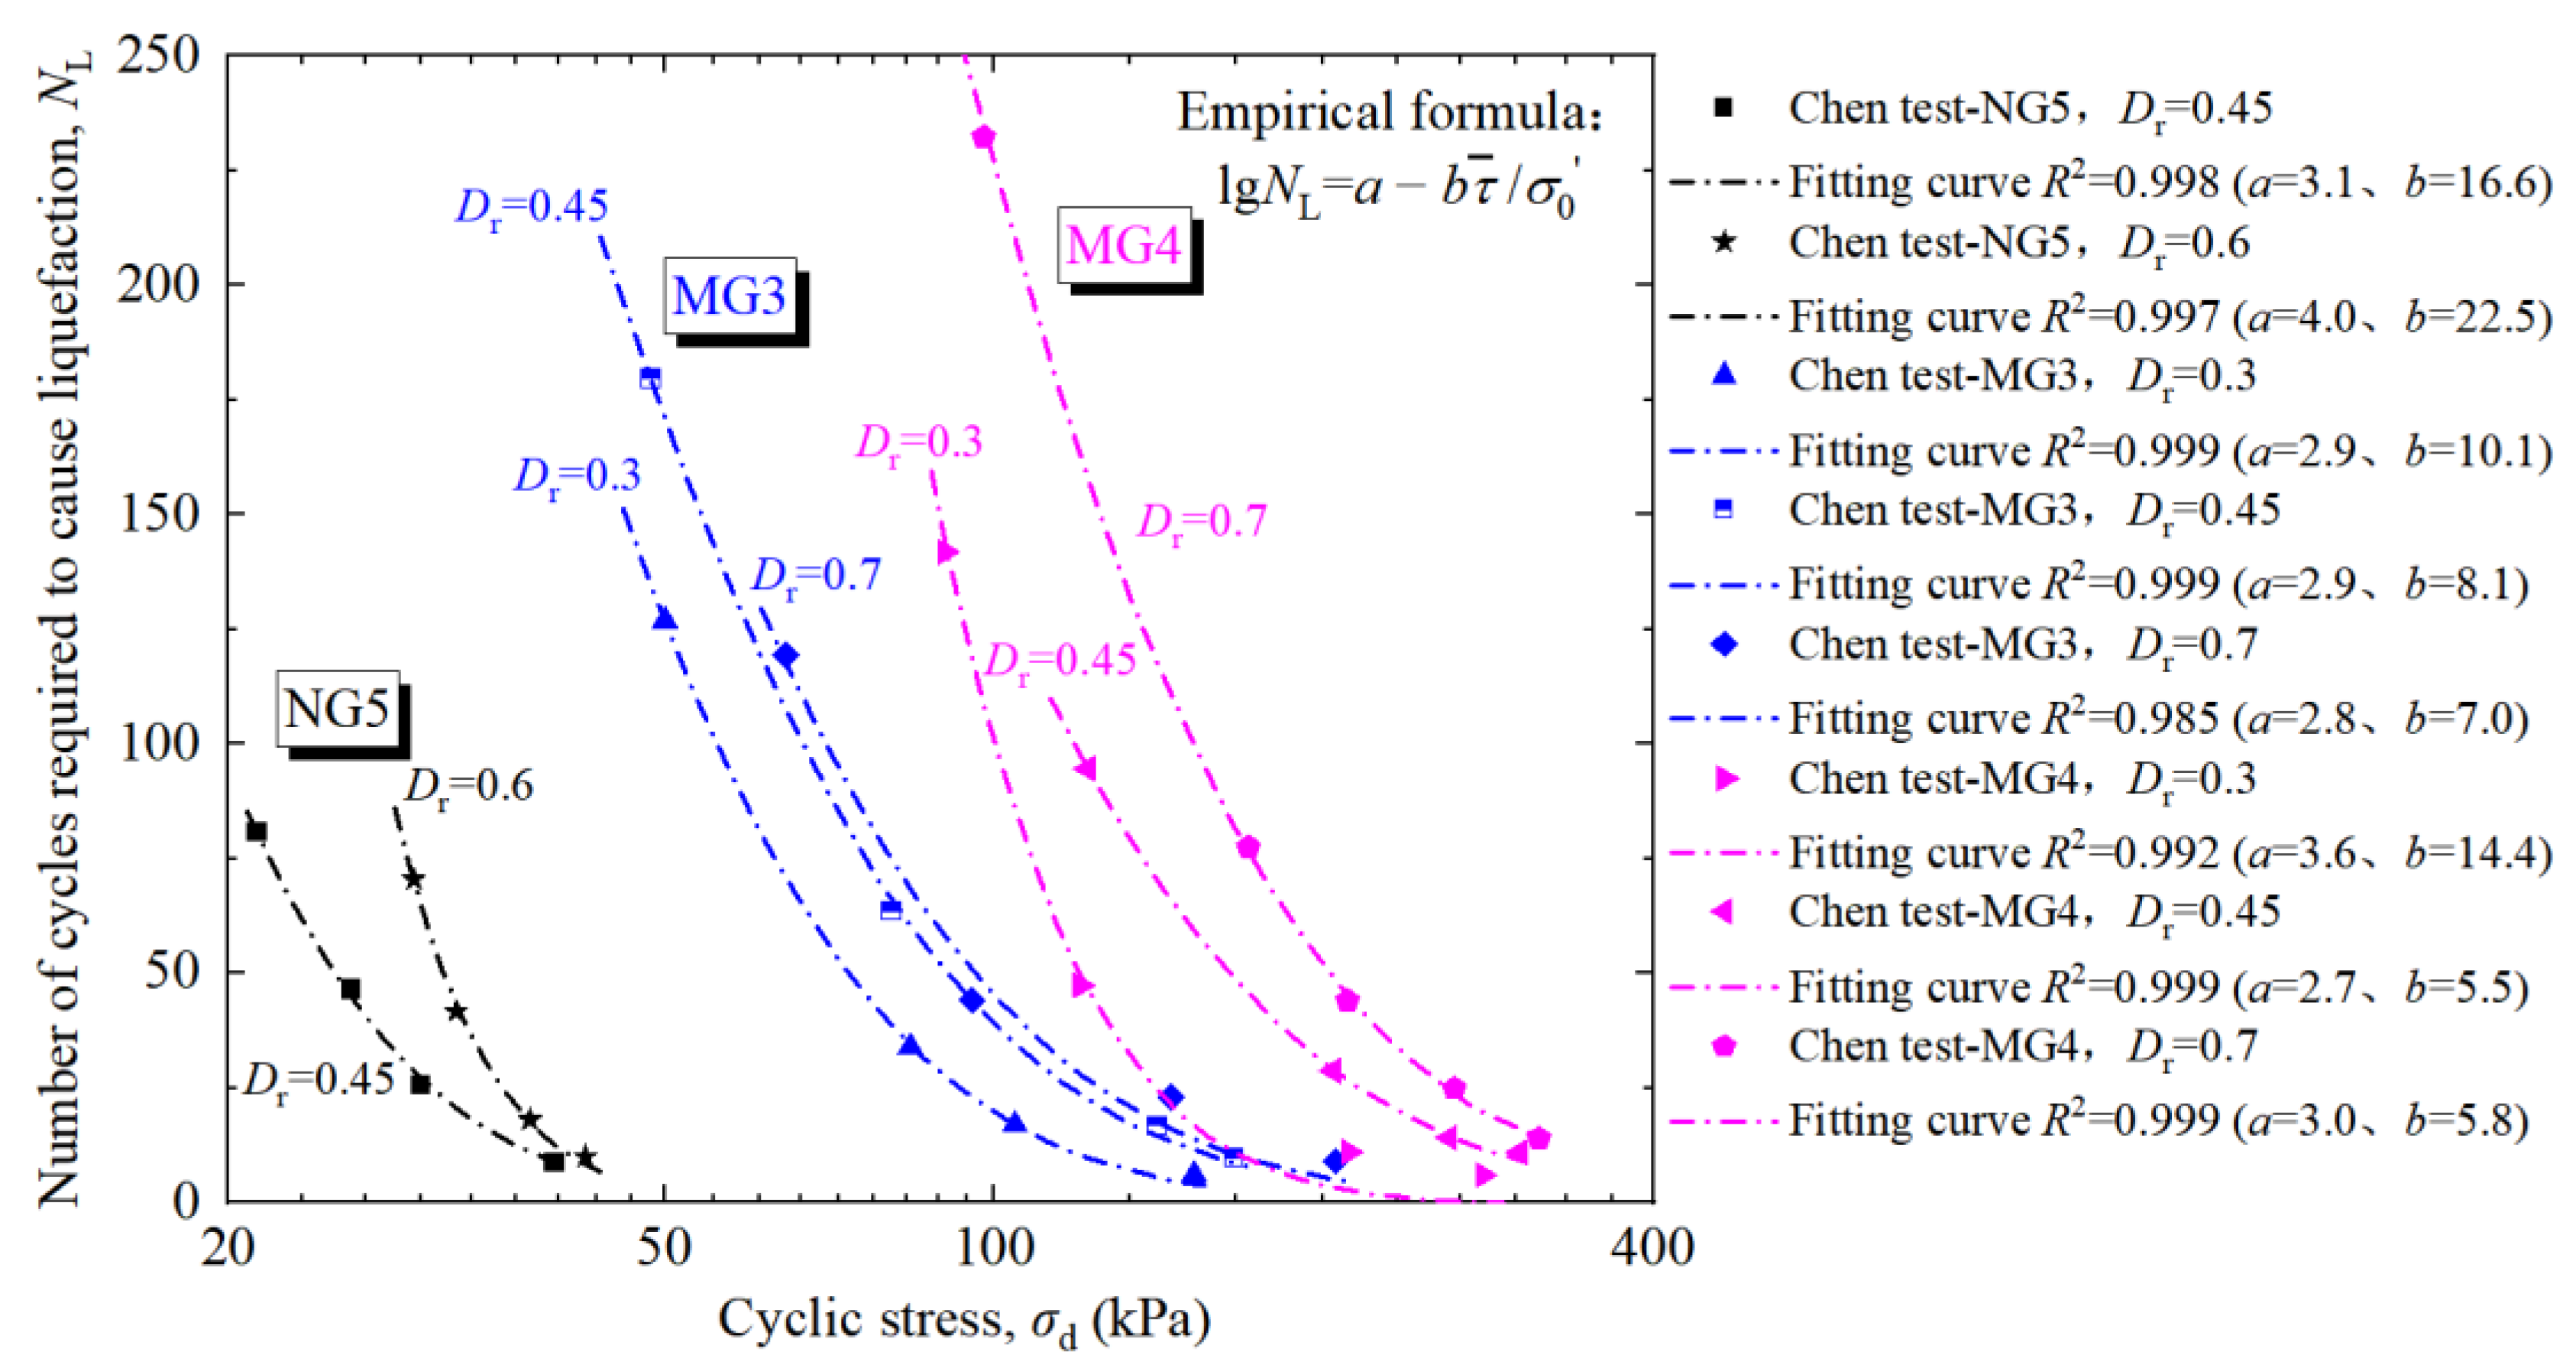
4. The Estimation Model of the Number of Cycles Required to Reach Liquefaction, NL

4.1. The Verification of NL

NL is the number of cycles required to reach liquefaction. NL is mostly obtained from the liquefaction test curve or empirical formula, such as that proposed by Xu [30]:
N L = 10 a b τ d σ 0 ; lg N L = a b τ d σ 0 = a b σ d 1 + K c σ 3 c
where a and b are constants, τ d is dynamic shear stress, σ 0 is the initial normal stress on the 45° slope of the sample, σ 3 c is the initial effective confining pressure, σ d is the axial cyclic stress, and K c is the initial consolidation stress ratio. The least squares method was employed to fit the experimental data, resulting in the values of a and b. Under different conditions of K c and σ 3 c , one relationship between NL and σ d can be established. It has been widely used in the field of engineering practice [30,31,32,33]. Figure 9 verifies the accuracy of the empirical formula by using the Chen et al. [34] test data. This empirical formula provides the relationship curves of the different groups of test materials, and the goodness of fit is greater than 0.99. This formula can, however, not consider the influence of other factors, such as relative density, on the cyclic numbers required to reach liquefaction. The number of cycles required to cause liquefaction is often related to various factors such as the soil’s relative density, porosity, consolidation ratio, and initial effective consolidation stress. Therefore, this empirical formula must be corrected to consider these factors.

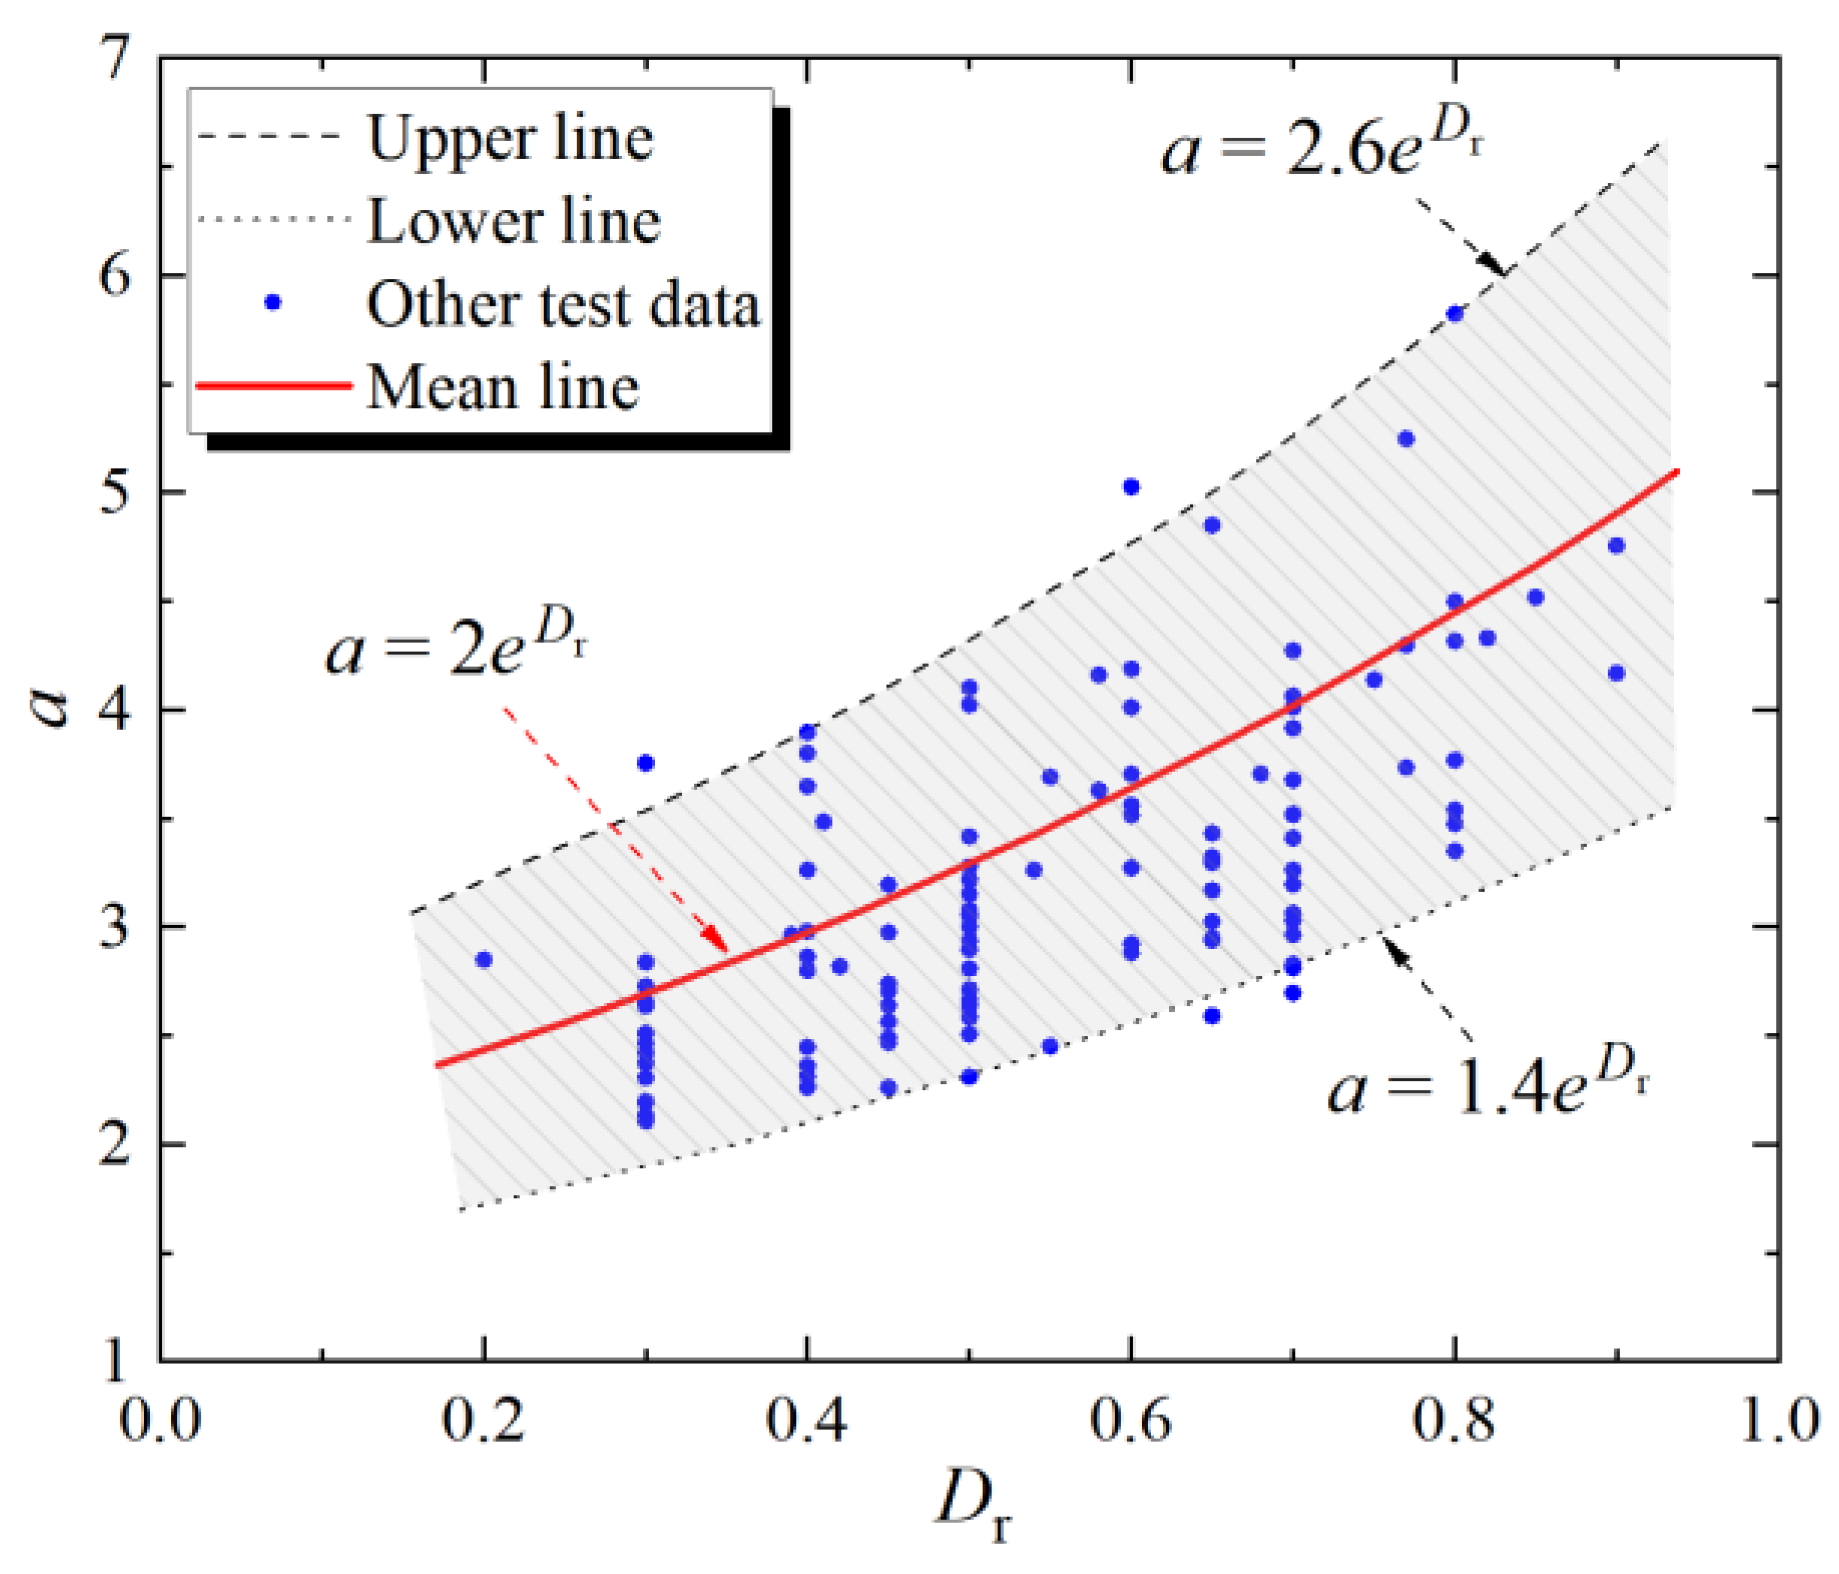
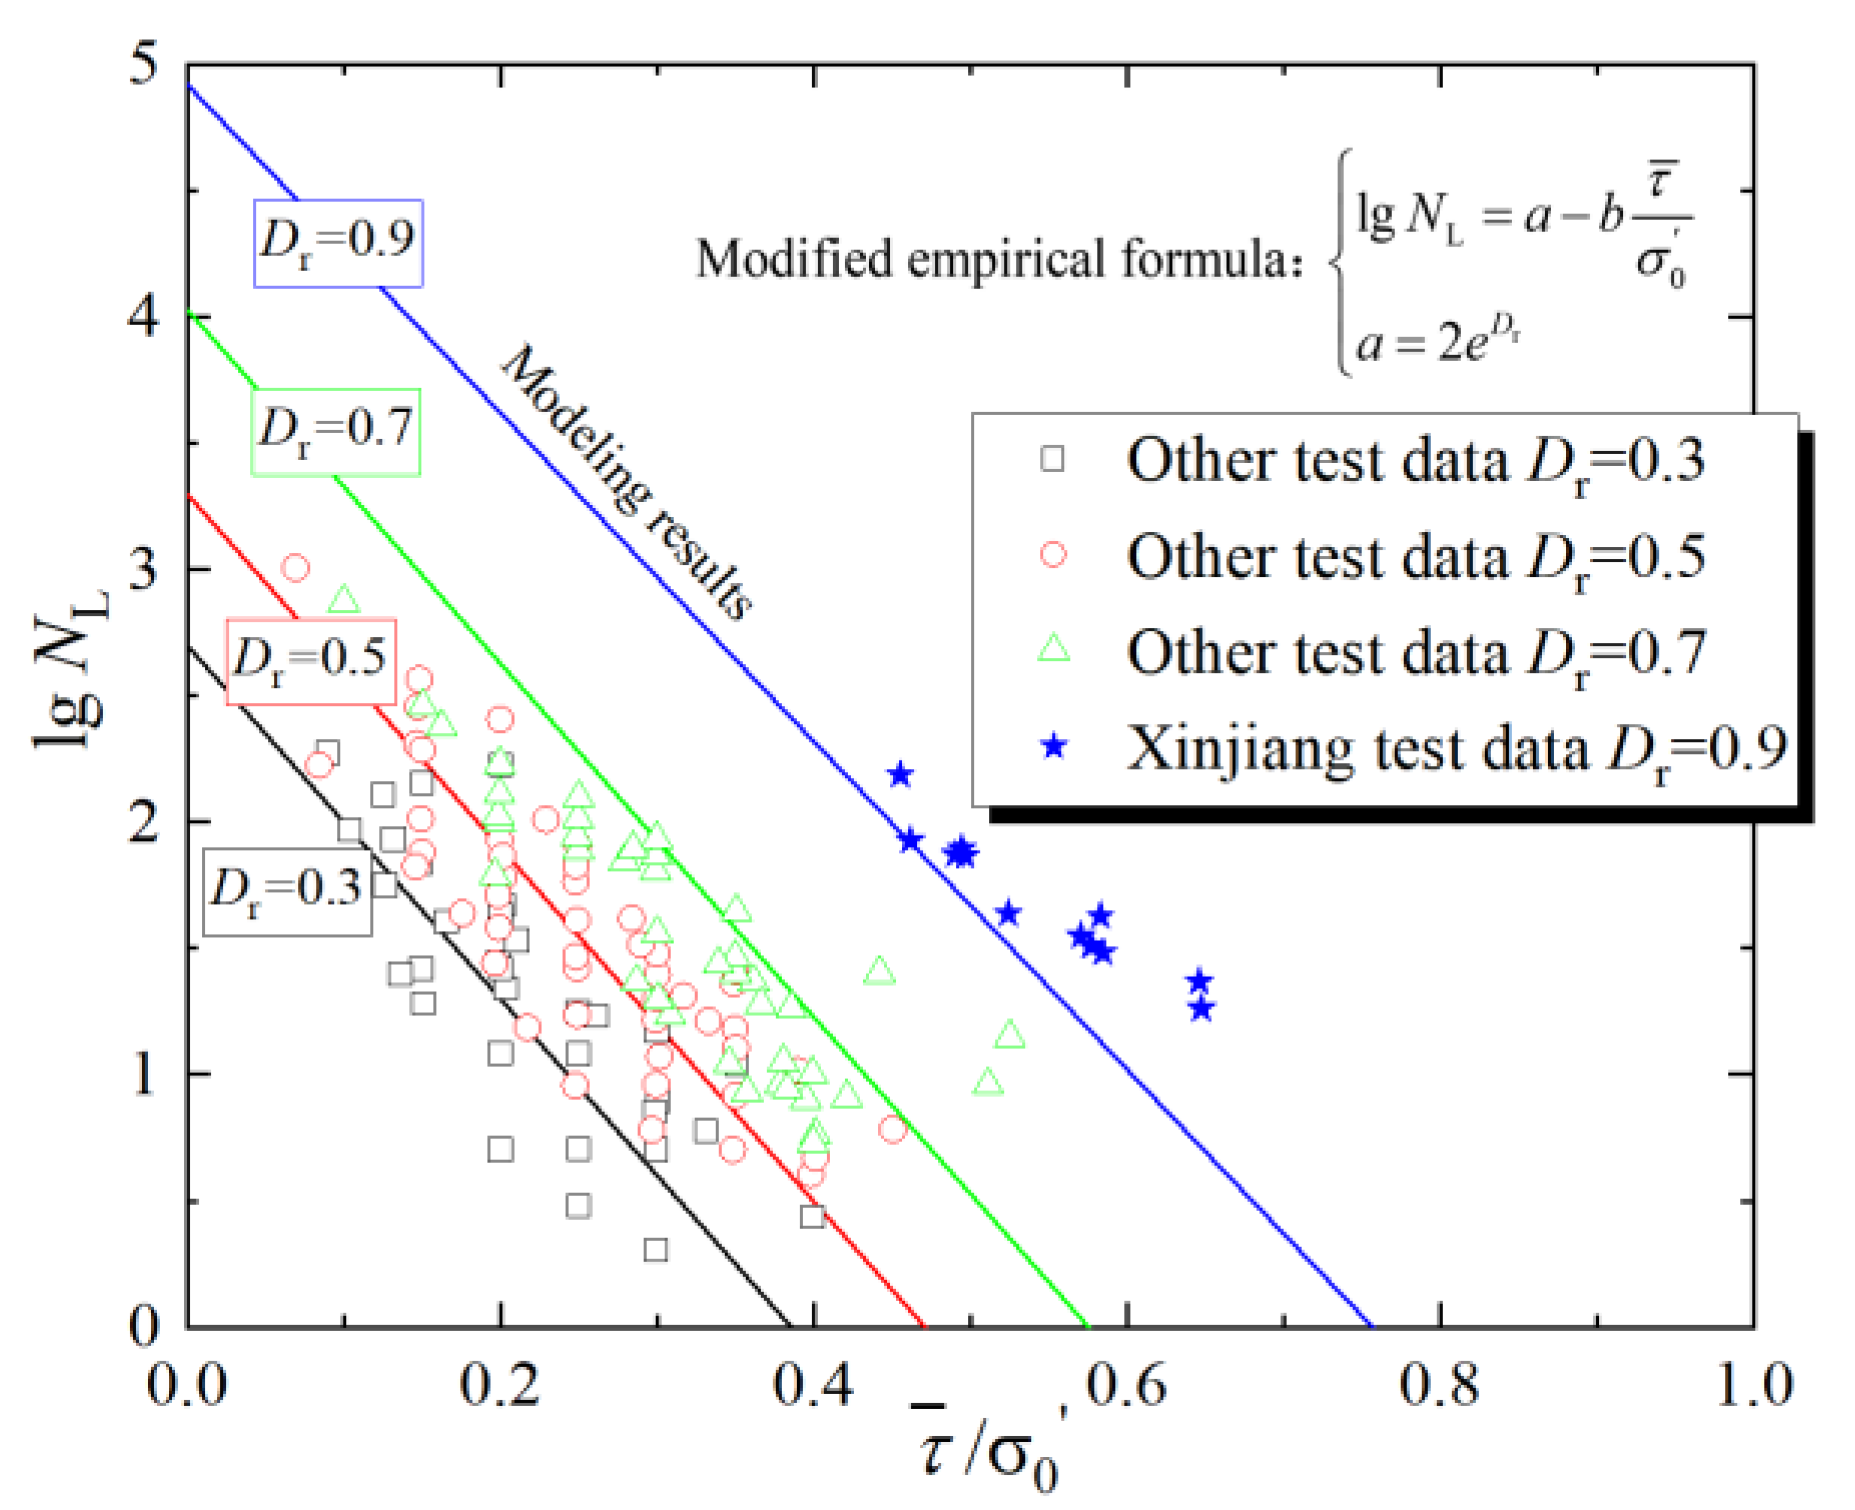
4.2. The Modification of NL

Factors such as the relative density, porosity, consolidation ratio, and initial effective consolidation stress all affect the NL. The influence of the relative density on the dynamic strength of soil is clear, in that the dynamic strength of the material increases with an increase in the relative density [35]. The empirical formula proposed by Xu [30] reflects the liquefaction of materials when the dynamic stress is near zero. At extremely small amplitudes, the value of a is associated with the relative density of the material and the number of cycles required to induce liquefaction. The larger the relative density, the larger the a value and the number of cycles required to cause liquefaction. Based on the relationship between a and Dr [19,27,34,36,37,38,39,40,41,42,43,44,45,46,47], the a value is distributed within a curve band. This implies that the mean curve of the relationship between a and Dr can be calculated, as depicted in Figure 10.
The relative density is selected as the parameter of interest in the NL estimation model so that the empirical formula of Xu [30] can be modified by the relationship between the a value and the Dr mean curve. The expressions are given by the following:
lg N L = a b τ ¯ σ 0 a = 2 e D r
where NL is the number of cycles required to reach liquefaction, a is related to the relative density of the test material, b is the empirical constant, τ ¯ is the mean shear stress, σ 0 is the initial normal stress on the 45° slope of the sample, and Dr is the relative density.
The linear relationship between lg N L and τ ¯ / σ 0 is established by collecting the test data [27,34,37,38,39,43,48]. Figure 11 shows the dynamic triaxial test results of the Xinjiang sand-gravel material. The test value is slightly higher than the simulation result of the modified empirical formula because the initial consolidation ratio of this test is set to 1.5 or 2.0 and isobaric consolidation is not considered. This difference is, however, still within an acceptable range. The relationship between lg N L and τ ¯ / σ 0 for different relative densities that were obtained by the modified empirical formula shows that the larger the relative density is, the larger the intercept of the function line. This means that small dynamic loading requires more cycles to cause liquefaction of the sample.

5. Estimation of the Dynamic Pore Water Pressure of the Saturated Sand-Gravel Material

The sand-gravel material dynamic pore pressure growth conforms to the hyperbolic form seen in Figure 5. The modification of the hyperbolic pore pressure model in this paper can be given by the following Equation (5):
u d σ 3 c = a u N N L 1 + N N L b u
where au and bu are test constants related to the soil properties, u d refers to excess pore water pressure, σ 3 c is the initial effective confining pressure, N is the number of dynamic cycles, and NL is the number of cycles required to reach liquefaction. In practical engineering, when the axial strain reaches a certain value, the soil can be judged to be liquefied. Therefore, au and bu are identified as independent parameters in this paper.
The changes in the dynamic pore water pressure and the corresponding fitting curve of Equation (5) for the eight groups of Xinjiang sand-gravel tests are shown in Figure 12. The fitting curves of the Seed [6] pore water pressure model and the Xu [30] pore water pressure model are also shown in Figure 12 for comparison. Under low initial confining pressure conditions, the pore water pressure in the sample increases rapidly during the initial stages of dynamic loading. At lower initial confining pressures, the pore water pressure changes to conform more readily to Equation (5). The initial confining pressure inhibits the accumulation of pore water pressure to a degree. The fitting curves of the Seed and Idriss (1971) [6] and the Xu and Shen (1983) [30] models both overestimate the growth rate of the pore water pressure during the early stages of dynamic loading but underestimate the dynamic pore pressure in the middle and late stages. Therefore, the Seed and Idriss (1971) [6] and the Xu and Shen (1983) [30] pore water pressure models may provide a dangerous pore water pressure prediction result. In contrast, the pore water pressure model proposed in this paper fits most of the test results well.
The results of the sand-gravel and the sand dynamic tests conducted by several researchers [26,27,42,49] and the fitting curves obtained by using the pore water pressure model proposed in this paper are shown in Figure 13. The pore pressure growth model in Figure 13 covers the three forms of pore pressure growth defined by Zhang [10]. The goodness of fit R 2 of the pore pressure model proposed in this paper for different test pore pressure ratio curves is greater than 0.95. This means that the pore pressure model proposed in this paper is not only suitable for simulating the dynamic pore pressure growth in sand-gravel materials but is also suitable for sandy materials and that it can simulate three different pore pressure growth modes.

6. Conclusions

This paper investigated the different factors that influence liquefaction using the large-scale dynamic triaxial test on a sand-gravel material from the Xinjiang valley, China. The liquefaction characteristics of saturated sand-gravel materials are similar to those of sand. Our proposed pore water pressure growth model can be universally applied to both sand-gravel materials and sandy materials. We propose an evaluation method for the number of cycles required to reach liquefaction, which is the key parameter in the pore water pressure growth model. The main conclusions of this paper are as follows:
(1)
Dislocation and slip occur between the grains of the saturated sand-gravel material under cyclic loading. This causes both reversible and irreversible two-part volume strains, causing an increase in the periodic fluctuation of the dynamic pore water pressure. The increase in the dynamic pore water pressure is more obvious and the amplitude is larger due to the large pores between the sand-gravel materials. The dense saturated sand-gravel material with its large consolidation stress ratio shows a small volume shrinkage and a large volume expansion, where dilatancy can inhibit the increase in the pore water pressure in the sand-gravel.
(2)
During cyclic loading, volume expansion or shrinkage occurs alternately in the saturated sand-gravel material. The mean effective stress of the sand-gravel material decreases, causing the dynamic shear modulus of the material to decrease and the dynamic strain of the material to increase under the same dynamic stress conditions.
(3)
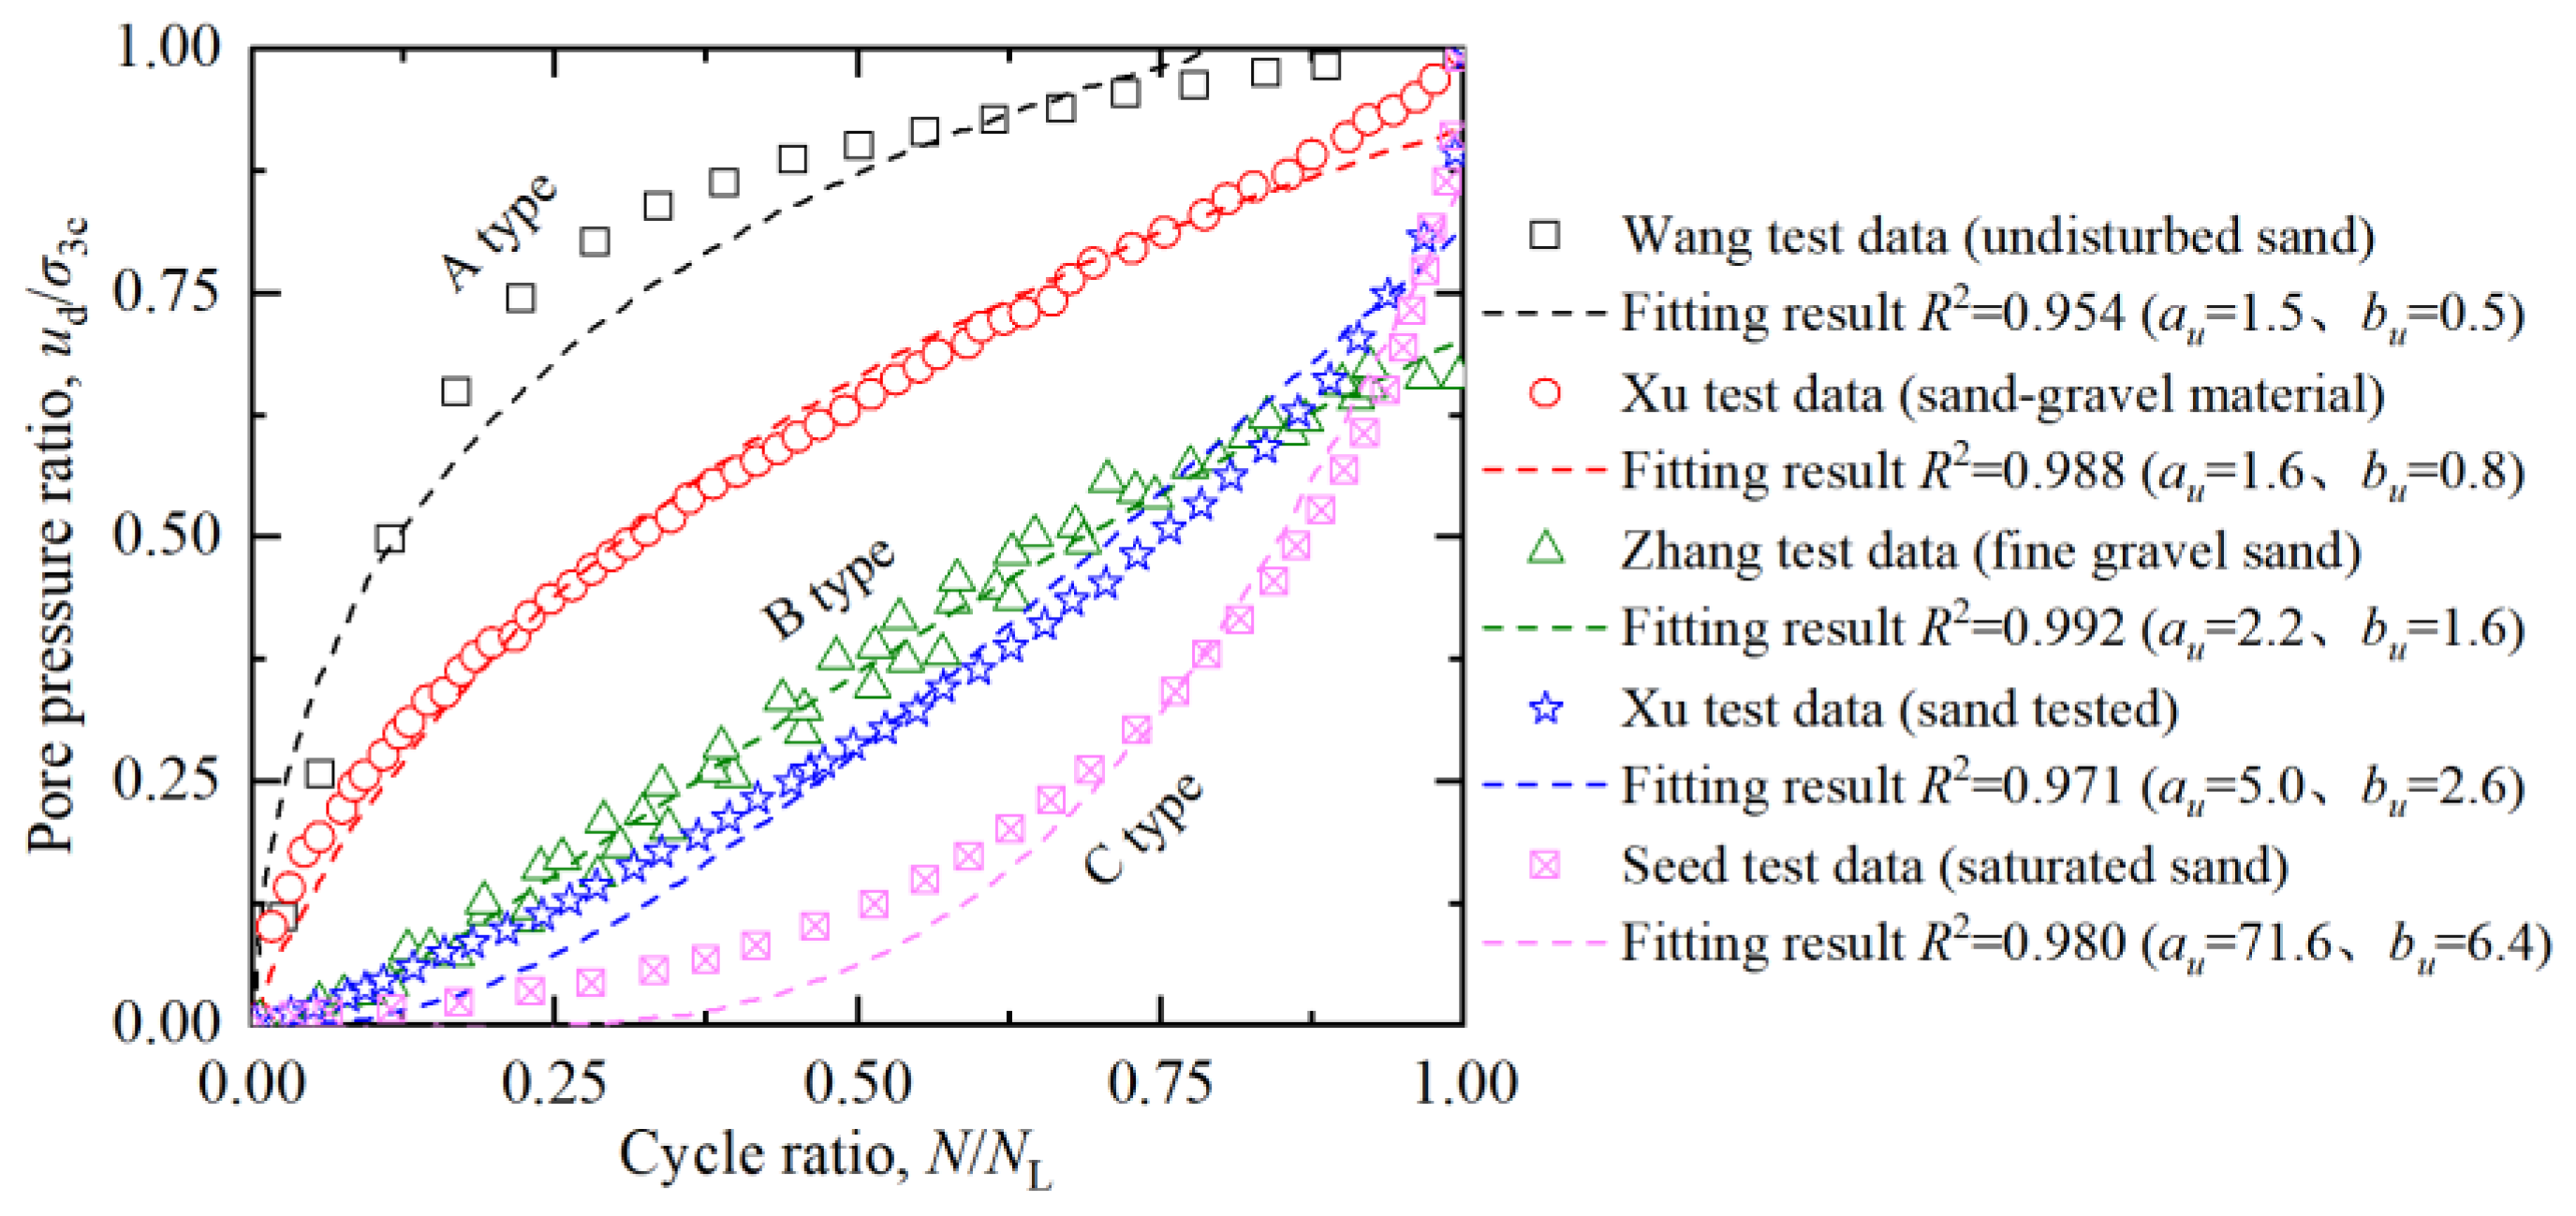
Even if the relative density of the sand-gravel material reaches 90%, there is still the possibility of liquefaction under dynamic loading. Earth-rock dams that are built on sand-gravel overburdens and earth-rock dams filled with sand-gravel materials in earthquake-prone areas should use our proposed analysis and evaluation method to investigate the possibility of sand-gravel liquefaction. We used test data and considered the influence of relative density to modify the existing empirical formula and provide an evaluation method for the number of cycles required to reach liquefaction. We propose a pore water pressure growth model that is suitable for both sand-gravel and sandy materials. Comparisons and validations demonstrated that the proposed model accurately describes the three types of pore water pressure growth processes during liquefaction. The pore pressure growth model proposed in this paper can be used to analyze the liquefaction resistance of the dam foundations and dam structure of high earth-rock dams and high sand-gravel dams located on deep overburdens.

Author Contributions

Methodology, S.C. and B.S.; Writing—original draft, J.C.; Writing—review & editing, Z.F. All authors have read and agreed to the published version of the manuscript.

Funding

This work is supported by the National Natural Science Foundation of China (No. U21A20158, 52222906 and 52309158). The financial support from Nanjing Hydraulic Research Institute (NHRI, Grant Number Y323003) is also greatly appreciated.

Institutional Review Board Statement

Not applicable.

Informed Consent Statement

Not applicable.

Data Availability Statement

Data are contained within the article.

Conflicts of Interest

The authors declare no conflict of interest.

References

  1. Xu, C.S.; Yue, C.; Du, X.L.; Liang, K.; Wang, B. Experimental study on the influence of cyclic loading frequency on liquefaction characteristics of saturated sand. Géotechnique 2024, 25, 1–14. [Google Scholar] [CrossRef]
  2. Sahin, A.; Cetin, K.O. Gravelly Liquefaction Case Histories after 2008 Wenchuan-China Earthquake Mw = 7.9. Int. J. Geosyn. Ground Eng. 2023, 9, 42. [Google Scholar] [CrossRef]
  3. Zhou, Y.G.; Xia, P.; Ling, D.S.; Chen, Y.M. Liquefaction case studies of gravelly soils during the 2008 Wenchuan earthquake. Eng. Geol. 2020, 274, 105691. [Google Scholar] [CrossRef]
  4. Yuan, J.Y.; Wang, Y.L.; Zhan, B.L.; Yuan, X.M.; Wu, X.Y.; Ma, J.J. Comprehensive investigation and analysis of liquefaction damage caused by the Ms7. 4 Maduo earthquake in 2021 on the Tibetan Plateau, China. Soil Dyn. Earthq. Eng. 2022, 155, 107191. [Google Scholar] [CrossRef]
  5. Casagrand, A. Characteristics of cohesionless soils affecting the stability of slopes and earth fills. Bost. Soc. Civ. Eng. 1936, 23, 13–32. [Google Scholar]
  6. Seed, H.B.; Idriss, I.M. A Simplified procedure for evaluating soil liquefaction potential. Soil Mech. Found. Div. J. 1971, 97, 1249–1273. [Google Scholar] [CrossRef]
  7. Booker, J.R.; Rahman, M.S.; Seed, H.B. GADFLEA: A Computer Program for the Analysis of Pore Pressure Generation and Dissipation during Cyclic or Earthquake Loading; College of Engineering, University of California: Berkeley, CA, USA, 1976; pp. 24–76. [Google Scholar]
  8. Finn, W.L.; Lee, K.W.; Martin, G.R. An effective stress model for liquefaction. J. Geotech. Eng. Div. 1977, 103, 517–533. [Google Scholar] [CrossRef]
  9. Xu, Z.Y.; Shen, Z.J. 2-D dynamic analysis of effective stresses of seismic liquefaction. J. East China Tech. Univ. Water Resour. 1981, 2, 1–14. [Google Scholar] [CrossRef]
  10. Zhang, J.M.; Xie, D.Y. A practical algorithm for increasing pore water pressure of saturated sand vibrating. J. Hydraul. Eng. 1991, 8, 45–51. [Google Scholar] [CrossRef]
  11. Martin, G.R.; Finn, W.; Seed, H.B. Fundamentals of liquefaction under cyclic loading. J. Geotech. Eng. Div. 1975, 101, 423–438. [Google Scholar] [CrossRef]
  12. Xie, D.Y. Soil Dynamics; Higher Education Press: Beijing, China, 2011. [Google Scholar]
  13. Cao, Y.L.; He, G.N.; Lin, G. Energy analysis of the rise degree of vibrational pore water pressure in soil. J. Dalian Inst. Technol. 1987, 26, 83–89. [Google Scholar]
  14. Finn, W.; Bhatia, S.K. Prediction of seismic porewater pressures. In Proceedings of the 10th International Conference on Soil Mechanics and Foundation Engineering (Stockholm), Stockholm, Sweden, 15 June 1981. [Google Scholar]
  15. Ishihara, K. Soil Behavior in Earthquake Geotechnics; Oxford University Press: New York, NY, USA, 1996. [Google Scholar]
  16. Huang, C.X.; Cao, T.; Wang, L.; Zhang, L.; Chen, Y.S.; Wang, L. Experimental study on liquefaction influence factors of saturated silty soil using orthogonal design method. Bull. Eng. Geol. Environ. 2024, 83, 304. [Google Scholar] [CrossRef]
  17. Amini, P.F.; Yang, J. Energy-based liquefaction assessment of partially and fully saturated clayey sands. Eng. Geol. 2024, 331, 107434. [Google Scholar] [CrossRef]
  18. Cai, Y.B.; Zhang, Y.L.; Qi, Q.J.; Cheng, Y.; Shi, Y.B.; Sun, Z. Experimental study on strength and liquefaction characteristics of sand under dynamic loading. Sustainability 2023, 15, 10306. [Google Scholar] [CrossRef]
  19. Vargas, R.R.; Ueda, K.; Uemura, K. Influence of the relative density and K0 effects in the cyclic response of Ottawa F-65 sand–cyclic Torsional Hollow-Cylinder shear tests for LEAP-ASIA-2019. Soil Dyn. Earthq. Eng. 2020, 133, 106111. [Google Scholar] [CrossRef]
  20. Lakkimsetti, B.; Latha, G.M. Role of grain size and shape on undrained monotonic shear, liquefaction, and post-liquefaction behaviour of granular ensembles. Soil Dyn. Earthq. Eng. 2023, 173, 108086. [Google Scholar] [CrossRef]
  21. Haeri, S.M.; Nikoonejad, K. Liquefaction behavior of a well-graded gravelly soil under initial static shear stress in cyclic triaxial and simple shear conditions. Int. J. Geomech. 2023, 23, 4023053. [Google Scholar] [CrossRef]
  22. Wang, X.L.; Xu, B.; Su, H.; Pang, R. Elastoplastic constitutive model of gravelly soil and its validation through numerical analysis of the Kobe Port Island liquefaction. Comput. Geotech. 2024, 169, 106213. [Google Scholar] [CrossRef]
  23. Kim, J.; Athanasopoulos-Zekkos, A.; Cubrinovski, M. Monotonic and cyclic simple shear response of well-graded sandy gravel soils from Wellington, New Zealand. J. Geotech. Geoenviron. Eng. 2023, 149, 04023046. [Google Scholar] [CrossRef]
  24. Pokhrel, A.; Chiaro, G.; Kiyota, T.; Cubrinovski, M. Liquefaction characteristics of sand-gravel mixtures: Experimental observations and its assessment based on intergranular state concept. Soils Found. 2024, 64, 101444. [Google Scholar] [CrossRef]
  25. Yuan, X.M.; Wang, H.; Cao, Z.Z.; Xu, H.X. Interpretation to characteristics of gravelly soils sites that liquefied in Wenchuan earthquake. Chin. J. Geophys. 2017, 60, 2733–2743. [Google Scholar] [CrossRef]
  26. Xu, B.; Kong, X.J.; Zou, D.G.; Lou, S.L. Study of dynamic pore water pressure and axial strain in saturated sand-gravel composites. Rock Soil Mech. 2006, 27, 925–928. [Google Scholar] [CrossRef]
  27. Zhang, S.; Zhang, Y.F.; Zhang, L.K.; Liu, Z.J. Influence of confining pressure and vibration frequency on the liquefaction strength of the saturated gravel sand. J. Xinjiang Agric. Univ. 2015, 38, 68–71. [Google Scholar] [CrossRef]
  28. Shamoto, Y.; Zhang, J.M.; Tokimatsu, K. New methods for evaluating large residual post-liquefaction ground settlement and horizontal displacement. Soils Found. 1998, 38, 69–84. [Google Scholar] [CrossRef] [PubMed]
  29. Zhang, J.M. Reversible and irreversible dilatancy of sand. Chin. J. Geotech. Eng. 2000, 22, 12–17. [Google Scholar] [CrossRef]
  30. Xu, Z.Y.; Shen, Z.J. Dynamic analysis of effective stress for seismic strengthening of Yuecheng Reservoir earth dam. Earthq. Eng. Eng. Vib. 1983, 3, 89–109. [Google Scholar] [CrossRef]
  31. Gong, X.Y.; Wang, M.M.; Yang, S.G.; Hu, S.M.; Gou, C. Dynamic response analysis of an upstream tailings dam under earthquake. Nonferrous Met. (Min. Sect.) 2022, 74, 71–77. [Google Scholar] [CrossRef]
  32. Ai, X.Q.; Li, J. Seismic response analysis of underground pipelines under effective stress. J. Disaster Prev. Mitig. Eng. 2005, 25, 1–7. [Google Scholar] [CrossRef]
  33. Xu, Z.Y.; Zhou, J. Dynamic analysis of three-dimensional drainage effective stress of Auroville earth dam. J. Hydraul. Eng. 1991, 19–27+34. [Google Scholar] [CrossRef]
  34. Chen, G.X.; Wu, Q.; Sun, T.; Zhao, K.; Zhou, E.Q.; Xu, L.Y.; Zhou, Y.G. Cyclic behaviors of saturated sand-gravel mixtures under undrained cyclic triaxial loading. J. Earthq. Eng. 2021, 25, 756–789. [Google Scholar] [CrossRef]
  35. Liu, X.; Li, S.; Sun, L.Q. The study of dynamic properties of carbonate sand through a laboratory database. Bull. Eng. Geol. Environ. 2020, 79, 3843–3855. [Google Scholar] [CrossRef]
  36. Eseller, E.E.; Monkul, M.M.; Akin, Ö.; Yenigun, S. The coupled influence of relative density, CSR, plasticity and content of fines on cyclic liquefaction resistance of sands. J. Earthq. Eng. 2017, 23, 909–929. [Google Scholar] [CrossRef]
  37. Hoque, M.M.; Ansary, M.A.; Yasin, S.J.M. Effects of relative density and effective confining pressure on liquefaction resistance of sands. In Proceedings of the 19th International Conference on Soil Mechanics and Geotechnical Engineering, ICSMGE, Seoul, Republic of Korea, 17–22 September 2017. [Google Scholar]
  38. Zhang, B.; Muraleetharan, K.K.; Liu, C. Liquefaction of unsaturated sands. Int. J. Geomech. 2016, 16, 1–8. [Google Scholar] [CrossRef]
  39. Chen, G.X.; Sun, T.; Wang, B.H.; Li, X.J. Undrained cyclic failure mechanisms and resistance of saturated sand-gravel mixtures. Chin. J. Geotech. Eng. 2015, 37, 2140–2148. [Google Scholar] [CrossRef]
  40. Salem, M.; Elmamlouk, H.; Agaiby, S. Static and cyclic behavior of North Coast calcareous sand in Egypt. Soil Dyn. Earthq. Eng. 2013, 55, 83–91. [Google Scholar] [CrossRef]
  41. Xenaki, V.C.; Athanasopoulos, G.A. Dynamic properties and liquefaction resistance of two soil materials in an earthfill dam–Laboratory test results. Soil Dyn. Earthq. Eng. 2008, 28, 605–620. [Google Scholar] [CrossRef]
  42. Wang, B.H.; Liu, J.D.; Chen, G.X. Effects of relative density and structural properties on liquefaction resistance of Nanjing fine sand. J. Disaster Prev. Mitig. Eng. 2007, 27, 383–388+400. [Google Scholar] [CrossRef]
  43. Lin, P.S.; Chang, C.W. Damage investigation and liquefaction potential analysis of gravelly soil. J. Chin. Inst. Eng. 2002, 25, 543–554. [Google Scholar] [CrossRef]
  44. Chien, L.K.; Oh, Y.N.; Chang, C.H. Effects of fines content on liquefaction strength and dynamic settlement of reclaimed soil. Can. Geotech. J. 2002, 39, 254–265. [Google Scholar] [CrossRef]
  45. Evans, M.D.; Zhou, S. Liquefaction behavior of sand-gravel composites. J. Geotech. Eng. 1995, 121, 287–298. [Google Scholar] [CrossRef]
  46. Alba, P.D.; Seed, H.B.; Chan, C.K. Sand liquefaction in large-scale simple shear tests. J. Geotech. Eng. Div. 1976, 102, 909–927. [Google Scholar] [CrossRef]
  47. Seed, H.B.; Martin, P.P.; Lysmer, J. The Generation and Dissipation of Pore Water Pressures during Soil Liquefaction; University of California: Los Angeles, CA, USA, 1975. [Google Scholar]
  48. Wang, G.; Yin, H.; Zheng, H.H.; Yang, J. Comparative experimental study on liquefaction characteristics of carbonate and silica sands. J. Eng. Geol. 2021, 29, 69–76. [Google Scholar] [CrossRef]
  49. Seed, H.B.; Lysmer, J.; Martin, P.P. Pore-water pressure changes during soil liquefaction. J. Geotech. Eng. Div. 1976, 4, 323–346. [Google Scholar] [CrossRef]
Figure 1. Sand-gravel materials in Xinjiang.
Applsci 14 07909 g001
Figure 2. GCTS dynamic triaxial test apparatus.
Applsci 14 07909 g002
Figure 3. Grain-size distribution of tested sand-gravel materials.
Applsci 14 07909 g003
Figure 4. The stress state of the samples in dynamic triaxial tests.
Applsci 14 07909 g004
Figure 5. Pore water pressure growth curves of saturated sand-gravel. (a) S2 pore water pressure; (b) S4 pore water pressure; (c) S7 pore water pressure.
Applsci 14 07909 g005
Figure 6. Upper and lower envelope lines of saturated sand-gravel: (a) saturated sand-gravel upper envelope line; (b) saturated sand-gravel lower envelope line.
Applsci 14 07909 g006
Figure 7. Relationship between sand-gravel material strain and cyclic numbers. (a) S2 and S12; (b) S7 and S17.
Applsci 14 07909 g007
Figure 8. Mean effective stress paths of sand-gravel. (a) S1 mean effective stress path; (b) S2 mean effective stress path; (c) S4 mean effective stress path; (d) S7 mean effective stress path.
Applsci 14 07909 g008
Figure 9. Calculation results of cyclic numbers to liquefaction.
Applsci 14 07909 g009
Figure 10. Relationship between a and Dr.
Applsci 14 07909 g010
Figure 11. Relationship between lg N L and τ ¯ / σ 0 .
Applsci 14 07909 g011
Figure 12. Pore pressure ratio fitting curve of Xinjiang sand-gravel material. (a) Confining pressure is 50 or 100 kPa; (b) confining pressure is 200 or 300 kPa.
Applsci 14 07909 g012
Figure 13. Verification of the pore water pressure model proposed in this paper.
Applsci 14 07909 g013
Table 1. Common pore water pressure growth models.
Pore Water Pressure ModelEquationExplanationReference
Stress model u d σ 3 c = 1 2 + 1 π arcsin 2 N N L 1 θ 1 u d is the dynamic pore water pressure; σ 3 c is the initial confining pressure; N L is the number of cycles required to cause liquefaction; θ is the experimental constant related to the type of material.Seed [6]
Strain model Δ u = E ¯ r Δ ε v d Δ ε v d = c 1 γ c 2 ε v d + c 3 ε v d 2 γ + c 4 ε v d E ¯ r is the tangent modulus of the one-dimensional unloading curve at a point corresponding to the initial vertical effective stress; c 1 , c 2 , c 3 , c 4 are test constants.Martin et al. [11]
Transient model u ( t + Δ t ) = u ( t ) + Δ u = u ( t ) + Δ u σ + Δ u 0 + Δ u T = u ( t + Δ t ) * + Δ u T Δ u σ , Δ u 0 , Δ u T are increments of the pore water pressure during Δ T ; u ( t + Δ t ) * is the pore water pressure without dissipation at ( t + Δ t ) ; u ( t + Δ t ) is the dissipation pore water pressure at ( t + Δ t ) .Xie [12]
Energy model u σ 0 = K W R β W R = 1 lg K c 3 W 0 W 0 = W σ 0 W is the dissipated energy; K and β are test constants.Cao et al. [13]
Endochronic theory u d σ v = A B ln ( 1 + B k ) K is the damage parameter; the variable includes the shear strain amplitude and number of cycles. A and B are test parameters.Finn [14]
Effective stress path model q / p q / p max   , loading q / p < q / p max   , unloading Under loading conditions, additional plastic shear deformation occurs in the soil. The variation of pore water pressure is equal to the variation of the mean effective stress.Ishihara [15]
Table 2. Physical properties of tested sand-gravel materials.
Sand-Gravel Materials in XinjiangMean Grain Size
d50/mm
Specific Gravity GsMinimum Dry Density
ρmin/g·cm−3
Maximum Dry Density
ρmax/g·cm−3
Relative Density
Dr
Dry Density
ρd/g·cm−3
142.751.852.340.92.28
Table 3. Summary of test schemes.
Test NumberKcσ3c (kPa)σd (kPa) C S R
S11.55070.500.56
S2100142.900.57
S3121.250.49
S4200291.450.58
S5245.250.49
S6227.650.46
S7300438.450.58
S8393.150.52
S9346.300.46
S102.05095.100.63
S11100190.950.64
S12175.750.59
S13200387.650.65
S14342.250.57
S15296.750.49
S16300582.800.65
S17519.350.58
S18447.150.50
Table 4. The results for the N L and u d tests on saturated sand-gravel materials.
Test NumberKcσ3c (kPa)ud (kPa)NL
S11.55049.93174.4
S210099.9565.4
S3100.01147.5
S4200197.142.35
S5198.5474.3
S6199.79153.3
S7300295.8730.37
S8298.0743.35
S9299.9484.3
S102.05049.24145.3
S1110095.344.3
S1295.06105.25
S13200187.7723.3
S14193.4235.25
S15195.9378.25
S16300280.6218.25
S17282.7132.2
S18281.0373.2
Disclaimer/Publisher’s Note: The statements, opinions and data contained in all publications are solely those of the individual author(s) and contributor(s) and not of MDPI and/or the editor(s). MDPI and/or the editor(s) disclaim responsibility for any injury to people or property resulting from any ideas, methods, instructions or products referred to in the content.

