Article

Multimodal Interference-Based Fiber Optic Sensors for Glucose and Moisture Content Detection in Honey

by
Mayeli Anais Pérez-Rosas
,
Yahir Nicolás García-Guevara
,
Yadira Aracely Fuentes-Rubio
*,
René Fernando Domínguez-Cruz
,
Oscar Baldovino-Pantaleón
and
Gerardo Romero-Galván
Department of Electrical and Electronic Engineering, Universidad Autónoma de Tamaulipas, Carr. a San Fernando Cruce con Canal Rodhe S/N. Col Arcoiris. Reynosa 88779, Mexico
*
Author to whom correspondence should be addressed.
Appl. Sci. 2024, 14(17), 7914; https://doi.org/10.3390/app14177914
Submission received: 3 August 2024 / Revised: 30 August 2024 / Accepted: 3 September 2024 / Published: 5 September 2024

Abstract

:
Fiber optic sensors (FOSs) have transformed industrial applications with their high sensitivity and precision, especially in real-time monitoring. This study presents a fiber optic sensor based on multimodal interference (MMI) applied to detect honey adulteration. The sensor is built using a non-core multimode fiber (NC-MMF) segment spliced between two standard single-mode fibers (SMFs). We focus on reporting the detection of two main adulterants in honey that modify its refractive index (RI): the presence of glucose and moisture content. Detailed testing was performed with two commercially approved honey brands, named A and B. The sensor successfully detected glucose concentrations from 1% to 5% and moisture content from 0% to 20% for both brands. For glucose detection, we obtained sensitivity values −0.55457 nm/% for brand A and −2.61257 nm/% for brand B. In terms of moisture content in honey, we observed a sensitivity around −0.3154 nm/% and −0.3394 nm/% for brands A and B, respectively. Additionally, temperature tests were performed, showing that the sensor works optimally up to 30 °C. The results were validated using a conventional refractometer, showing a close agreement with the data obtained and confirming the reliability and accuracy of the proposed sensor. Compared to other refractometers, the MMI sensor offers advantages such as real-time monitoring, ease of assembly, cost-effectiveness, and minimal maintenance. Furthermore, the sensor represents an alternative tool to guarantee the quality and authenticity of honey, overcoming the limitations of conventional measurement techniques.

1. Introduction

Fiber optic sensors (FOSs) have emerged as a revolutionary technology in various industrial applications due to their numerous advantages. The development of fiber optic technology began in the 1970s with advancements towards low-loss optical fibers for telecommunications. This led researchers to explore the potential of fiber optics as a novel waveguide for fast data communication [1,2]. The integration of fiber optic communications and optoelectronics industries catalyzed the creation of fiber optic sensors, capable of detecting changes in phase, intensity, wavelength, and external disturbances [3,4]. These sensors offer high sensitivity and precision in detecting environmental changes, allowing real-time monitoring of critical variables. Their ability to operate in hostile environments, compact size, and flexibility enable easy integration into existing systems. Additionally, their capacity to transmit signals over long distances without significant loss ensures efficient and accurate communication. These characteristics, along with low maintenance and high durability, make fiber optic sensors an advanced and reliable solution for improving process control and safety in diverse industries [2,3]. Fiber optic sensors have been developed in various geometries, structures, and platforms, including fiber Bragg gratings (FBGs) [5], long-period gratings (LPGs) [6], specialty fibers [7], tapered fibers [8], multimodal interference (MMI) phenomenon [9,10,11] and in-fiber surface plasmon resonance [12], among others. These varied configurations highlight the versatility and adaptability of FOS technology to meet different sensing requirements.
As already mentioned, fiber optic sensors have been used in multiple areas; in the food industry, fiber optic sensors are particularly valuable for their ability to perform real-time analysis [13]. This capability allows continuous and precise monitoring during production processes, significantly enhancing the quality control and safety of food products. By providing rapid and reliable detection of contaminants and adulterants, these sensors help ensure that foods meet regulatory standards and consumer expectations, reducing the risk of foodborne illnesses and improving trust in the supply chain [14,15]. An excellent example of a food product that could greatly benefit from advanced tracking techniques is honey. Widely consumed for its nutritional value and as a natural sweetener, honey is particularly vulnerable to adulteration [16]. The main mechanisms used to alter honey include dilution with water, the addition of cheap sugars or syrups, mixing with lower quality honey or honey of unknown origin, or adding chemicals such as antibiotics or pesticides to prevent fermentation and prolong shelf life [16,17]. Adulterating honey with water increases its humidity content, potentially enabling the growth of yeasts and other microorganisms, thereby reducing its shelf life and quality. Additionally, honey adulterated with water has a higher risk of microbiological contamination, leading to health issues such as gastrointestinal infections [18,19]. Similarly, adulteration with glucose and other sugars not only degrades the nutritional quality of honey but also alters its chemical and biochemical properties, affecting its taste and potentially harming consumer health [20]. Ensuring the quality and authenticity of honey is essential for consumers to enjoy its nutritional benefits. Various techniques have been developed to measure and analyze the physicochemical parameters of honey, including water content and glucose. Reported techniques include the use of refractometers [21], electrical conductivity [22], spectroscopy [23], stable carbon isotope ratio analysis [24,25], chromatography [26,27], Fourier transform (FT) Raman spectroscopy, and microscopic detection [28]. However, most of these techniques demand a significant amount of manual work and were not applied for practical honey quality assessment. In this way, they come with disadvantages like being time-consuming processes to carry out intricate chemical separation procedures and involving costly isotope testing, which is challenging to incorporate into regular monitoring evaluations [29]. On the other hand, fiber optic sensors have shown satisfactory results in detecting the adulteration of glucose in honey as reported in Reference [30] and both fructose and glucose as detailed in References [31,32]. Additionally, fiber optic sensors have been used to measure honey adulterated with distilled water through reflection techniques, as is noted in References [33,34].
This paper presents a novel study that lies in the development and application of an SMS-configured fiber optic sensor specifically designed to detect low levels of adulteration in honey, particularly through the addition of glucose and moisture, with sensitivity and stability compared to conventional methods. The sensor has a simple structure that consists of a non-core multimode fiber (NC-MMF) segment spliced between two standard single-mode fibers (SMFs). In this scheme, the medium surrounding the NC-MMF plays the role of its coating, which makes the multimode interference taking place in the NC-MMF sensitive to variations in the external refractive index (RI). This effect allows for the detection and quantification of different concentrations of honey adulterated with water or glucose standard optical equipment. An advantage with respect to the published sensors is that their manufacturing does not require functionalization procedures, or the deposition of materials, and does not require special care in handling. The proposed sensor was tested on commercial honey brands, showing a linear response with respect to the level of adulteration, thus demonstrating its potential for low-cost, real-time detection suitable for online analysis in the food industry.

2. Theoretical Description

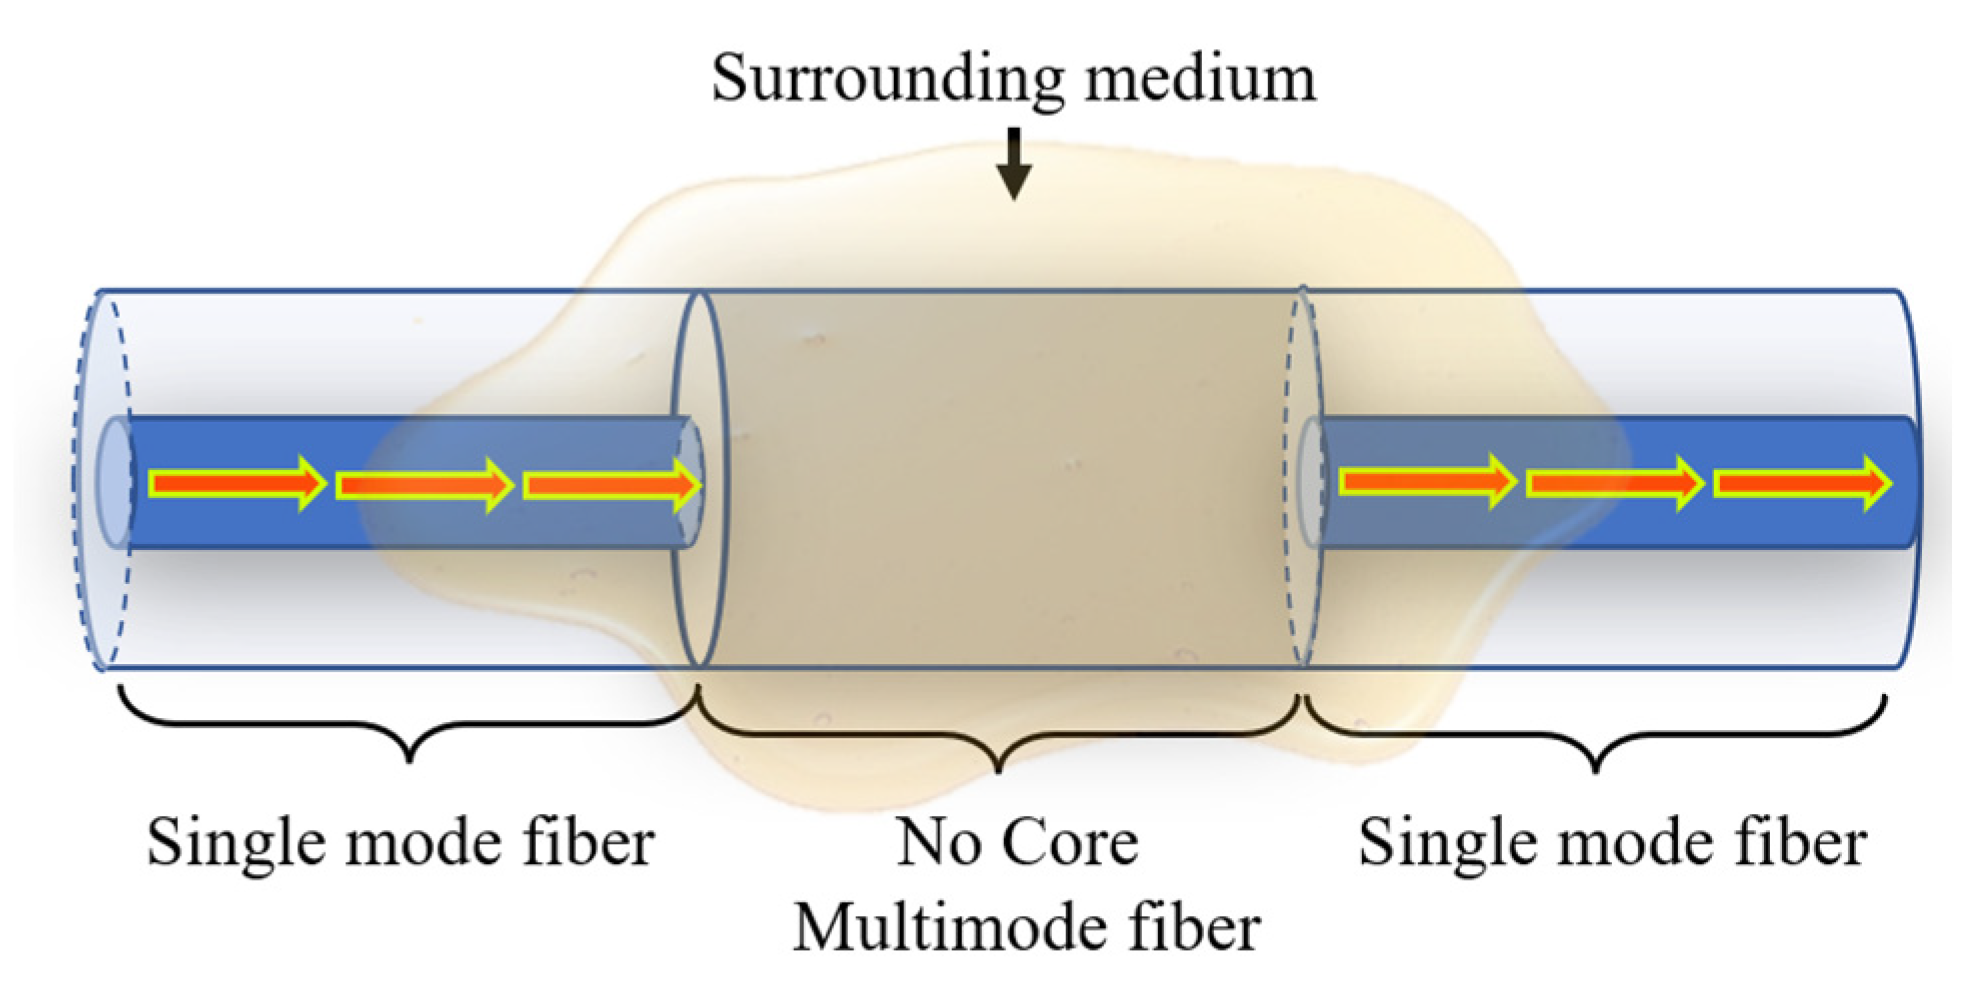
2.1. Multimode Interference (MMI) Sensor Principle

A common geometry of multimode interference-based fiber detection device is known as an SMS configuration. This configuration contains a segment of multimode fiber (MMF) linked between two single-mode fibers (SMFs). If the MMF coating is removed or absent, as in the case of an NC-MMF, then the structure can be used as a sensor of the surrounding media [35], as shown in Figure 1.
As the signal transitions from the SMF to the central portion of the fiber, various modes are stimulated and interact while traversing the NC-MMF. Along the optical axis of the fiber, specific locations generate self-images, which essentially replicate the initial input field [36]. Due to the circular symmetry of the input field, only the linearly polarized mode L P 0 m is excited within the central fiber [37,38,39]. The electric field at the entrance of the MMF can be described as [36,39]:
E r , 0 = 0 M b m ψ m ( r )
where m represents the mode number that is guided, ψ m ( r ) stands for the electric field within the NC-MMF for the m t h mode, r denotes the radial position within the fiber’s cross-section, M signifies the overall count of radial modes stimulated in the NC-MMF segment, and b m indicates the mode expansion coefficient. This coefficient is determined by the overlap integral between E r , 0 and ψ m ( r ) , and the field at distance L of the NC-MMF expressed by [40,41]:
E r , L = m = 1 M b m ψ m ( r ) e i β m L
In this context, β m represents the longitudinal propagation constant specific to the L P 0 m mode within the NC-MMF. According to Equation (2), whenever the phase factor β m L equals p π , where p takes on integer values (1, 2, 3, etc.), the input field is replicated. This replication point is essentially the result of constructive interference among the modes as they propagate along the NC-MMF. The assessment of the transmission output power is determined by [38,42]:
T λ , L = m = 1 M b m 2 ψ m ( r ) e i β m L 2
By Equation (3), the wavelength transmitted through the MMI filter is affected by both the diameter and length of the NC-MMF. The NC-MMF length is meticulously selected to correspond to a specific wavelength by the expression [39,43]:
L M M F = p n e f f D e f f 2 λ p e a k
where n e f f denotes the effective refractive index of the core, D e f f represents the diameter of the NC-MMF, L M M F is the length of the NC-MMF, and p is an integer indicating the self-image order. The reader is referred to Refs. [39,44] for a detailed derivation of Equation (4) within the context of the integrated MMI devices and to Ref. [11] for a simplified extension to fiber-optic MMI devices.
The adjustment of the wavelength occurs through modifications in dimensions or refractive index. The self-image position is influenced by the MMF dimension, and the wavelength is propagated. When the NC-MMF length is precisely aligned with the self-image point for a specific wavelength and spliced with the output SMF, maximum transmission is achieved at that wavelength. However, for other wavelengths, self-image points may fall either before or after the NC-MMF-SMF interface, resulting in reduced light coupling to the SMF. Consequently, when a broadband spectrum passes through such a cascade structure, it gives an MMI passband filter [41]. To reach genuine self-images and minimize loss, most studies opt for the fourth self-image point when selecting the MMF length [45,46]. A detailed description of the multimodal interference effect can be consulted in the Reference [39]. Additionally, in Reference [11], an extensive review of this phenomena using an optical fiber configuration, and its application as a sensor of physical variables is presented.

2.2. Rheological and Optical Characteristics of Honey

The optical and rheological properties of honey are essential for assessing its quality and detecting adulteration. The rheological properties that describe honey’s behavior as a fluid include viscosity, shear-thinning behavior, thixotropy, elasticity, temperature dependence, Newtonian behavior, and storage modulus. These characteristics are influenced by factors such as shear rate, stress, temperature, moisture content, floral source, and processing conditions. For instance, viscosity decreases with rising temperature, while shear-thinning behavior reduces apparent viscosity under increased shear rates. Understanding these properties is crucial for determining honey’s quality, authenticity, and suitability for various applications in the food industry [47,48].
On the other hand, optical properties of honey, such as refractive index, birefringence, optical rotation, absorption and scattering, optical path length variation, and polarization properties, are critical for its interaction with light and for designing fiber optic sensors. The refractive index, which ranges from approximately 1.4815 to 1.504 [49,50], varies with solid content, temperature, and water content, making it a vital parameter for assessing honey quality. It aids in determining moisture content, detecting adulteration, identifying floral sources, and spotting dilution or blending of honey. Furthermore, the refractive index’s sensitivity to moisture content helps estimate honey’s purity, while deviations from standard values indicate potential adulteration [50]. Thus, we observe that honey exhibits a complexity and whose complete description implies the incorporation of the mentioned properties. However, the perspective of our study is focused on using a multimodal interference device to describe the optical characteristics of honey, specifically for identifying adulteration with glucose and measuring moisture content through refractometric measurements. In this sense, all procedures were carefully performed to ensure accuracy and minimize errors.

3. Materials and Methods

3.1. Sensor Fabrication and Experimental Set-Up

The SMS device was constructed following the principles outlined in Equation (4). These devices incorporate a length of Non-Core Multimode Fiber (NC-MMF) sandwiched between two Single-mode Fibers (SMFs). The spectral response of the device was tailored by simply modifying the length of the NC-MMF segment. The SMF used in this application is SMF-28 (Thorlabs, Newton, NJ, USA), characterized by a cladding diameter of 125 µm and a core diameter of 8 µm. The NC-MMF (FG125LA, Thorlabs, Newton, NJ, USA), with a diameter D e f f of 125 μm and a refractive index n e f f of 1.4445 at the operating wavelength of 1550 nm. The sensor assembly was created using a straightforward method involving the splicing of the SMF to the NC-MMF. Subsequently, the NC-MMF length was determined using a vernier caliper, with the splice serving as the zero-length reference point. After marking the NC-MMF at the desired length, it was cleaved at the marked point, followed by the splicing of the second SMF. All fiber segments were joined together using an arc fusion splicer (Fujikura, San Jose, CA, USA, model FSM-60S).
Following the guidance provided by Equation (4) and opting for the fourth self-image ( p = 4 ) , the length of the NC-MMF section was computed to fabricate the sensor targeting a peak wavelength of   λ p e a k = 1488   n m . Consequently, the calculated length of the NC-MMF is approximately L M M F = 6.07   c m . Subsequently, the sensor head was fitted with standard FC/PC connectors for the ease of handling and integration. The manufacturing process is simple and resilient: through a basic variational examination of Equation (4), it becomes evident that any deviation in the length of the MMF results in a change in the peak wavelength [51]:
δ λ p e a k = λ p e a k L δ L = p n e f f D e f f 2 L M M F 2 δ L
Therefore, with p = 4 , n e f f = 1.4445 , D e f f = 125   μ m , L M M F = 6.07   c m , and factoring in the standard resolution of a typical vernier caliper at L = 0.05   m m , the deviation in the peak wavelength amounts to approximately δ λ p e a k 1.4   n m .
The experimental set-up was carried out to evaluate the SMS structure (Figure 2). In this experimental set-up, a superluminescent diode (SLD, Thorlabs, Newton, NJ, USA, model SLD1550S-A1) is employed to generate a wide spectral range spanning from 1420 nm to 1650 nm. The generated signal is launched into the system through an FC/PC connection cable. Subsequently, the signal propagates through the SMS device and is gathered by a secondary patch cable; finally, its transmitted characteristics are assessed using an optical spectrum analyzer (OSA, Anritsu, Morgan Hill, CA, USA, model MS9740A).

3.2. Samples Preparation

3.2.1. Preparation of Samples Adulterated with Glucose

According to the CODEX Alimentarius and the NOM-004-SAG/GAN-2018 Official Mexican Regulation of Honey Production and Specifications, the maximum permissible concentration of glucose in honey is 5% (g/100 gr) [52,53]. Using this reference, the samples were created using two distinct commercially available honey brands from Mexico, both of which had their purity confirmed in compliance with Mexican regulations, revealing a glucose content of 0%. To simulate adulteration, we introduced commercial glucose for both brands at varying levels of adulteration. This adulteration process started at 1% (w/w) and escalated incrementally by 1% (w/w) up to a maximum of 5% (w/w), contingent upon the weight fraction (w/w) [53].
The samples were maintained at room temperature to prevent the formation of any crystalline substances and were gently agitated for 30 min to ensure uniformity and mitigate potential complications arising from inherent fluctuations in glucose concentration. After mixing, the refractive index of each sample was measured using a refractometer (Hanna Instruments, Judetul Salaj, Romania, model HI96800). The refractometer was calibrated prior to measurement following the manufacturer’s instructions.

3.2.2. Preparation of Honey Samples with Moisture Content

For this part of the study, the same commercially available honey brands used in Section 3.2.1 were employed. According to NOM-004-SAG/GAN-2018 [53] and the Codex Alimentarius [52], the maximum permissible moisture content in honey is 20%. To create samples with varying moisture content, specific amounts of distilled water were added to the pure honey. The adulterated honey samples were prepared with moisture concentrations ranging from 20% to 0% in 5% increments based on the weight fraction (w/w).
The samples were mixed at room temperature for 30 min using a stirring device to ensure uniformity. Similar to the glucose adulteration samples, the refractive index of each honey sample was measured using the same refractometer, following the calibration procedure.

4. Results and Discussion

As a first step, we tested our SMS sensor to detect honey alteration by glucose’s presence. In such a case, the experimental testing to validate the SMS sensor began with the sensor in its initial state, safely placed inside a container and exposed to the surrounding air. Subsequently, the sensor was completely immersed in a sample of 5% glucose with brand A honey, ensuring that the NC-MMF section was fully immersed. For each sample, spectral data of the resulting signal were captured using an optical spectrum analyzer (OSA). After each measurement, the sensor underwent a thorough cleaning procedure using vinegar and deionized water, followed by air drying. This ensured the reestablishment of identical initial conditions for each subsequent test. The same sequence of steps was repeated for the adulterated samples of brand B honey.
The next stage of our sequence of experiments was to test our SMS framework for the detection of water content in honey. In this case, we used the set of honey samples adulterated with distilled water described in the previous section. This procedure replicates the moisture content in honey. The experimental tests were carried out in the same way as for the honey samples adulterated with glucose, that is, we started by placing the sensor in the initial condition (surrounded by air). The sensor was then immersed in the adulterated honey sample containing 20% distilled water, and the spectrum of the signal obtained was recorded using the OSA. After each measurement, the sensor was cleaned with vinegar and deionized water and air-dried to ensure identical initial conditions for each test. This process was repeated for each adulterated honey sample, from 20% to 0% adulteration, for brand A and B honey.
Variations in the refractive index (RI) of the medium surrounding the NC-MMF section modify the interference conditions, resulting in a spectral shift. Figure 3a displays the spectral response when the SMS sensor is immersed in the brand A honey samples adulterated with glucose. The same spectral response was observed for honey from brand B. Similarly, Figure 3b shows the spectral response of the SMS sensor for all samples of honey from brand A adulterated with water (simulating moisture content in honey) at concentrations ranging from 20% to 0% in 5% increments. The spectrum of the sensor in its initial condition (in air) is also included as a comparative reference. The same spectral response was obtained for honey from brand B.
It is important to note that the spectral shift differs for samples adulterated with glucose and water. This behavior is due to the refractive index of glucose being higher than water. Therefore, when honey is mixed with water, the wavelength shifts are similar but of different magnitudes.
To validate the sensor, the refractive index obtained from the refractometer (Hanna Instruments, Judetul Salaj, Romania, model HI96800) for all honey samples adulterated with both glucose and distilled water was used. Then, the spectral shift of the peak wavelength, Δλ, was calculated as a function of the concentration of each adulterated honey sample. This shift was determined by measuring the difference between the peak wavelengths when the SMS structure was immersed in the sample and its position when measured in air. The negative spectral shift is proportional to the adulteration concentration level of the sample. This spectral shift was then compared with the refractive indices obtained from each sample recorded with the refractometer, as presented in Figure 4. Specifically, Figure 4a,b show the spectral shift for glucose-adulterated honey of brands A and B, respectively, compared to the refractometer measurements. Similarly, Figure 4c,d illustrate the spectral change for honey adulterated with distilled water, simulating moisture content, for brands A and B, respectively, compared to the refractive index obtained from the refractometer.
By fitting the experimental data to a linear function, we obtained sensitivities of −0.55457 nm/% and −0.0018 nm/% for brand A honey adulterated with glucose, using the SMS sensor and the refractometer, respectively. For brand B honey adulterated with glucose, the linearity values were −2.61257 nm/% for the SMS sensor and −0.00163 nm/% for the refractometer. A similar response was observed for honey adulterated with distilled water. The sensitivity was −0.3154 nm/% and −0.3394 nm/% for the SMS sensor for samples A and B, respectively, and −0.00217 nm/% and −0.00214 nm/% for the refractometer for samples A and B, respectively. Comparing the sensor response with the readings recorded by the refractometer, we observed very similar behavior in both measurement systems.
Furthermore, considering the maximum resolution of the OSA instrument used in our experiments (0.03 nm), the obtained sensitivities indicate that glucose levels as small as 0.054% and 0.011% can be detected for brands A and B, respectively. It is also possible for the sensor to detect moisture levels in the honey of brands A and B at 0.095% and 0.088%, respectively. In other words, variations in moisture and glucose levels of less than 1% can be monitored. This suggests that our approach could be suitable for quality control in honey production. Additionally, compared to the results obtained through a well-established measurement parameter, such as the refractometer, our proposed measurement technique demonstrates both reliability and accuracy.
To evaluate the accuracy and repeatability of the measurements obtained from the proposed sensor, we carefully selected representative samples of honey from brand A with glucose adulterations in concentrations of 1%, 3%, and 5%. For each selected sample, we meticulously measured the wavelength peaks, repeating the process three times. This procedure included washing, cleaning, and drying the sensor between measurements. The standard deviations resulting from these repetitions are detailed in Table 1. In the case of the 5% concentration, we observed a variation likely attributed to the glucose level approaching the saturation limit of the solution.
A similar process was carried out to determine the repeatability of the sensor when measuring honey with moisture content. Three representative samples were selected with adulteration concentrations of 5%, 10%, and 15%. These samples were measured three times each, following the same measurement procedure described above, which included cleaning with vinegar, deionized water, and air drying. The results obtained are shown in Table 1.
We also investigated the influence of thermal effects. To explore this, measurements were performed at different temperatures, starting with the sample containing 5% glucose concentration for honey brand A. The MMI sensor was immersed in the sample, and the vessel was placed on a heating plate (Cimarec, ThermoFisher Scientific, Waltham, MA, USA, model SP1313225). The temperature was gradually raised from 25 °C to 45 °C in 5 °C increments. The entire system was housed within a temperature chamber. At each temperature, the sample was allowed to stabilize for 20 min before the spectrum was recorded. We calculated a thermal sensitivity of 0.312 nm/°C. A similar procedure was performed to determine the sensor response at different temperatures for samples adulterated with distilled water from brand A honey. The sensor behavior was similar, emphasizing the need to maintain a constant temperature during measurements to avoid small variations in the refractive index.
The results showed that increasing the temperature affects the sensor response due to the rheological properties of honey, such as temperature-dependent viscosity and Newtonian behavior. This effect produces a non-linear temperature response in the sensor. Therefore, it is suggested to use the sensor to detect moisture in honey at a maximum ambient temperature of 30 °C to ensure accurate measurements. It is important to mention that there are strategies to athermalize MMI devices, such as partially coating the NC-MMF with a polymeric material whose thermo-optical coefficient compensates for the thermal effects of silica [54,55]. However, these strategies were not part of this experimental study.

5. Conclusions

This paper presents an experimental investigation of a proposed fiber optic sensor using an SMS configuration to detect adulteration in honey by the two most common mechanisms: by the addition of glucose and moisture content. The sensor demonstrated its efficacy in detecting glucose adulteration at concentrations between 1% and 5% and in detecting moisture content ranging from 0% to 20% using distilled water. Rigorous testing involved two commercially approved honey brands complying with Mexican authenticity laws. The sensor exhibits notable advantages, including simple fabrication, the use of inexpensive conventional fibers, and a linear response, making it promising for quality assessment in the food industry.
The results demonstrated the sensor’s sensitivity, with values around −0.55457 nm/% for honey brand A and −2.61257 nm/% for honey brand B when detecting glucose adulteration and −0.3154 nm/% and −0.3394 nm/% when detecting moisture adulteration for honey brand A and B. The accuracy and reliability of the sensor were validated by comparing its measurements with those obtained from a conventional refractometer, showing close agreement and an absence of bias.
The MMI device ensures effective performance when used at temperatures up to 30 °C, crucial for maintaining measurement accuracy under normal honey processing and storage conditions. This feature significantly increases interest in the food industry as a robust mechanism for effectively monitoring honey adulteration levels, thus safeguarding honey product authenticity and quality in the market.
The proposed MMI sensor offers several advantages over traditional refractometers. While refractometers are well-known for their high numerical sensitivity, this can make them more susceptible to environmental noise and fluctuations, potentially complicating measurements in real-world conditions. In contrast, the SMS sensor’s lower sensitivity contributes to its superior stability and robustness in practical applications, allowing for more reliable and continuous real-time monitoring without frequent recalibration or complex maintenance. This is particularly beneficial in industrial settings where uninterrupted monitoring is critical to ensure product quality and consistency. Additionally, the SMS sensor’s design facilitates integration into automated systems, reducing operational costs over time.
Moreover, the MMI sensor allows continuous and real-time monitoring, enhancing its practicality for ongoing honey quality control in contrast with commercial refractometers that provide only discrete measurements. The MMI sensors have a simple structure using conventional optical fibers, making it a more cost-effective and accessible option. Its ability to detect small levels of honey adulteration with high sensitivity further positions the MMI sensor as an attractive alternative for ensuring honey quality.
Also, the MMI sensor has other significant advantages such as sensitivity to multiple parameters, lower maintenance requirements, ease of integration into automated systems, portability, versatility in applications, and faster response times. These attributes make the MMI sensor a robust and flexible tool suitable for several industrial applications.
Despite the inherent complexity of honey, which typically exhibits Newtonian behavior but can display non-Newtonian characteristics when adulterated, the sensor optimally addressed the challenge of measuring adulterated honey. This highlights the sensor’s capability to account for the intricate rheological and optical properties of honey. The potential impact of this sensor is significant, given its ability to detect low-level adulteration, user-friendly design, and real-time monitoring capabilities. Future work suggests developing a model that incorporates the elastic, mechanical, and optical characteristics of honey to provide a more comprehensive analysis.

Author Contributions

Conceptualization and methodology: R.F.D.-C. and Y.A.F.-R.; experiments, data collection, and data curation: M.A.P.-R. and Y.N.G.-G.; theoretical analysis and numerical calculations: M.A.P.-R., Y.N.G.-G. and O.B.-P.; formal analysis: Y.A.F.-R., G.R.-G. and R.F.D.-C.; project supervision: Y.A.F.-R., R.F.D.-C. and G.R.-G. All authors contributed to writing the paper. All authors have read and agreed to the published version of the manuscript.

Funding

This research was partially funded by Secretaría de Investigación y Posgrado, Universidad Autónoma de Tamaulipas, by internal grant UAT/CE/116/2022 (“Expansion of the Research Capacity of the Electronics group at UAM Reynosa Rodhe”), grant UAT/SIP/INV/2023/075 (Research Project UAT 2023), and the UAM Reynosa-Rodhe Operational Plan.

Institutional Review Board Statement

Not applicable.

Informed Consent Statement

Not applicable.

Data Availability Statement

The original contributions presented in the study are included in the article, further inquiries can be directed to the corresponding author.

Conflicts of Interest

The authors declare no competing financial interest.

References

  1. Gholamzadeh, B.; Nabovati, H. Fiber optic sensors. Int. J. Electron. Commun. Eng. 2008, 2, 1107–1117. [Google Scholar]
  2. Culshaw, B.; Kersey, A. Fiber-optic sensing: A historical perspective. J. Light. Technol. 2008, 26, 1064–1078. [Google Scholar] [CrossRef]
  3. Udd, E.; Spillman, W.B., Jr. Fiber Optic Sensors: An Introduction for Engineers and Scientists; John Wiley & Sons: Hoboken, NJ, USA, 2011. [Google Scholar]
  4. Al-Azzawi, A. Fiber Optics: Principles and Advanced Practices, 2nd ed.; CRC Press: Boca Raton, FL, USA, 2017. [Google Scholar]
  5. Sahota, J.K.; Gupta, N.; Dhawan, D. Fiber Bragg grating sensors for monitoring of physical parameters: A comprehensive review. Opt. Eng. 2020, 59, 060901. [Google Scholar] [CrossRef]
  6. James, S.W.; Tatam, R.P. Optical fibre long-period grating sensors: Characteristics and application. Meas. Sci. Technol. 2003, 14, R49–R61. [Google Scholar] [CrossRef]
  7. Zhang, T.; Zheng, Y.; Wang, C.; Mu, Z.; Liu, Y.; Lin, J. A review of photonic crystal fiber sensor applications for different physical quantities. Appl. Spectrosc. Rev. 2017, 53, 486–502. [Google Scholar] [CrossRef]
  8. Jarzebinska, R.; Cheung, C.S.; James, S.W.; Tatam, R.P. Response of the transmission spectrum of tapered optical fibres to the deposition of a nanostructured coating. Meas. Sci. Technol. 2009, 20, 034001. [Google Scholar] [CrossRef]
  9. Mehta, A.; Mohammed, W.; Johnson, E.G. Multimode interference-based fiber-optic displacement sensor. IEEE Photonics Technol. Lett. 2003, 15, 1129–1131. [Google Scholar] [CrossRef]
  10. Wang, K.; Dong, X.; Köhler, M.H.; Kienle, P.; Bian, Q.; Jakobi, M.; Koch, A.W.J.I.S.J. Advances in optical fiber sensors based on multimode interference (MMI): A review. IEEE Sens. J. 2020, 21, 132–142. [Google Scholar] [CrossRef]
  11. Guzmán-Sepúlveda, J.R.; Guzmán-Cabrera, R.; Castillo-Guzmán, A.A.J.S. Optical sensing using fiber-optic multimode interference devices: A review of nonconventional sensing schemes. Sensors 2021, 21, 1862. [Google Scholar] [CrossRef]
  12. Rivero, P.J.; Goicoechea, J.; Arregui, F.J. Localized Surface Plasmon Resonance for Optical Fiber-Sensing Applications; InTech: Nappanee, IN, USA, 2017. [Google Scholar]
  13. Narsaiah, K.; Jha, S.N.; Bhardwaj, R.; Sharma, R.; Kumar, R. Optical biosensors for food quality and safety assurance-a review. J. Food Sci. Technol. 2012, 49, 383–406. [Google Scholar] [CrossRef]
  14. Verissimo, M.I.S.; Gamelas, J.A.F.; Fernandes, A.J.S.; Evtuguin, D.V.; Gomes, M. A new formaldehyde optical sensor: Detecting milk adulteration. Food Chem. 2020, 318, 126461. [Google Scholar] [CrossRef] [PubMed]
  15. Fuentes-Rubio, Y.A.; Zuniga-Avalos, Y.A.; Guzman-Sepulveda, J.R.; Dominguez-Cruz, R.F. Refractometric Detection of Adulterated Milk Based on Multimode Interference Effects. Foods 2022, 11, 1075. [Google Scholar] [CrossRef] [PubMed]
  16. Fakhlaei, R.; Selamat, J.; Khatib, A.; Razis, A.F.A.; Sukor, R.; Ahmad, S.; Babadi, A.A. The Toxic Impact of Honey Adulteration: A Review. Foods 2020, 9, 1538. [Google Scholar] [CrossRef] [PubMed]
  17. Jaafar, M.B.; Othman, M.B.; Yaacob, M.; Talip, B.A.; Ilyas, M.A.; Ngajikin, N.H.; Fauzi, N.A.M. A Review on Honey Adulteration and the Available Detection Approaches. Int. J. Integr. Eng. 2020, 12, 125–131. [Google Scholar] [CrossRef]
  18. Zak, N.; Wilczynska, A. The Importance of Testing the Quality and Authenticity of Food Products: The Example of Honey. Foods 2023, 12, 3210. [Google Scholar] [CrossRef] [PubMed]
  19. Soares, S.; Amaral, J.S.; Oliveira, M.; Mafra, I. A Comprehensive Review on the Main Honey Authentication Issues: Production and Origin. Compr. Rev. Food Sci. Food Saf. 2017, 16, 1072–1100. [Google Scholar] [CrossRef]
  20. Bogdanov, S. Authenticity of honey and other bee products: State of the art. Bull. Univ. Agric. Sci. Vet. Med. Cluj-Napoca 2007, 63, 64. [Google Scholar]
  21. Seraglio, S.K.T.; Bergamo, G.; Molognoni, L.; Daguer, H.; Silva, B.; Gonzaga, L.V.; Fett, R.; Costa, A.C.O. Quality changes during long-term storage of a peculiar Brazilian honeydew honey: “Bracatinga”. J. Food Compos. Anal. 2021, 97, 103769. [Google Scholar] [CrossRef]
  22. Acquarone, C.; Buera, P.; Elizalde, B. Pattern of pH and electrical conductivity upon honey dilution as a complementary tool for discriminating geographical origin of honeys. Food Chem. 2007, 101, 695–703. [Google Scholar] [CrossRef]
  23. Mantha, M.; Urban, J.R.; Mark, W.A.; Chernyshev, A.; Kubachka, K.M. Direct Comparison of Cavity Ring Down Spectrometry and Isotope Ratio Mass Spectrometry for Detection of Sugar Adulteration in Honey Samples. J. AOAC Int. 2018, 101, 1857–1863. [Google Scholar] [CrossRef]
  24. Tosun, M. Detection of adulteration in honey samples added various sugar syrups with 13C/12C isotope ratio analysis method. Food Chem. 2013, 138, 1629–1632. [Google Scholar] [CrossRef] [PubMed]
  25. Cinar, S.B.; Eksi, A.; Coskun, I. Carbon isotope ratio (13C/12C) of pine honey and detection of HFCS adulteration. Food Chem. 2014, 157, 10–13. [Google Scholar] [CrossRef] [PubMed]
  26. Wang, J.M.; Xue, X.F.; Du, X.J.; Cheng, N.; Chen, L.Z.; Zhao, J.; Zheng, J.B.; Cao, W. Identification of Acacia Honey Adulteration with Rape Honey Using Liquid Chromatography-Electrochemical Detection and Chemometrics. Food Anal. Method 2014, 7, 2003–2012. [Google Scholar] [CrossRef]
  27. Puscas, A.; Hosu, A.; Cimpoiu, C. Application of a newly developed and validated high-performance thin-layer chromatographic method to control honey adulteration. J. Chromatogr. A 2013, 1272, 132–135. [Google Scholar] [CrossRef] [PubMed]
  28. Gallardo-Velázquez, T.; Osorio-Revilla, G.; Loa, M.Z.-d.; Rivera-Espinoza, Y. Application of FTIR-HATR spectroscopy and multivariate analysis to the quantification of adulterants in Mexican honeys. Food Res. Int. 2009, 42, 313–318. [Google Scholar] [CrossRef]
  29. Roussel, S.; Bellon-Maurel, W.; Roger, J.M.; Grenier, P. Authenticating white grape must variety with classification models based on aroma sensors, FT-IR and UV spectrometry. J. Food Eng. 2003, 60, 407–419. [Google Scholar] [CrossRef]
  30. Isa, N.M.; Irawati, N.; Rosol, A.H.A.; Rahman, H.A.; Ismail, W.I.W.; Yusoff, M.H.M.; Naim, N.F. Silica Microfiber Sensor for the Detection of Honey Adulteration. Adv. Sci. Lett. 2017, 23, 5532–5535. [Google Scholar] [CrossRef]
  31. Bidin, N.; Zainuddin, N.H.; Islam, S.; Abdullah, M.; Marsin, F.M.; Yasin, M. Sugar detection in adulterated honey via fiber optic displacement sensor for food industrial applications. IEEE Sens. J. 2016, 16, 299–305. [Google Scholar] [CrossRef]
  32. Vikas; Yadav, M.K.; Kumar, P.; Verma, R.K. Detection of adulteration in pure honey utilizing Ag-graphene oxide coated fiber optic SPR probes. Food Chem. 2020, 332, 127346. [Google Scholar] [CrossRef]
  33. Rosli, N.N.F. Fibre optic displacement sensor for honey purity detection in distilled water. Enhanc. Knowl. Sci. Technol. 2022, 2, 328–336. [Google Scholar] [CrossRef]
  34. Hida, N.; Bidin, N.; Abdullah, M.; Yasin, M. Fiber optic displacement sensor for honey purity detection in distilled water. Optoelectron. Adv. Mater. 2013, 7, 565–568. [Google Scholar]
  35. Zhao, Y.; Zhao, J.; Zhao, Q. Review of no-core optical fiber sensor and applications. Sens. Actuators A Phys. 2020, 313, 112160. [Google Scholar] [CrossRef]
  36. Zhao, J.; Wang, J.; Zhang, C.; Guo, C.; Bai, H.; Xu, W.; Chen, L.; Miao, C. Refractive Index Fiber Laser Sensor by Using Tunable Filter Based on No-Core Fiber. IEEE Photonics J. 2016, 8, 6805008. [Google Scholar] [CrossRef]
  37. Pachon, E.G.; Franco, M.A.; Cordeiro, C.M. Spectral bandwidth analysis of high sensitivity refractive index sensor based on multimode interference fiber device. In Proceedings of the OFS2012 22nd International Conference on Optical Fiber Sensors, Beijing, China, 15–19 October 2012; pp. 1208–1211. [Google Scholar]
  38. Mohammed, W.S.; Mehta, A.; Johnson, E.G. Wavelength Tunable Fiber Lens Based on Multimode Interference. J. Light. Technol. 2004, 22, 469–477. [Google Scholar] [CrossRef]
  39. Soldano, L.B.; Pennings, E.C.M. Optical multi-mode interference devices based on self-imaging: Principles and applications. J. Light. Technol. 1995, 13, 615–627. [Google Scholar] [CrossRef]
  40. Wang, Q.; Farrell, G.; Yan, W. Investigation on Single-Mode–Multimode– Single-Mode Fiber Structure. J. Light. Technol. 2008, 26, 512–519. [Google Scholar] [CrossRef]
  41. Antonio-Lopez, J.E.; LiKamWa, P.; Sanchez-Mondragon, J.J.; May-Arrioja, D.A. All-fiber multimode interference micro-displacement sensor. Meas. Sci. Technol. 2013, 24, 055104. [Google Scholar] [CrossRef]
  42. Mukhopadhyay, P.K.; Gupta, P.K.; Singh, A.; Sharma, S.K.; Bindra, K.S.; Oak, S.M. Note: Broadly tunable all-fiber ytterbium laser with 0.05 nm spectral width based on multimode interference filter. Rev. Sci. Instrum. 2014, 85, 056101. [Google Scholar] [CrossRef]
  43. Younus, S.I.; Al-Dergazly, A.A.; Abass, A. Characterization of Multimode Interference Based Optical Fiber. In Proceedings of the IOP Conference Series: Materials Science and Engineering; IOP Publishing: Bristol, UK, 2021; p. 012060. [Google Scholar]
  44. Okamoto, K. Fundamentals of Optical Waveguides; Elsevier: Amsterdam, The Netherlands, 2021. [Google Scholar]
  45. Antonio-Lopez, J.E.; Sanchez-Mondragon, J.J.; LiKamWa, P.; May-Arrioja, D.A. Fiber-optic sensor for liquid level measurement. Opt. Lett. 2011, 36, 3425–3427. [Google Scholar] [CrossRef]
  46. Ma, L.; Qi, Y.; Kang, Z.; Bai, Y.; Jian, S. Tunable fiber laser based on the refractive index characteristic of MMI effects. Opt. Laser Technol. 2014, 57, 96–99. [Google Scholar] [CrossRef]
  47. Faustino, C.; Pinheiro, L. Analytical Rheology of Honey: A State-of-the-Art Review. Foods 2021, 10, 1709. [Google Scholar] [CrossRef] [PubMed]
  48. Bambang, N.; Ikhsan, M.; Sukri, N. Rheological Properties of Honey and its Application on Honey Flow Simulation through Vertical Tube. In Proceedings of the IOP Conference Series: Earth and Environmental Science; IOP Publishing: Bristol, UK, 2019; p. 012041. [Google Scholar]
  49. Machado De-Melo, A.A.; Almeida-Muradian, L.B.d.; Sancho, M.T.; Pascual-Maté, A. Composition and properties of Apis mellifera honey: A review. J. Apic. Res. 2017, 57, 5–37. [Google Scholar] [CrossRef]
  50. Bogdanov, S.; Lüllmann, C.; Martin, P.; von der Ohe, W.; Russmann, H.; Vorwohl, G.; Oddo, L.P.; Sabatini, A.-G.; Marcazzan, G.L.; Piro, R.; et al. Honey quality and international regulatory standards: Review by the International Honey Commission. Bee World 2015, 80, 61–69. [Google Scholar] [CrossRef]
  51. Mar-Abundis, N.; Fuentes-Rubio, Y.A.; Dominguez-Cruz, R.F.; Guzman-Sepulveda, J.R. Sugar Detection in Aqueous Solution Using an SMS Fiber Device. Sensors 2023, 23, 6289. [Google Scholar] [CrossRef] [PubMed]
  52. CXS 12-1981; Standard for Honey. Food and Agriculture Organization of the United Nations: Rome, Italy, 2019.
  53. NOM-004-SAG/GAN-2018; Producción de Miel y Especificaciones. Secretaría de Agricultura y Desarrollo Rural: Guadalajara, Mexico, 2020.
  54. Ruiz-Perez, V.I.; Velasco-Bolom, P.M.; May-Arrioja, D.A.; Sepulveda, J.R.G. Measuring the Thermo-Optic Coefficient of Liquids With Athermal Multimode Interference Devices. IEEE Sens. J. 2021, 21, 3004–3012. [Google Scholar] [CrossRef]
  55. Ruiz-Perez, V.I.; May-Arrioja, D.A.; Guzman-Sepulveda, J.R. An All-Solid Athermal Multimode-Interference Cascaded Device for Wavelength-Locking. IEEE Photonics Technol. Lett. 2018, 30, 669–672. [Google Scholar] [CrossRef]
Figure 1. Schematic representation of the SMS fiber optic sensor configuration (sketched by the authors).
Applsci 14 07914 g001
Figure 2. Experimental array to test SMS structure. The inset shows in detail the spectrum of the SMS sensor.
Applsci 14 07914 g002
Figure 3. Spectral response of the SMS sensor, as a reference the spectral response in the initial condition is also represented, that is, when the sensor is surrounded by air. (a) Sensor response for brand A honey mixtures with glucose adulteration. (b) Sensor response for brand A honey mixtures with different moisture contents.
Applsci 14 07914 g003
Figure 4. Spectral shift of the maximum wavelength and refractive index (RI) relative to the initial condition, based on the two types of adulteration analyzed: glucose and moisture content in honey for the two honey brands examined. (a) Measurement of brand A honey adulterated with glucose using the SMS sensor versus a refractometer. (b) Measurement of brand B honey adulterated with glucose using the SMS sensor versus a refractometer. (c) Measurement of brand A honey adulterated with distilled water (moisture content) using the SMS sensor versus a refractometer. (d) Measurement of brand B honey adulterated with distilled water (moisture content) using the SMS sensor versus a refractometer.
Applsci 14 07914 g004
Table 1. Standard deviations from sample concentrations of adulterated honey brand A.
% Glucose% Moisture ContentStandard Deviation
1% 0.13856
3% 0.24
5% 0.59003
5%0.14142
10%0.21046
15%0.24170
Disclaimer/Publisher’s Note: The statements, opinions and data contained in all publications are solely those of the individual author(s) and contributor(s) and not of MDPI and/or the editor(s). MDPI and/or the editor(s) disclaim responsibility for any injury to people or property resulting from any ideas, methods, instructions or products referred to in the content.

