Article

Quantitative Analysis of Sterols and Oxysterols in Foods by Gas Chromatography Coupled with Mass Spectrometry

Division of Food Quality Assessment, Department of Food Technology and Assessment, Institute of Food Science, Warsaw University of Life Sciences, Nowoursynowska 159 Street, 02-787 Warsaw, Poland
*
Author to whom correspondence should be addressed.
Appl. Sci. 2024, 14(17), 7934; https://doi.org/10.3390/app14177934
Submission received: 17 July 2024 / Revised: 27 August 2024 / Accepted: 2 September 2024 / Published: 5 September 2024
(This article belongs to the Section Chemical and Molecular Sciences)

Abstract

:
The study aimed to determine the content of sterol oxidation products (oxysterols) in selected processed food products with the use of GC-MS. It is known that an excessively high consumption of cholesterol in foods can lead to atherosclerosis and coronary heart disease and may also promote the appearance of gallstones. Cholesterol oxidation products have mutagenic, angiotoxic and cytotoxic properties and can lead to the development of atherosclerosis and promote the occurrence of some cancers. The cholesterol content in the tested products ranged from 8.72 to 2007.11 mg/100 g fat, and plant sterols were determined in 5 out of 12 tested products and their content ranged from 5.88 to 380.8 mg/100 g fat. The studies showed the presence of sterol oxidation products in each analyzed product. The total oxysterol content ranged from 0.16 to 3.95 μg/g fat in pastry products and from 0.06 to 9.72 μg/g fat in meat products. Due to the presence of sterol oxidation products in all analyzed products, their content in food products should be monitored. The presented analytical method is a proper tool for the determination of sterol oxidation products in different food matrices.

1. Introduction

Sterols belong to a group of steroids. They have three six-carbon rings, one five-carbon ring, a side chain located at carbon 17, a double bond between the fifth and sixth carbon, and a hydroxyl group located at the third carbon atom (Figure 1) [1]. Sterols can also be divided according to their origin. There are three groups of sterols: those of animal origin (for instance, cholesterol, cholestenol, and coprostanol), plant sterols—phytosterols (for example, β-sitosterol, campesterol, stigmasterol, and brassicasterol), and mycosterols found in mushrooms (i.e., ergosterol). A large part of cholesterol in the human body, about 60–70%, is produced by the liver, smaller amounts by the adrenal glands, intestines, and skin, and about 20–25% may come from a diet containing animal products [2,3]. The sources of cholesterol in a diet are mainly products of animal origin, such as cream, lard, and eggs, and also fatty cheese and meat [4]. One of the most important dietary recommendations is to limit cholesterol intake to a maximum of 300–350 mg per day [5]. Too high a level of cholesterol in the blood may lead to an increased risk of diseases such as atherosclerosis and coronary heart disease and may also promote the appearance of gallstones [6,7]. However, a low intake of cholesterol, especially in the presence of iron in the diet, may increase the risk of Parkinson’s disease [8]. The increasing interest in phytosterols is related to their effect in reducing cholesterol levels in human blood serum, which is increased in over 60% of Poles [9]. Along with high cholesterol levels (hypercholesterolemia), phenomena such as hypertension and atherosclerosis often occur. By consuming phytosterols, which reduce the absorption of cholesterol in the intestines and intensify its excretion together with feces, the level of cholesterol in the blood is reduced (total cholesterol and LDL cholesterol fraction), and the risk of the above-mentioned diseases are decreasing [10]. Plant sterols have several other positive properties—for instance, they reduce the risk of stomach, colon, and prostate cancer—and they also have anti-inflammatory properties and antioxidants [11]. For people with dyslipidemia, it is recommended to consume about 2 g of phytosterols per day [12]. The best sources of plant sterols in the human diet are vegetables and oils.
Oxysterols are oxidized derivatives of animal or plant sterols. If cholesterol is oxidized, the resulting products are called cholesterol oxidation products, abbreviated as COPs. If the substrate were phytosterols, we are talking about phytosterol oxidation products (POPs). Oxysterols can be formed in the human body in oxidation reactions with or without enzymes, e.g., by autoxidation. Oxysterols may also occur in food due to the oxidation of lipids that have been heat-treated or due to exposure to light and oxygen in the air [13,14]. Products resulting from the oxidation of sterols have many negative properties, including the effect they have on DNA synthesis, interfering with the proper functioning of cell membranes, and also have mutagenic, angiotoxic, and cytotoxic properties, which can lead to the development of atherosclerosis and promote the occurrence of some cancers (breast and prostate). However, it should be emphasized that the products of the oxidation of animal sterols (cholesterol) are more toxic than the products of the oxidation of plant sterols [15,16]. The most toxic cells are characterized by cholestanetriol, 7-ketocholesterol, 7α and 7β-hydrocycholesterol and 25 and 26-hydroxycholesterol, while 5α,6α and 5β,6β-epoxysterols are important factors causing cellular steatosis [17].
Cholesterol oxidation products may enhance the occurrence of inflammatory reactions in the body; this action involves the initiation of the expression and synthesis of molecules such as inflammatory cytokines, chemokinins, and adhesion molecules [14]. The resulting inflammation may be a fundamental factor leading to the aggravation of complications of many chronic diseases. The most common disease associated with oxysterols is atherosclerosis. Probably the factor that starts the formation of atherosclerotic plaque is damage to the vascular endothelium, which causes monocytes to accumulate, then move to the vessel walls and transform into macrophages. Further reactions caused by excited monocytes and macrophages lead to the production of foam cells that form atherosclerotic plaque. 7α and 7β-hydroxycholesterol and 7-ketocholesterol cause an inflammatory phenotype in endothelial cells; additionally, 7-ketocholesterol induces the formation of foam cells [14]. Many neurodegenerative diseases, such as Parkinson’s disease, Huntington’s disease, multiple sclerosis, Alzheimer’s disease, and amyotrophic lateral sclerosis, have been associated with oxidative stress. It has been proven that 7-ketocholesterol has a strong cytotoxic effect on neuronal cells; its presence in the brain can cause significant damage and contribute to the aggravation of the above-mentioned diseases [18]. Regrettably, no safe dose of sterol oxidation products has been determined so far, possibly because these compounds can also form within the human body, for example, during digestion or enzyme interaction.
Among the methods used for the analysis of sterol oxidation products, gas chromatography with a flame ionization detector can be mentioned. Another group of methods used for this application are high-performance liquid chromatography with UV (ultraviolet detection) or ELSD (Evaporative Light Scattering Detection) detectors. The above-mentioned separation methods coupled with a mass spectrometer (GC-MS, LC-MS) or a tandem mass spectrometer (GC-MS/MS, LC-MS/MS) are the most common techniques for the detection and quantitative analysis of sterol oxidation products, e.g., 7-ketocholesterol, hydroxysterols, epoxycholesterol, etc. [19]. Such techniques require the alkaline, acidic, or enzymatic hydrolysis of the fat fraction. The next step of the sample preparation before GC or LC analysis is the saponification or transesterification of the samples. Often, sterols and oxysterols are derivatized before injection into a gas or liquid chromatograph (trimethylsilyl derivatives) to obtain more stable derivatives than free sterols/oxysterols. The application of mass spectrometry coupled with GC or LC provides better qualitative analysis of sterols and their derivatives. Different methods of molecular ionization, e.g., electron ionization, can be used to obtain a specific mass spectrum, which can be compared with the mass spectrum of standards or compared with the mass spectrum from libraries [19]. Such techniques requires specific reagents, e.g., for hydrolysis and derivatization, and advanced measuring equipment and trained personnel.
Currently, the interest of scientists in testing the amount of oxysterols in Polish food products has decreased significantly. One of the most recent research studies describing the content of oxysterols in Polish dairy products was published by Czerwonka et al. (2024). The authors claim that the following COPs were identified: 7α-hydroxycholesterol, 7β-hydroxycholesterol, 5,6β-epoxycholesterol, 5,6α-epoxycholesterol, and 7-ketocholesterol. Cheese with internal mold and cheddar contained 13.8 and 11.7 mg/kg, respectively. On the other hand, yogurt and kefir contained 0.94 and 0.57 mg/kg, respectively. The authors reported that the concentration of total oxysterols in dairy products represented 1.7% of cholesterol content [20]. Another study performed by Czerwonka et al. (2024) aimed to detect oxysterols in eight different animal origin products. They reported that in all samples, 7-ketocholesterol was the most abundant among all oxysterols (7-ketocholesterol, 7α-hydroxycholesterol, 7β-hydroxycholesterol, 5,6α-epoxycholesterol, 5,6β-epoxycholesterol), and its share was between 31 and 67% of the total COP concentration. The total content of COP to cholesterol was about 1% [21]. Chudy and Teichert found that, after 6 months of storage, the dominant oxysterol in milk powder and egg powder was 7α-hydroxycholesterol and 7-ketocholesterol. The level of oxysterols in powdered milk reached 1.81% of total cholesterol [22]. The above-mentioned results suggest that the levels of cholesterol oxidation products should be monitored in products to obtain the best health quality of foodstuffs.
This study aimed to evaluate the content of sterols and sterol oxidation products in selected processed Polish food products.

2. Materials and Methods

2.1. Materials

This research used products available in large-format stores or smaller grocery stores in Warsaw, which were purchased in December 2020. The selection of food samples was mainly guided by high cholesterol content, and thus the possible presence of cholesterol oxidation products that negatively affect human health, and also the availability of products in the Polish market. The animal origin products were as follows: kabanos (poultry, beef, pork), producer Tarczyński, (Ujeżdziec Mały, Poland) bacon (steamed, smoked), producer Morliny, (Ostróda, Poland), salami, manufacturer Bell, (Niepołomice, Poland), whole milk powder, manufacturer Mlekovita, (Wysokie Mazowieckie, Poland), and canned pork produced by Kuchnia Staropolska, Graal S.A., (Wejcherowo, Poland). All meat products, except for canned pork, were stored at 2–5 °C before analysis. Cookies: cereal cakes (milk and cereals), manufacturer Belvita, Mondezel International, (Chicago, IL, USA), cookies with chocolate, manufacturer Milka, Mondezel International, (Chicago, IL, USA) sweet dessert cookies, manufacturer San, Mondezel International, (Chicago, IL, USA) and biscuits, manufacturer Mamut, (Wrocław, Poland). Three replicates of each product were analyzed.

2.2. Fat Extraction from Food Products

Fat extraction from selected products was carried out using the Folch method. A solution of chloroform and methanol was used in a volume ratio of 2:1. The tested product was initially ground in a laboratory grinder, then 2 g was weighed into a beaker and 15 mL of the Folch solution and saturated NaCl solution was added. The mixture was shaken and ground once again using a homogenizer, then the mixture was transferred to tubes and centrifuged at 8000 rpm for 10 min. The separated chloroform layer was transferred using a syringe to smaller test tubes, and the solvent was evaporated under a stream of nitrogen [23].

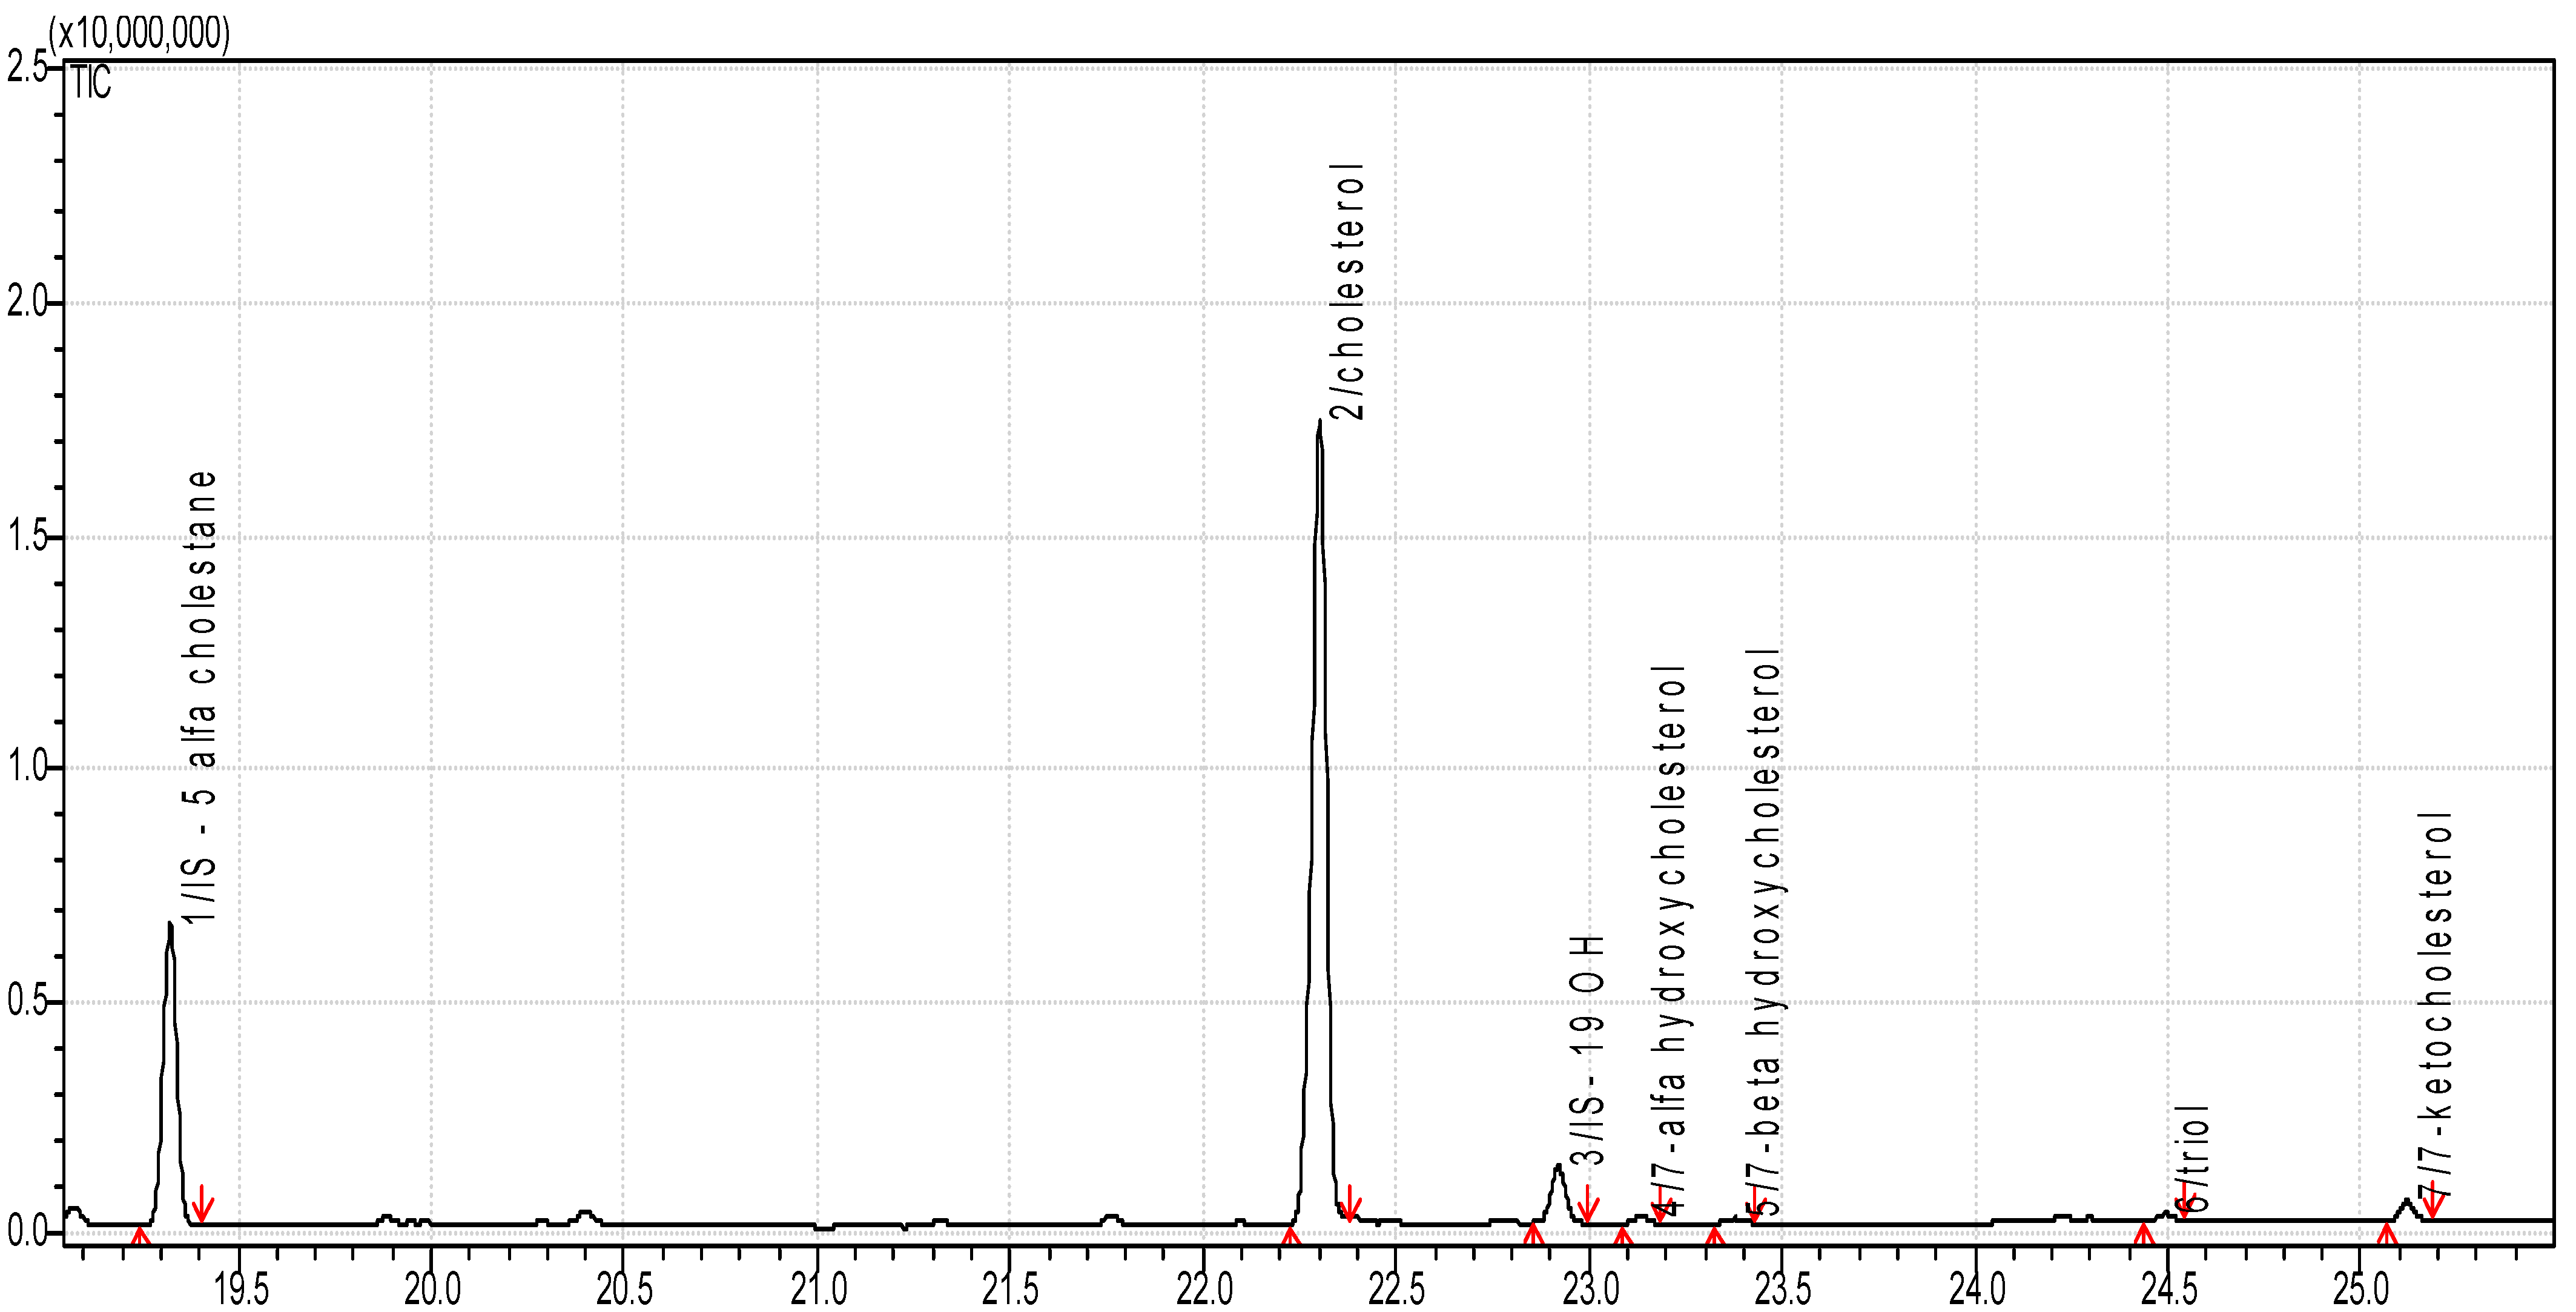
2.3. Determination of Cholesterol and Oxysterols

Extracted fat was diluted in 10 mL of hexane and 0.1 mL of 5α-cholestane solution (40 mg/100 mL of trichloromethane—internal standard for sterols quantification) and 0.1 mL of 19-hydroxycholesterol solution (10 mg/100 mL of ethanol—internal standard for oxysterol quantification) were added to samples. Next, they were saponified with 0.5 mL of 2N potassium methoxide for 1 h at room temperature. Afterward, the solvents were removed under a stream of nitrogen, and the samples were derivatized due to the addition of 100 μL of anhydrous pyridine (Sigma-Aldrich, St. Louis, MO, USA) and 100 μL of silylation agents (Trimethylsilyl 2,2,2-trifluoro-N-trimethylsilylethanimidate with the addition of 1% of trimethylchlorosilane from Sigma-Aldrich, St. Louis, MO, USA) and left for 24 h at room temperature. Cholesterol and oxysterols were analyzed on a gas chromatograph coupled with the mass spectrometer Shimadzu GCMS–QP2010 SE (Shimadzu, Kyoto, Japan). The separation of cholesterol and oxysterols was carried out with the usage of the RTX-5 (30 m × 0.25 mm × 0.1 µm) capillary column Restek (Bellefonte, PA, USA), and the volume of the injected sample was 1 µL (splitless mode). A helium flow rate of 1.18 mL/min was used. The injector temperature was 275 °C, and the column temperature was programmed as follows: 65 °C for 2 min, subsequently increased to 250 °C at the rate of 15 °C/min, and then to 310 °C at the rate of 5 °C/min for 6 min. The interface temperature for GC-MS was 255 °C. The temperature of the ion source was 250 °C, and the ionization energy was 70 V. Total ion monitoring (TIC) was used to detect sterols and oxysterols (m/z ranged from 100 to 600). The identification of sterol and oxysterols was made based on mass spectral libraries (NIST 47, NIST 147, and Wiley 175) as well as data from the literature and by a comparison of their retention times with the authentic standards, including cholesterol, 7β-OH, 7α-OH, triol, and 7-ketocholesterol (Sigma-Aldrich, St. Louis, MO, USA) [23]. The limit of detection for sterols was between 0. and 0.5 ppm. The limits of detection for particular COPs were between 0.2 and 5 ppm. All samples were analyzed in triplicate.

2.4. Statistical Analysis

Means and standard deviations were calculated for the obtained results. Tukey’s HSD test was used to create homogeneous groups, with a significance level of α = 0.05. The obtained results and homogeneous groups are presented in tables and figures.

3. Results and Discussion

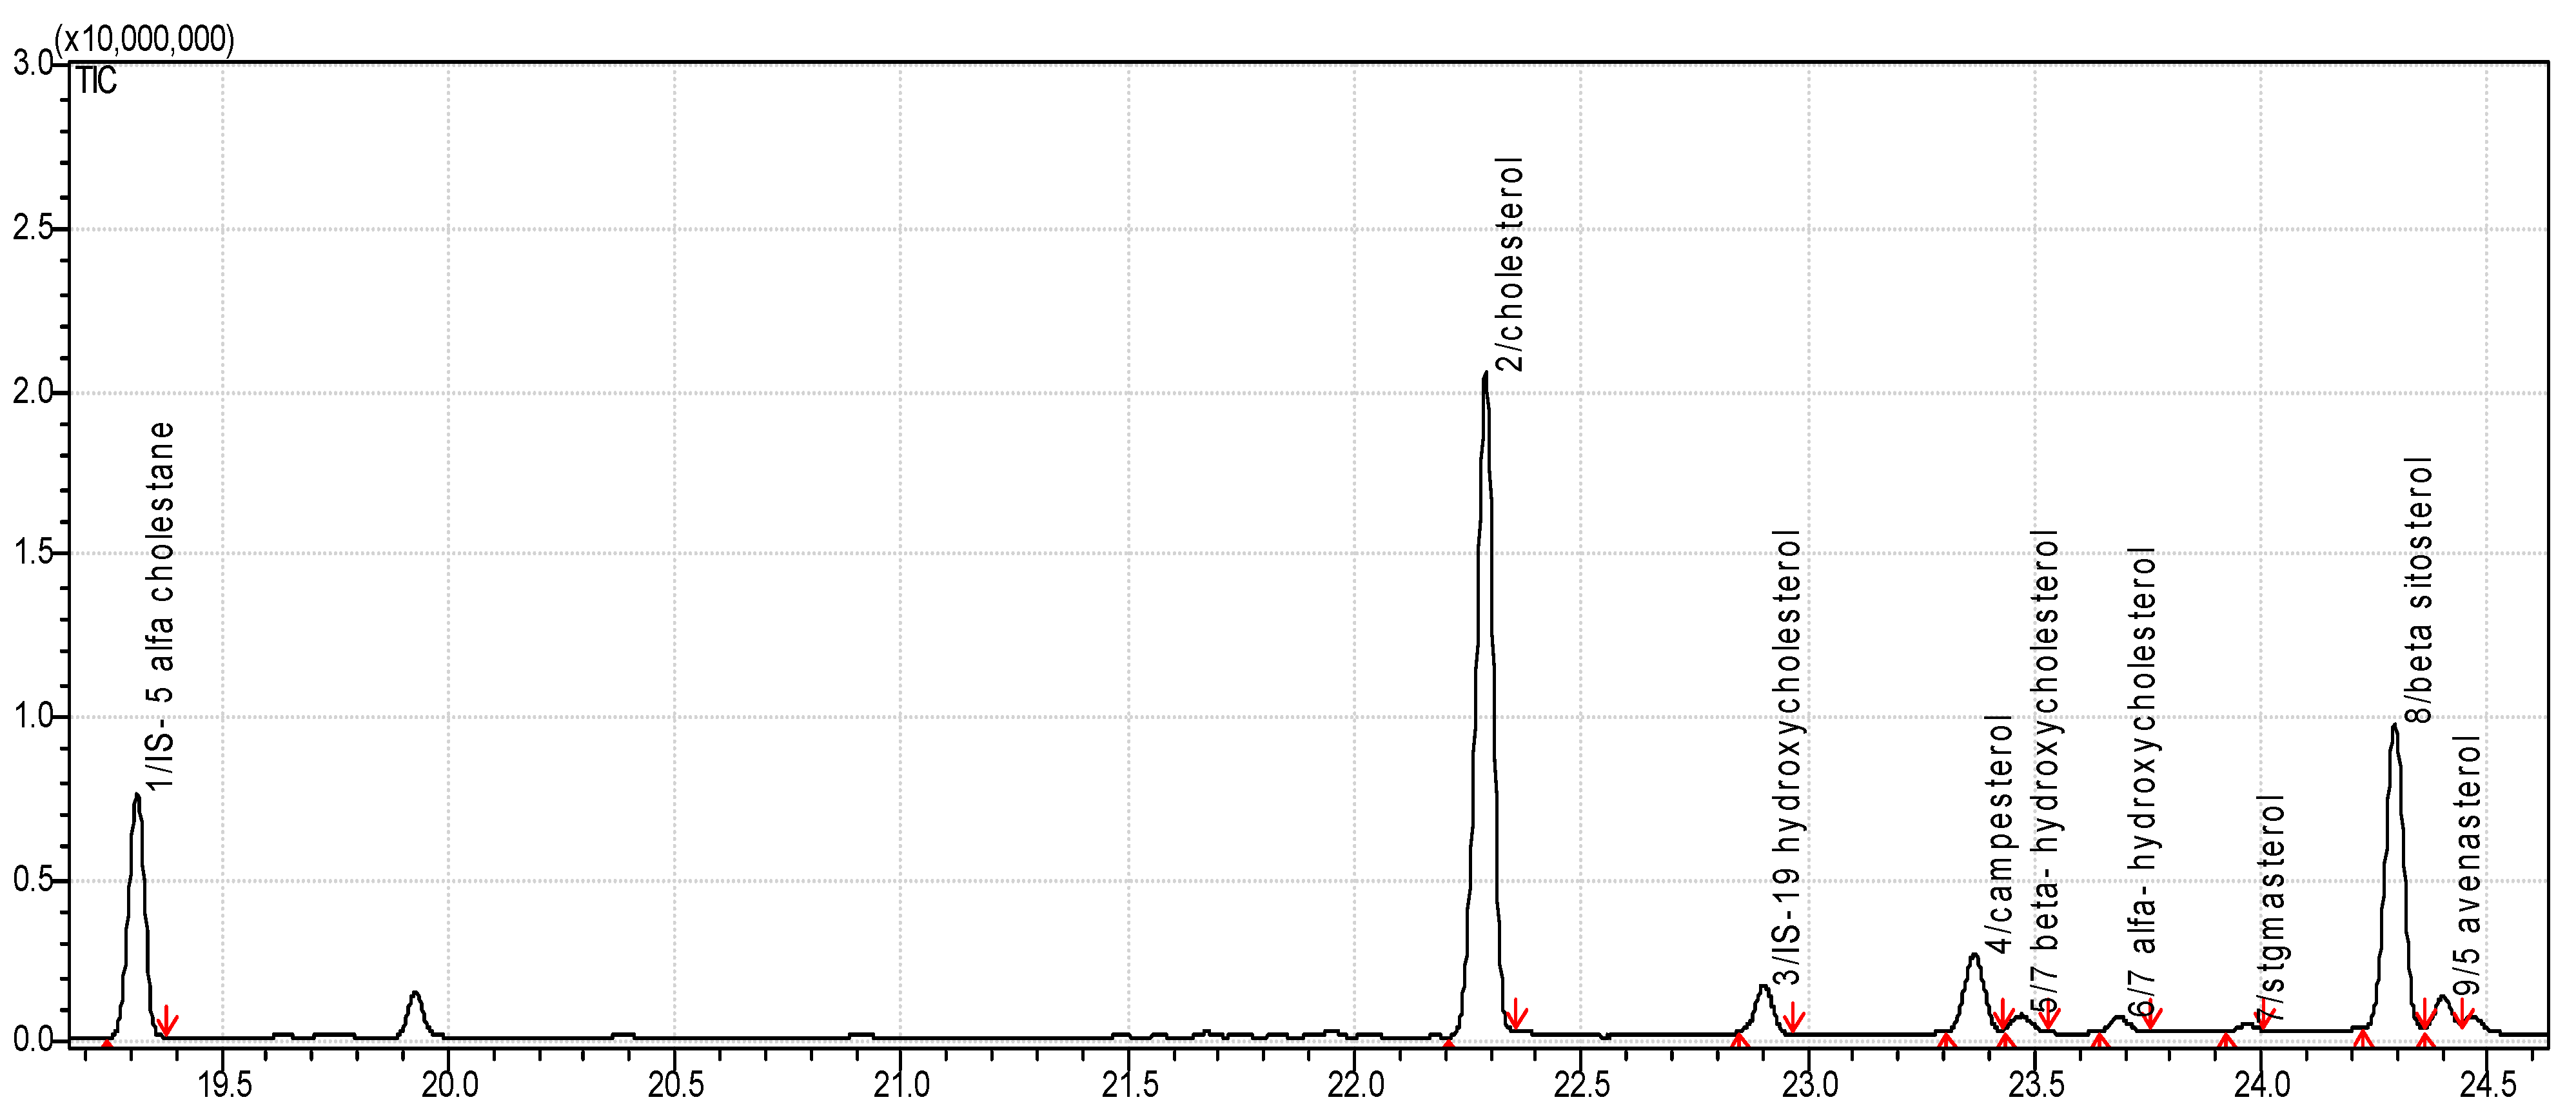
3.1. Sterol Content in Food Products

The analyzed products had different cholesterol content (Table 1). Poultry sausages had the highest content of this sterol (356.2 mg/100 fat). Products such as poultry kabanos, canned pork (275.02 mg), pork kabanos (276.55 mg), and steamed bacon (214.75 mg) with salami (237.19 mg) had an average cholesterol content. Products that can be included in the group with the lowest cholesterol content include smoked bacon (with an average content of 101.68 mg of cholesterol per 100 g of fat) and beef kabanos with an average content of 98.15 mg of cholesterol per 100 g of fat (Table 1). Among the tested meat products, only one contained phytosterols; it was canned pork, and the total content of plant sterols in this product was 5.88 mg per 100 g of fat (Table 1). The presence of phytosterols in this product could be due to the presence of pea fiber.
According to data from the U.S. Department of Agriculture, the cholesterol content in bacon is 261 mg/100 g of fat, and in salami, it is 342 mg/100 g of fat. According to data provided by Kołodziej-Skalska et al., the cholesterol content in bacon was 166.67 mg/100 g of fat [24]. These values are definitely higher than in raw meat. In the work of Lercker and Rodriguez-Estrada [25], the given cholesterol content in meat products was 500 mg/100 g of fat; it ranged from 400 to 500 mg for baked beef, while in salami, the cholesterol content ranged from 100 to 300 mg/100g of fat. In the analysis conducted by Larkeson et al. [25], the cholesterol content in raw beef hamburgers was 271 mg/100 g of fat, while in the meatballs (50% pork and 50% beef), it was 589 mg/100 g of fat.
Table 2 presents the results regarding the determination of sterols in cake products and powdered milk. The tested products had varying cholesterol contents, from 8.72 mg to 2007.11 mg/100 g of fat. The highest cholesterol content was found in biscuits (2007.11 mg/100 g of fat). Such a high cholesterol content in biscuits may result from the use of pasteurized egg mass in the production technology of these products. The cholesterol content in eggs is approximately 210 mg of cholesterol per piece [26]. However, powdered milk had an average cholesterol content of 266.96 mg, and for sweet dessert cookies, it was 95.78 mg/100 g of fat The groups with the lowest cholesterol content included chocolate chip cookies, containing on average 46.26 mg per 100 g of fat, and cereal cakes, containing only 8.72 mg of cholesterol per 100 g of extracted fat. On this basis, it can be stated that the presented methods for the determination of cholesterol in different food products were adequate for low and very high concentrations of sterols and can be applied for further analysis of COPs in, e.g., another food matrix. In other products, the presence of cholesterol was due to the presence of ingredients such as powdered milk, eggs, and butter. In research conducted by Bonczar et al. [27], the cholesterol content in milk was 210 mg per 100 g of fat in raw milk and 367 mg of cholesterol in whole milk powder. The following phytosterols were also determined in the analyzed products (brassicasterol, campesterol, stigmasterol, and β-sitosterol). The only product that did not contain phytosterols was powdered milk.
The highest total content of plant sterols was found in cereal cakes, containing an average of 380.8 mg/100 g of fat, in biscuits, it was 83.83 mg, and in sweet dessert cookies, there was 60.67 mg of phytosterols per 100 g of fat, while the lowest phytosterol content was found in cookies with pieces of chocolate, i.e., 45.52 mg of cholesterol per 100 g of fat. Cereal cookies may owe their high content of plant sterols to the presence of rapeseed oil, in which the phytosterol content may amount to an average of 879 mg/100 g of oil. Additionally, the high content of phytosterols in the above-mentioned cookies may result from the presence of cereals, which may also be a source of plant sterols [28]. Brassicasterol was determined only in the above-mentioned cookies; it is a characteristic phytosterol of rapeseed oil. In research conducted by Rudzińska et al. [29], only rapeseed oil, among other analyzed phytosterols, contained brassicasterol, in an amount of 98–104 mg/100 g of oil. This oil was also characterized by a high content of campesterol (245 mg/100 g of oil) and β-sitosterol (352 mg/100 g of oil). The most common phytosterol in vegetable oils is β-sitosterol [27], which, in each product tested, had the largest share of all identified plant sterols.

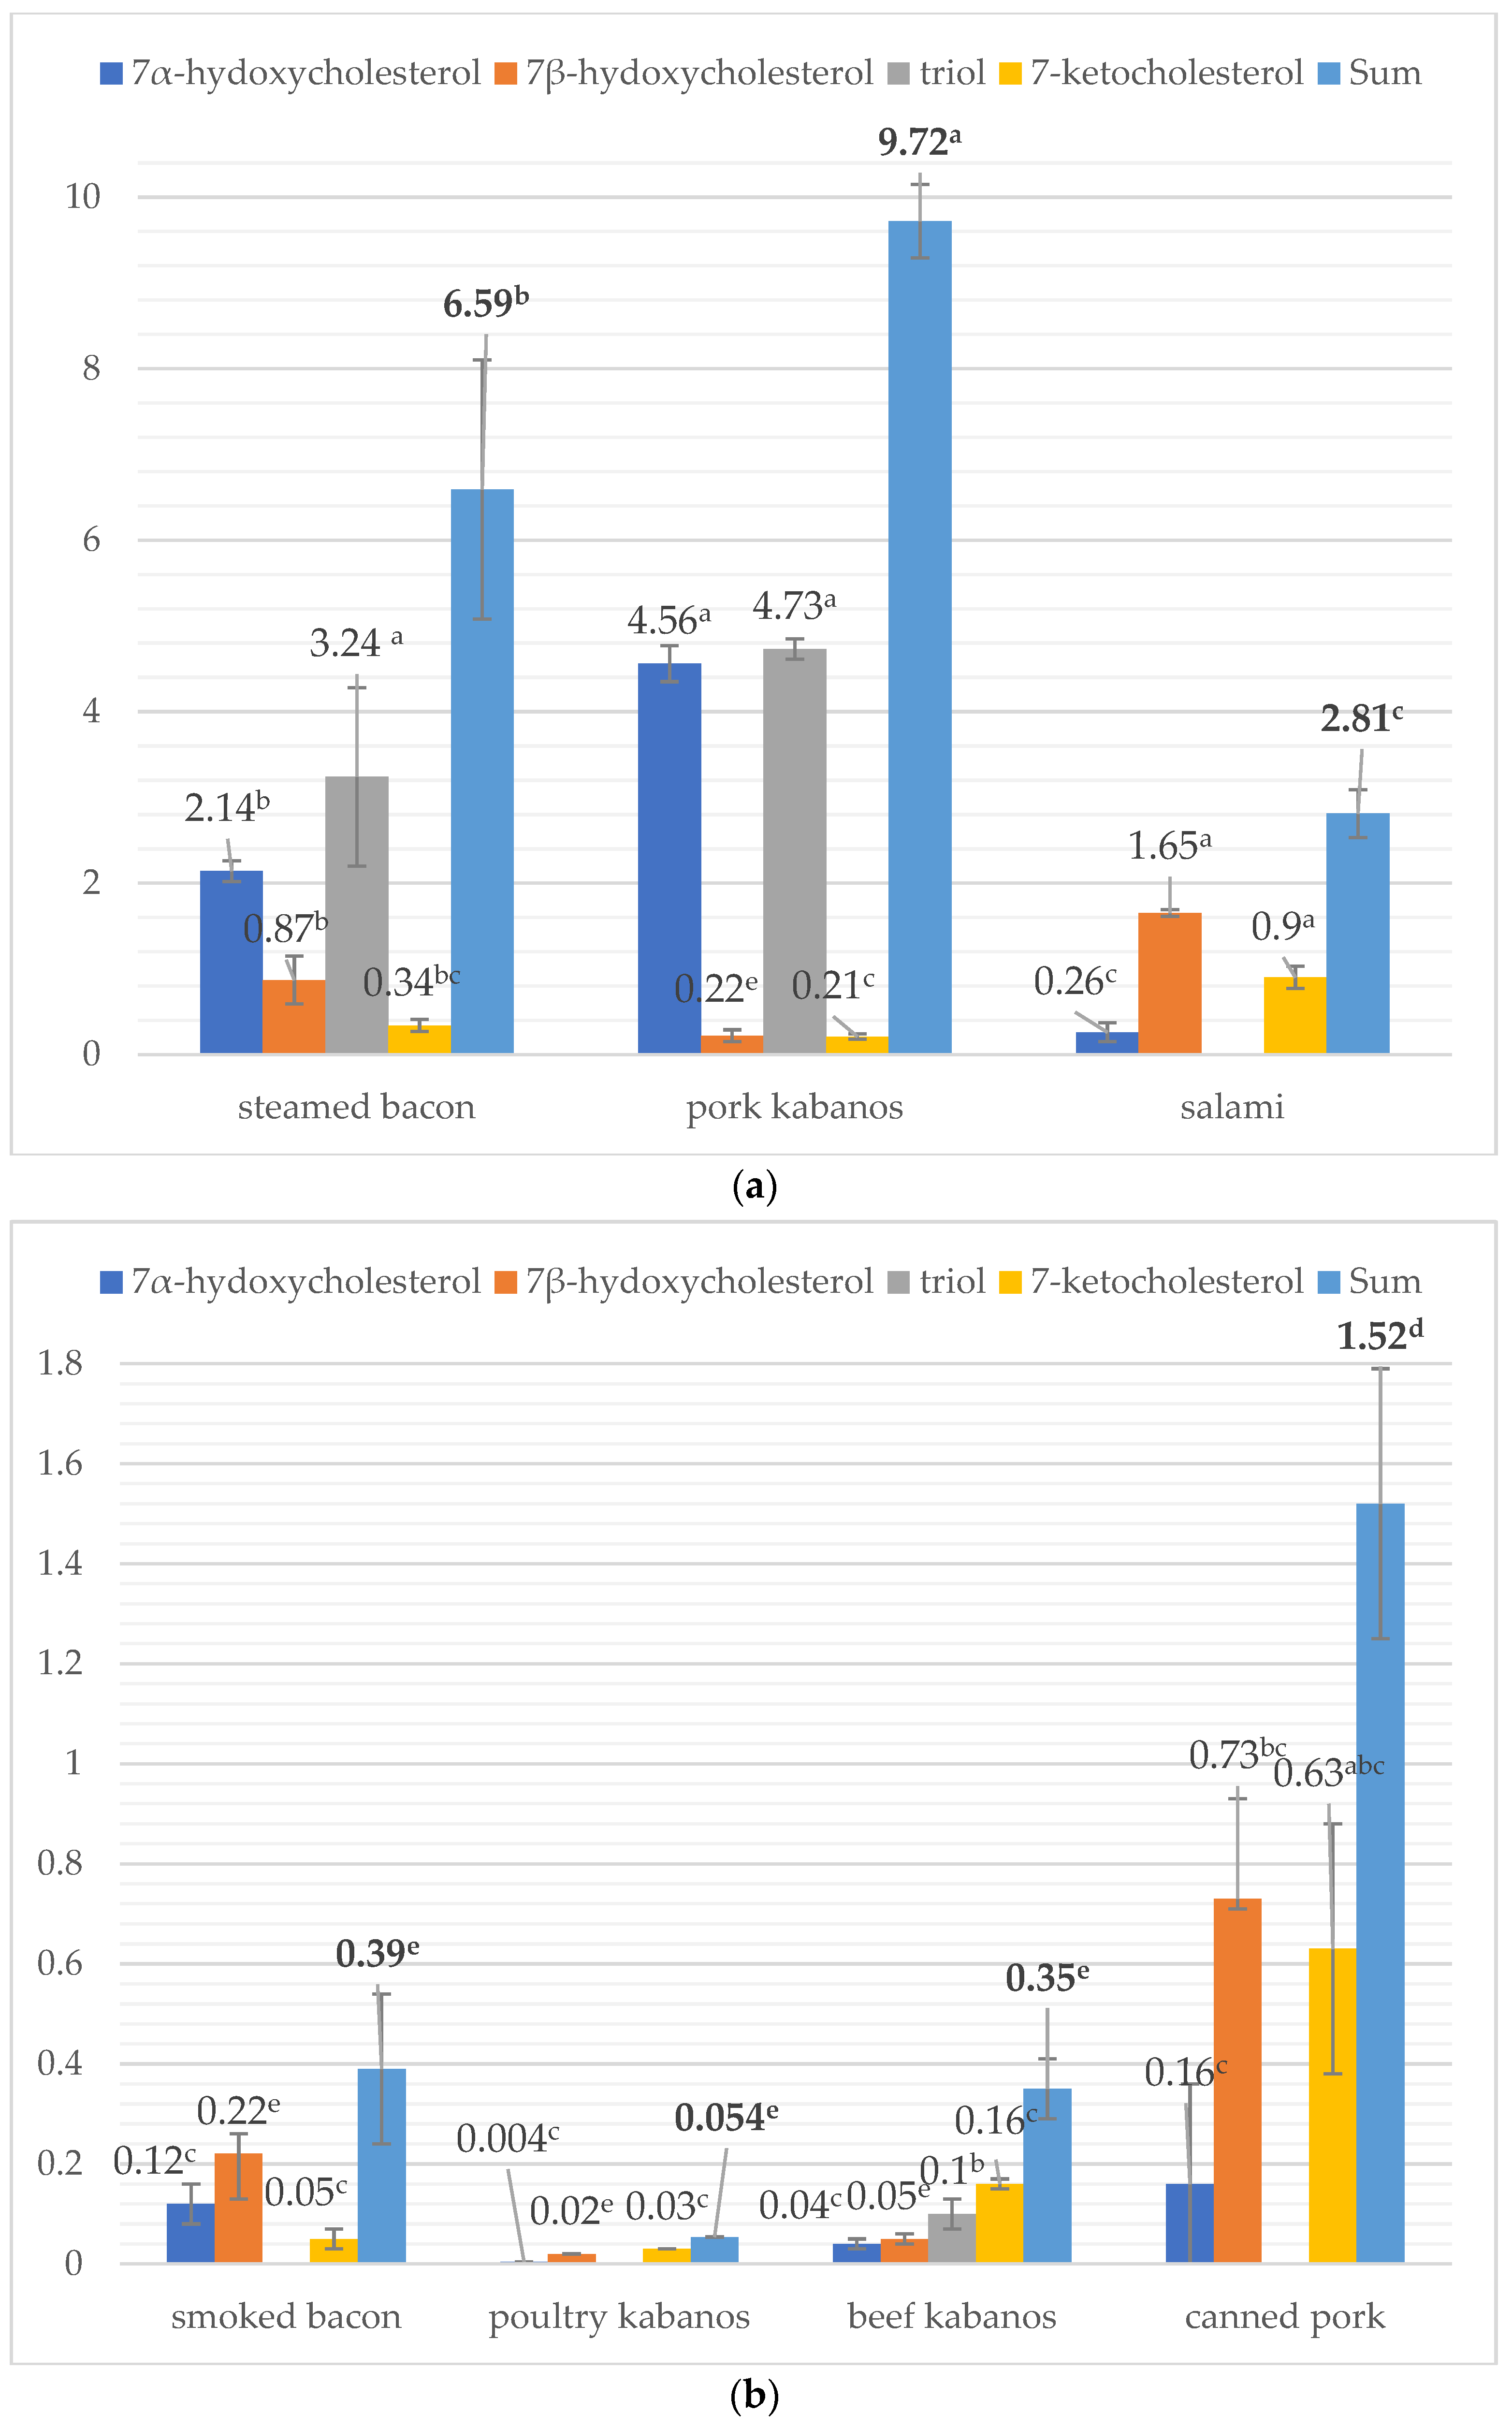
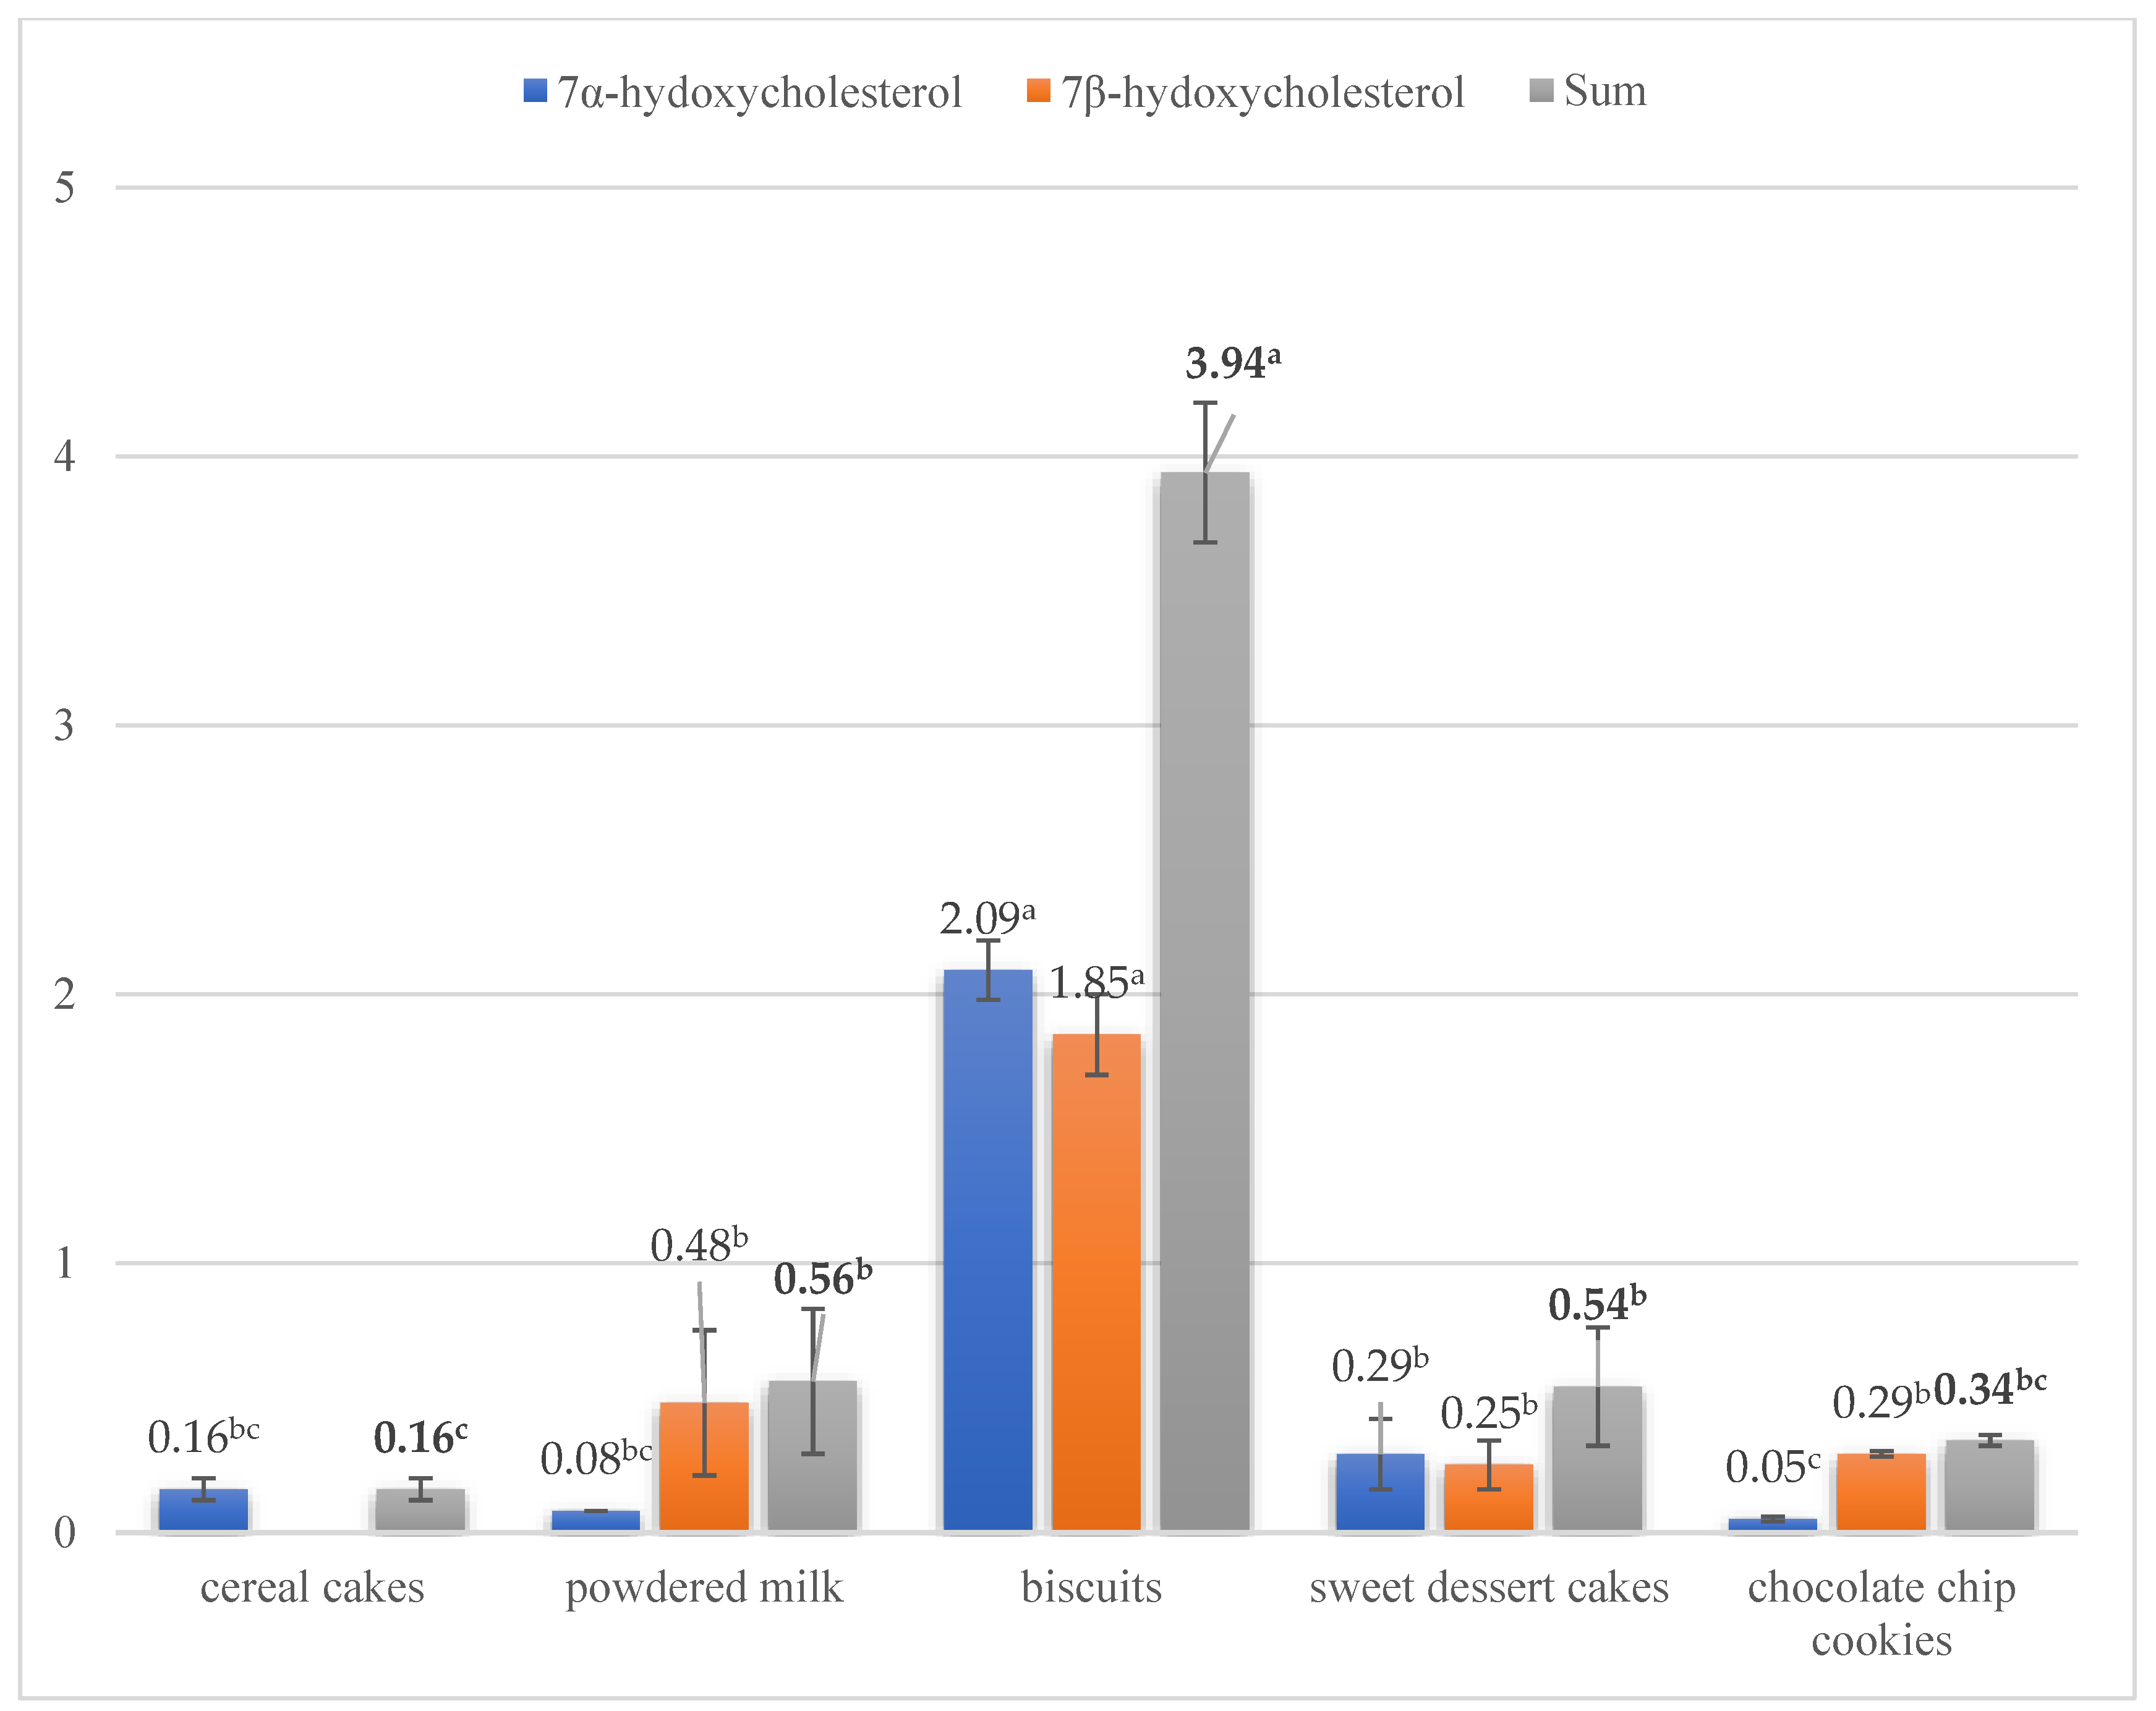
3.2. Concentration of Sterol Oxidation Products in Food Products

The content of cholesterol oxidation products in products of animal origin may be influenced by factors such as the temperature and processing time of the food product, as well as the method of storage. The content of oxysterols usually does not exceed 1% of the total cholesterol. However, there may be situations in which 10% or even more of the cholesterol present in a food product may be oxidized [17]. Figure 2 presents one of the chromatograms that were obtained during the separation of sterol and their oxidized forms. Figure 3 presents results regarding the content of sterol oxidation products in processed meat products.
The fat fraction of the tested products contained four oxysterols: 7α-hydroxycholesterol, 7β-hydroxycholesterol, 7-ketocholesterol, and cholesterol triol. Their total content ranged from 0.58 μg/g of fat to 9.72 μg/g of fat (Figure 3a,b). A statistical analysis of the results concerning the total content of cholesterol oxidation products indicated that meat products can be divided into five homologous groups: the first group with the highest content of the above-mentioned compounds includes the product pork kabanos, the second group contains steamed bacon (Figure 3a,b), the third group includes salami, the fourth group contains canned pork, and the fifth group includes smoked bacon, pork kabanos and beef kabanos.
The presence of cholesterol triol was detected only in three products: steamed bacon (3.24 μg/g fat), pork kabanos (4.73 μg/g fat), and beef kabanos (0.1 μg/g fat) (Figure 3a,b).
The remaining oxysterols were determined in each of the analyzed products, with the highest content of 7α-hydroxycholesterol in pork kabanos (4.56 μg/g fat) and the lowest in poultry kabanos (0.004 μg/g fat), beef kabanos (0.04 μg/g fat), salami (0.26 μg/g fat) and canned pork (0.16 μg/g fat). Salami contained 7β-hydroxycholesterol at a concentration of 1.65 μg/g of fat, while the lowest content of 7β-hydroxycholesterol was found in poultry kabanos (0.02 μg/g fat) and beef kabanos (0.05 μg/g fat). The highest content of 7-ketocholesterol was found in salami, containing 0.9 μg of this oxysterol per 1 g of fat and the lowest in pork kabanos (0.21 μg/g fat), beef kabanos (0.16 μg/g fat), smoked bacon (0.05 μg/g fat) and poultry kabanos (0.03 μg/g fat) (Figure 3a,b).
Summarizing, the total content of cholesterol oxidation products represented from 0.002 to 0.352% of oxidized cholesterol was found in analyzed samples. The highest percentage of oxidized cholesterol was found in pork kabanos—0.352%, then in smoked bacon—0.307%, and next in salami—0.119% of oxidized cholesterol. In canned pork, steamed bacon, and beef kabanos the percentage of oxidized cholesterol was as follows: 0.055%, 0.038%, and 0.035%, respectively. A lower level of oxidized cholesterol was found in poultry kabanos—0.002%. Czerwonka et al. stated that the ratio of cholesterol oxidation products to cholesterol was about 1% in meat products: fresh milk, yogurt, eggs (yolk), edam cheese, chicken breast meat, pork chop, salmon, and cod [21]. The lower percentage of oxidized cholesterol observed in the current study could be due to preservatives added to the processed foods, e.g., antioxidants, or type of packaging, e.g., modified atmosphere, which is commonly used for sausages, e.g., kabanos, or other processed meat products, e.g., bacon, etc.
A statistically significantly higher content of total cholesterol oxidation products was found in products subjected to thermal processing; for example, raw beef contained 8.66 μg/g fat, while after thermal processing, this value increased to 30.06 μg/g fat [14]. In our previous research [16], in salami-type products, the following COPs were additionally determined, 5β,6β-epoxycholesterol, 5α,6α-epoxycholesterol, and 25-hydroxycholesterol, and the total content of cholesterol oxidation products ranged from 6.9 to 7.9 μg/g of fat. The study also found an increase in the content of cholesterol oxidation products in meat after heat treatment in comparison to raw meat. Initially, the content of oxysterols in pork meat was 8.7 μg/g of fat, and after thermal treatment, it was 19.3 μg/g of fat. It was similar in beef meat: 6.4 μg/g of fat before thermal treatment and 25.9 μg/g of fat, after processing. Brzeska et al. [14] describe the content of cholesterol oxidation products before and after thermal treatment in meat products, e.g., the total oxysterol content in a beef hamburger was 2.3 μg/g of fat, and after heating with microwaves, it was 12.3 μg/g of fat, and in a poultry hamburger, its content in raw meat was 4.0 μg/g of fat, and after frying with olive oil, it was 24.6 μg/g of fat. The study by Derewiaka and Obiedziński also presented the difference in the content of cholesterol oxidation products before and after the thermal process. In the pork and beef cutlets, the content of cholesterol oxidation products before thermal treatment was 8.7 and 6.4 μg/g of fat, respectively, and after thermal treatment, it was 19.3 and 25.9 μg/g of fat [16].
Only two cholesterol oxidation products were determined in the tested pastry products: 7α-hydroxycholesterol and 7β-hydroxycholesterol. Phytosterol oxidation products were not determined in any of the tested products. The total content of cholesterol oxidation products was the highest in biscuits, and it amounted to 3.94 μg/g fat (including 2.09 of 7α-hydroxycholesterol and 1.85 7β-hydroxycholesterol μg/g of fat), while the lowest in cereal cakes was 0.16 μg/g fat, in which only 7α-hydroxycholesterol was determined (Figure 4). The content of oxysterols in the remaining cookies was 0.56 μg/g in milk powder, 0.54 μg/g in sweet dessert cakes (Figure 5), and 0.34 μg/g fat in chocolate chip cookies. The high content of cholesterol oxidation products in biscuits may be caused by the high content of cholesterol in the products themselves (Figure 4 and Table 2), which may undergo oxidation upon contact with air or during thermal treatment in their production technology. A statistical analysis of the concentration of the total content of cholesterol oxidation products indicated that pastry products and powdered milk can be divided into three homologous groups. In the first group with the highest content of COPs—biscuits, in the second group—powdered milk and sweet dessert cakes, and in the third group—cereals and cakes, and the content of COPs in chocolate chip cookies was placed in the second and the third groups. The ratio of cholesterol oxidation products to cholesterol concentration was low compared to meat products and ranged from 0.002 to 0.018%. The highest percentage of oxidized cholesterol was found in cereal cakes (0.018%), in chocolate chip cookies and sweet dessert cakes (0.007%), and in powdered milk, and in biscuits, it was only 0.002%.
7-ketocholesterol was not determined in the bakery products tested in this study; however, in the analysis conducted by Lercker et al. [25], the content of 7-ketocholesterol in children’s cookies ranged from 0.6 μg/g of fat to 34 μg/g of fat, and in cookies containing eggs, its content ranged from 1.8 μg/g of fat to 27.1 μg/g of fat, while in powdered milk it ranged from 1.1 to 3.2 μg/g of fat. In the analysis conducted by Derewiaka [15], the tested dough (sękacz) contained from 5.1 μg/g fat to 6.8 μg of oxysterols/g of fat.

4. Conclusions

The paper presents the results of determining the content of sterols and cholesterol oxidation products in 12 processed food products, including cakes, powdered milk, and meat products, using gas chromatography coupled with mass spectrometry. Our article outlines an appropriate research methodology that enables us to obtain reliable results regarding the content of cholesterol oxidation products in various food matrices, such as meat or confectionery products.
Cholesterol oxidation products were detected in all tested food items. In pastry products and powdered milk, two cholesterol oxidation products were identified: 7α-hydroxycholesterol and 7β-hydroxycholesterol. In meat products, cholesterol triol and 7-ketocholesterol were also detected. Given their negative impact on human health, it is necessary to monitor the content of sterol oxidation products in food, particularly in products intended for children, such as biscuits or powdered milk. Additionally, efforts should be made to modify production processes to minimize their presence. Further research in this area is essential to continue monitoring the content of cholesterol oxidation products in food products.

Author Contributions

Conceptualization, D.D.; methodology, D.D.; software, D.D. and M.P.; validation, D.D. and M.P.; formal analysis, D.D.; investigation, M.P.; resources, D.D.; data curation, D.D. and M.P.; writing—original draft preparation, D.D.; writing—review and editing, D.D.; visualization, D.D. and M.P.; supervision, D.D.; project administration, D.D.; funding acquisition, D.D. All authors have read and agreed to the published version of the manuscript.

Funding

This research received no external funding.

Institutional Review Board Statement

Not applicable.

Informed Consent Statement

Not applicable.

Data Availability Statement

The original contributions presented in the study are included in the article, further inquiries can be directed to the corresponding author.

Conflicts of Interest

The authors declare no conflicts of interest.

References

  1. Burnus, Z. Oznaczanie wolnych sterol roślinnych i zwierzęcych w estrach metylowych kwasów tłuszczowych z wykorzystaniem techniki chromatografii gazowej. Nafta-Gaz 2013, LXIX, 632–645. [Google Scholar]
  2. Kropiwiec, K.; Babicz, M.; Całyniku, Z. Zawartość cholesterolu w surowcach i produktach pochodzenia zwierzęcego. In Przegląd Wybranych Zagadnień z Zakresu Przemysłu Spożywczego; Szala, M., Kropiwiec, K., Eds.; Wydawnictwa Naukowe Tygiel: Lublin, Poland, 2016; pp. 75–83. [Google Scholar]
  3. Li, L.-H.; Dutkiewicz, E.P.; Huang, Y.-C.; Zhou, H.-B.; Hsu, C.-C. Analytical methods for cholesterol quantification. J. Food Drug Anal. 2019, 27, 375–386. [Google Scholar] [CrossRef] [PubMed]
  4. Wieczorek-Chełmińska, Z. Nowoczesna Dietetyczna Książka Kucharska; PZWL Wydawnictwo Lekarskie: Warsaw, Poland, 2011; pp. 15–18. [Google Scholar]
  5. Drozdowski, B. Lipidy. In Chemia Żywności t. 2, Sacharydy, Lipidy i Białka; Sikorski, Z.E., Ed.; Wydawnictwo Naukowo-Techniczne: Warsaw, Poland, 2012; pp. 73–83. [Google Scholar]
  6. Kołodziejczyk, A. Steroidy. In Naturalne Związki Organiczne; Polskie Wydawnictwo Naukowe PWN: Warsaw, Poland, 2015; pp. 466–476. [Google Scholar]
  7. Czarkowska, J. Zdrowy Styl Życia; Wydawnictwa Podlaski Ośrodek Doradztwa Rolniczego: Szepietów, Poland, 2018; pp. 1–20. [Google Scholar]
  8. Kołakowska, A. Lipidy. In Chemia Żywności 1. Główne Składniki Żywności; Polskie Wydawnictwo Naukowe: Warsaw, Poland, 2017; pp. 153–214. [Google Scholar]
  9. Zdrojewski, T.; Wyrzykowski, B.; Szczęch, R.; Wierucki, Ł.; Naruszewicz, M.; Narkiewicz, K.; Zarzeczna-Baran, M. Epidemiology and prevention of arterial hypertension in Poland. Blood Press. 2005, 14 (Suppl. 2), 10–16. [Google Scholar] [CrossRef] [PubMed]
  10. Stasiuk, W.; Czabak-Garbacz, R.; Szkutnik, J. Fitosterole w profilaktyce i terapii. Lek Polsce 2013, 23, 36–41. [Google Scholar]
  11. Szymańska, R.; Kruk, J. Fitosterole-występowanie i znaczenie dla człowieka. Kosm. Probl. Nauk. Biol. 2007, 56, 107–114. [Google Scholar]
  12. Wełnicki, M.; Szeligowska, J.; Mamcarz, A. Zastosowanie steroli roślinnych w prewencji chorób układu sercowo-naczyniowego. Mit czy realna możliwość potencjalizacji efektów klasycznych leków hipolipemizujących? Chor. Serca Naczyń 2014, 11, 225–229. [Google Scholar]
  13. Otaegui-Arrazola, M.; Menendez-Carreno, M.; Ansorena, D.; Astiasaran, I. Oxysterol: A world to explore. Food Chem. Toxicol. 2010, 48, 3289–3303. [Google Scholar] [CrossRef] [PubMed]
  14. Brzeska, M.; Szymczyk, K.; Szterk, A. Current Knowledge about Oxysterols: A Review. J. Food Sci. 2016, 81, 2299–2308. [Google Scholar] [CrossRef] [PubMed]
  15. Derewiaka, D. Occurrence and Formation of Sterol Oxidation Products in Selected Food Products. Ph.D. Thesis, Warsaw University of Life Sciences, Warsaw, Poland, 2008. [Google Scholar]
  16. Hafid, N. Cholesterol Oxidation Products (COPs) in Ruminant Meat: A Biological and Pathological Approach: A review. Asian J. Dairy Food Res. 2019, 38, 191–203. [Google Scholar]
  17. Karwowska, M.; Libera, J.; Wójciak, K.M. Znaczenie żywieniowe utlenionych pochodnych cholesterolu w mięsie i produktach mięsnych. In Trendy w Żywieniu Człowieka; Karwowska, M., Gustawa, W., Eds.; Wydawnictwo Polskie Towarzystwo Technologów Żywności: Kraków, Poland, 2015; pp. 91–97. [Google Scholar]
  18. Anderson, A.; Campo, A.; Fulton, E.; Corwin, A.; Gray Jerome, W., III; O’Connor, M.S. 7-Ketocholesterol in disease and aging. Redox Biol. 2019, 29, 101380. [Google Scholar] [CrossRef] [PubMed]
  19. Derewiaka, D. Food Lipids: Sources, Health Implications, and Future Trends; Lorenzo, J., Munekata, P., Pateiro, M., Eds.; Elsevier: Amsterdam, The Netherlands, 2022; pp. 173–205. ISBN 978-0-12-823371-9. [Google Scholar] [CrossRef]
  20. Czerwonka, M.; Gielecińska, A.; Białek, A.; Białek, M.; Bobrowska-Korczak, B. Cholesterol and Its Oxidation Derivatives Content in Market Dairy Products. Nutrients 2024, 16, 1371. [Google Scholar] [CrossRef] [PubMed]
  21. Czerwonka, M.; Białek, A.; Bobrowska-Korczak, B. A Novel Method for the Determination of Squalene, Cholesterol and Their Oxidation Products in Food of Animal Origin by GC-TOF/MS. Int. J. Mol. Sci. 2024, 25, 2807. [Google Scholar] [CrossRef] [PubMed]
  22. Chudy, S.; Teichert, J. Oxysterols in stored powders as potential health hazards. Sci. Rep. 2021, 11, 21192. [Google Scholar] [CrossRef] [PubMed]
  23. Derewiaka, D. The influence of the food matrix on the content of cholesterol and oxysterols during simulated process of digestion. Eur. J. Lipid Sci. Technol. 2024, 126, 2200175. [Google Scholar] [CrossRef]
  24. Kołodziej-Skalska, A.; Matysiak, B.; Grudziński, M. Mięso wieprzowe a zdrowie człowieka. Kosmos. Probl. Nauk. Biol. 2016, 65, 535–542. [Google Scholar]
  25. Lercker, G.; Rodriguez-Estrada, M.T. Cholesterol Oxidation: Presence of 7-ketocholesterol in Different Food Products. J. Food Compos. Anal. 2000, 13, 625–631. [Google Scholar] [CrossRef]
  26. Pieszka, M.; Pompa-Roborzyński, M.; Baran, J. Surowce i produkty drobiarskiej a zdrowie konsumenta. Wiadomości Zootech. 2017, 4, 118–123. [Google Scholar]
  27. Bonczar, G.; Chrzanowska, K.; Maciejowski, K.; Walczycka, M. Zawartość cholesterolu i jego pochodnych w mleku i produktach mleczarskich—Uwarunkowania surowcowe i technologiczne. Żywność Nauka Technol. Jakość 2011, 1, 15–27. [Google Scholar]
  28. Kopeć, A.; Nowacka, E.; Piątkowska, E.; Leszczyńska, T. Charakterystyka i prozdrowotne właściwości steroli roślinnych. Żywność Nauka Technol. Jakość 2011, 3, 5–14. [Google Scholar]
  29. Rudzińska, M.; Kazuś, T.; Wąsowicz, E. Sterole i ich utlenione pochodne w olejach roślinnych rafinowanych i tłoczonych na zimno. Rośliny Oleiste 2001, 22, 477–497. [Google Scholar]
Figure 1. Chemical structure of β-sitosterol.
Applsci 14 07934 g001
Figure 2. Chromatogram after separation of sterols and oxysterol fraction extracted from steamed bacon.
Applsci 14 07934 g002
Figure 3. (a) Content of sterol oxidation products [µg/g of fat] in meat products. (b) Content of sterol oxidation products [µg/g of fat] in meat products. a–e—values within with different letters are significantly different (p ≤ 0.05).
Applsci 14 07934 g003
Figure 4. Content of sterol oxidation products [µg/g of fat] in pastry products and powdered milk. a,b,c—values within with different letters are significantly different (p ≤ 0.05).
Applsci 14 07934 g004
Figure 5. Chromatogram after separation of sterols and oxysterol fraction extracted from sweet dessert cakes.
Applsci 14 07934 g005
Table 1. Sterol content [mg/100 g of fat] in processed meat products.
Steamed BaconSmoked BaconPork KabanosPoultry KabanosBeef KabanosSalamiCanned Pork
Cholesterol214.72 ± 56.44 bc101.68 ± 5.08 c276.55 ± 77.72 b356.62 ± 67.57 ab98.1 ± 19.06 c237.19 ± 49.67 bc275.02 ± 43.36 b
Campasteroln.d.n.d.n.d.n.d.n.d.n.d.2.65 ± 0.63
Stigmasteroln.d.n.d.n.d.n.d.n.d.n.d.1.22 ± 0.45
β-sitosteroln.d.n.d.n.d.n.d.n.d.n.d.2.01 ± 0.95
Sum of phytosterolsn.d.n.d.n.d.n.d.n.d.n.d.5.88 ± 2.03
n.d.—not detected. a,b,c—values within a row with different letters are significantly different (p ≤ 0.05).
Table 2. Content of sterols [mg/100 g of fat] in pastry products and powdered milk.
Cereal CakesPowdered MilkBiscuits Sweet Dessert Cakes Chocolate Chip Cookies
Cholesterol8.72 ± 1.42 c266.96 ± 82.55 b2007.11 ± 167.57 a95.78 ± 2.06 bc46.26 ± 2.19 c
Brassicasterol42.88 ± 13.93n.d.n.d.n.d.n.d.
Campesterol103.00 ± 1.86 an.d.23.68 ± 1.65 b12.03 ± 0.83 c7.52 ± 0.46 d
Stigmasterol7.74 ± 0.34 an.d.n.d.2.08 ± 0.17 c6.82 ± 0.29 b
β -sitosterol227.18 ± 6.11 an.d.60.15 ± 4.13 b43.01 ± 3.4 c29.81 ± 1.19 d
Avenasteroln.d.n.d.n.d.3.65 ± 0.28 a1.38 ± 0.55 b
Sum of phytosterols380.8 ± 22.24 an.d.83.83 ± 5.78 b60.76 ± 4.68 bc45.53 ± 2.49 c
n.d.—not detected. a,b,c—values within a row with different letters are significantly different (p ≤ 0.05).
Disclaimer/Publisher’s Note: The statements, opinions and data contained in all publications are solely those of the individual author(s) and contributor(s) and not of MDPI and/or the editor(s). MDPI and/or the editor(s) disclaim responsibility for any injury to people or property resulting from any ideas, methods, instructions or products referred to in the content.

