Abstract
Nowadays, traffic congestion poses a significant problem in urban areas, affecting daily life. The imbalance between supply and demand causes overloading. Intersections are critical nodes in urban transport networks, and their design has a substantial impact on traffic safety and efficiency. Microscopic traffic flow models, which describe vehicle maneuvers and traffic patterns, are widely used for optimal design and performance evaluation of transportation facilities. This article focuses on traffic modeling at intersections using the Aimsun software. The examined intersections are located in Topoľčany, Slovakia, where a 13-h traffic survey was conducted on Tovarnická Street. In addition to the current situation, simulations were performed for scenarios distributing 10% and 20% of peak traffic intensity over longer periods, with overall quality levels determined. This article highlights the importance of researching intersection throughput and the need for capacity assessment in planning any construction that affects traffic in the area.
1. Introduction
With the rapid progress in industrialization and urbanization, it is expected that there will be an increasing number of vehicles in the transportation system, potentially leading to social problems such as traffic congestion, accidents, and environmental pollution [,]. In addition, exhaust gases from traffic contribute to the greenhouse effect [,,].
The current primary challenge for urban systems is addressing the negative impacts of road transport. It is known that approximately 50% of pollution comes from road traffic, mainly from combustion engines []. In recent decades, various measures have been adopted to reduce pollution, including vehicle technologies, alternative fuels, and sophisticated demand management policies [,].
Among the most demanding traffic flow management strategies is addressing traffic congestion at the network level. At intersections, unnecessary slowing down or stopping of vehicles results in wasted fuel and time, as well as decreased driver and passenger comfort []. More than 40% of traffic accidents, including 20% of fatalities, occur at intersections. Most of them are caused by human factors []. Urban traffic congestion affects daily life, and the imbalance between supply and demand in transportation causes these problems [,,].
Currently, traffic congestion in large cities is one of the most critical issues affecting daily life. The imbalance between supply and demand in transportation leads to traffic jams [,].
One way to achieve balance is to increase the transportation supply, for example, by constructing roads and intersections. However, implementing such projects is costly and sometimes impossible due to space constraints. An alternative solution is demand management, which is less expensive and involves reducing demand through traffic management plans [,]. Online shopping has proven to be an effective way to reduce urban traffic. Traffic volume forecasts are made to balance supply and demand [,,]. The choice of mode of transport and travel time influences the demand for urban transportation [].
One approach to demand management is the proper allocation of travel time. Flexible working hours (WHs) can reduce traffic congestion. Employees can choose their start time within a predetermined period, selecting a less congested time for travel or a shared vehicle with family members. Remote work and flexible WHs have increased [,]. Consequently, it is expected that these individuals will choose their commuting time for two reasons to help manage travel demand. Firstly, an individual may choose to travel when traffic load is lighter. Secondly, an individual may choose to travel when a shared vehicle can be used with other family members []. Remote work and flexible WHs have been increasing in recent years [].
This paper aims to model this issue and implement it in the city of Topoľčany, to optimize company start times with minimal deviations from original schedules.
Research by the authors on this topic indicates that the implementation of travel time selection policies can significantly reduce traffic density in urban networks. Studies show that flexible WHs decrease car usage and traffic congestion, especially during peak hours. In the Netherlands, adjusting WHs and working from home reduced travel delays. Similar results are presented for public transport. In another study by Van der Loop et al., research shows that in the Netherlands, working from home and adjusting WHs to avoid peak times are the most significant forms of flexible work [,]. Mutlu et al. [] proposed a mathematical model to reduce traffic congestion after the implementation of flexible WH policies. This model aims to find the WHs of each target node considering travel demand between origin and target nodes, routes, and road capacities. Finally, using the proposed program, traffic density during peak hours was significantly reduced. In Beijing, flexible WHs reduced traffic volume by 15.24% and average travel time by 21.73%. Changes in WHs have a positive impact on public transportation performance, although improvements in personal transport are less pronounced [,]. Another study showed that shifting WHs to an earlier time in the morning reduces morning traffic and driver daily load [,]. Another study conducted by the London Metropolitan Transport Authority showed that changing people’s WHs can significantly improve urban and public transportation [,,].
Studies indicate that people are more willing to change their departure time rather than their mode of transportation to avoid congestion. Understanding the psychological factors influencing departure time choice is key to motivating this behavior change []. Departure time choice has been examined from a microeconomic perspective, where individuals make trade-offs between costs, travel time, and deviations from preferred arrival times. Travel time variability (TTV) plays a crucial role, as high variability can lead to reconsideration of departure time choices. Prospect theory also highlights the importance of the decision-making framework for departure time choice, demonstrating the relevance of attitudes and the subjective importance of arriving at a preferred time.
As mentioned, traffic congestion is related to commuting, and changing departure times could significantly contribute to reducing peak-hour congestion. Several studies have shown that people are more likely to change their departure time to avoid congestion than to change their mode of transportation []. The question remains, however, how to motivate people to make this behavior change. Answering this question requires a better understanding of the psychological factors that influence departure time choice. While this question is important for both car and public transport commuting, this paper focuses on car commuting [,].
To date, departure time choice has primarily been examined from a microeconomic perspective, where the main determinants of behavior are objective factors, such as travel time, arrival time, and travel costs. This rational choice approach assumes that individuals make trade-offs between costs, travel time, and deviations from preferred arrival times to maximize their benefit. Later works have also included travel time reliability, which accounts for the uncertainty of actual travel time during a trip, i.e., unexpected delays [,]. This concept, often referred to as travel time variability (TTV), is important, as people may reconsider their departure time choices under conditions of high travel time variability [,]. Several studies have approached departure time choice considering the assumptions of prospect theory. These studies emphasize the importance of the decision-making framework and have shown that the choice of more or less risky departure times depends on the working conditions and positions of commuters. They indirectly demonstrated the relevance of attitudes, specifically the subjective importance of arriving at a preferred arrival time for the choice of departure time [].
2. Materials and Methods
2.1. Introduction to Traffic Modeling
Traffic modeling represents a fundamental tool for the efficient management of high volumes of automobile traffic on major roadways and the optimization of complex road infrastructure. In recent years, this approach has become indispensable for the analysis, simulation, and prediction of traffic behavior at various levels of complexity, from congested urban areas to rural environments, utilizing macro, meso, and microscopic modeling levels [].
Microsimulation models focus on detailed tracking of individual vehicles and their dynamics, such as lane-changing maneuvers, providing a comprehensive view of vehicle behavior in traffic []. These models provide detailed results and accuracy in monitoring individual driver behaviors.
Macrosimulation models, on the other hand, deal with traffic at a higher level of abstraction, where key parameters are traffic density and road link capacity. These models do not account for individual driver behaviors but provide an overall picture of traffic flow and enable the analysis of road network capacity needs []
Mesosimulation models, which represent a compromise between macro and microsimulation approaches, allow for dynamic simulation of traffic entities with less emphasis on detail compared to microsimulation models []. These models are suitable for analyzing broader trends in traffic behavior without the need for high detail.
Another modern approach in microscopic traffic modeling is agent-based modeling, which is gaining popularity in urban logistics []. These models incorporate individual actor behaviors, allowing for the simulation of their decision-making in various scenarios, such as policy measures [].
The overall use of traffic modeling, whether macro, meso, or microsimulation approaches, contributes to a better understanding and management of traffic systems, which is essential for the effective administration of urban and rural transportation and the improvement of quality of life in these areas.
Traffic behavior is the volume, speed, and density of traffic flow, estimated based on available historical or real-time data. In recent years, with the rapid increase in intelligent transportation services, traffic monitoring applications, and the development of the Internet of Things (IoT), traffic modeling has gained significant attention in the research community. Most research in traffic modeling focuses on designing models that analyze and predict traffic congestion issues and simulating traffic flow in various road environments, such as highways, intersections, and urban streets [,,].
The availability of these models is crucial for traffic engineering and the performance evaluation of traffic facilities. These models examine spatial and temporal interactions within traffic situations to capture their significant impact on traffic behavior. The temporal factor in these models identifies directional movement within a time series, while the spatial factor considers geographic space to create accurate predictions. The combination of temporal and spatial characteristics in traffic prediction models significantly improves the prediction accuracy [].
Numerous studies have demonstrated that machine learning models can effectively model spatiotemporal correlations in continuous traffic data. On the other hand, traffic simulation models are used to simulate vehicle movements and realistically depict traffic flow. These models are essential for optimizing road design and evaluating the impact of road network design on vehicle movement. Simulation models provide a realistic geographic environment for planning driver behavior scenarios on various types of roads, including urban and highway networks. They use mathematical models to simulate real-time vehicle movement, following theories that describe automobile behavior. The difference between traffic prediction models and traffic simulation models lies in their goals and usage. Prediction models estimate future values of traffic indicators (such as volume, speed, and density) based on historical data under given conditions. In contrast, simulation models estimate the current value of traffic indicators under specific conditions and test various scenarios and design changes in road infrastructure [].
Verkehr In Stadten-SIMulationsmodell (VISSIM 2023.0.8.0) is one of the most widely used software tools for traffic microsimulation. The ability to model heterogeneous traffic without lane discipline makes VISSIM a primary choice for traffic flow simulation. The tool has also simulated intersection flows [,].
2.2. Traffic Modeling in Aimsum Software
The traffic model was developed using Aimsun Next 22.0.1.0, a tool that facilitates macroscopic, mesoscopic, and microscopic simulation. Aimsun enables the modeling of various traffic networks, including urban networks, highways, expressways, bypasses, and their combinations [,,,].
Simulations in Aimsun provide a variety of outputs, categorized into several groups: network-wide statistics, statistics for a group of sections, statistics for individual sections and turns, statistics for selected routes, source/destination matrix statistics, and public transportation statistics. For each group, outputs such as traffic intensity, density, average speed, section speed, travel time, delay time, stop time, number of stops, total distance traveled, total travel time, fuel consumption, and emissions produced are generated [,].
2.2.1. Definition of the Traffic Model Purpose and Input Data
The traffic model was developed to study the impact of peak hour distribution on one of the main traffic arteries in the city of Topoľčany. It required the creation of a traffic model capable of performing microscopic simulation. The model needed to support various types of traffic, including passenger cars, trucks, heavy trucks, and public transportation. It was also important to simulate the changing demand on the traffic network, i.e., the fluctuating load on the network. Aimsun was selected for this purpose, as it met all the defined requirements. The input data for such a model include traffic load data in short time intervals (15 min) and calibration data. Figure 1 shows the entire process of creating a microsimulation and obtaining outputs.
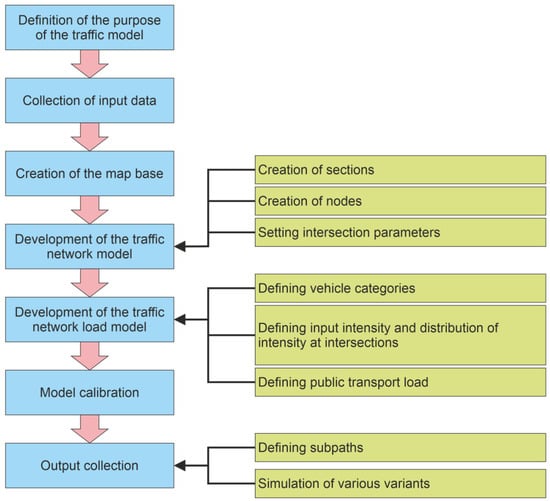
Figure 1.
Procedure for evaluating the impact of peak hour distribution using microscopic simulation in Aimsun software. Source: processed by authors.
2.2.2. Collection of Input Data
Traffic load data were obtained through a directional intersection traffic survey conducted at five intersections. This survey provided data on the traffic intensity and the turning movements of vehicles at selected intersections. These data were collected separately for different types of vehicles, including passenger cars, trucks, heavy trucks, bicycles, and buses.
Data collection for this research was conducted through two separate activities. Firstly, a comprehensive traffic survey was carried out using video cameras placed above individual intersections. Temporary industrial cameras with batteries were used for this purpose. These cameras were installed on street lighting poles near the specified intersections using a hydraulic lift. In this case, automatic analysis software was utilized to evaluate vehicle movements at the intersections.
During the traffic survey, data were also collected from the Google Distance Matrix API []. The following figure (Figure 2) highlights the segments for which online data were gathered. These same segments were subsequently set as subpaths in the Aimsun software.
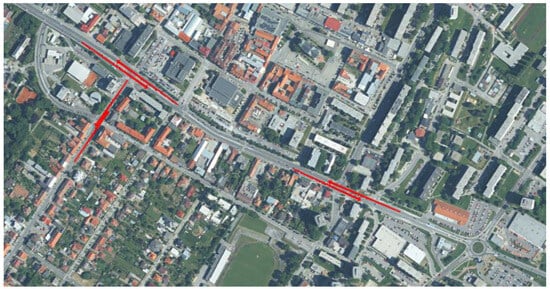
Figure 2.
Road sections for which travel times have been collected via the Distance Matrix API. The red arrows indicate the monitored traffic flow and its direction. Source: processed by authors.
2.3. Analysis of Signal-Controlled Intersections in Topoľčany
Directional traffic surveys were conducted at five traffic signal-controlled (TSC) intersections, the locations of which are shown in Figure 3.
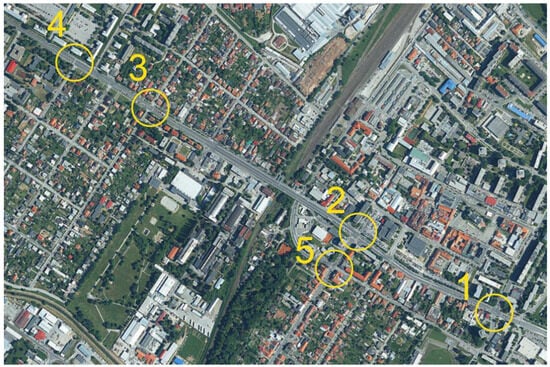
Figure 3.
Designation of analyzed intersections. Source: processed by authors from [].
These surveys were conducted on an average working day (Tuesday) on 26 October 2023, from 5:30 to 18:30, a total of 13 h, so that the traffic survey would definitely identify both traffic peak hours. The survey results were not affected by adverse weather conditions.
Table 1 provides a comparison of measured values obtained from the traffic survey at the analyzed intersections.

Table 1.
Comparison of measured values at individual intersections. Source: processed by authors.
Additional input data necessary for the calibration of the traffic model were also collected. During the traffic survey, a survey of vehicle travel times on selected sections was also conducted using the Google Distance Matrix API. These data were collected at 5-min intervals. An experiment evaluating the accuracy of Google Maps in determining traffic speeds showed promising results. A comparison of actual traffic speeds with the congestion levels indicated by Google Maps showed a 90% match, demonstrating the potential usability of these maps for accurate assessment of road congestion [].
2.4. Model Creation
2.4.1. Creation of the Map Base
The traffic model was created using a map base [], allowing for accurate modeling of sections, their lengths, and individual lanes. High-resolution orthophotos enabled precise definition of typical vehicle trajectories at intersections.
2.4.2. Creation of the Traffic Network Model
Using Aimsun functions, individual objects on the traffic network (sections and nodes) were progressively created and modified. The created roads were adjusted for lane widths, lane arrangements, segment lengths, and maximum allowed speeds, and nodes were set with give-way signs and control plans—Figure 4. The created traffic model has the following characteristics:
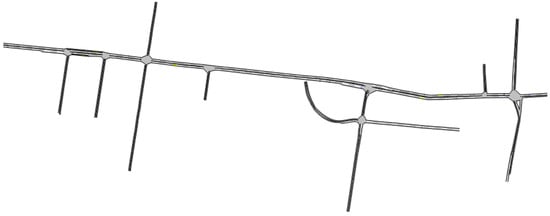
Figure 4.
Created traffic model. Source: processed by authors.
- consists of 92 sections and 19 intersections,
- total section length: 8 km,
- total lane length: 12 km.
- The modeled traffic network includes five TSC intersections. Intersection no. 1 has a traffic-dependent traffic signal control.
2.4.3. Creation of the Traffic Network Load Model
Three types of vehicles were modeled—car, bus, and truck. The demand model was created using a traffic state in 15-min intervals. The input values for the traffic state were obtained from the directional intersection survey conducted at five TSC intersections on 26 October 2023. The traffic model also includes intersections where no traffic survey was conducted. These intersections were used to balance the measured intensity differences between two adjacent intersections. For public transport (buses), routes and schedules (arrival and departure times) were created according to the timetable.
2.4.4. Calibration of the Traffic Model
The traffic model was calibrated based on vehicle travel times on selected sections. Figure 5 shows the approximation of simulated travel time values at intersection no. 2 to the actual measured values. Variations in the simulation are mainly because simulation outputs were collected at 1-min intervals, while values measured via Google were collected every 5 min.
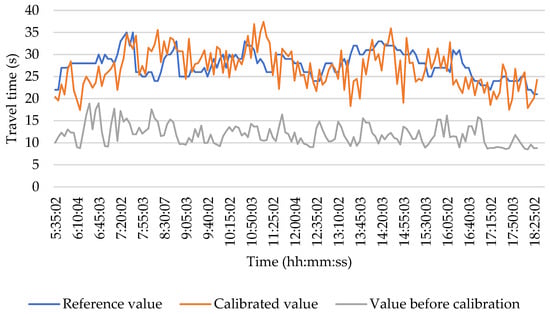
Figure 5.
Example of simulation model calibration. Source: processed by authors.
2.4.5. Definition of Subpaths
Delays at intersections were simulated using subpaths, with a number of subpaths created for each intersection corresponding to the number of traffic streams at that intersection. For example, Figure 6 shows the subpath for traffic stream no. 7. The subpath includes a longer segment at the entrance to the intersection and a very short segment at its exit. The simulation outputs for a given subpath account only for vehicles that have traversed the entire subpath. This method ensures that the delay time for the subpath encompasses the delays at the entrance to the intersection, delays while passing through the intersection, and delays on the very short segment at the exit of the intersection. Given that only minimal delays can occur on the very short segment at the intersection’s exit, the delay time calculated from these subpaths can be considered the delay time for the intersection.

Figure 6.
Example of subpath for traffic flow no. 7: red section—selected subpath, purple—detectors, arrows—traffic markings, triangles—traffic signs. Source: processed by authors.
2.5. Simulation of Different Variants
The calibrated traffic model assesses the current state of the evaluated traffic network and simulates various scenarios involving defined adjustments. The primary adjustment involved modifying the demand model to spread the peak traffic intensity over a longer period–modeling the temporal distribution of peak traffic while maintaining the same number of vehicles passing through the network. The morning peak hour (MPH) was from 7:15 to 8:15, with the peak quarters measured just before 8:00. It can be assumed that this morning peak is due to the start of the work shift at 8:00. With flexible WHs, some residents might choose a different start time for work. For this scenario, it is assumed that residents will be allowed to start their work shift at 9:00.
Three scenarios were simulated:
- Variant 0: The current state.
- Variant 1: A state where 10% of the peak traffic intensity is shifted to the period immediately following the current peak. Specifically, 10% of the intensity from the period 7:15–8:15 is shifted to 8:00–9:15, and 10% of the intensity from 14:00–16:15 is shifted to 16:15–17:15.
- Variant 2: A state where 20% of the peak traffic intensity is shifted to the period immediately following the current peak. Specifically, 20% of the intensity from the period 7:15–8:15 is shifted to 8:00–9:15, and 20% of the intensity from 14:00–16:15 is shifted to 16:15–17:15.
It is not possible to accurately determine how traffic will change after the introduction of flexible WHs. However, we assume that people will choose times when they experience less delay. A 10% and 20% shift from the traffic peak were chosen to allow an estimation of how the situation would change if the traffic peak were reduced by, for example, 15%.
The traffic survey data were collected in 15-min intervals, as were the input values into Aimsun, and the simulation evaluation was performed every minute. A 10% reduction in the traffic peak means reducing the value of each 15-min interval by 10%, meaning the number of vehicles by which the traffic peak is reduced differs in each interval.
3. Results and Discussion
Firstly, the intersections were assessed in terms of their capacity. The capacity calculations for the evaluated intersections followed the procedure defined in Technical Conditions TP 102 [] “Calculation of Road Capacities", which is the recognized method for intersection capacity calculations in the Slovak Republic. Given the variations in intersection load from different entries throughout the day, the capacity calculations were conducted separately for both the morning and afternoon peak hours (APH). Since the evaluated intersections use signal plans with two different cycle lengths for control, the capacity calculations were performed for both signal plans.
The comparison of the achieved level of service is presented in Table 2, which shows that currently, two intersections in coordination have reached and exceeded their capacity. The waiting times are extremely long, and the intersections are overloaded.

Table 2.
Comparison of the capacity assessment results for the current and future state. Source: processed by authors.
Furthermore, the capacity of the intersections and the impact of the temporal distribution of peak traffic were analyzed using virtual simulation in the Aimsun software. A total of 27 simulations were performed, and the results represent the comparison of average values across these 27 simulations. The entire period for which intersection survey data were available was simulated, meaning each simulation covered 13 h (5:30–18:30). The simulation outputs were recorded in the database at 1-min intervals.
The primary simulation output compared was delay time. The average delay time for the modeled network was 43.9 s, with a standard deviation of 0.8357 s. Based on the calculation using Formula (1), we can state that, at a 99% confidence level, the confidence interval was 0.983 s, approximately 1 s.
where:
| — | confidence interval, α corresponds to the probability that the mean value does not lie within the confidence interval, | |
| — | Student’s t-distribution for the probability of a two-tailed error (sum α) with N − 1 degrees of freedom, | |
| — | the number of repetitions, | |
| S | — | standard deviation of the model outputs. |
The simulation results were processed in two levels—for the entire transport network and for individual TSC intersections. For obtaining outputs for the entire traffic network, the “MISYS” database was used, where the main outputs were (number of vehicles that have exited the network), (mean delay time in s/km), and (total traveled distance in km). The statistics include only those vehicles that have traversed the entire system in the simulation, i.e., those that have exited the traffic network.
The Aimsun Dynamic Simulators User’s Manual v.8 shows methods for calculating individual simulation outputs–delay time (2), travel time (3) and travelled distance (4):
where:
where:
where:
| — | average delay time per vehicle per km (s/km), | |
| — | average delay time per km of the i-th vehicle (s) | |
| — | number of vehicles that exit the network during period I. |
| — | average travel time per km of the i-th vehicle (s), | |
| — | total delay time accumulated in each section by the i-th vehicle (s), | |
| — | total distance travelled by the i-th vehicle in the network (m). |
| — | total number of kilometers travelled by all the vehicles that have crossed the network (km). |
The traffic model in Aimsun, when loaded through the “Traffic state", does not allow for the collection of statistical simulation outputs for individual vehicles. However, it does permit the recording of information at adjustable intervals. In our simulation, the interval for counting and recording statistical outputs was 1 min. As a result, each simulation yielded 780 simulation outputs for relatively small groups of vehicles (a maximum of 78 vehicles during 1 min of simulation). Therefore, the average delay times “dtime” were calculated for these small groups of vehicles.
The total delay time per 1 km of travel can then be calculated using the following Equation (5):
During a single interval, vehicles travel a total of “travel” km, from which it follows that each vehicle in interval travels (6):
The total delay time for all vehicles on the traffic network can then be calculated as (7):
3.1. Outputs of the Simulation on the Traffic Network for the Investigated Variant 1
Figure 7 shows the change in traffic intensity on the modeled network (a 10% change in intensity). The figure illustrates that Variant 1 has a temporal extension of the traffic peak and a reduction in extreme intensity values during the peak period.
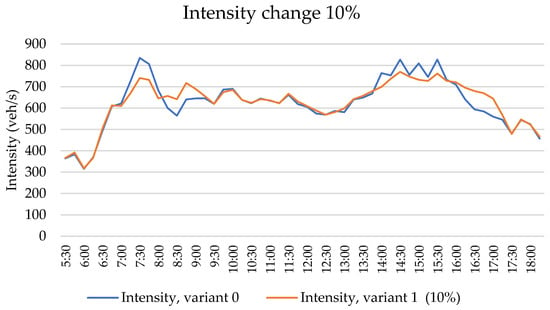
Figure 7.
Comparison of intensity change between Variant 1 (10%) and Variant 0 (current state). Source: processed by authors.
As shown in Table 3, the total delay time from 7:15 to 8:15 is shorter (by 14.05%), but the delay time from 8:15 to 9:15 is longer (by 18.29% compared to the current state). However, the total delay time is shorter. In the first half of the day, this results in a reduction of 0.19 h, and in the second half of the day, a reduction of 0.64 h. Therefore, from an overall perspective, this represents only a slight reduction in total delay time. These results suggest that the temporal distribution of the traffic peak in the studied period has a relatively significant impact on traffic during the peak period. However, the overall reduction in travel time is minimal.

Table 3.
Comparison of total delay time between the current state and Variant 1. Source: processed by authors.
In Figure 8, the reduction in total time during the traffic peak from 7:15 to 8:15 and the increase in delay times from 8:15 to 9:15 can be observed. Outside of these periods, the differences in delay times are minimal. From this, it can be inferred that if 10% of vehicles are shifted from the MPH to the period from 8:15 to 9:15, the deterioration in the traffic situation will only occur during this period and will not create congestion that would affect traffic beyond this period. It is also evident that total delay times will be longer in the period from 8:15 to 9:15.
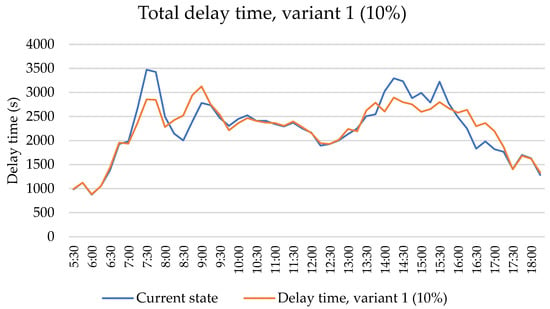
Figure 8.
Comparison of total delay time for Variant 1 (in 15-min intervals). Source: processed by authors.
The following graphs show the difference in delay times on the modeled network for individual vehicles. The graphs represent the percentage of vehicles that fall into 5-s intervals according to their total delay time on the traffic network. In Figure 9, it can be seen that with a 10% shift in start time, the number of vehicles delayed on the network from 50 to 60 s decreases, and the number of vehicles delayed on the network for 40 s/km increases.
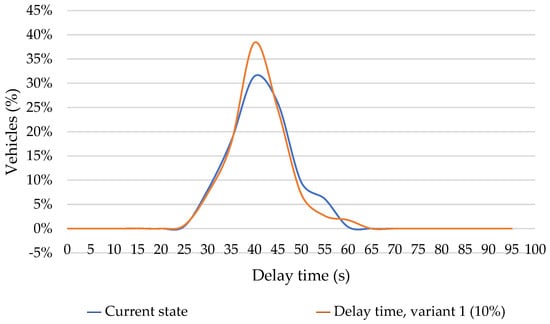
Figure 9.
Entire day—the percentage of vehicles by their total delay time on the traffic network. Source: processed by authors.
A similar trend can be observed in the graphs showing vehicles in the morning and afternoon (Figure 10). Although simulations indicate more vehicles with reduced delay times, the maximum delay values increase by approximately 4 s (from 60.58 to 64.65 s/km). These maximum values will be reached in the morning hours. In the afternoon, the maximum delay time will also increase by approximately 3 s (from 57.7 to 60.45 s/km). These extreme delay times were simulated for only about 400 vehicles–approximately 1% of vehicles will experience longer delay times than the maximum delay times currently observed.
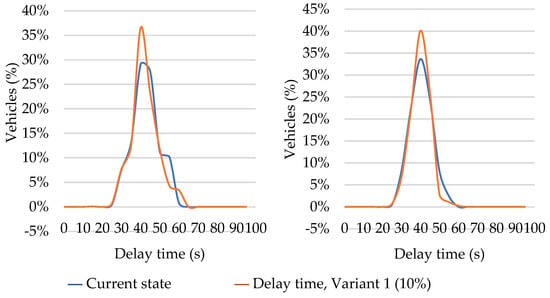
Figure 10.
The percentage of vehicles by their total delay time on the traffic network in the morning (left) and afternoon (right). Source: processed by authors.
3.2. Outputs of the Simulation on the Traffic Network for the Investigated Variant 2
In Variant 2, it can be observed that if 20% of vehicles from the peak traffic period shifted their travel time to the period between 8:00 and 9:15, the peak quarter-hour and peak hours would occur at different times compared to the present, with the MPH occurring from 8:15 to 9:15 and the AP hour from 16:00 to 17:00. However, the intensities during the peak hours would still be lower than the intensities during the current peak hours (Figure 11).
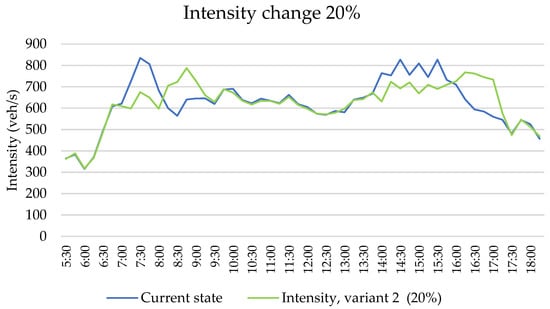
Figure 11.
Comparison of intensity change between Variant 2 (20%) and Variant 0 (current state). Source: processed by authors.
Simulation results indicate a significant increase in delay times from 8:15 to 9:15, with longer delay times compared to the present lasting until 10:00. An increase in intensity from 8:15 to 9:15 will cause traffic congestion that lasts beyond the period of increased traffic intensity. The situation will normalize to current levels only after 10:00.
Since the simulation does not consider changes to the signal plans of intersections during this period (except for intersection K4), the higher increase in delay times is likely due to the change in the source and destination of trips in different time intervals, resulting in different proportional loads on individual traffic flows.
In the afternoon, the total delay times will still be shorter than in the current state. However, there is a noticeable increase in delay times starting from 16:15, the period simulated to have increased intensity due to vehicles from the AP hour (Figure 12).
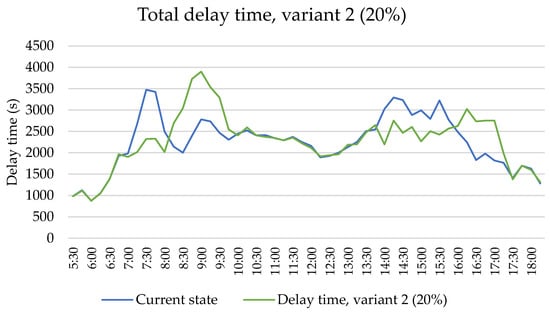
Figure 12.
Comparison of total delay time for Variant 2 (in 15-min intervals). Source: processed by authors.
Similarly to Variant 1, if the intensity during the current MPH is reduced by 20%, the total delay times will decrease significantly, by 27.93%. However, these vehicles will cause an increase in intensity from 8:15 to 9:15 (new traffic peak), where the total delay time will increase by 43.42%. In terms of hours, during the current traffic peak, total delay times will be shorter by 14.01 h, but in the newly formed traffic peak, they will be longer by 16.91 h, meaning that the delay time for all vehicles will be longer by an additional 2.9 h. Considering that congestion will last until 10:00, the total delay time for all cars in the morning will be longer by 10.05 h.
Conversely, in the afternoon, it is still possible to observe a reduction in total delay time by 2.84 h. However, this reduction in delay times is significantly lower compared to the increase in delay times from the morning, resulting in a longer total delay for vehicles on the traffic network, by 7.21 h. Table 4 also shows other results.

Table 4.
Comparison of total delay time between the current state and Variant 2. Source: processed by authors.
When looking at the delay times for individual vehicles (Figure 13), it is obvious that a large group of vehicles experienced reduced delay times on the traffic network, of up to 40–45 s. This reduction is more significant than in Variant 1. However, the simulations also recorded vehicles with delay times exceeding 65 s (approximately 4.45% of all vehicles). As shown in Figure 14, all these extended delays were simulated during the morning hours.
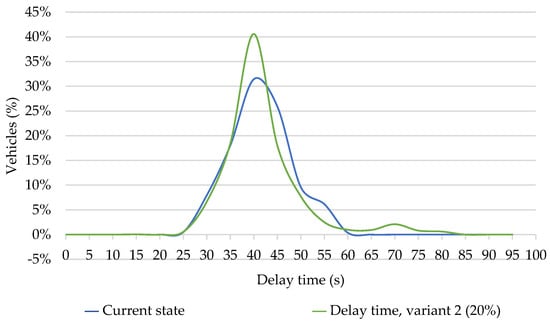
Figure 13.
Delay times for individual vehicles, Variant 2 (20%). Source: processed by authors.
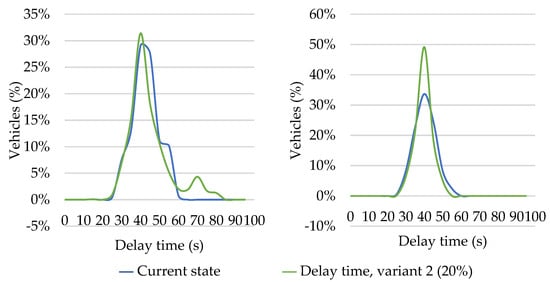
Figure 14.
Delay times for individual vehicles during MPH (left) and APH (right), Variant 2 (20%). Source: processed by authors.
Table 5 shows that the average delay time for the entire day is shorter compared to the current state in Variant 1. In Variant 2, it is longer than in the current state. On the other hand, both the mode and the median have a decreasing trend. This situation is mainly due to extreme values, with the maximum delay time in Variant 2 reaching 84.3 s (compared to 60.58 s in the current state). In the morning, the median is shortest in Variant 1 and longest in Variant 2. In the afternoon, the median is shortest in Variant 2.

Table 5.
Delays on the traffic network per 1 km. Source: processed by authors.
The mode shows lower values in Variant 1 and even lower in Variant 2; however, in the morning, the mode of delay times is highest in Variant 1. From all these values, it can be concluded that dispersing the traffic peak will result in most vehicles experiencing shorter delay times, but there will also be a small number of vehicles that will experience significantly longer delays on the traffic network compared to the current state.
3.3. Evaluation of Individual TSC Intersections with Traffic Signal Control (TSC)
For gathering statistics from subpaths, the MISUBPATH database was used, where the main examined item was (mean delay time in seconds). The Aimsun manual describes the calculation method (8) for (equal to ):
where:
| — | average delay time per vehicle (s), | |
| — | , | |
| — | average delay time per km of the i-th vehicle (s), | |
| — | . |
From Equation (9), it follows that to calculate the level of service at the intersection, we can directly use the () value.
Figure 15, Figure 16, Figure 17, Figure 18 and Figure 19 show the maximum delay times at individual intersections throughout the day, calculated according to Equation (7).
where:
| — | . |
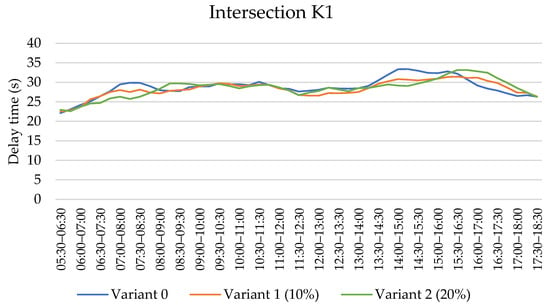
Figure 15.
Modeling of delay times at Intersection K1. Source: processed by authors.
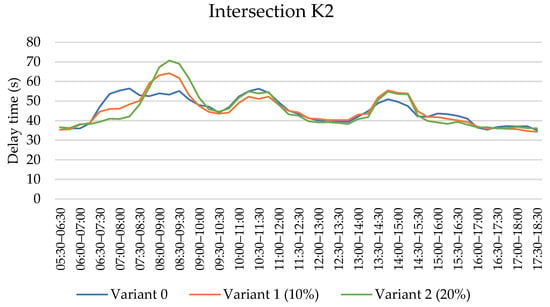
Figure 16.
Modeling of delay times at Intersection K2. Source: processed by authors.
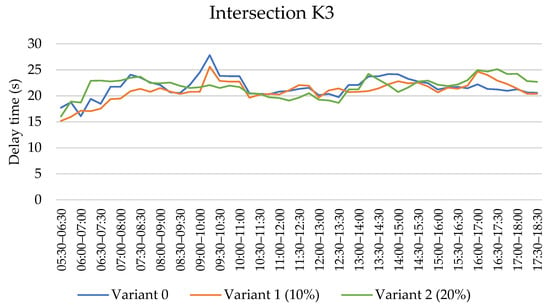
Figure 17.
Modeling of delay times at Intersection K3. Source: processed by authors.
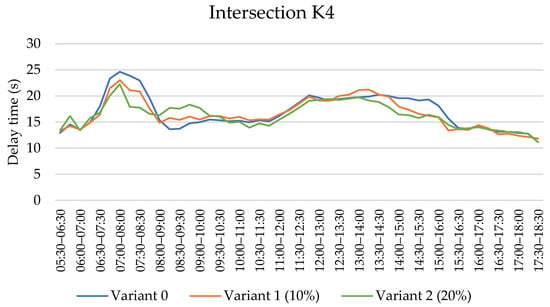
Figure 18.
Modeling of delay times at Intersection K4. Source: processed by authors.
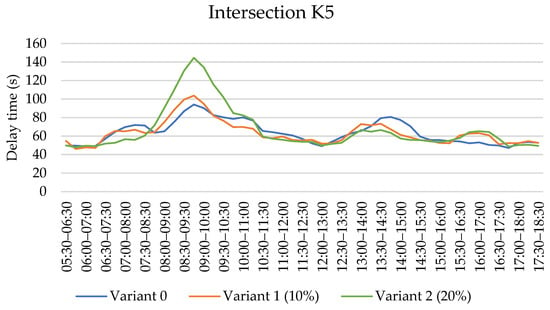
Figure 19.
Modeling of delay times at Intersection K5. Source: processed by authors.
Table 5 lists the extreme values of delay times for the morning period (5:30–12:00), the afternoon period (12:00–18:30), and the MPH (7:15–8:15 and 8:15–9:15).
Intersection K1 is currently the only one with traffic-dependent control; as shown in Figure 15, the change in intensity due to the temporal distribution of the traffic peak throughout the day does not significantly affect the maximum delay time. The worst simulated level of service is B for all three variants. Results for intersection K2 are in Figure 16.
Similarly to intersection K1, at intersection K3 (Figure 17), the distribution of traffic peaks does not significantly affect the quality of traffic. The worst simulated level of service is B for all three simulated variants (see Table 6).

Table 6.
Simulation results—comparison of different solution variants. Source: processed by authors.
According to the simulation results, the quality of traffic at intersection K4 (Figure 18) is good throughout the day (level of service B). Although the time savings are minimal, this intersection shows the most significant benefits from the temporal distribution of the traffic peak. During high-load times (8:15–9:15), the level of service does not deteriorate and remains at A; however, in Variant 2, there can be an improvement in the level of service for the period 7:15–8:15 (from level B to level A) (see Table 6).
The temporal distribution of the traffic peak will have the most negative impact on intersection K5, which is already at its capacity limit (according to the simulation results, it reaches the level of service E). As shown in Figure 19, in the case of Variant 1 (10%), the increase in delay times is not significant, but in the case of Variant 2 (20%), the intersection capacity will be exceeded, and the increase in delay times will be significant. The simulation results suggest that congestion will affect traffic for a longer period—significantly longer waiting times will be observed until 10:30. The level of service at the intersection is F (see Table 6).
3.4. Limitations of the Study
This article describes the impact of flexible WHs and peak-hour traffic on a specific example of a small district town. It can be assumed that similar improvements in traffic conditions will occur in other cities with approximately the same peak-hour traffic intensity. For comparison, cities where intersection surveys were conducted in the last five years were selected. The following figure (Figure 20) presents a graph showing the percentage of vehicles passing through the intersection during the morning and afternoon peak hours relative to the total load between 6:00 and 10:00 and between 14:00 and 18:00.
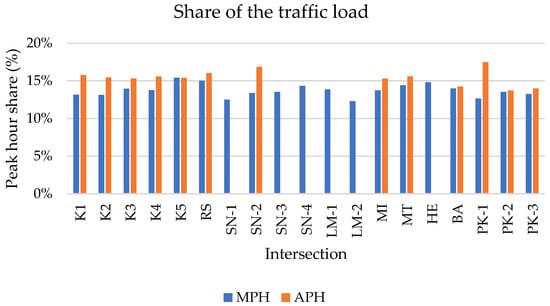
Figure 20.
Share of the traffic load during the peak hour (K—intersections analyzed in this case study, RS—Rimavská Sobota, SN—Spišská Nová Ves, MI—Michalovce, HE—Humenné, BA—Batislava, PK—Pezinok). Source: processed by authors.
The graph in the previous figure shows that during the morning peak hour, 12.31% to 13.73% of the total traffic load passes through the intersections, while during the afternoon peak hour, this percentage ranges from 13.73% to 17.47%. The total load is defined as the sum of vehicles recorded between 6:00 and 10:00 and between 14:00 and 18:00. In some cases, data for the afternoon peak hours were not available. Based on this comparison, it can be assumed that if a similar traffic load distribution is observed in other cities, the traffic flow characteristics will behave similarly. It should be kept in mind that the outputs presented in this article are only the results of a microscopic simulation conducted on traffic light-controlled intersections in the town of Topoľčany. However, traffic-related problems are faced by almost every city, and these problems will only grow with the increasing number of individual cars. From the results of traffic surveys, it is obvious that the traffic peak in Slovak cities accounts for 12% to 17.5% of the 8-h intensity. During the traffic peak, people most acutely feel traffic-related problems. Verification of simulation results with real data is not possible due to a lack of data—there is no exact number of workers whose WHs have changed to flexible formats. However, the simulation outputs indicated under what conditions such a change could benefit the traffic situation in the area in question.
This article clearly states that flexible WHs can contribute to improving traffic conditions. By spreading out the morning or afternoon peak hours, not only is the pressure on infrastructure reduced, but it is also easier to manage peak times in terms of public transportation. However, flexible WHs also have certain limitations and risks in terms of implementation, regulations, and potential unintended consequences [].
From an implementation perspective, it should be noted that not all industries (e.g., manufacturing) are prepared to adopt flexible WHs. It is therefore generally true that office-based professions are more suitable for flexible WHs. However, changing the start of the workday could also be problematic in these professions. Some families, particularly in the morning, may share a commute to work and school, so the start of their work shift would likely be aligned with the start of their children’s school day or their partner’s work shift. Another issue could be managing people who are not present at the workplace for the entire time, and there is also a need for related technological infrastructure if employees work from home.
From a regulatory perspective, it is important to ensure that social legislation (labor laws) is not violated, and therefore, each company’s internal regulations must be properly set.
Flexible WHs may also have negative impacts. In transportation, they may not only reduce traffic congestion but could shift it to another time. In public transportation, there may be a demand for additional services at different times, requiring the addition of more routes. Problems may also arise in the area of social interaction [], similar to those experienced with the introduction of remote work [], such as difficulties in separating work and private life and the risk of social isolation if team members work at very different times.
Another limitation of this study is the lack of an environmental assessment. Although the Aimsun microsimulation program provides for this, its emissions model is outdated. It can be assumed that if the stop time, the number of stops, and the need for vehicle acceleration and deceleration are reduced during the simulation, this would have a positive impact on fuel consumption and the associated exhaust emissions. The environmental impacts of flexible WHs should be the subject of further studies.
3.5. Possibilities of Using the Results
The main finding of the article is that time savings can be achieved by spreading out the intensity of peak hours under traffic-dependent control. An intersection controlled according to current traffic conditions can ensure smoother traffic flow at lower traffic intensities. On the other hand, under time-dependent control, a short-term increase in intensity can cause problems, especially if the intersection is operating at its capacity limit (in this case study, this was the intersection K5). The study also showed that traffic-dependent control was able to handle these short-term changes (intersection K1).
In Slovakia, there are both original time-dependent and new traffic-dependent intersections. For example, in the city of Žilina, all intersections are controlled according to traffic load, while in other cities, there are significantly fewer—one in Liptovský Mikuláš, one in Rimavská Sobota, and one in Spišská Nová Ves. The article suggests that the introduction of flexible WHs could be especially beneficial in cities with a majority of traffic-dependent intersections. In cities where intersections are still controlled based on fixed time schedules, the change could worsen the traffic situation, potentially necessitating adjustments to signal plans during specific time intervals.
4. Conclusions
Capacity calculations reveal the exceeded capacity of intersections K1, K4, and K5. Simulation results for the current state indicate that intersection K5 is at the edge of its capacity. The main reason for the discrepancy between the calculation outputs and the simulations is the intersection K1 with actuated control, which cannot be accounted for in capacity calculations according to technical conditions TP 102. However, the Aimsun software can simulate such intersections. Similarly, intersection K4 has TSC only on one arm for a pedestrian crossing, which also could not be perfectly accounted for in the capacity calculations according to TP 102. From this perspective, virtual simulation in the Aimsun program is a better tool for assessing the impact of the temporal distribution of traffic peaks.
Simulation suggests that an increase in traffic intensity outside the current traffic peak can cause more significant problems than those currently experienced in the city of Topoľčany. This is mainly because the examined area includes five intersections with TSC, four of which are fixed control, and only one of which has actuated control. According to the simulation for the current state, K5 is at the edge of its capacity. Since it is a time-dependent traffic-controlled intersection, exceeding capacity will cause significant increases in delay times. However, since it is a time-dependent controlled intersection, a reduction in intensity has a lower impact on reducing delay times, mainly because vehicles at the intersection wait only until they receive a green signal, during which most can pass through.
Intersection K1, the only one with actuated control, managed the change in load best. For example, with the implementation of Variant 2, the average delay times during the current morning peak decreased by 4.2 s, but the increase in delay times during the period of increased intensity was only 1.9 s on average.
Conversely, the worst case was intersection K5, where with the implementation of Variant 2, the average delay times during the current peak decreased by 16.1 s. However, they increased by 34.6 s during the 8:15–9:15 period. We can assume that the temporal distribution of the traffic peak over a longer period will positively affect traffic, especially in combination with actuated control at TSC intersections.
Another positive effect of changing the start of work shifts could be a higher rate of shared rides or higher use of other modes of transport, such as bicycles, thereby reducing traffic intensity. However, a reduction in traffic intensity will again have the most significant impact on traffic, especially if the intersections are controlled by actuated control, which can best adapt to changes in intensity.
The temporal distribution of the traffic peak using flexible WHs must also be considered from the perspective of public transport. On one hand, flexible WHs can help evenly load vehicles at different times, theoretically reducing the total number of public transport vehicles required. On the other hand, it may result in increased transport performance in public transport, mainly due to the need for a higher number of connections to cover the start and end times of work shifts.
Simulation results suggest that the temporal distribution of the traffic peak has its limits. If too many drivers change their departure times, the traffic peak and associated problems will shift to another part of the day. It is, therefore, necessary to carefully consider which companies and institutions should change their start times or where the implementation of flexible WHs is appropriate. According to the simulation results, reducing intensity during the peak by 10% would appear to be effective for the traffic situation in Topoľčany. However, reducing intensity by 20% will lead to traffic problems at another time of day.
The simulation showed that a 10% distribution of peak load will have a positive impact on traffic, with average daily delays decreasing by approximately 0.58%. However, a 20% distribution of peak load will have a negative impact on traffic, with average daily delays increasing by 1.09%. This situation is mainly due to some intersections exceeding their capacity outside the current peak period due to the redistribution of demand. It also showed that the temporal distribution of the traffic peak may not be a suitable tool for improving traffic conditions if there are intersections with time-dependent traffic control in the area.
Author Contributions
Conceptualization, Ľ.Č. and A.K.; methodology, A.K.; software, Ľ.Č.; validation, Ľ.Č., J.P. and A.K.; formal analysis, K.Č.; investigation, J.P.; resources, J.P.; data curation, Ľ.Č.; writing—original draft preparation, J.P.; writing—review and editing, K.Č.; visualization, K.Č.; supervision, Ľ.Č.; project administration, A.K.; funding acquisition, A.K. All authors have read and agreed to the published version of the manuscript.
Funding
This paper has been developed under support of the project: MŠVVŠ SR VEGA No. 1/0178/22 KALAŠOVÁ, A.: Basic research of the sharing economy as a tool for reducing negative externalities.
Institutional Review Board Statement
Not applicable.
Informed Consent Statement
Not applicable.
Data Availability Statement
The raw data supporting the conclusions of this article will be made available by the authors on request.
Conflicts of Interest
The authors declare no conflicts of interest.
References
- de Luca, S.; Di Pace, R.; Memoli, S.; Pariota, L. Sustainable Traffic Management in an Urban Area: An Integrated Framework for Real-Time Traffic Control and Route Guidance Design. Sustainability 2020, 12, 726. [Google Scholar] [CrossRef]
- The Future of Cities–Opportunities, Challenges and the Way Forward–European Commission. Available online: https://joint-research-centre.ec.europa.eu/jrc-news-and-updates/future-cities-opportunities-challenges-and-way-forward-2019-10-11_en (accessed on 10 July 2024).
- Lizbetin, J.; Stopka, O.; Kurenkov, P.V. Declarations Regarding the Energy Consumption and Emissions of the Greenhouse Gases in the Road Freight Transport Sector. Arch. Automot. Eng.–Arch. Motoryz. 2019, 83, 59–72. [Google Scholar] [CrossRef]
- Synák, F.; Gaňa, J.; Rievaj, V.; Mokričková, L. Ways of Reducing Carbon Dioxide from Road Transport. Arch. Automot. Eng.–Arch. Motoryz. 2019, 86, 41–54. [Google Scholar] [CrossRef]
- Samson-Bręk, I.A.; Matuszewska, A. Possibilities of Reducing Greenhouse Gas Emissions in Agriculture on the Example of a Biogas Plant. Arch. Automot. Eng.–Arch. Motoryz. 2019, 86, 127–142. [Google Scholar] [CrossRef]
- Alam, A.; Hatzopoulou, M. Reducing Transit Bus Emissions: Alternative Fuels or Traffic Operations? Atmos. Environ. 2014, 89, 129–139. [Google Scholar] [CrossRef]
- Du, B.; Hu, X.; Sun, L.; Liu, J.; Qiao, Y.; Lv, W. Traffic Demand Prediction Based on Dynamic Transition Convolutional Neural Network. IEEE Trans. Intell. Transp. Syst. 2020, 22, 1237–1247. [Google Scholar] [CrossRef]
- Jurecki, R.S.; Jaśkiewicz, M. Analysis of Road Accidents in Poland over the Last Ten Years. Zesz. Nauk./Akad. Morska W Szczecinie 2012, 32, 65–70. [Google Scholar]
- Matuszak, Z.; Jaskiewicz, M.; Wieckowski, D.; Stoklosa, J. Remarks to the Reliability Assessment and to Human Actions–Especially Car Driver. In Proceedings of the 18th International Scientific Conference-Logi 2017, Ceske Budejovice, Czech Republic, 19 October 2017; Stopka, O., Ed.; EDP Sciences: Les Ulis, France, 2017; Volume 134, p. 00036. [Google Scholar]
- Choi, E.-H. Crash Factors in Intersection-Related Crashes: An on-Scene Perspective; National Highway Traffic Safety Administration: Washington, DC, USA, 2010. [Google Scholar]
- Campbell, M.; Egerstedt, M.; How, J.P.; Murray, R.M. Autonomous Driving in Urban Environments: Approaches, Lessons and Challenges. Philos. Trans. R. Soc. A Math. Phys. Eng. Sci. 2010, 368, 4649–4672. [Google Scholar] [CrossRef]
- Achiri, A.T.; Mbue, I.N.; Merlin, A.; Gerard, A. Automobile Crash Investigation Based on Vehicle System Related Causes: Systematic Literature Review. World J. Eng. Technol. 2022, 10, 139–157. [Google Scholar] [CrossRef]
- Baradaran, H.; Bozorgvar, H.; Nourallahzadeh, Z.; Rasaizadi, A. Effectiveness of Flexible Working Hours on Traffic Index, a Case Study for Tehran. Adv. Res. Civ. Eng. 2023, 5, 56–69. [Google Scholar]
- Koźlak, A.; Wach, D. Causes of Traffic Congestion in Urban Areas. Case of Poland. In SHS Web of Conferences, Proceedings of the 10th Jubilee Scientific Conference–InfoGlob 2018, Gdansk, Poland, 18–20 September 2018; EDP Sciences: Les Ulis, France, 2018; Volume 57, p. 01019. [Google Scholar]
- El-Hansali, Y.; Farrag, S.; Yasar, A.; Malik, H.; Shakshuki, E.; Al-Abri, K. Assessment of the Traffic Enforcement Strategies Impact on Emission Reduction and Air Quality. Procedia Comput. Sci. 2021, 184, 549–556. [Google Scholar] [CrossRef]
- Ghodsi, M.; Ardestani, A.; Rasaizadi, A.; Ghadamgahi, S.; Yang, H. How COVID-19 Pandemic Affected Urban Trips? Structural Interpretive Model of Online Shopping and Passengers Trips during the Pandemic. Sustainability 2021, 13, 11995. [Google Scholar] [CrossRef]
- Jafari Shahdani, F.; Rasaizadi, A.; Seyedabrishami, S. The Interaction between Activity Choice and Duration: Application of Copula-Based and Nested-Logit Models. Sci. Iran. 2021, 28, 2037–2052. [Google Scholar] [CrossRef]
- Metz, D. Tackling Urban Traffic Congestion: The Experience of London, Stockholm and Singapore. Case Stud. Transp. Policy 2018, 6, 494–498. [Google Scholar] [CrossRef]
- Musselwhite, C.; Avineri, E.; Fulcher, E.; Susilo, Y.; Goodwin, P. Understanding Public Attitudes to Road User Safety; Department for Transport (DfT): London, UK, 2010; ISBN 1-84864-051-X. [Google Scholar]
- Seyedabrishami, S.; Izadi, A.R. A Copula-Based Joint Model to Capture the Interaction between Mode and Departure Time Choices in Urban Trips. Transp. Res. Procedia 2019, 41, 722–730. [Google Scholar] [CrossRef]
- Rasaizadi, A.; Kermanshah, M. Mode Choice and Number of Non-Work Stops during the Commute: Application of a Copula-Based Joint Model. Sci. Iran. 2018, 25, 1039–1047. [Google Scholar] [CrossRef]
- Dizaho, E.K.; Salleh, R.; Abdullah, A. Achieveing Work Life Balance Through Flexible Work Schedules and Arrangements. Glob. Bus. Manag. Res. 2017, 9, 455–465. [Google Scholar]
- Yu, R.; Burke, M.; Raad, N. Exploring Impact of Future Flexible Working Model Evolution on Urban Environment, Economy and Planning. J. Urban Manag. 2019, 8, 447–457. [Google Scholar] [CrossRef]
- Hostettler Macias, L.; Ravalet, E.; Rérat, P. Potential Rebound Effects of Teleworking on Residential and Daily Mobility. Geogr. Compass 2022, 16, e12657. [Google Scholar] [CrossRef]
- van der Loop, H.; Willigers, J.; Haaijer, R. Empirical Estimation of Effects of Flexible Working on Mobility and Congestion in the Netherlands 2000 to 2016. Transp. Res. Rec. 2019, 2673, 557–565. [Google Scholar] [CrossRef]
- van der Loop, H.; Haaijer, R.; Willigers, J. The Impact of Various Forms of Flexible Working on Mobility and Congestion Estimated Empirically. In Autonomous Vehicles and Future Mobility; Elsevier: Amsterdam, The Netherlands, 2019; pp. 125–139. [Google Scholar]
- Mutlu, Ö.; Durak, Z.; Akyer, H. Staggered Working Hours in Order to Reduce Traffic Congestion. Pamukkale Univ. J. Eng. Sci. -Pamukkale 2020, 26, 730–736. [Google Scholar] [CrossRef]
- Zong, F.; Juan, Z.; Jia, H. Examination of Staggered Shifts Impacts on Travel Behavior: A Case Study of Beijing, China. Transport 2013, 28, 175–185. [Google Scholar] [CrossRef]
- Huang, L.; Li, J. Applicability of Staggered Work Hours for Urban Traffic: Case of Guangzhou. In Proceedings of the ICTE 2011, Chengdu, China, 23–25 July 2011; pp. 404–409. [Google Scholar]
- Gatersleben, B.; Uzzell, D. Affective Appraisals of the Daily Commute: Comparing Perceptions of Drivers, Cyclists, Walkers, and Users of Public Transport. Environ. Behav. 2007, 39, 416–431. [Google Scholar] [CrossRef]
- Choo, S.; Mokhtarian, P.L.; Salomon, I. Does Telecommuting Reduce Vehicle-Miles Traveled? An Aggregate Time Series Analysis for the US. Transportation 2005, 32, 37–64. [Google Scholar] [CrossRef]
- Public Attitudes to Roads in England: Wave 1; Department for Transport: London, UK, 2015.
- Thorhauge, M.; Haustein, S.; Cherchi, E. Accounting for the Theory of Planned Behaviour in Departure Time Choice. Transp. Res. Part F Traffic Psychol. Behav. 2016, 38, 94–105. [Google Scholar] [CrossRef]
- Hendrickson, C.; Plank, E. The Flexibility of Departure Times for Work Trips. Transp. Res. Part A Gen. 1984, 18, 25–36. [Google Scholar] [CrossRef]
- Kroes, E.; Daly, A.; Gunn, H.; Van Der Hoorn, T. The Opening of the Amsterdam Ring Road: A Case Study on Short-Term Effects of Removing a Bottleneck. Transportation 1996, 23, 71–82. [Google Scholar] [CrossRef]
- Arellana, J.; Daly, A.; Hess, S.; de Dios Ortúzar, J.; Rizzi, L.I. Development of Surveys for Study of Departure Time Choice: Two-Stage Approach to Efficient Design. Transp. Res. Rec. 2012, 2303, 9–18. [Google Scholar] [CrossRef]
- Lizana, P.; Arellana, J.; Ortúzar, J.d.D.; Rizzi, L.I. Modelling Mode and Time-of-Day Choice with Joint RP and SC Data. In Proceedings of the International Choice Modelling Conference (ICMC), Sydney, Australia, 3–5 July 2013. [Google Scholar]
- Noland, R.B.; Polak, J.W. Travel Time Variability: A Review of Theoretical and Empirical Issues. Transp. Rev. 2002, 22, 39–54. [Google Scholar] [CrossRef]
- Fosgerau, M.; Fukuda, D. Valuing Travel Time Variability: Characteristics of the Travel Time Distribution on an Urban Road. Transp. Res. Part C Emerg. Technol. 2012, 24, 83–101. [Google Scholar] [CrossRef]
- Fujii, S.; Kitamura, R. Drivers’ Mental Representation of Travel Time and Departure Time Choice in Uncertain Traffic Network Conditions. Netw. Spat. Econ. 2004, 4, 243–256. [Google Scholar] [CrossRef]
- Su, Y.; Ghaderi, H.; Dia, H. The Role of Traffic Simulation in Shaping Effective and Sustainable Innovative Urban Delivery Interventions. EURO J. Transp. Logist. 2024, 13, 100130. [Google Scholar] [CrossRef]
- Hoogendoorn, S.P.; Bovy, P.H. State-of-the-Art of Vehicular Traffic Flow Modelling. Proc. Inst. Mech. Eng. Part I J. Syst. Control. Eng. 2001, 215, 283–303. [Google Scholar] [CrossRef]
- Taniguchi, E.; Thompson, R.G.; Yamada, T. Recent Trends and Innovations in Modelling City Logistics. Procedia-Soc. Behav. Sci. 2014, 125, 4–14. [Google Scholar] [CrossRef]
- Kokkinogenis, Z.; Passos, L.S.; Rossetti, R.; Gabriel, J. Towards the Next-Generation Traffic Simulation Tools: A First Evaluation. In Proceedings of the 6th Doctoral Symposium in Informatics Engineering, Porto, Portugal, 27–28 January 2011; FEUP, University of Porto: Porto, Portugal, 2011; pp. 77–90. [Google Scholar]
- Nguyen, J.; Powers, S.T.; Urquhart, N.; Farrenkopf, T.; Guckert, M. An Overview of Agent-Based Traffic Simulators. Transp. Res. Interdiscip. Perspect. 2021, 12, 100486. [Google Scholar] [CrossRef]
- Harantová, V.; Mazanec, J.; Štefancová, V.; Mašek, J.; Foltýnová, H.B. Two-Step Cluster Analysis of Passenger Mobility Segmentation during the COVID-19 Pandemic. Mathematics 2023, 11, 583. [Google Scholar] [CrossRef]
- Bachechi, C.; Po, L. Traffic Analysis in a Smart City. In Proceedings of the IEEE/WIC/ACM International Conference on Web Intelligence-Companion, Thessaloniki, Greece, 14–17 October 2019; Volume 2019, pp. 275–282. [Google Scholar]
- Ferrara, A.; Sacone, S.; Siri, S. Freeway Traffic Modelling and Control; Springer: Berlin/Heidelberg, Germany, 2018; Volume 585. [Google Scholar]
- Gnap, J.; Poliak, M.; Semanova, S. The Issue of a Transport Mode Choice from the Perspective of Enterprise Logistics. Open Eng. 2019, 9, 374–383. [Google Scholar] [CrossRef]
- Wang, X.; Kockelman, K.M. Forecasting Network Data: Spatial Interpolation of Traffic Counts from Texas Data. Transp. Res. Rec. 2009, 2105, 100–108. [Google Scholar] [CrossRef]
- Tryfona, N.; Jensen, C.S. Conceptual Data Modeling for Spatiotemporal Applications. GeoInformatica 1999, 3, 245–268. [Google Scholar] [CrossRef]
- Alghamdi, T.; Mostafi, S.; Abdelkader, G.; Elgazzar, K. A Comparative Study on Traffic Modeling Techniques for Predicting and Simulating Traffic Behavior. Future Internet 2022, 14, 294. [Google Scholar] [CrossRef]
- Mohan, R.; Eldhose, S.; Manoharan, G. Network-Level Heterogeneous Traffic Flow Modelling in VISSIM. Transp. Dev. Econ. 2021, 7, 8. [Google Scholar] [CrossRef]
- Casas, J.; Ferrer, J.L.; Garcia, D.; Perarnau, J.; Torday, A. Traffic Simulation with Aimsun. In Fundamentals of Traffic Simulation; Springer: New York, NY, USA, 2010; pp. 173–232. [Google Scholar]
- Boxill, S.A.; Yu, L. An Evaluation of Traffic Simulation Models for Supporting Its Development; Centre for Transportation Training and Research, Texas Southern University: Houston, TX, USA, 2000. [Google Scholar]
- Barceló, J. Fundamentals of Traffic Simulation; Springer: Berlin/Heidelberg, Germany, 2010; Volume 145. [Google Scholar]
- Jones, S.L.; Sullivan, A.J.; Cheekoti, N.; Anderson, M.D.; Malave, D. Traffic Simulation Software Comparison Study. UTCA Rep. 2004, 2217, 1–58. [Google Scholar]
- Ronaldo, A. Comparison of the Two Micro-Simulation Software Aimsun & Sumo for Highway Traffic Modelling. 2012. Available online: http://liu.diva-portal.org/smash/get/diva2:555913/FULLTEXT01.pdf (accessed on 11 July 2024).
- Mintsis, E.; Belibassakis, M.; Mintsis, G.; Basbas, S.; Pitsiava-Latinopoulou, M. The Use of a Transport Simulation Model (AIMSUN) to Determine the Environmental Effects of Pedestrianization and Traffic Management in the Center of Thessaloniki. Eur. J. Environ. Sci. 2016, 6, 25–29. [Google Scholar]
- Google Distance Matrix API Overview. Available online: https://developers.google.com/maps/documentation/distance-matrix/overview (accessed on 27 August 2024).
- Mapy.cz: Satellite Images. Available online: https://www.mapy.cz (accessed on 20 June 2024).
- Rezzouqi, H.; Gryech, I.; Sbihi, N.; Ghogho, M.; Benbrahim, H. Analyzing the Accuracy of Historical Average for Urban Traffic Forecasting Using Google Maps. In Intelligent Systems and Applications, Proceedings of the 2018 Intelligent Systems Conference (IntelliSys) Volume 1; Springer: Berlin/Heidelberg, Germany, 2019; pp. 1145–1156. [Google Scholar]
- Geoportál. Ortofotomozaika SR. Available online: http://www.geoportal.sk/sk/zbgis/ortofotomozaika/ (accessed on 11 July 2024).
- Slovak Road Administration: Technical Conditions TP 102 Calculation of Road Traffic Capacities. Available online: https://www.ssc.sk/files/documents/technicke-predpisy/tp/tp_102.pdf (accessed on 20 June 2024).
- Soga, L.R.; Bolade-Ogunfodun, Y.; Mariani, M.; Nasr, R.; Laker, B. Unmasking the Other Face of Flexible Working Practices: A Systematic Literature Review. J. Bus. Res. 2022, 142, 648–662. [Google Scholar] [CrossRef]
- Chung, H.; Birkett, H.; Forbes, S.; Seo, H. Covid-19, Flexible Working, and Implications for Gender Equality in the United Kingdom. Gend. Soc. 2021, 35, 218–232. [Google Scholar] [CrossRef]
Disclaimer/Publisher’s Note: The statements, opinions and data contained in all publications are solely those of the individual author(s) and contributor(s) and not of MDPI and/or the editor(s). MDPI and/or the editor(s) disclaim responsibility for any injury to people or property resulting from any ideas, methods, instructions or products referred to in the content. |
© 2024 by the authors. Licensee MDPI, Basel, Switzerland. This article is an open access article distributed under the terms and conditions of the Creative Commons Attribution (CC BY) license (https://creativecommons.org/licenses/by/4.0/).