Abstract
This study presents a unique model for assessing the dependability of continuous parts of combined systems in open-pit mining through the application of fuzzy logic. Continuous sub-systems as part of the combined system of coal exploitation in surface mines have the basic function of ensuring safe operation, high capacity with high reliability, and low costs. These subsystems are usually part of the thermal power plant’s coal supply system and ensure stable fuel supply. The model integrates various independent partial indicators of dependability into an expert system specifically designed for evaluating these systems. It deconstructs the complex parameter of system dependability into distinct partial indicators: reliability, maintainability, and logistical support. These indicators are then integrated using fuzzy composition (max-min composition). Historical data from 2018 to 2023 are utilized alongside the fuzzy model to provide a retrospective analysis of system dependability, serving to validate the model’s effectiveness. What sets this model apart from conventional approaches is its consideration of practical dependability indicators, thereby obviating the need for extensive long-term monitoring and data collection to portray the system’s status accurately over time. This model serves as a valuable tool for assisting decision-makers in open-pit mining operations, facilitating planning, exploitation control, and the selection of maintenance strategies to ensure consistent production and cost reduction. Designed for quick assessment, the model relies on expert judgments and assessments to determine system dependability efficiently.
1. Introduction
Mining operations, crucial to numerous economies worldwide, are undergoing a transformative phase, marked by heightened environmental concerns, technological advancements, and a growing emphasis on operational efficiency [1,2]. These operations include a wide range of activities, from excavation and material extraction to transportation and processing. Within the complex structure of mining activities, transport systems are one of the key components, enabling the smooth movement of materials across large mining sites [3].
Material transportation is a critical aspect of mining operations, significantly influencing costs, efficiency, safety, and environmental impact [4,5]. Considering that loading and transportation costs amount to 60% of the total operating costs, it is essential that these systems are efficient and reliable [6]. The environmental footprint of traditional diesel-powered transport methods necessitates research into sustainable alternatives such as electric and autonomous vehicles [7,8]. Moreover, safety and risk management are paramount, with advanced technologies such as automation and real-time monitoring offering new opportunities for optimizing transport routes and enhancing decision-making [9]. Given the complex and variable conditions of mining environments, tailored solutions are essential, making continuous research in this area crucial for achieving greater sustainability, operational excellence, and economic viability in the mining industry.
Various methods and models are used for the purposes of this research in the field of mining, which provide the possibility of dealing with the complex and changing conditions of the mining environment. One of the most widely applied mathematical approaches is the theory of fuzzy sets, which is suitable for the analysis of processes in which uncertainty, ambiguity, subjectivity, and indeterminacy prevail [10].
The application of this method enables the aforementioned problem to be successfully analyzed, and the analysis results reflect the previous expert experiences and results of experimental measurements in a good way. To assess the success of using this method, prior knowledge of the behavior of the analyzed systems and processes is necessary. By comparing the experience and experimental data with the analysis results of the fuzzy logic method, its verification is carried out. Below is an overview of works with the application of fuzzy logic in mining and similar topics.
The largest number of studies is related to the field of mechanization in mining, where fuzzy logic was used to evaluate the performance of mining equipment under different operating conditions. The approach takes into account multiple criteria such as reliability, efficiency, and maintenance costs [10,11,12,13,14,15,16]. For example, the dependability of bucket wheel excavators, which are complex hierarchical systems, has been analyzed using fuzzy sets to synthesize information from the component level to the entire system, applying evident reasoning theory [17]. This mathematical approach has also found application in various parts of the production process in surface and underground mines, where processes such as loading, transportation, drilling, and blasting are adequately optimized [18,19,20,21,22]. The scientific literature also highlights the pervasive nature of risk in mining operations [23,24,25,26,27,28], emphasizing the need for robust risk management strategies to mitigate the impact of potential failures, where risk assessment methodologies such as failure mode and effects analysis (FMEA) and risk priority number (RPN) calculations are used very effectively in combination with fuzzy logic [29]. New approaches for assessing maintenance support and integrating it into the dependability concept have been developed, with fuzzy algebra playing a key role in this process. This involves using fuzzy composition to incorporate maintenance support into dependability, alongside the fuzzification of probability functions related to reliability and maintainability [30]. Fuzzy logic can also be applied to analyze environmental data collected from mining sites to assess the impact of mining activities on air and water quality, soil stability, and biodiversity. This information can help in developing strategies to minimize environmental degradation and comply with regulatory requirements [31,32,33].
When it comes to transport systems, the evolution of mining practices has witnessed a change that has entailed the adoption of continuous haulage systems, marking a departure from conventional discontinuous methods. While traditional transportation systems that rely on trucks and loaders still predominate in certain contexts, the advent of continuous systems ushered in a new era of efficiency and productivity. Continuous conveyor systems, characterized by crushers, conveyor belts, and integrated automation technologies, offer countless advantages over discontinuous technologies [34]. A fuzzy approach to dependability performance evaluation allows for the analysis of technical systems from multiple perspectives, including design, construction, maintenance, and logistics. This approach is particularly useful when available data are limited to expert judgments, as demonstrated in the dependability analysis of mechanical systems within bucket wheel excavators [35].
Given the evolving challenges of environmental sustainability, safety, and cost optimization, the role of continuous transport systems is gaining increasing importance in mining operations. These systems, characterized by their ability to operate 24/7 without interruption, offer a path towards sustainable and responsible mining practices. By minimizing energy consumption, reducing carbon emissions, and increasing worker safety, continuous transport systems support transformative changes in the mining industry [4].
Scientific articles in areas of maintainability and reliability engineering are very current [16,36,37,38,39,40,41,42,43].
The continuous part of the combined system is used at the coal open pit Gacko, Republic Srpska, Bosnia and Herzegovina. This paper presents a model that predicts the dependability of the continuous part of the combined system (CCS system) at the open pit Gacko applying the fuzzy theory. More precisely, this paper deals with the development of a model for predicting the dependability of the continuous part of the combined system at the open pit using the max-min composition. The basic idea of this paper is an expert assessment of partial indicators that affect the dependability and their synergy in order to determine the dependability of the CCS systems with the help of fuzzy models. In addition to the fuzzy model, a historical overview (period 2018–2023) of data related to the dependability of these systems is given. These historical data served to verify the fuzzy model.
2. Case Study: Open Pit Gacko, Continuous Parts of the Combined System
The lignite basin Gacko is located in the north-eastern part of Herzegovina, a region of Bosnia and Herzegovina, and has an area of about 30 km2. It is divided into four exploitation fields: Western, Central, Eastern, and Southern. Coal mining in this basin began in 1954, with a smaller capacity, and since 1982, with a capacity of 1.8 Mt/year for the needs of the power plant. Coal production currently takes place with a capacity of 2.3 Mt/year. Exploitation has been completed in West Field, it is currently taking place in Central and South, and it is planned to continue in East Field. The coal mining system is combined with hydraulic bucket excavators, with a bucket volume of 4–6 m3, truck transportation to the crusher, with a load capacity of 110 t, and further transport with belt conveyors. Two continuous systems with rotary excavators with a theoretical capacity of 1600 m3/h and suitable belt conveyors and spreaders are engaged in the excavation of the overburden. In addition to continuous systems, hydraulic excavators, buckets with a bucket volume of 10–12 m3, trucks with a load capacity of 110 t, a crusher with a theoretical capacity of 2000 m3/h, appropriate conveyors, and a spreader within the combined system are engaged in the excavation of overburden. The geological structure of the deposits and the great variety of mining equipment make exploitation conditions more complex.
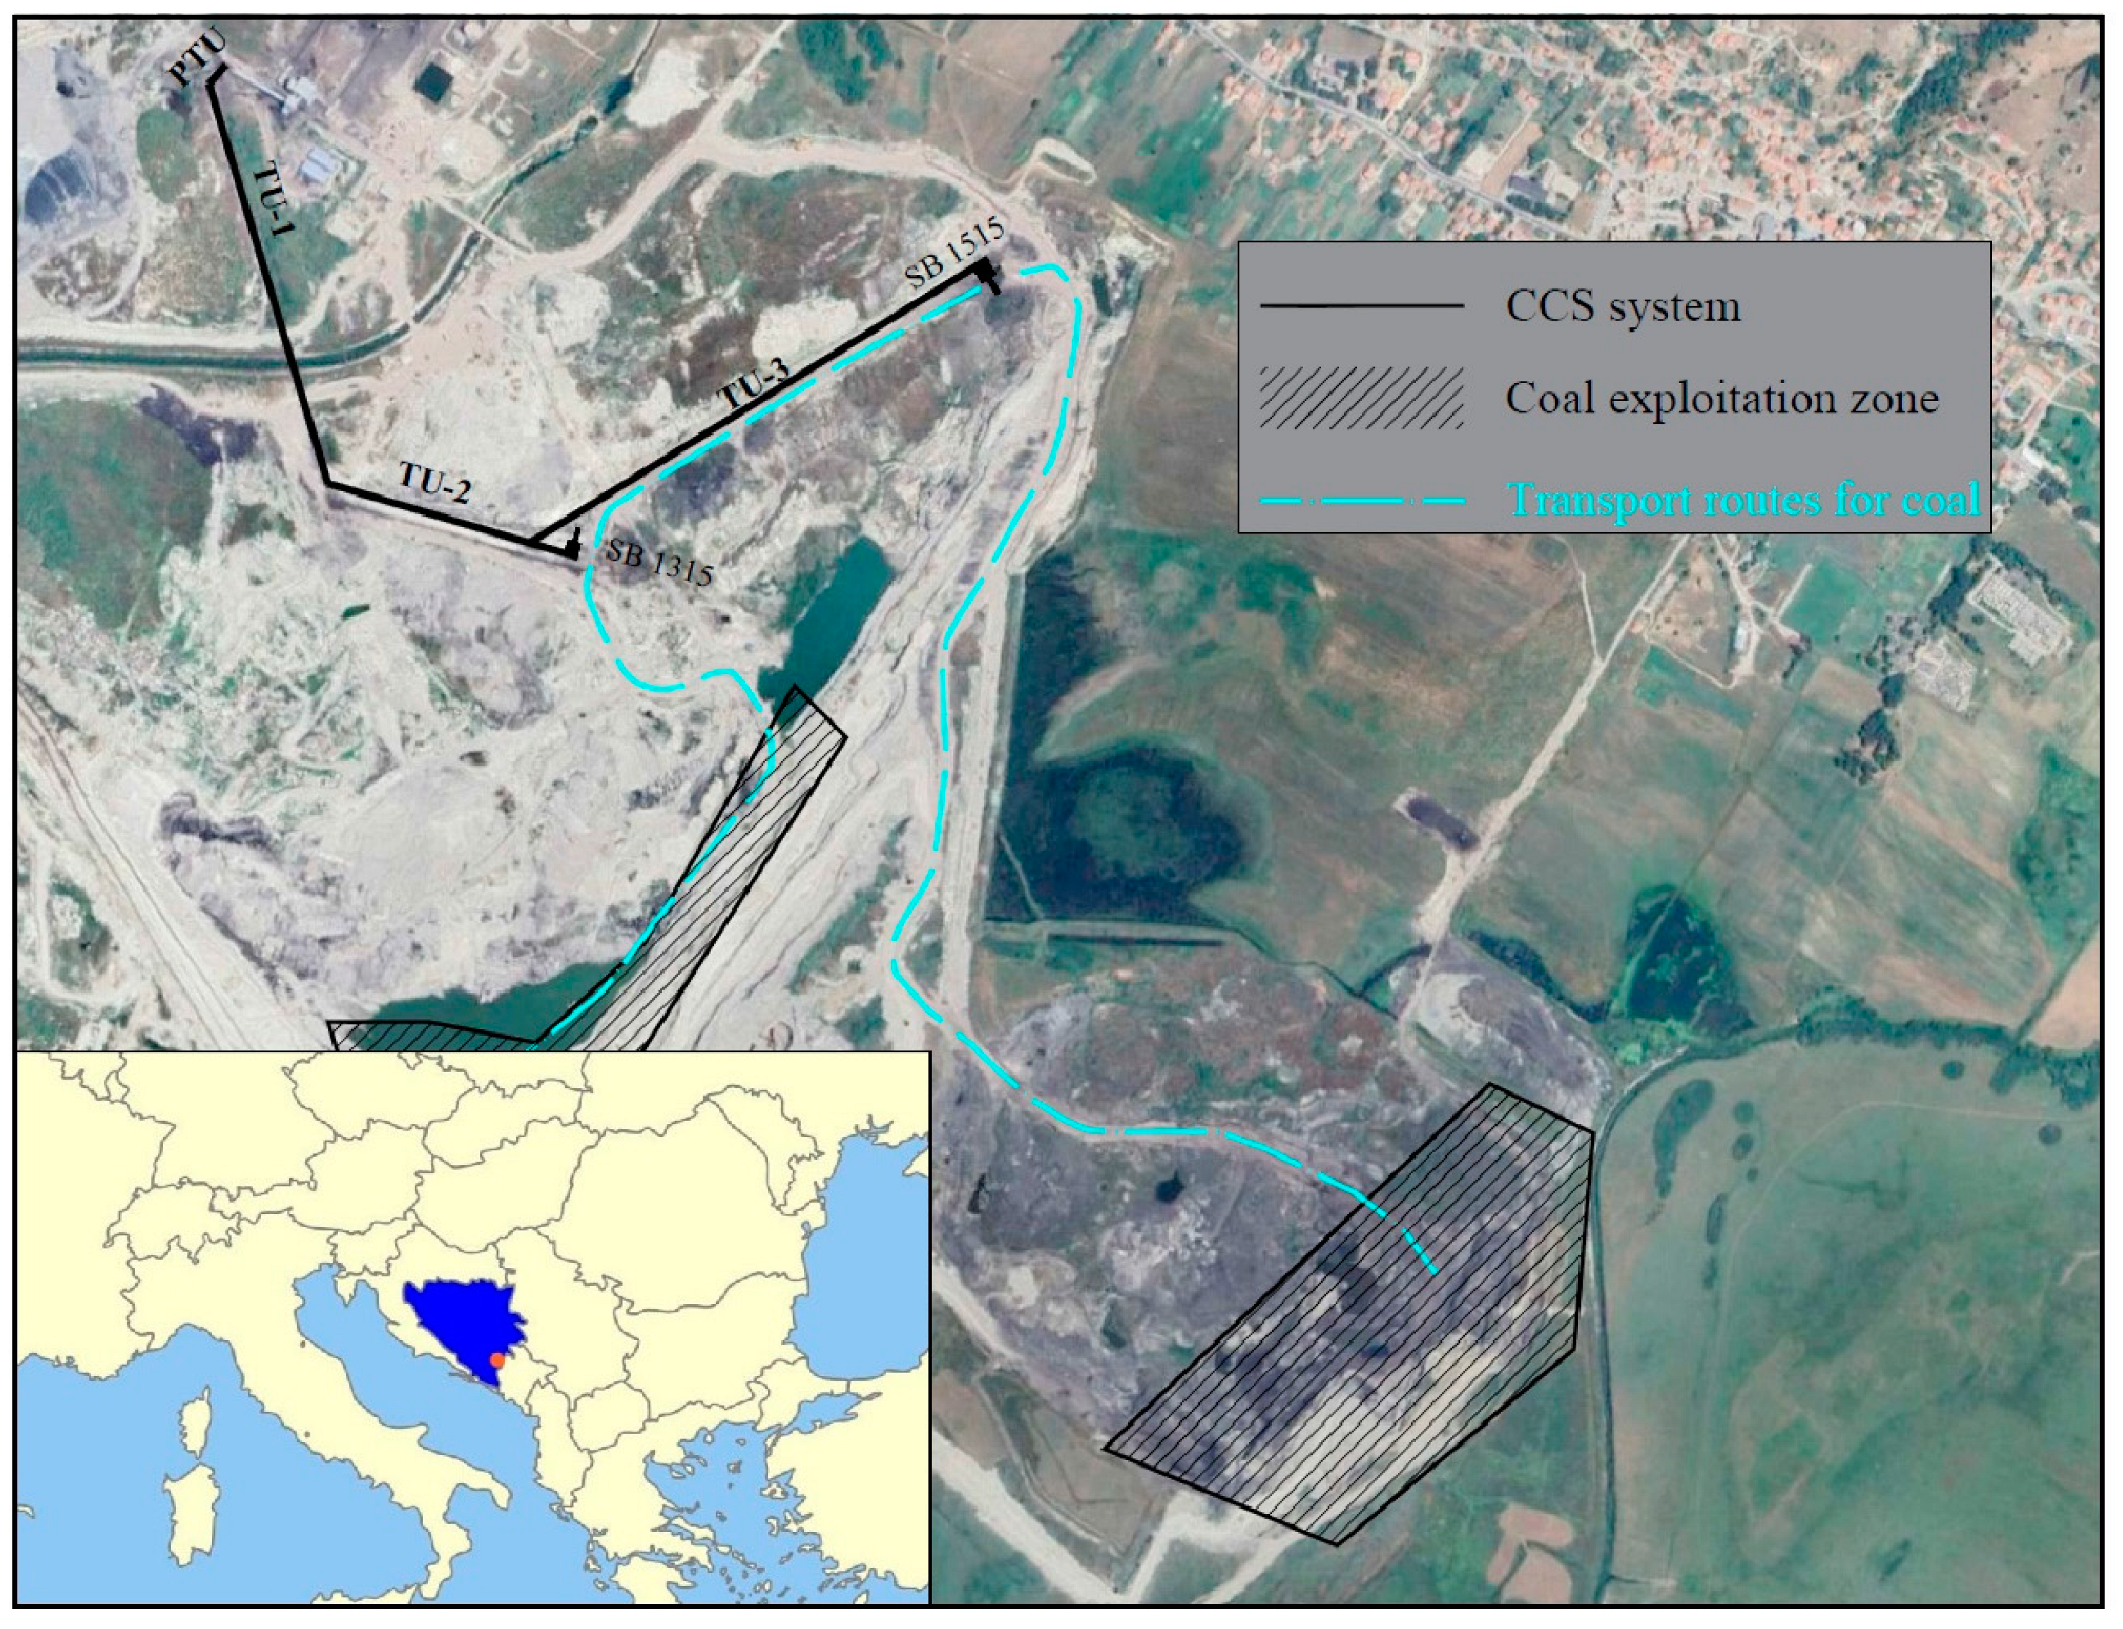
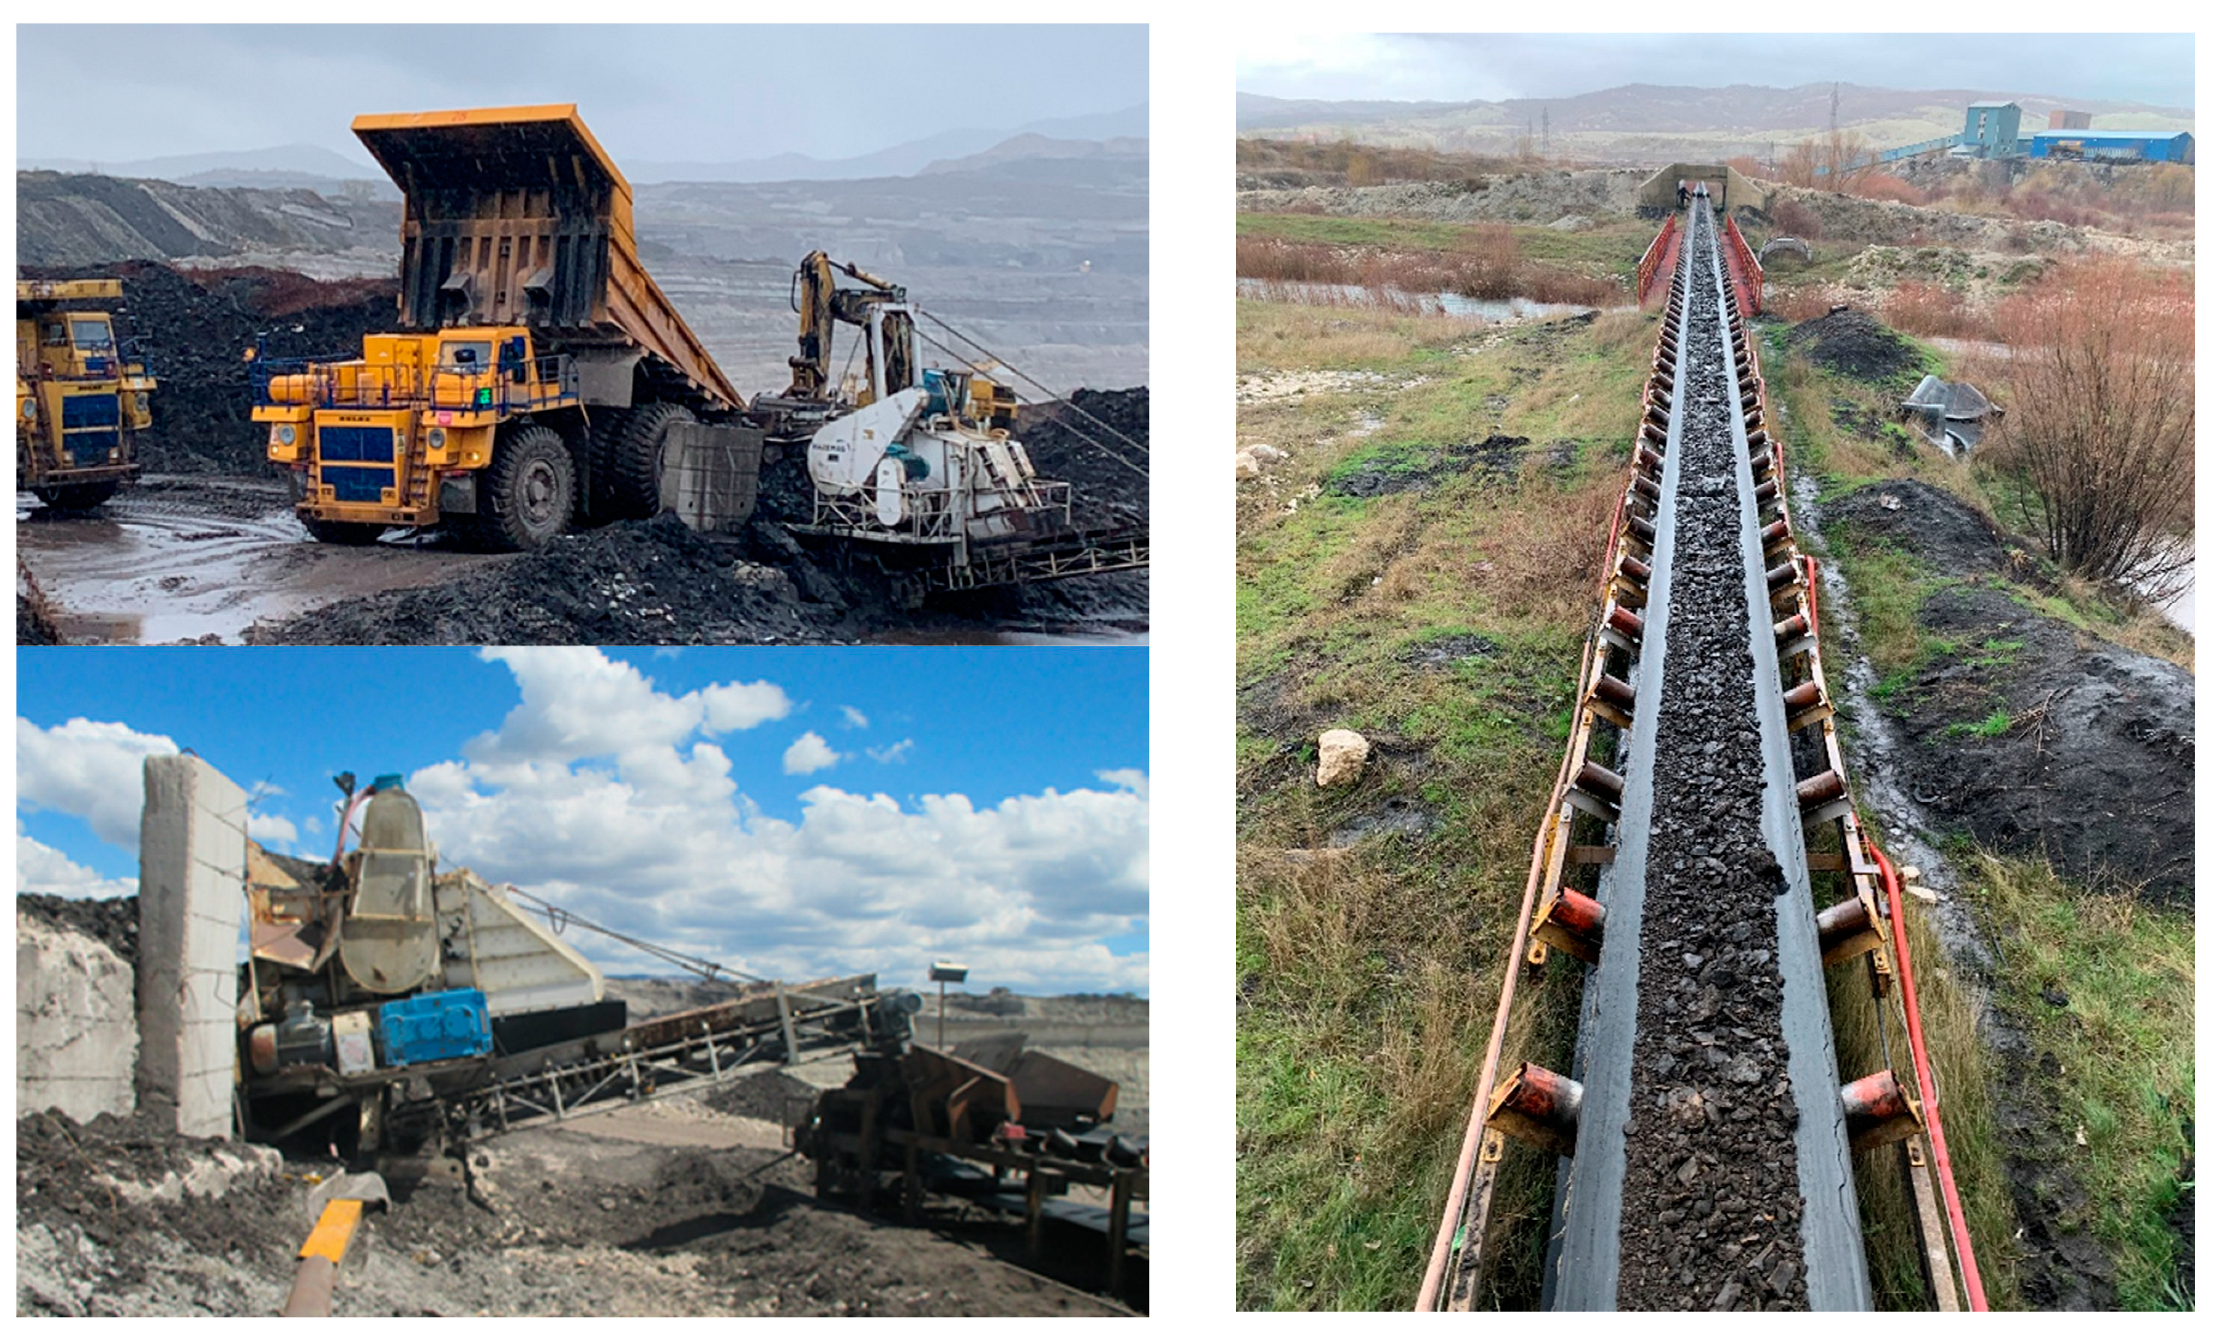
The CCS system (crusher-belt conveyors-landfill) consists of two semi-mobile primary crushers, SB 1315 and SB 1515, and belt conveyors TU-3, TU-2, TU-1, and PTU. Coal brought by truck to the SB 1515 crusher is directly shaken onto the same rake, and that brought to the SB 1315 crusher is deposited at the landfill and dosed to the rake using a loader where, after crushing and pulverization by the conveyor system, it is handed over to the power plant. Figure 1 shows the position of the CCS system at the open pit Gacko. Figure 2 shows a view of the open pit Gacko.

Figure 1.
View of the CCS system and position of open pit Gacko (Source: Google Earth, https://philarcher.org/diary/2013/euromap/, accessed on 10 July 2024).
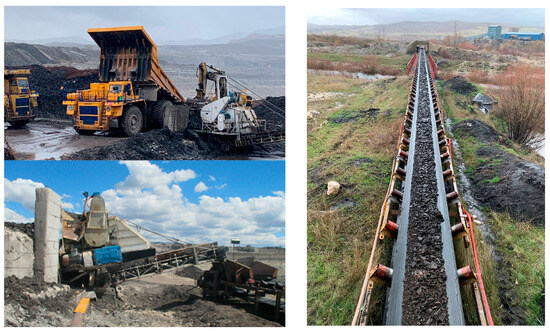
Figure 2.
Gacko open pit (photographed by the author of the article: N.S.).
3. Methodology
3.1. Dependability
Dependability is a common term used to describe the availability and factors affecting reliability, maintainability, and the level of maintainability [44,45]. The term availability is commonly used as a measure of operational safety [44,46]. The availability is expressed in quantitative indicators and, as such, represents a measure of operational safety and thus a measure of quality in use [47]. The performance of availability has a decisive effect on operational safety and quality in use due to the well-known fact that the machine should first of all be available for work, in order to realize the other performances as well [44,47].
Dependability is a complex function that depends on the following performances [48]:
- performances of reliability;
- performances of maintainability;
- performances of logistic support for maintenance.
Operational safety: “A collective term used to describe the availability performance and factors that determine these performances: reliability performances, maintainability performances, and logistics support performances” [37].
The dependability of technical systems is conceptually stipulated by ISO-IEC standards [49,50].
3.2. Development Fuzzy Model
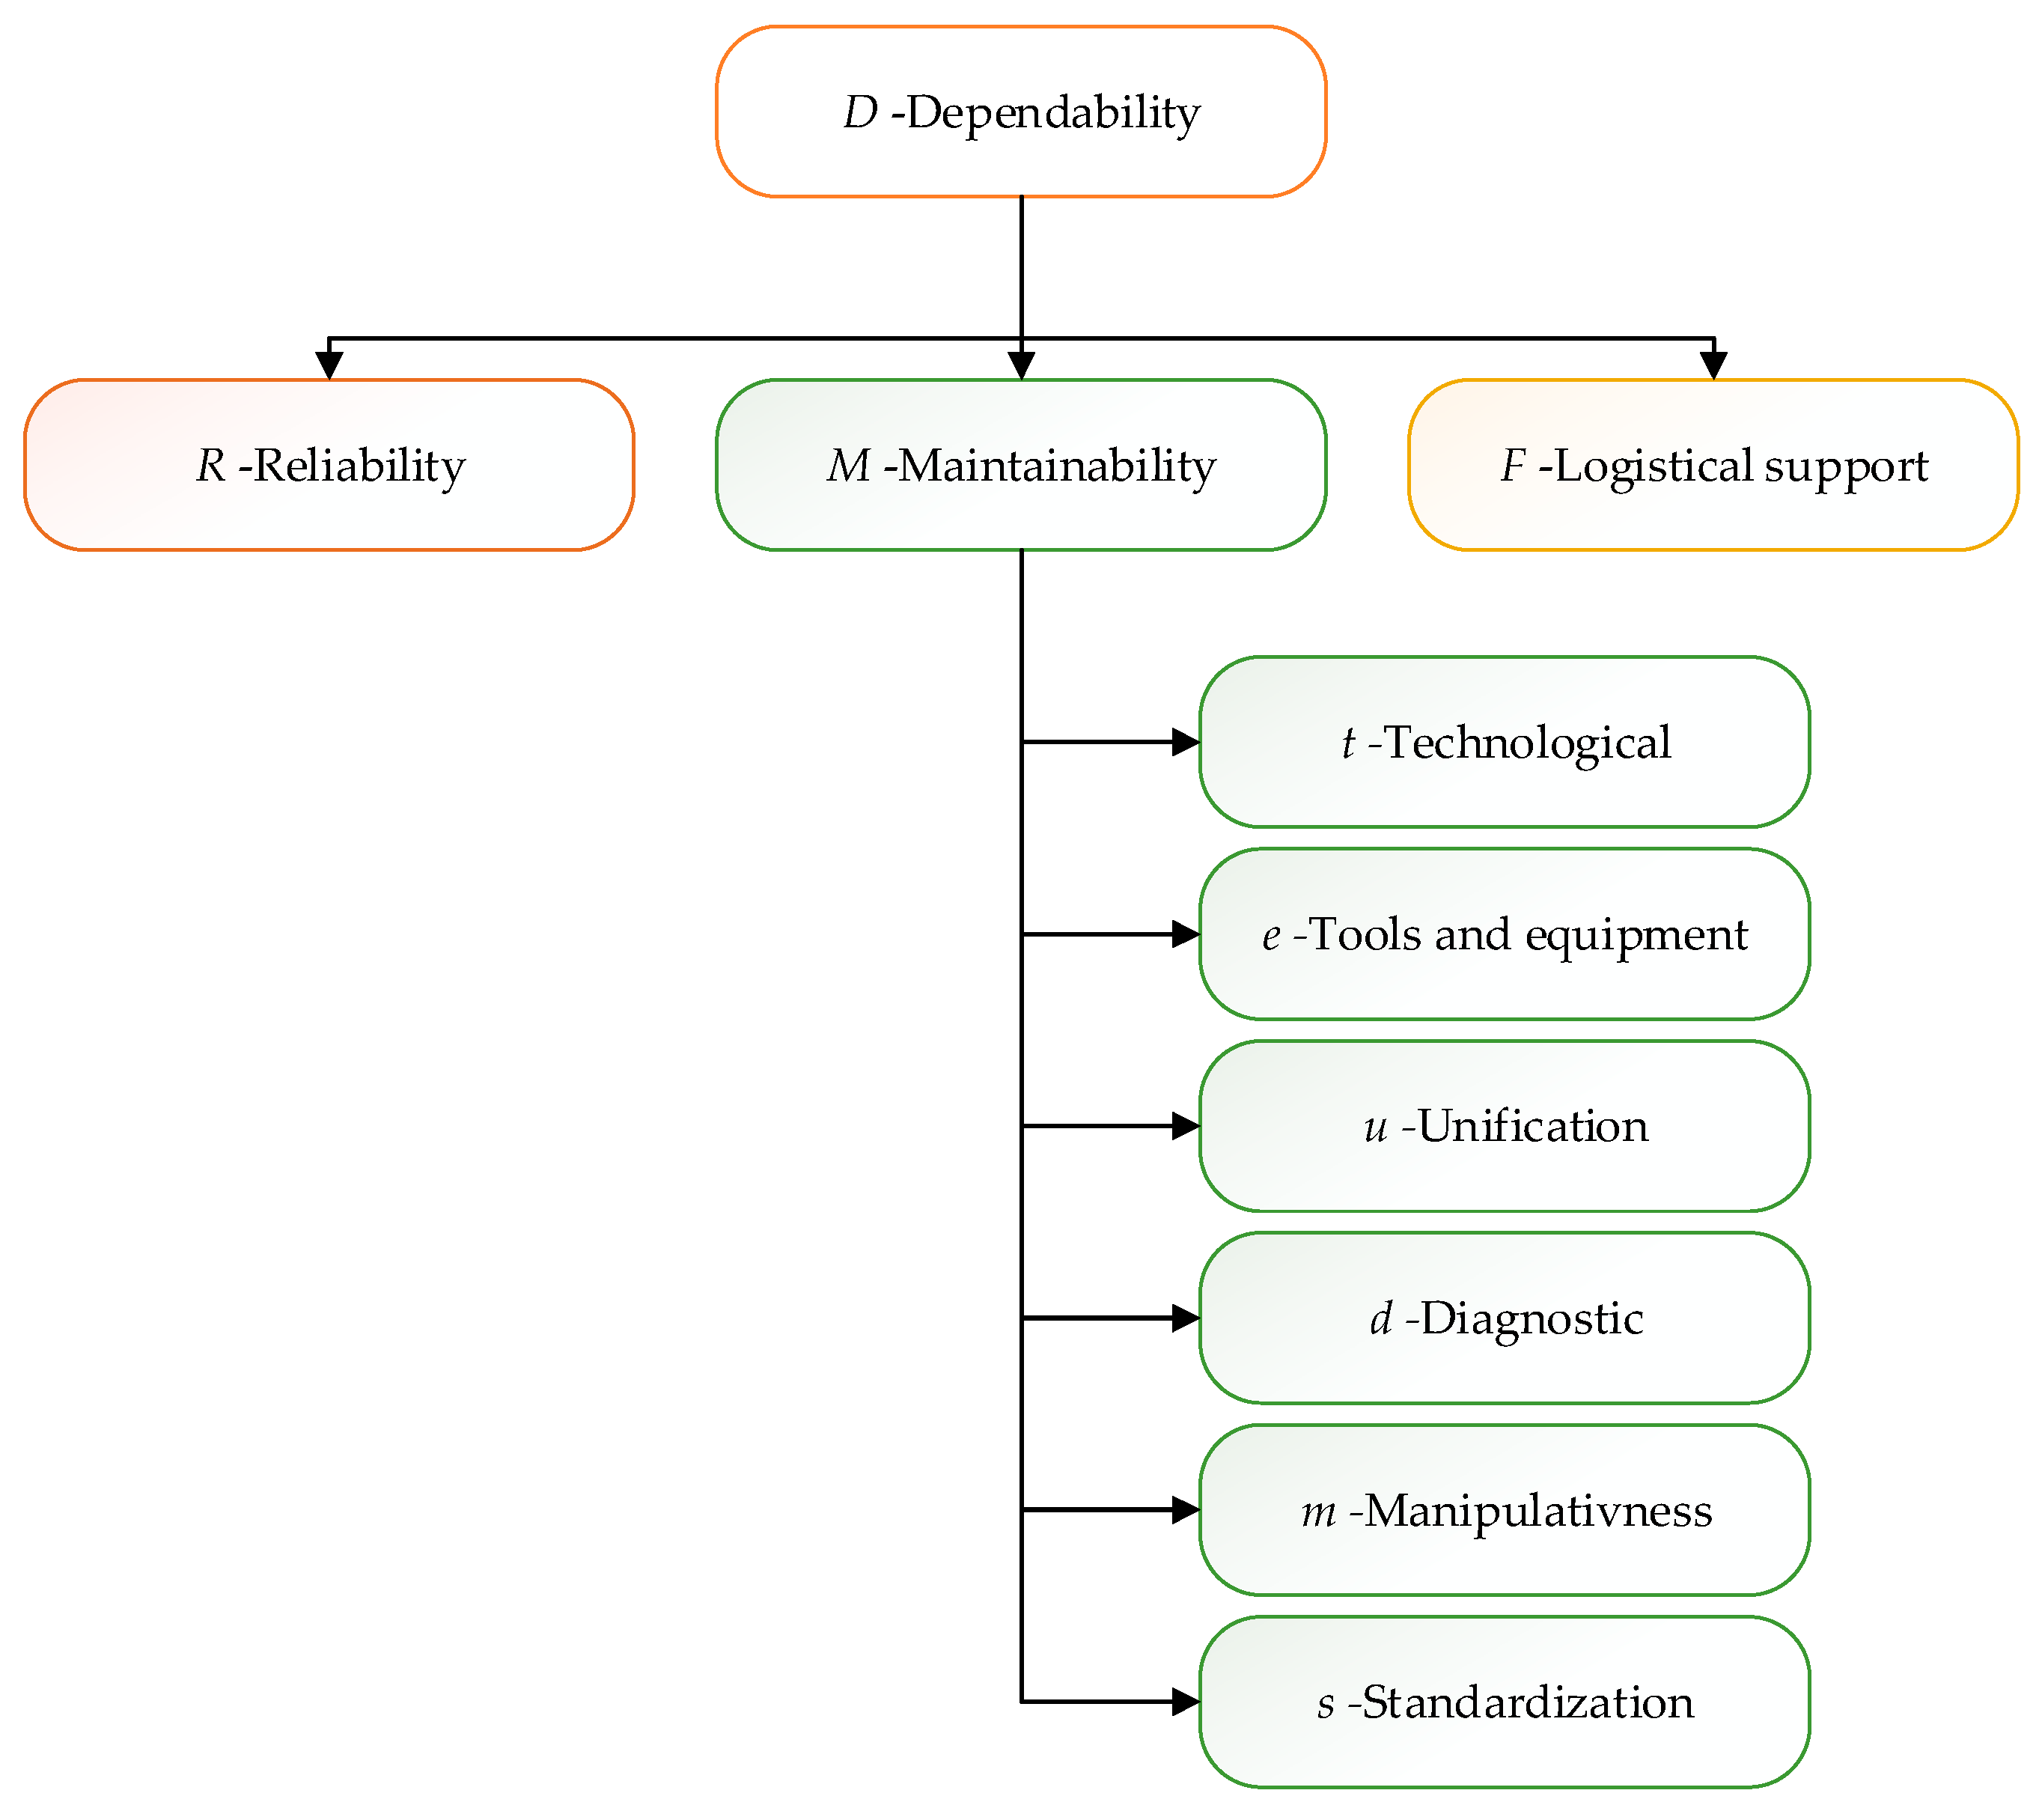
The model for determining dependability will be presented through a hierarchical structure consisting of synthetic and partial indicators. In this sense, dependability () will be defined through partial indicators that are classified in the domain of reliability () and the domain of maintenance convenience () and logistical support (), where the specified domains are synthetic indicators. Partial indicators of dependability are shown in Figure 3 and should include most of the phenomena and influential factors that lead to failure of the observed system.
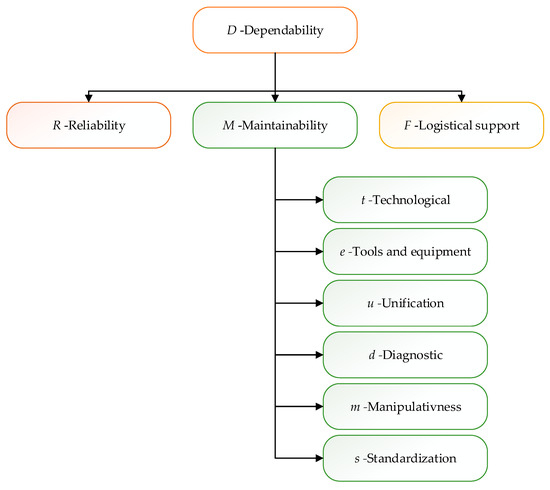
Figure 3.
Presentation of partial indicators of dependability.
The first step when creating a fuzzy model is the definition of linguistic variables that refer to the partial indicators of dependability, namely:
Reliability represents the probability, at a certain level of confidence, that the system (machine) will successfully perform the function for which it is intended, without failure and within the specified performance limits, taking into account the previous time of system use, during the specified duration of a task. When it is used in the prescribed manner and for the purpose for which it is intended, under the specified load levels [11].
Maintainability, as a set of structural characteristics that affect the time to eliminate failures or the time of performing other maintenance procedures, is an internal property of the observed technical system; therefore, it is called structural maintainability. The following parameters affect the maintainability: t—technology, e—tools and equipment, u—unification, d—diagnostics, m—manipulativeness, s—standardization [11,51].
For the technical system to successfully perform the set tasks, it is necessary to provide logistical support and numerous conditions. The logistic support combines the management process with appropriate technical measures to define the necessary support and create conditions for the realization of the given function of the technical system goal.
Logistical support performances according to the ISO-IEC Standard are defined as: “The ability of maintenance system, i.e., the organization that performs maintenance, to provide under given conditions the required maintenance of the technical system in accordance with the maintenance policy” [48,49], the Standards of the IEC 300 series deal with the concept of logistic support for maintenance [50].
In terms of the number of linguistic variables, it can be inferred that seven is the maximum count of variables that a person can rationally recognize simultaneously while retaining the same meaning [52].
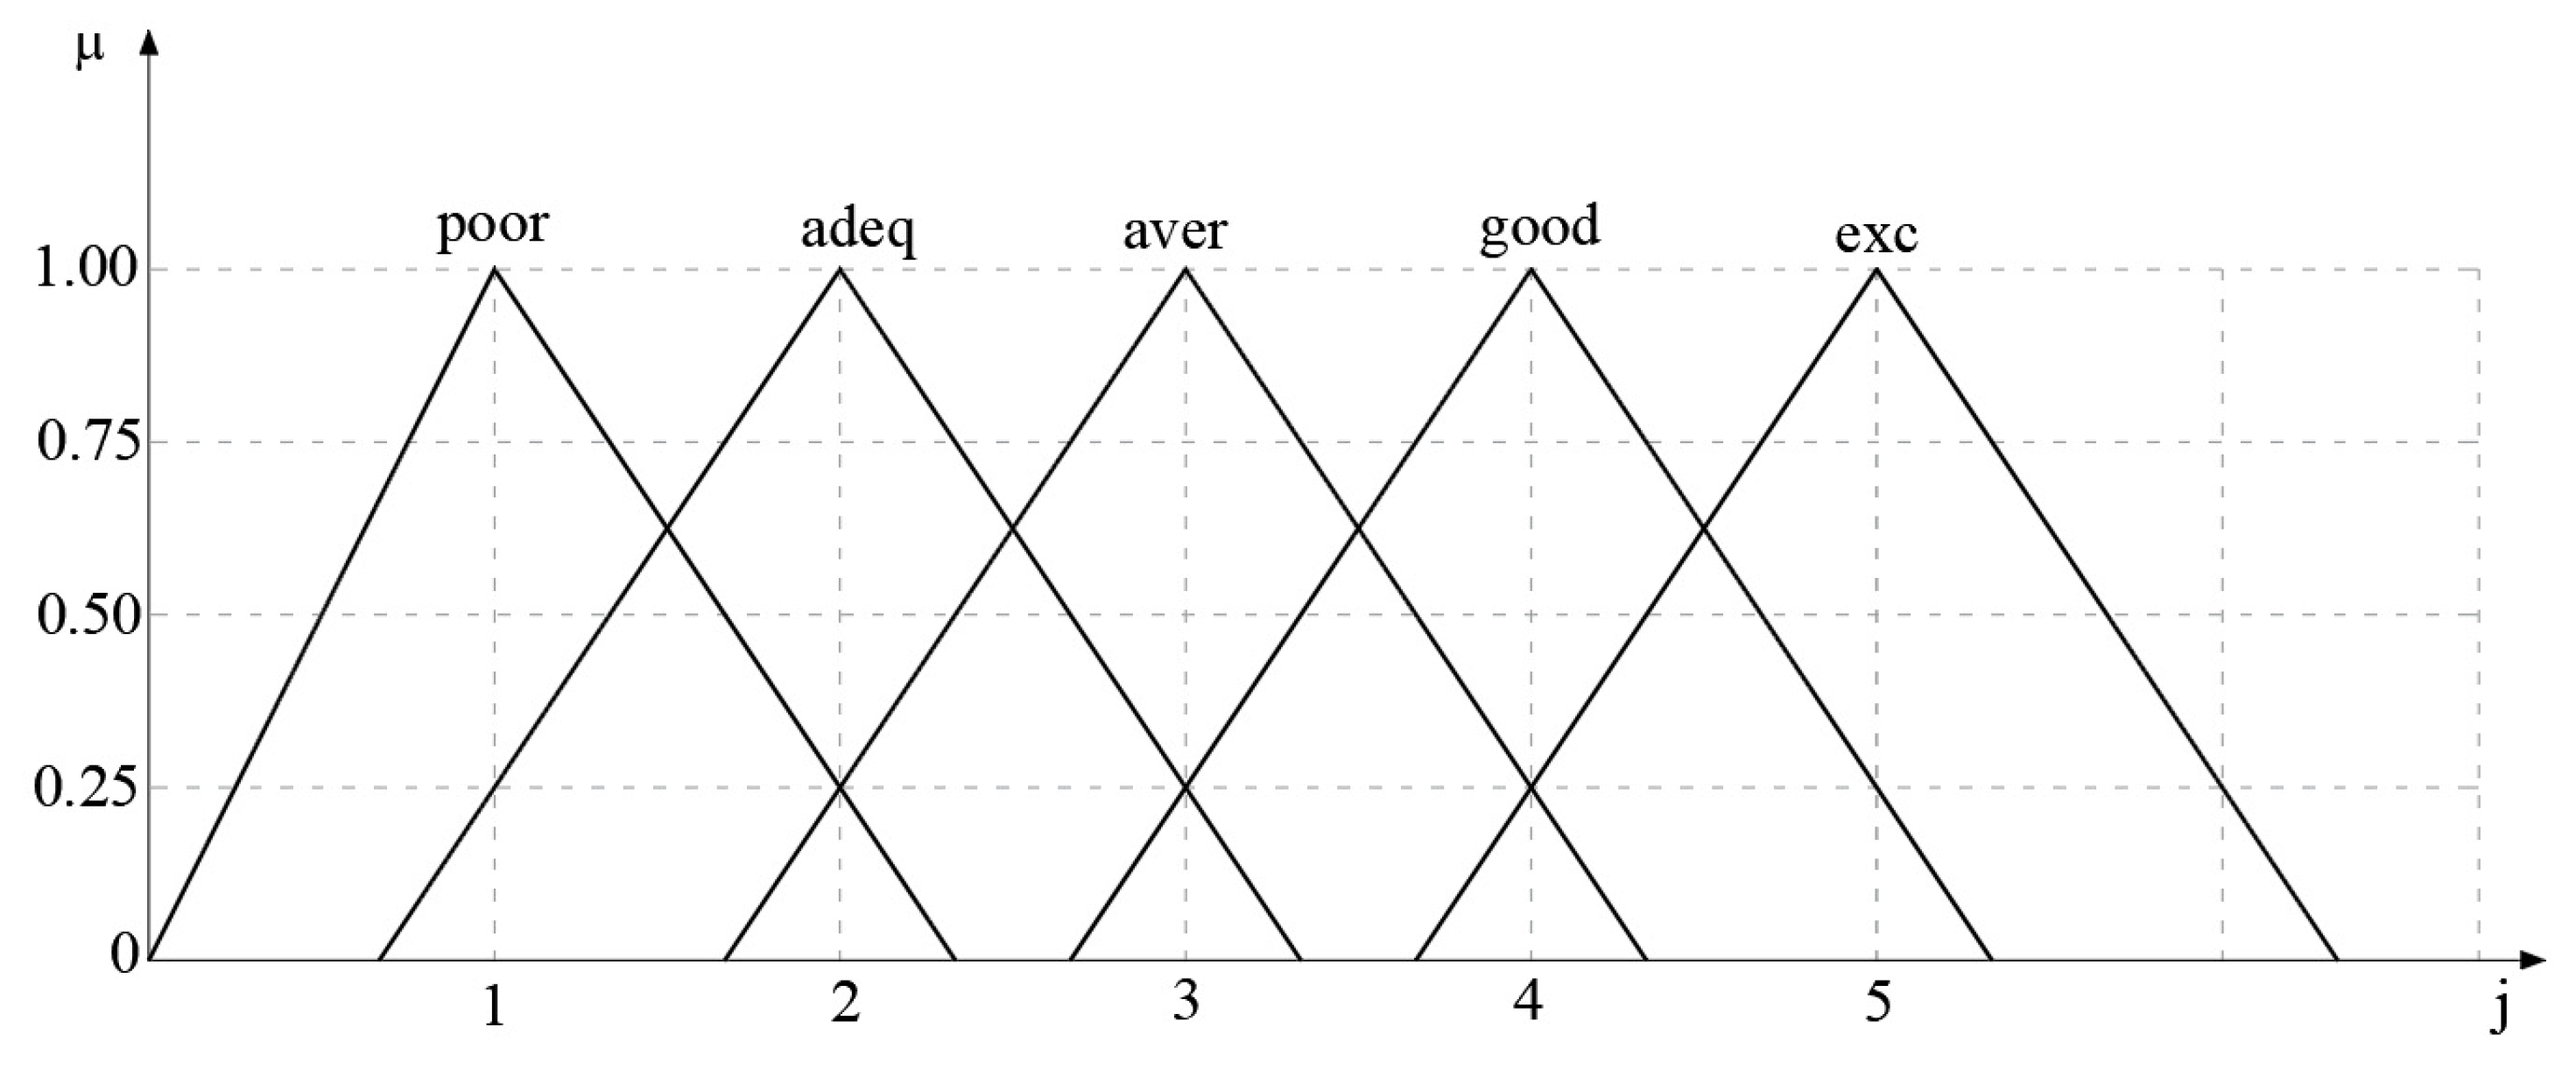
Taking this statement into account, the five ratings (linguistic variables), defined as follows: excellent (exc), good (good), average (aver), adequate (adeq), and poor (poor), will be considered in this paper. Linguistic variables (ratings) are given in the form of triangular fuzzy numbers, and their graphic representation are presented in the following Figure 4 and Figure 5.
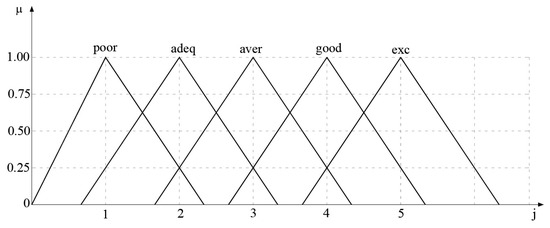
Figure 4.
Fuzzy sets.
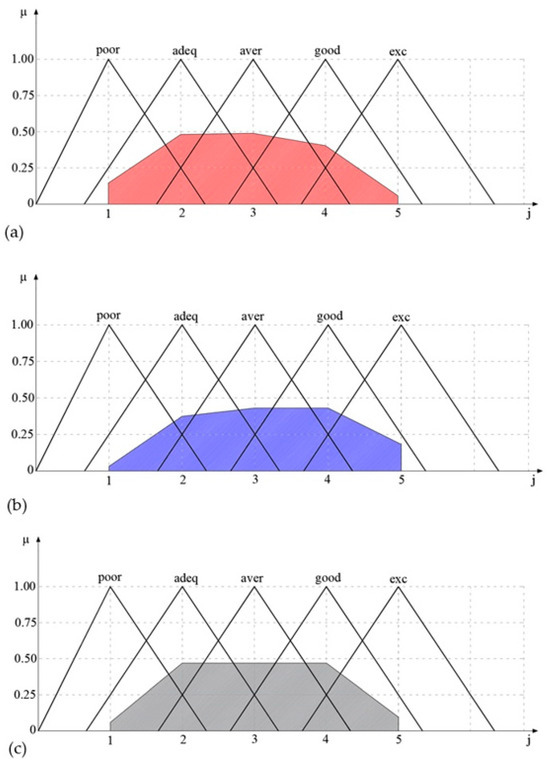
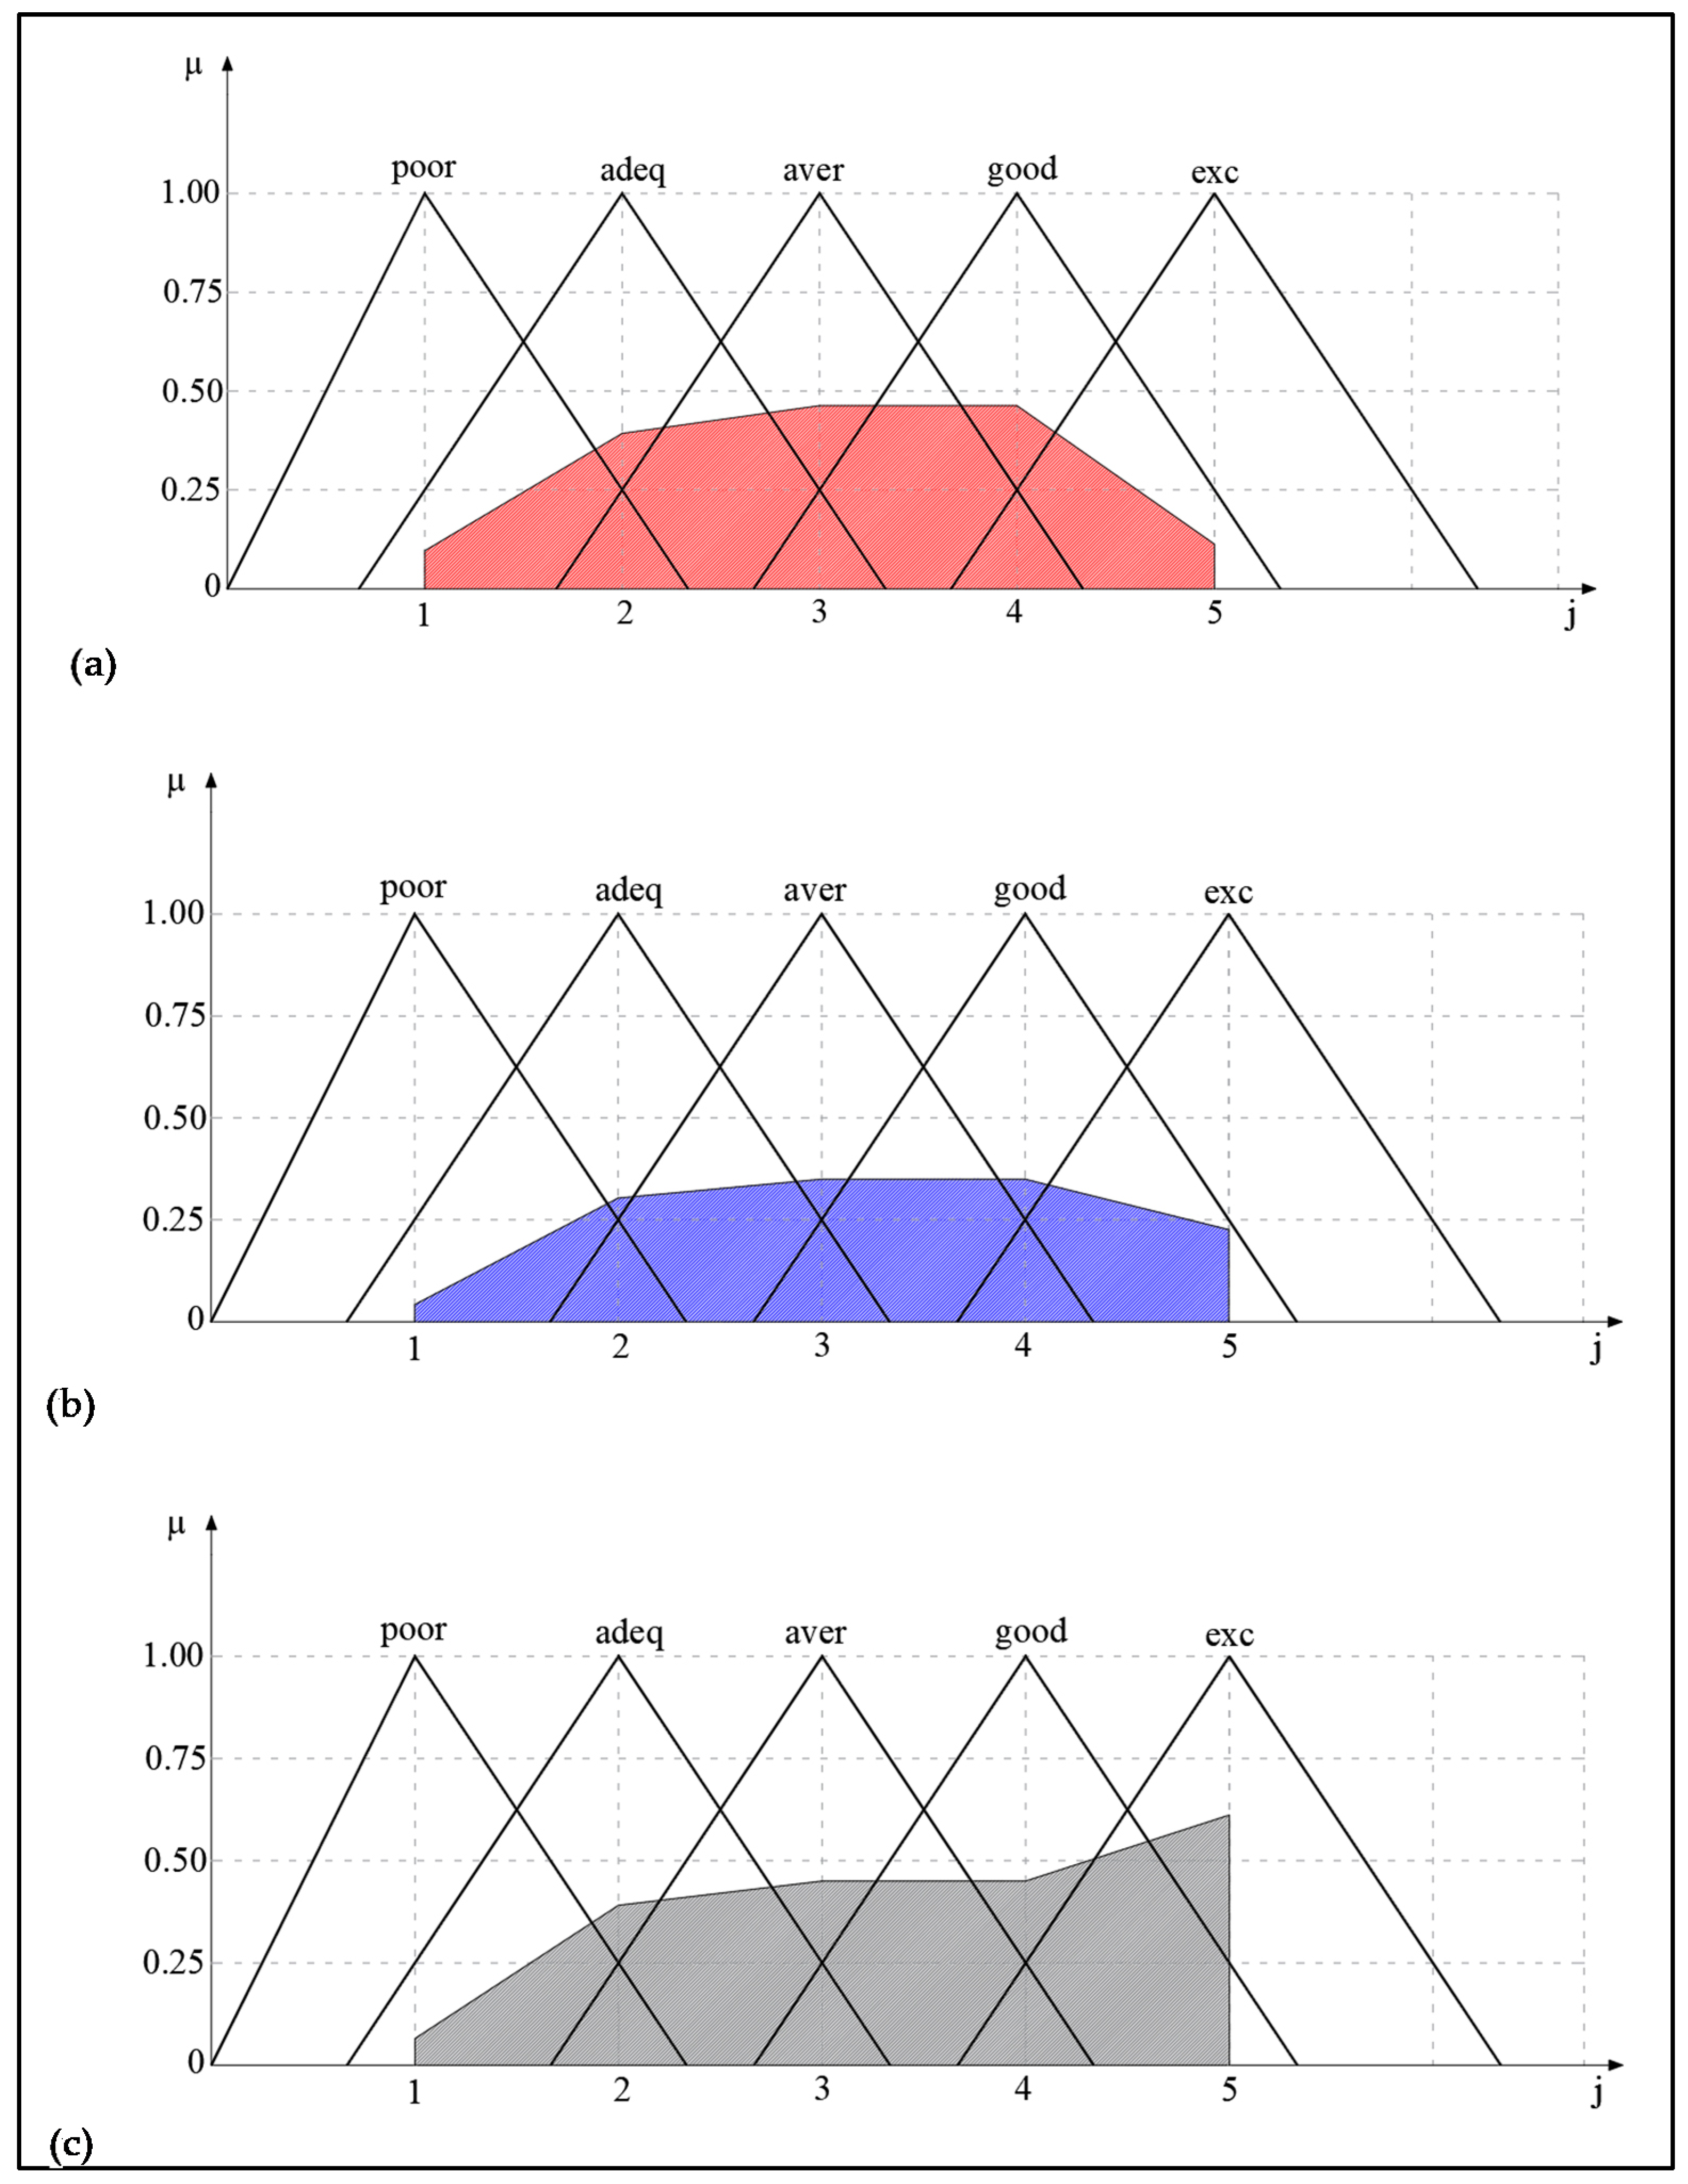
Figure 5.
Distribution of output values for indicator M maintainability for the CCS system, Crusher SB 1515 (a), Crusher SB 1315 (b), and belt conveyors (c) using max-min composition.
Corresponding fuzzy numbers of the mentioned linguistic variables are defined by (according to Figure 6):
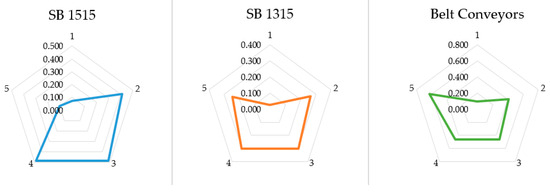
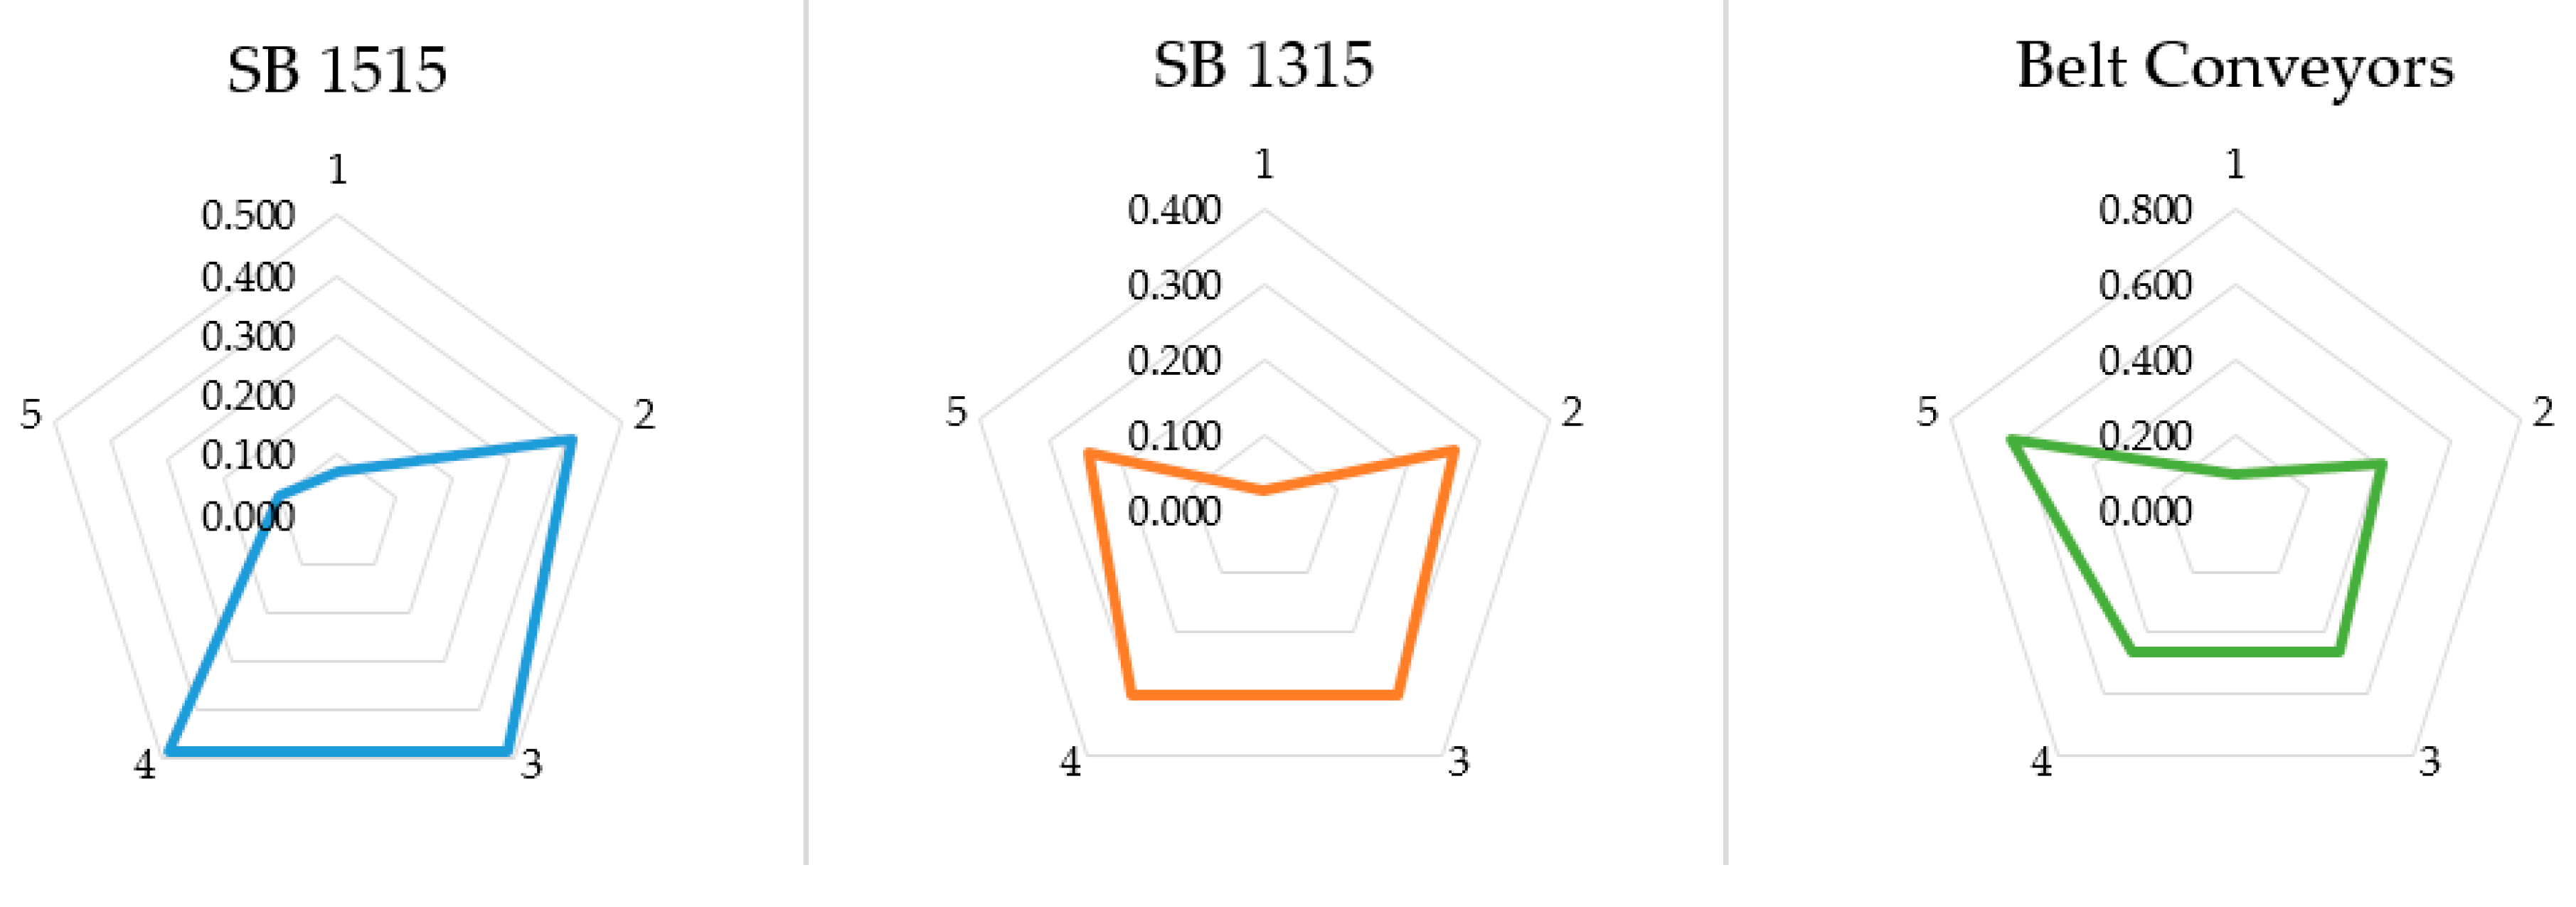
Figure 6.
Display results for parts of the CCS system.
Partial indicators t, e, u, d, m, and s more closely determine the partial indicator M-maintenance convenience, while M-maintainability together with R-reliability and F-logistic support determine the D-dependability of the system. It is shown in the following how the dependability D is determined based on indicators of maintainability M, reliability R, and logistical support F, while the maintenance convenience M is obtained similarly based on partial indicators t, e, u, d, m, and s.
The idea of this work is to obtain a more accurate assessment of the dependability of CCS systems at the open pit Gacko. This assessment was identified as the best possible among the worst expected ratings of the partial availability indicators (R, M, and F). Let the partial indicators R, M, and F be shown in the form of the following triangular fuzzy numbers
In the next step, the max-min composition is performed on them. If the mentioned partial indicators R, M, and F are observed, it is possible to make combinations of corresponding membership functions, which will be further denoted with
Each of these combinations represents one possible assessment of the dependability and the following two values can be associated with it
and
takes values from the set , and each of the mentioned values can be associated with the number , which represents the maximum value of is equal to , za , that is
In this way, a rating for the dependability of is obtained
Using the best-fit method, see [11], to transform the obtained ratings into belonging to the fuzzy set, determined by (2), the distance is used that is defined by
For . Small values indicate proximity to the linguistic variable . Accordingly, let be the minimum value of the obtained distances , and then the reciprocal value of the relative distances can be associated to each of them that is determined by:
If for some i the distance value is equal to 0, then the corresponding value of the reciprocal value of relative distance is while the other values of the reciprocal relative distances are equal to 0. The normalized values of the therefore obtained reciprocal values of the relative distances are determined by:
and present belonging to the appropriate rating:
In the end, the appropriate linguistic rating is obtained as follows:
In a similar way, a rating for maintainability M is obtained from the linguistic variables t, e, u, d, m, and s, which are later used to determine the dependability D.
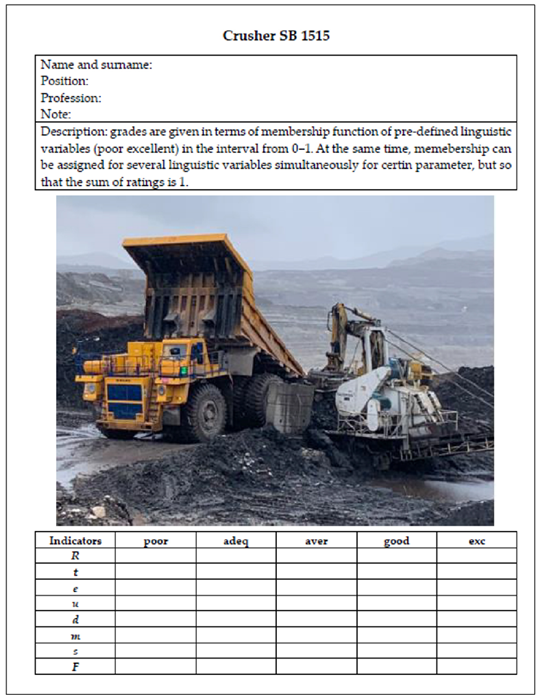
Initially, experts were provided with a questionnaire to gather their opinions on various indicators. These responses were then subjected to statistical analysis, a crucial step before moving on to the fuzzification process. The fuzzy proposal marks the initial application of artificial intelligence (AI) by assigning each indicator a corresponding fuzzy number. Subsequently, using fuzzy composition max–min, fuzzy numbers were determined for the indicators included in the final model, which are based on the indicators from the questionnaire. Finally, the grades were identified using appropriate methods, such as the best fit method.
Results of Expert Evaluation
Determination of the dependability of the system and its partial indicators was processed through the results obtained through questionnaires related to the expert evaluation of the partial indicators of operational safety. The questionnaire contained detailed descriptions of the partial indicators themselves. In the expert evaluation, 10 experts were surveyed. The first five experts are representatives of the Gacko Mine (experts from this field with many years of work on these systems-minimum 10 years of work experience), and the other five experts are external experts with many years of experience in the field of open pit mining. It is expected that the assessment of internal experts will be formed considering different and specific working conditions. The inclusion of external experts was achieved with the intention of reducing subjectivity in the assessment and to use the experiences in other mines and in other conditions. In this way, it is ensured that the given ratings reflect both the specific impacts on the Gacko open pit and the general impacts occurring in mining in general. By engaging internal and external experts, a synergetic effect was obtained, expressed in the given ratings. Ratings are expressed using membership functions representing predefined linguistic variables ranging from ‘poor’ to ‘excellent’ within a scale of 0 to 1. Additionally, a parameter can be associated with multiple linguistic variables simultaneously, ensuring that the total sum of ratings equals 1. The following tables give the results of expert evaluation for each part of the CCS system. The layout of one questionnaire is given in Appendix A. The results of the expert evaluation for the CCS system are given in Appendix B.
3.3. Determination the Partial Indicator of Maintainability M
On the basis of the submitted results, the following estimates were obtained as the arithmetic mean of the corresponding grades for the corresponding sub-indicators for each analyzed part of the CCS system, shown in Table A1, Table A2 and Table A3. Ratings of maintainability indicators for Crusher SB 1515, Crusher SB 1315, and belt conveyors are shown in Table 1.

Table 1.
Ratings of maintainability indicators for Crusher SB 1515, Crusher SB 1315, and belt conveyors.
Using a linear combination of ratings described by (1), the coefficients of which are given in the previous table, fuzzy ratings for partial indicators for each part of the system are obtained. And, in this case, we will demonstrate this process using the example of the partial indicator t for the Crusher SB 1515.
Similarly, fuzzy ratings are obtained for other indicators and other parts of the system, which are shown in Table 2.
Table 2.
Final rating for partial indicators t, e, u, d, m, and s, for Crusher SB 1515, Crusher SB 1315, and belt conveyors in the form of fuzzy number.
On the basis of the obtained ratings in the form of fuzzy numbers, the ratings obtained using the max-min composition for the specified parts of the system are shown in the following table.
Using Formulas (3)–(5), the max-min composition values for indicator are obtained for each part of the system and they are shown in Table 3.
Table 3.
Ratings obtained for the partial indicator of maintainability using the max-min composition.
3.4. Determination of Partial Indicators of Reliability and Logistical Support of Parts of the Continuous Prats of Combined System R and F
On the basis of the submitted results, the following estimates were obtained for each analyzed part of the continuous system when these two partial indicators are concerned. These estimates are shown in the Table 4.
Table 4.
Ratings of partial reliability and logistical support for Crusher SB 1515, Crusher SB 1315, and belt conveyors.
Using the estimated values for the partial indicators for system maintainability, the final ratings for the partial indicators R, M, and F for Crusher SB 1515, Crusher SB 1315, and belt conveyors in the fuzzy number form were obtained. These ratings are shown in the Table 5.
Table 5.
Corresponding fuzzy numbers for Crusher SB 1515, Crusher SB 1315, and belt conveyors.
Based on the obtained ratings in the form of fuzzy numbers, the ratings obtained using the max-min composition for the specified parts of the CCS system are shown in the following table. These ratings are shown in the Table 6. The distribution of output values is also shown graphically in the Figure 7.
Table 6.
Obtained ratings for dependability using the max-min composition.
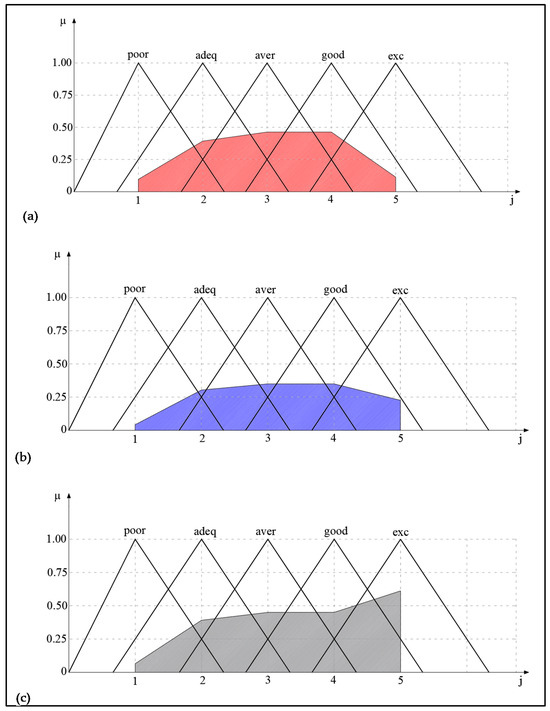
Figure 7.
Distribution of output values for D dependability for the CCS system, Crusher SB 1515 (a), Crusher SB 1315 (b), and belt conveyors (c) using max-min composition.
3.5. Dependability of the CCS System at the Open Pit Gacko
On the basis of the obtained ratings for dependability of the system parts, the overall rating of dependability was obtained using the max-min composition and reads as follows (Their distribution is shown in Figure 8 and also the results in Figure 9):
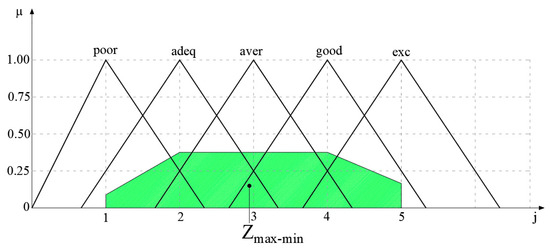
Figure 8.
Distribution of output values for D dependability for the CCS system using max-min composition.

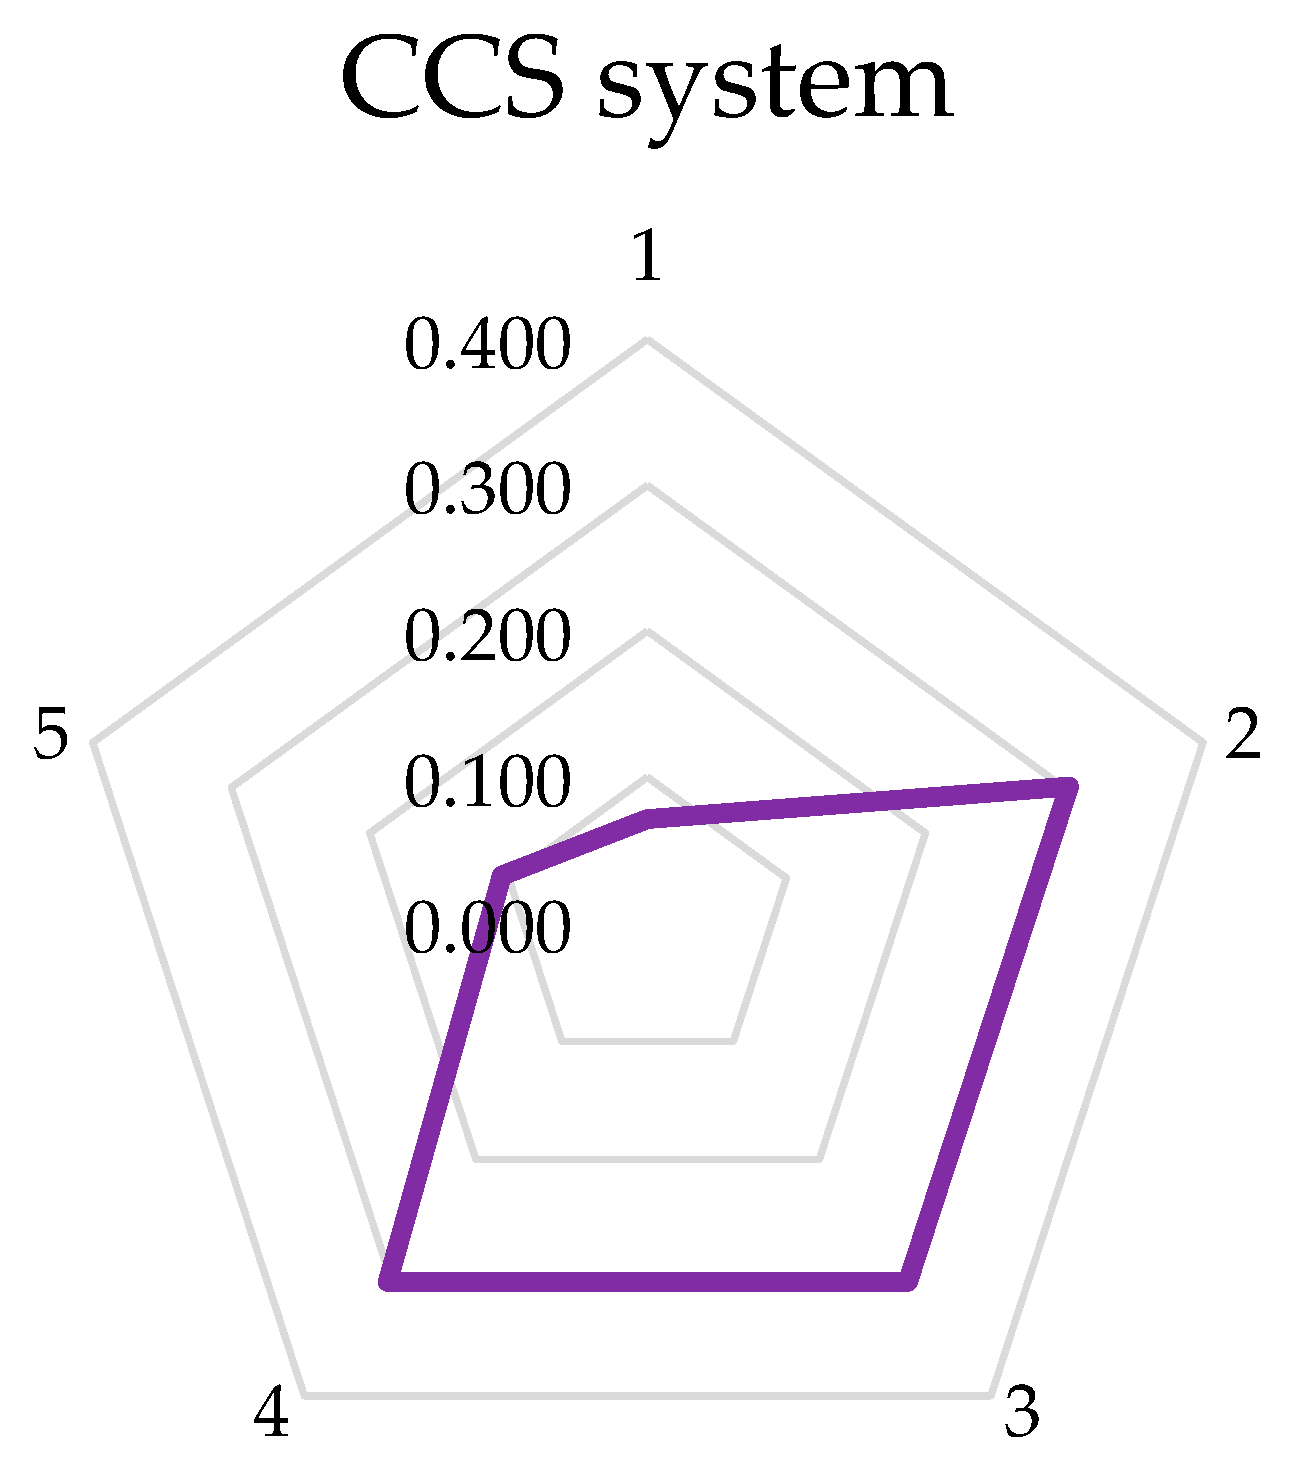
Figure 9.
Display results for CCS system.
(0.07125, 0.30333, 0.30333, 0.30333, 0.105).
Further analysis shows that the corresponding values obtained by the best fit method, by (8), are equal to:
So, we have
(, , , ) = (1.02977, 0.78942, 0.71215, 0.77866, 0.99645).
Note that = so the corresponding reciprocal values of the relative distances , as described in (9), are:
= (0.69156, 0.90211, 1, 0.91458, 0.71468).
The values of normalized reciprocal values , described in (10), are equal to:
Appropriate linguistic evaluation
On a scale of 1–5, the mentioned system in operation has a center of gravity of linguistic assessment for the max-min composition of 2.9860. Dependability is 59%.
One of the ways to determine the dispersion that occurs in the output result is the standard deviation, which is calculated according to the formula:
where -is the number of grades, and is the mean value of values , , , , and . In the case of max-min composition, the value of the standard deviation is:
In a similar way, dispersions and Z (center of gravity of linguistic assessment) values can be obtained for each part of the system separately. The obtained values are shown in the following Table 7.
Table 7.
Dispersions and Z (center of gravity of linguistic assessment) values for parts of the system.
If the final Z score was calculated as a linear combination of Z scores for each part of the system with coefficients corresponding to the participation of the corresponding dispersion, the following value would be obtained.
On a scale of 1–5, the mentioned system in operation has a center of gravity of linguistic assessment for the max-min composition of 2.8723. The corresponding dependability in this case is 57%.
The grade obtained in this way is approximate to the value using the max-min composition of the system parts, but unlike it, this one also includes information about the dispersions of the system parts grades.
4. Verification of Fuzzy Model
The verification model is based on the results of systematic monitoring of the work of the continuous part of the combined system, which is carried out by a specially designated service within Gacko Mine and Thermal Power Plant. The data were collected in order to prepare a special expertise of the condition of the surface mines of Mixed Holding Power Utility of Republic of Srpska, jointly verified by the investor and the designers. The performed verification gives a high degree of reliability to the data used in this article.
The effective system operating time represents the total operating time in the observed period and is calculated by subtracting the total downtime (failures) from the calendar fund. The operation of each system is accompanied by certain failures that have a direct impact on the utilization and reliability of the system. These failures can be planned or unplanned. Planned downtime refers to predefined technological operations and regular service maintenance. Unplanned failures are unpredictable and are not an integral part of the system’s working hours. The department in charge of monitoring the operation of the analyzed system keeps records that include the beginning, duration, and type of failures. These records are maintained on a shift or daily basis, and an official monthly report is issued on the operation of the system as a whole, including the continuous part.
Failures are categorized into the following groups:
- technological failures;
- electrical failures;
- mechanical failures;
- shift of workers;
- equipment overhaul;
- daily review;
- weather conditions.
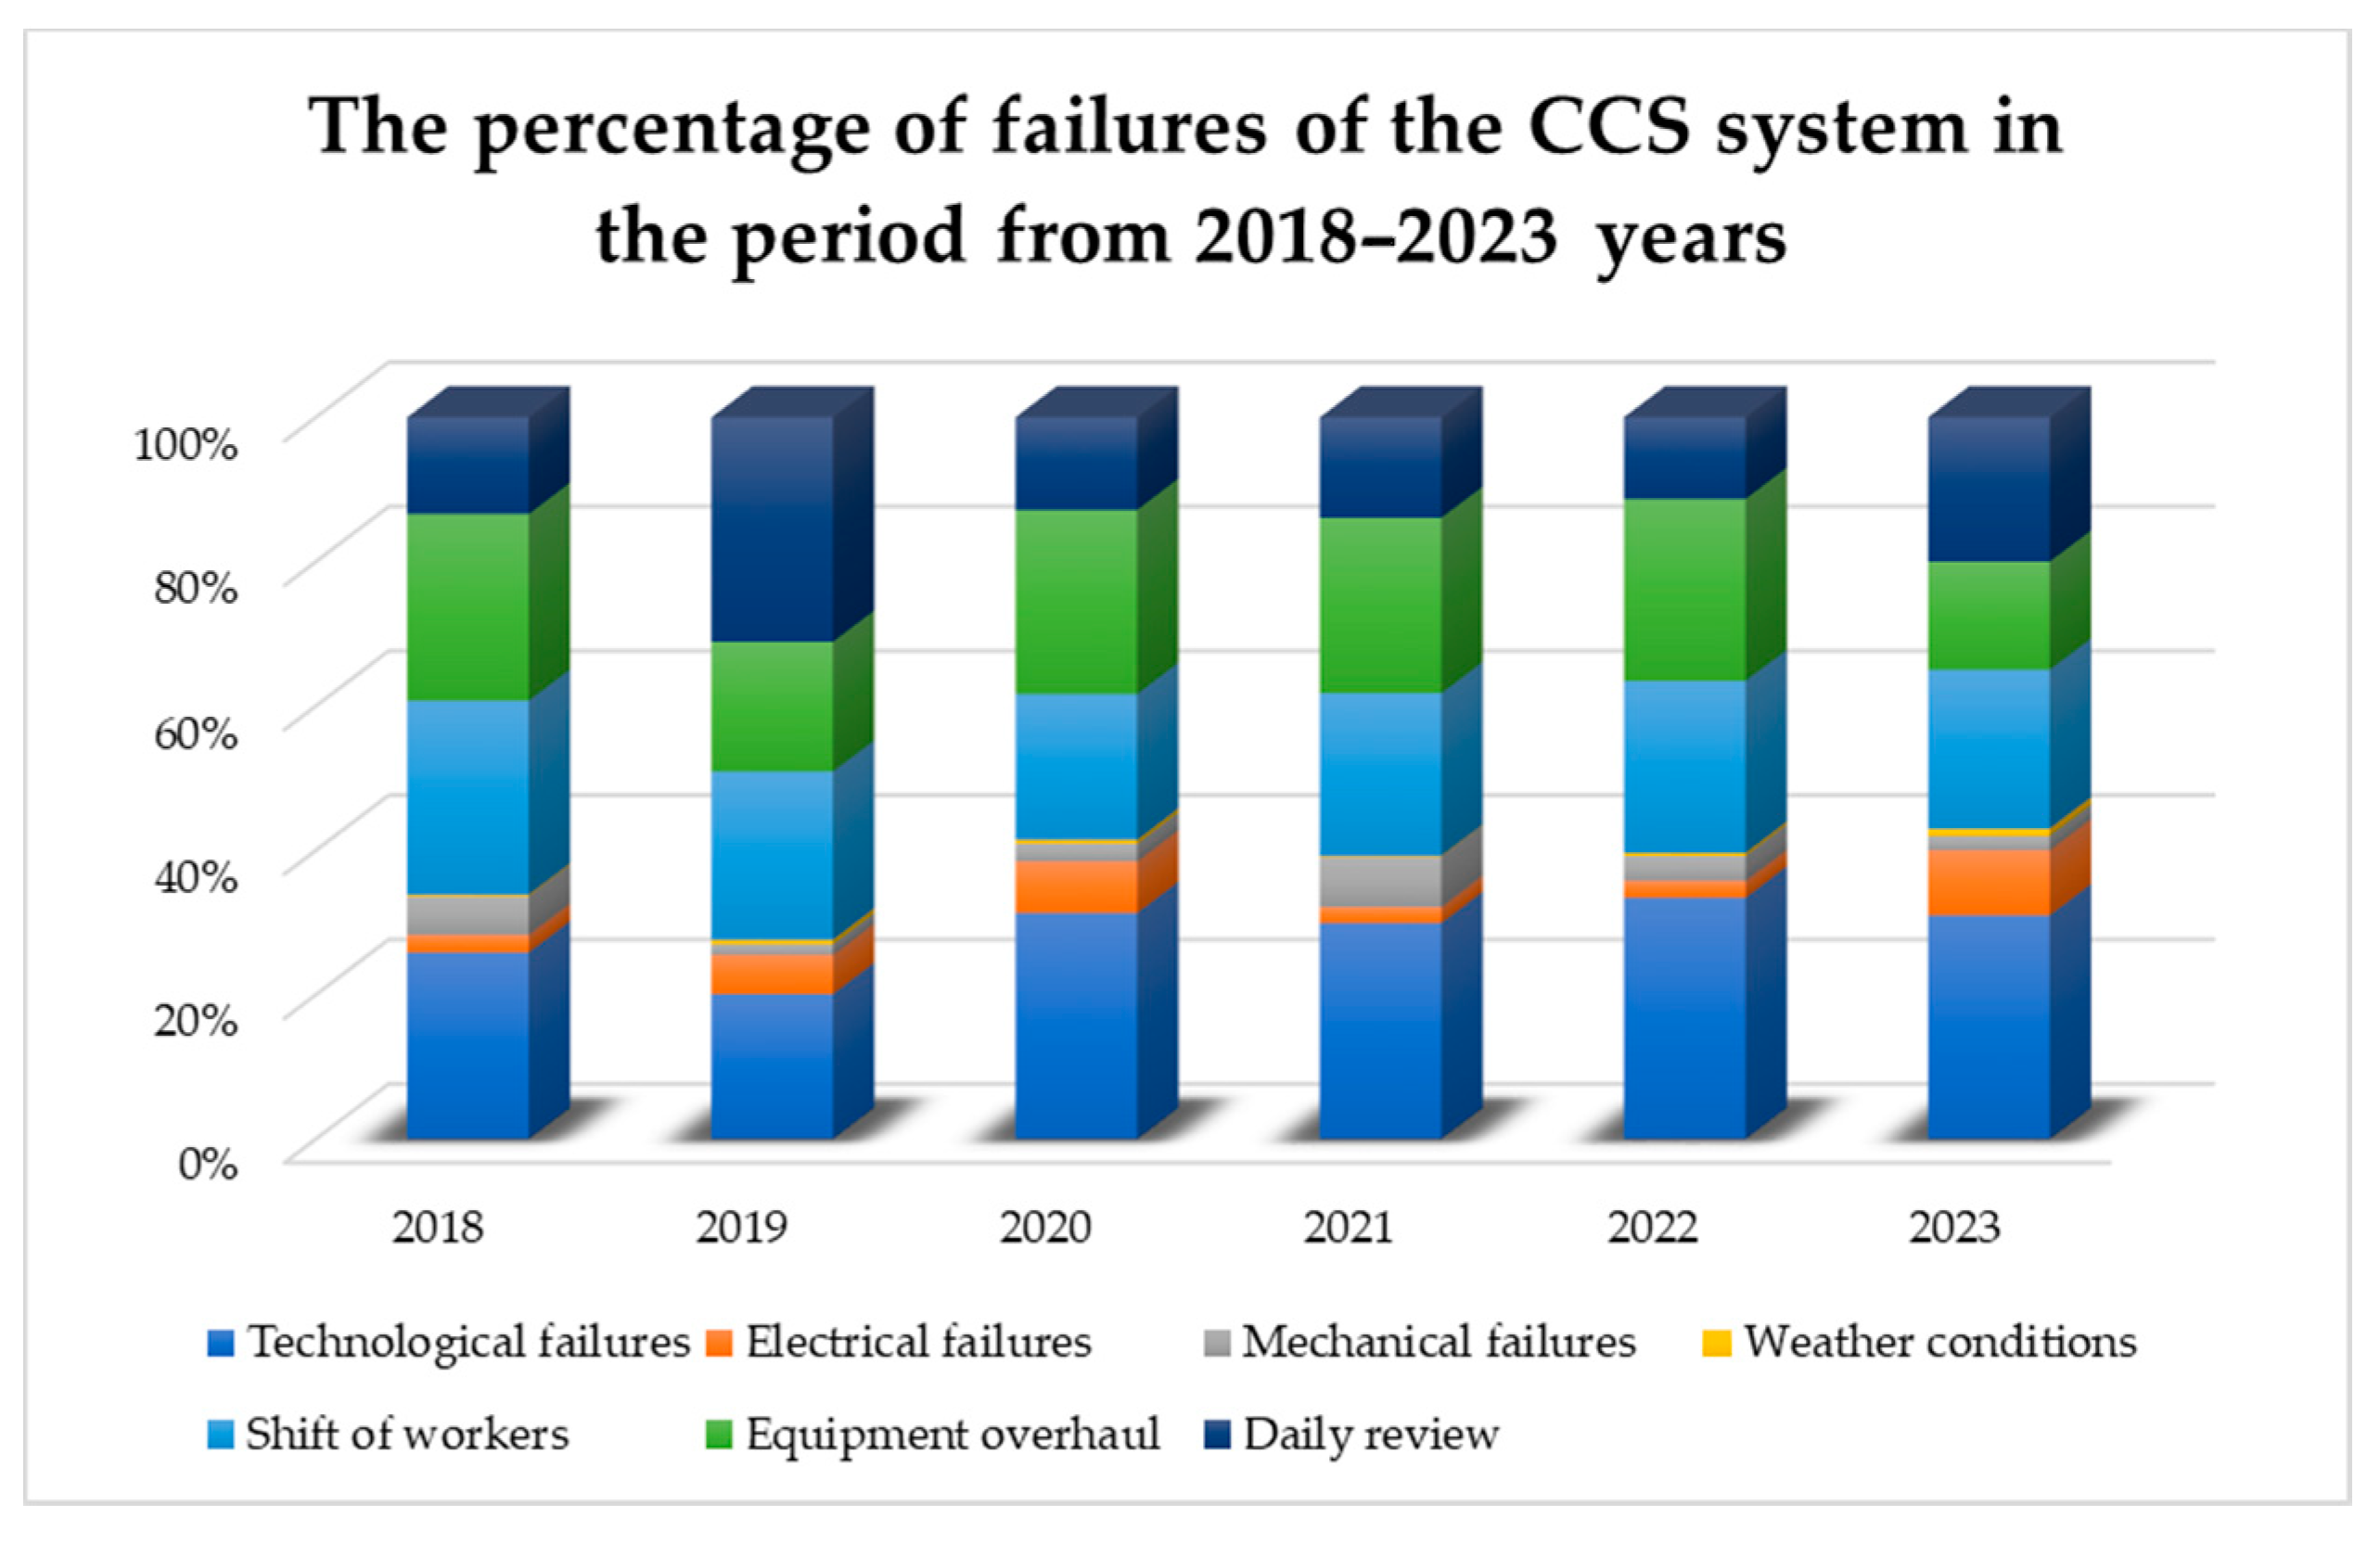
The following Figure 10 shows the percentage participation by types of failures for the CCS system by year.
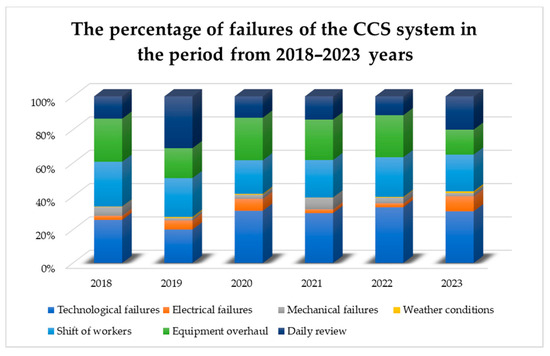
Figure 10.
The percentage of failures of the CCS system in the period 2018–2023.
This graph shows the percentage participation of different types of failures in the operation of the CCS system in the period from 2018 to 2023. The key indicators of the graph are as follows:
- Technological failures are consistently high and vary from 20.1% to 33.4% per year, which accounts for the largest part of total downtime (29% for a period of 6 years).
- Shift of workers and equipment overhaul are also significant downtime factors, with overall percentages of 23% and 22%.
- Electrical failures and mechanical failures have a relatively smaller share, but show variations between years.
- Weather conditions have the least participation in total downtime (0.5% for a period of 6 years).
- Daily review varies by year, but records a significant participation of 17% for the entire observed period.
Overall data show that technological failures, the shifts of workers, and equipment overhaul are the most dominant factors in the operation of the CCS system, while weather conditions are the least significant.
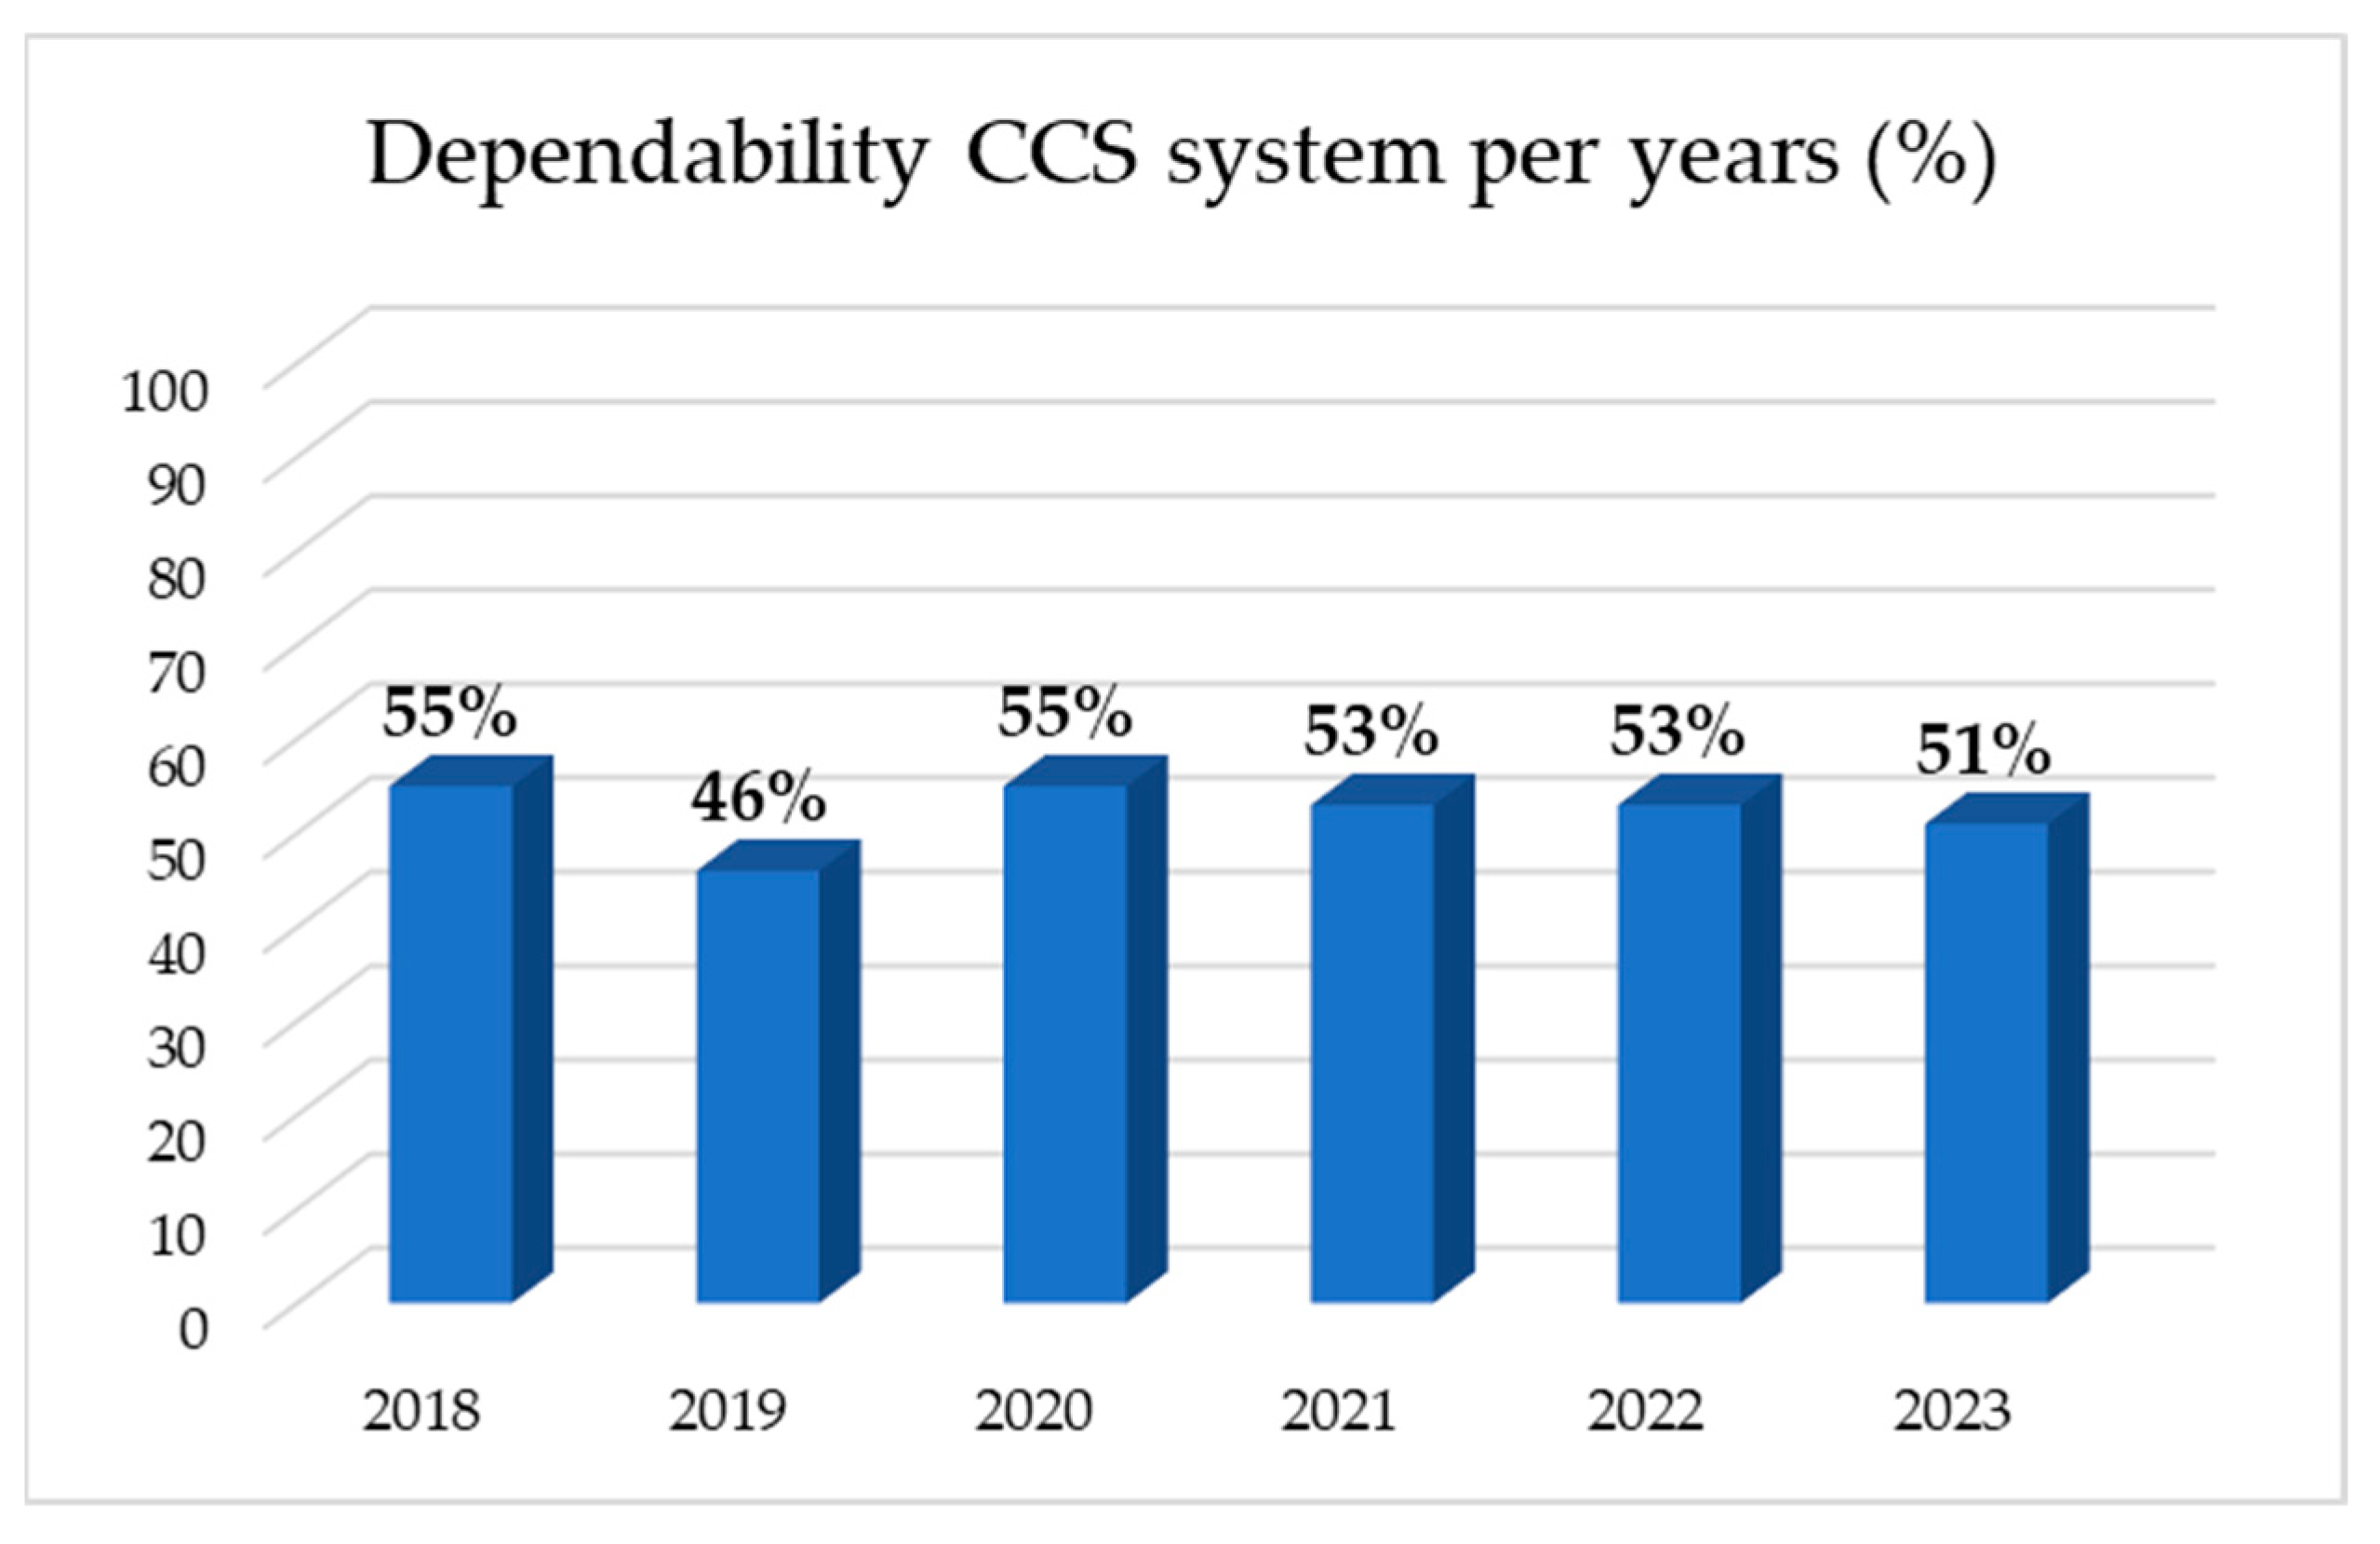
The dependability of the CCS system in the period 2018–2023 is shown in the following figure (Figure 11).

Figure 11.
The dependability of the continuous part of the CCS system in the period 2018–2023.
Data on the dependability of the CCS system in percentages for the period from 2018 to 2023 show slight variations. In 2018 and 2020, the system had the highest dependability of 55%. In 2019, dependability was the lowest, at 46%. This was the result of a significant percentage of failures related to the daily inspection of equipment, which was significantly higher in 2019 compared to all other years. In 2021 and 2022, dependability was stable at 53%, while 2023 saw a slight drop to 51%. Overall, system dependability varied between 46% and 55% over the observed period. The average value of dependability for the period of 6 years was 52.16%.
5. Discussion and Conclusions
In order to develop a model for determining the dependability of complex technical systems in mining, a combination of several research methods was necessary, such as a statistical analysis method, a conventional method for calculating dependability, and methods based on the application of fuzzy logic. These methods do not limit the use of some others. The goal is for them to show a match with historical data in their results.
The main goal of the research in this paper is to identify important parameters that affect the dependability of these technical systems and to synthesize these indicators and determine dependability by applying fuzzy logic. The initial basis of the model is represented by expert evaluations obtained by a survey that combines the evaluation of the dependability as a whole as well as the evaluation of individual parts of the system. Synthesis assessment allows the behavior of the production system to be described with a relevant assessment even when not all its elements are known. In this way, a relatively quick assessment is possible by applying the presented model in the function of production planning, maintenance system planning, and evaluation of exploitation effects, where the assessment depends on important indicators assessed by experts, for a complex technological system and in complex exploitation conditions. This is proven by the presented model verification by comparison with historical data. Once the model is set, it no longer requires a lengthy analysis of a large set of historical data. The model itself can be improved over time by taking into account additional indicators that turn out to have a significant impact. This model will improve the operation of the CCS system and indicate a possible reduction in maintenance costs and coal exploitation costs.
The presented model contributes to the assessment, understanding, and optimization of the dependability of the CCS system in surface coal mines. This model was developed using the example of the Gacko open pit, but it is also applicable to other open pits and can be especially significant for open pits where very different mining equipment is used, which requires specific types of maintenance and reacts differently to external influences. Therefore, it can be expected that the presented model can be successfully applied in cases where the mining equipment is unified to a greater extent and in different geological or climatic conditions. The model presented in this paper can be applied in other areas of the industry where similar production systems are applied.
This paper presents a model for evaluating the dependability of technical systems using fuzzy logic. It breaks down dependability into different indicators and combines them using the max-min composition method.
Unlike conventional models that rely on IT monitoring systems, this approach incorporates expert assessments from individuals directly involved in machine operation and maintenance. Its simplicity and reliance on expert judgment make it easy to implement without extensive data collection.
This model offers a fast way to assess system safety and provides valuable insights for enhancing specific indicators and overall dependability. By following the model’s recommendations, companies can streamline maintenance activities, analyze workflows, pinpoint weaknesses, and optimize the lifecycles of machinery to lower operational expenses.
Field experience confirms that the model accurately reflects the dependability of analyzed systems, considering factors such as system components, structure, age, working conditions, and organizational influences. When comparing the reliability data obtained through the fuzzy logic model with the actual field data collected over the period from 2018 to 2023, there is a strong correlation. The dependability obtained by two different methods using the model are 59% and 57%, and based on historical data for a period of 6 years, the average value of dependability is 52.6%. This consistency underscores the model’s effectiveness in capturing the real-world performance and dependability of the CCS systems.
Moreover, the historical data’s alignment with the model’s output validates the use of fuzzy logic in predicting and improving dependability. This approach not only facilitates proactive maintenance and risk management but also supports strategic decision-making by providing a sophisticated understanding of system vulnerabilities. The adaptability of the model to different mining contexts and its reliance on expert knowledge further enhance its practicality and robustness. Ultimately, this model serves as a valuable tool for mining companies aiming to achieve greater sustainability, efficiency, and cost-effectiveness in their operations.
Future research could explore the further refinement of this model by integrating it with advanced data analytics and machine learning techniques to enhance predictive accuracy and adaptability. Additionally, expanding the application of this model to other industries beyond mining could reveal broader insights and benefits, establishing it as a versatile tool for dependability assessment across various sectors. The continued evolution and validation of this model will ensure its relevance and efficacy in the ever-changing landscape of technical system management.
Author Contributions
Conceptualization, N.S. and M.G.; methodology N.S., M.G. and P.M.; Writing—review and editing N.S., P.M., D.K., A.D. and M.G., supervision S.S., N.S. and M.G. All authors have read and agreed to the published version of the manuscript.
Funding
This work was financially supported by the Ministry of Science, Technological Development and Innovation of the Republic of Serbia, Contract on realization and financing the scientific research work of the Mining and Metallurgy Institute Bor in 2024, Contract No.: 451-03-66/2024-03/200052.
Institutional Review Board Statement
Not applicable.
Informed Consent Statement
Not applicable.
Data Availability Statement
The original contributions presented in the study are included in the article, further inquiries can be directed to the corresponding author.
Acknowledgments
Gratitude to Ministry of Science, Technological Development and Innovation of the Republic of Serbia; Mining and Metallurgy Institute Bor, Zeleni bulevar 35, Bor; Gacko Mine and Thermal Power Plant.
Conflicts of Interest
The authors declare no conflict of interest.
Appendix A
Layout of questionnaire
Appendix B
Table A1.
Results of expert evaluation for Crusher SB 1515.
Table A1.
Results of expert evaluation for Crusher SB 1515.
| Expert | Type | poor | adeq | aver | good | exc | Expert | Type | poor | adeq | aver | good | exc |
|---|---|---|---|---|---|---|---|---|---|---|---|---|---|
| 1 | R | 0 | 0.5 | 0.5 | 0 | 0 | 6 | R | 0 | 0 | 0 | 0.6 | 0.4 |
| t | 0 | 0.2 | 0.8 | 0 | 0 | t | 0 | 0.4 | 0.6 | 0 | 0 | ||
| e | 0 | 0.6 | 0.4 | 0 | 0 | e | 0 | 0.2 | 0.8 | 0 | 0 | ||
| u | 0.2 | 0.8 | 0 | 0 | 0 | u | 0 | 0.1 | 0.9 | 0 | 0 | ||
| d | 0 | 0.5 | 0.5 | 0 | 0 | d | 0 | 0.4 | 0.6 | 0 | 0 | ||
| m | 0 | 0.3 | 0.7 | 0 | 0 | m | 0 | 0.3 | 0.7 | 0 | 0 | ||
| s | 0 | 0.1 | 0.9 | 0 | 0 | s | 0 | 0.7 | 0.3 | 0 | 0 | ||
| F | 0.4 | 0.6 | 0 | 0 | 0 | F | 0.2 | 0.8 | 0 | 0 | 0 | ||
| 2 | R | 0 | 0 | 0.3 | 0.7 | 0 | 7 | R | 0 | 0 | 0.3 | 0.7 | 0 |
| t | 0 | 0 | 0.35 | 0.65 | 0 | t | 0 | 0 | 0.2 | 0.8 | 0 | ||
| e | 0 | 0 | 0.2 | 0.8 | 0 | e | 0 | 0 | 0 | 0.4 | 0.6 | ||
| u | 0 | 0 | 0.6 | 0.4 | 0 | u | 0 | 0.4 | 0.6 | 0 | 0 | ||
| d | 0.2 | 0.8 | 0 | 0 | 0 | d | 0 | 0 | 0 | 0.6 | 0.4 | ||
| m | 0.5 | 0.5 | 0 | 0 | 0 | m | 0 | 0 | 0.2 | 0.8 | 0 | ||
| s | 0 | 0.7 | 0.3 | 0 | 0 | s | 0 | 0 | 0.3 | 0.7 | 0 | ||
| F | 0 | 0.3 | 0.7 | 0 | 0 | F | 0 | 0.4 | 0.6 | 0 | 0 | ||
| 3 | R | 0 | 0 | 0.3 | 0.7 | 0 | 8 | R | 0 | 0 | 0 | 0.8 | 0.2 |
| t | 0 | 0 | 0.4 | 0.6 | 0 | t | 0 | 0.4 | 0.6 | 0 | 0 | ||
| e | 0 | 0 | 0.45 | 0.55 | 0 | e | 0 | 0.3 | 0.7 | 0 | 0 | ||
| u | 0 | 0.25 | 0.75 | 0 | 0 | u | 0 | 0.6 | 0.4 | 0 | 0 | ||
| d | 0 | 0.1 | 0.9 | 0 | 0 | d | 0 | 0 | 0.2 | 0.8 | 0 | ||
| m | 0.4 | 0.6 | 0 | 0 | 0 | m | 0 | 0 | 0.7 | 0.3 | 0 | ||
| s | 0 | 0.6 | 0.4 | 0 | 0 | s | 0 | 0.4 | 0.6 | 0 | 0 | ||
| F | 0 | 0.3 | 0.7 | 0 | 0 | F | 0 | 0.1 | 0.9 | 0 | 0 | ||
| 4 | R | 0 | 0 | 0.1 | 0.9 | 0 | 9 | R | 0 | 0 | 0 | 0.9 | 0.1 |
| t | 0 | 0 | 0.2 | 0.8 | 0 | t | 0 | 0.3 | 0.7 | 0 | 0 | ||
| e | 0 | 0.5 | 0.5 | 0 | 0 | e | 0 | 0 | 0.2 | 0.8 | 0 | ||
| u | 0.4 | 0.6 | 0 | 0 | 0 | u | 0 | 0 | 0.4 | 0.6 | 0 | ||
| d | 0 | 0.4 | 0.6 | 0 | 0 | d | 0 | 0 | 0.2 | 0.8 | 0 | ||
| m | 0.3 | 0.7 | 0 | 0 | 0 | m | 0 | 0 | 0.7 | 0.3 | 0 | ||
| s | 0.25 | 0.75 | 0 | 0 | 0 | s | 0 | 0.3 | 0.7 | 0 | 0 | ||
| F | 0.15 | 0.85 | 0 | 0 | 0 | F | 0.2 | 0.8 | 0 | 0 | 0 | ||
| 5 | R | 0 | 0 | 0.3 | 0.7 | 0 | 10 | R | 0 | 0 | 0.6 | 0.4 | 0 |
| t | 0 | 0.3 | 0.7 | 0 | 0 | t | 0 | 0.3 | 0.7 | 0 | 0 | ||
| e | 0 | 0.7 | 0.3 | 0 | 0 | e | 0 | 0.4 | 0.6 | 0 | 0 | ||
| u | 0 | 0.4 | 0.6 | 0 | 0 | u | 0 | 0.6 | 0.4 | 0 | 0 | ||
| d | 0.3 | 0.7 | 0 | 0 | 0 | d | 0 | 0.1 | 0.9 | 0 | 0 | ||
| m | 0 | 0.6 | 0.4 | 0 | 0 | m | 0 | 0.7 | 0.3 | 0 | 0 | ||
| s | 0.3 | 0.7 | 0 | 0 | 0 | s | 0 | 0.2 | 0.8 | 0 | 0 | ||
| F | 0 | 0.3 | 0.7 | 0 | 0 | F | 0 | 0.4 | 0.6 | 0 | 0 |
Table A2.
Results of expert evaluation for Crusher SB 1315.
Table A2.
Results of expert evaluation for Crusher SB 1315.
| Expert | Type | poor | adeq | aver | good | exc | Expert | Type | poor | adeq | aver | good | exc |
|---|---|---|---|---|---|---|---|---|---|---|---|---|---|
| 1 | R | 0 | 0 | 0 | 0.6 | 0.4 | 6 | R | 0 | 0 | 0 | 0.6 | 0.4 |
| t | 0 | 0 | 0.2 | 0.8 | 0 | t | 0 | 0.4 | 0.6 | 0 | 0 | ||
| e | 0 | 0 | 0 | 0.7 | 0.3 | e | 0 | 0.2 | 0.8 | 0 | 0 | ||
| u | 0.45 | 0.55 | 0 | 0 | 0 | u | 0 | 0.1 | 0.9 | 0 | 0 | ||
| d | 0 | 0 | 0.1 | 0.9 | 0 | d | 0 | 0.4 | 0.6 | 0 | 0 | ||
| m | 0 | 0.3 | 0.7 | 0 | 0 | m | 0 | 0.3 | 0.7 | 0 | 0 | ||
| s | 0 | 0.2 | 0.8 | 0 | 0 | s | 0 | 0.7 | 0.3 | 0 | 0 | ||
| F | 0 | 0 | 0.4 | 0.6 | 0 | F | 0.2 | 0.8 | 0 | 0 | 0 | ||
| 2 | R | 0 | 0 | 0.3 | 0.7 | 0 | 7 | R | 0 | 0 | 0.3 | 0.7 | 0 |
| t | 0 | 0 | 0 | 0.3 | 0.7 | t | 0 | 0 | 0.2 | 0.8 | 0 | ||
| e | 0 | 0 | 0 | 0.4 | 0.6 | e | 0 | 0 | 0 | 0.4 | 0.6 | ||
| u | 0 | 0 | 0.2 | 0.8 | 0 | u | 0 | 0.4 | 0.6 | 0 | 0 | ||
| d | 0 | 0 | 0.4 | 0.6 | 0 | d | 0 | 0 | 0 | 0.6 | 0.4 | ||
| m | 0.5 | 0.5 | 0 | 0 | 0 | m | 0 | 0 | 0.2 | 0.8 | 0 | ||
| s | 0 | 0 | 0.8 | 0.2 | 0 | s | 0 | 0 | 0.3 | 0.7 | 0 | ||
| F | 0 | 0 | 0.2 | 0.8 | 0 | F | 0 | 0.4 | 0.6 | 0 | 0 | ||
| 3 | R | 0 | 0 | 0.3 | 0.7 | 0 | 8 | R | 0 | 0 | 0 | 0.8 | 0.2 |
| t | 0 | 0 | 0.4 | 0.6 | 0 | t | 0 | 0.4 | 0.6 | 0 | 0 | ||
| e | 0 | 0 | 0.45 | 0.55 | 0 | e | 0 | 0.3 | 0.7 | 0 | 0 | ||
| u | 0 | 0.25 | 0.75 | 0 | 0 | u | 0 | 0.6 | 0.4 | 0 | 0 | ||
| d | 0 | 0.1 | 0.9 | 0 | 0 | d | 0 | 0 | 0.2 | 0.8 | 0 | ||
| m | 0.4 | 0.6 | 0 | 0 | 0 | m | 0 | 0 | 0.7 | 0.3 | 0 | ||
| s | 0 | 0.6 | 0.4 | 0 | 0 | s | 0 | 0.4 | 0.6 | 0 | 0 | ||
| F | 0 | 0.3 | 0.7 | 0 | 0 | F | 0 | 0.1 | 0.9 | 0 | 0 | ||
| 4 | R | 0 | 0 | 0.1 | 0.9 | 0 | 9 | R | 0 | 0 | 0 | 0.9 | 0.1 |
| t | 0 | 0 | 0.2 | 0.8 | 0 | t | 0 | 0.3 | 0.7 | 0 | 0 | ||
| e | 0 | 0.5 | 0.5 | 0 | 0 | e | 0 | 0 | 0.2 | 0.8 | 0 | ||
| u | 0.4 | 0.6 | 0 | 0 | 0 | u | 0 | 0 | 0.4 | 0.6 | 0 | ||
| d | 0 | 0.4 | 0.6 | 0 | 0 | d | 0 | 0 | 0.7 | 0.3 | 0 | ||
| m | 0.3 | 0.7 | 0 | 0 | 0 | m | 0 | 0 | 0.4 | 0.6 | 0 | ||
| s | 0.25 | 0.75 | 0 | 0 | 0 | s | 0 | 0.3 | 0.7 | 0 | 0 | ||
| F | 0.15 | 0.85 | 0 | 0 | 0 | F | 0.2 | 0.8 | 0 | 0 | 0 | ||
| 5 | R | 0 | 0 | 0.3 | 0.7 | 0 | 10 | R | 0 | 0 | 0.6 | 0.4 | 0 |
| t | 0 | 0.3 | 0.7 | 0 | 0 | t | 0 | 0.3 | 0.7 | 0 | 0 | ||
| e | 0 | 0.7 | 0.3 | 0 | 0 | e | 0 | 0.4 | 0.6 | 0 | 0 | ||
| u | 0 | 0.4 | 0.6 | 0 | 0 | u | 0 | 0.6 | 0.4 | 0 | 0 | ||
| d | 0.3 | 0.7 | 0 | 0 | 0 | d | 0 | 0.1 | 0.9 | 0 | 0 | ||
| m | 0 | 0.6 | 0.4 | 0 | 0 | m | 0 | 0.7 | 0.3 | 0 | 0 | ||
| s | 0.3 | 0.7 | 0 | 0 | 0 | s | 0 | 0.2 | 0.8 | 0 | 0 | ||
| F | 0 | 0.3 | 0.7 | 0 | 0 | F | 0 | 0.4 | 0.6 | 0 | 0 |
Table A3.
Results of expert evaluation for belt conveyors.
Table A3.
Results of expert evaluation for belt conveyors.
| Expert | Type | poor | adeq | aver | good | exc | Expert | Type | poor | adeq | aver | good | exc |
|---|---|---|---|---|---|---|---|---|---|---|---|---|---|
| 1 | R | 0 | 0.5 | 0.5 | 0 | 0 | 6 | R | 0 | 0 | 0 | 0.6 | 0.4 |
| t | 0 | 0.2 | 0.8 | 0 | 0 | t | 0 | 0.4 | 0.6 | 0 | 0 | ||
| e | 0 | 0.6 | 0.4 | 0 | 0 | e | 0 | 0.2 | 0.8 | 0 | 0 | ||
| u | 0.2 | 0.8 | 0 | 0 | 0 | u | 0 | 0.1 | 0.9 | 0 | 0 | ||
| d | 0 | 0.5 | 0.5 | 0 | 0 | d | 0 | 0.4 | 0.6 | 0 | 0 | ||
| m | 0 | 0.3 | 0.7 | 0 | 0 | m | 0 | 0.3 | 0.7 | 0 | 0 | ||
| s | 0 | 0.1 | 0.9 | 0 | 0 | s | 0 | 0.7 | 0.3 | 0 | 0 | ||
| F | 0.4 | 0.6 | 0 | 0 | 0 | F | 0.2 | 0.8 | 0 | 0 | 0 | ||
| 2 | R | 0 | 0 | 0.3 | 0.7 | 0 | 7 | R | 0 | 0 | 0.3 | 0.7 | 0 |
| t | 0 | 0 | 0.35 | 0.65 | 0 | t | 0 | 0 | 0.2 | 0.8 | 0 | ||
| e | 0 | 0 | 0.2 | 0.8 | 0 | e | 0 | 0 | 0 | 0.4 | 0.6 | ||
| u | 0 | 0 | 0.6 | 0.4 | 0 | u | 0 | 0.4 | 0.6 | 0 | 0 | ||
| d | 0.2 | 0.8 | 0 | 0 | 0 | d | 0 | 0 | 0 | 0.6 | 0.4 | ||
| m | 0.5 | 0.5 | 0 | 0 | 0 | m | 0 | 0 | 0.2 | 0.8 | 0 | ||
| s | 0 | 0.7 | 0.3 | 0 | 0 | s | 0 | 0 | 0.3 | 0.7 | 0 | ||
| F | 0 | 0.3 | 0.7 | 0 | 0 | F | 0 | 0.4 | 0.6 | 0 | 0 | ||
| 3 | R | 0 | 0 | 0.3 | 0.7 | 0 | 8 | R | 0 | 0 | 0 | 0.8 | 0.2 |
| t | 0 | 0 | 0.4 | 0.6 | 0 | t | 0 | 0.4 | 0.6 | 0 | 0 | ||
| e | 0 | 0 | 0.45 | 0.55 | 0 | e | 0 | 0.3 | 0.7 | 0 | 0 | ||
| u | 0 | 0.25 | 0.75 | 0 | 0 | u | 0 | 0.6 | 0.4 | 0 | 0 | ||
| d | 0 | 0.1 | 0.9 | 0 | 0 | d | 0 | 0 | 0.2 | 0.8 | 0 | ||
| m | 0.4 | 0.6 | 0 | 0 | 0 | m | 0 | 0 | 0.7 | 0.3 | 0 | ||
| s | 0 | 0.6 | 0.4 | 0 | 0 | s | 0 | 0.4 | 0.6 | 0 | 0 | ||
| F | 0 | 0.3 | 0.7 | 0 | 0 | F | 0 | 0.1 | 0.9 | 0 | 0 | ||
| 4 | R | 0 | 0 | 0.1 | 0.9 | 0 | 9 | R | 0 | 0 | 0 | 0.9 | 0.1 |
| t | 0 | 0 | 0.2 | 0.8 | 0 | t | 0 | 0.3 | 0.7 | 0 | 0 | ||
| e | 0 | 0.5 | 0.5 | 0 | 0 | e | 0 | 0 | 0.2 | 0.8 | 0 | ||
| u | 0.4 | 0.6 | 0 | 0 | 0 | u | 0 | 0 | 0.4 | 0.6 | 0 | ||
| d | 0 | 0.4 | 0.6 | 0 | 0 | d | 0 | 0 | 0.7 | 0.3 | 0 | ||
| m | 0.3 | 0.7 | 0 | 0 | 0 | m | 0 | 0 | 0.4 | 0.6 | 0 | ||
| s | 0.25 | 0.75 | 0 | 0 | 0 | s | 0 | 0.3 | 0.7 | 0 | 0 | ||
| F | 0.15 | 0.85 | 0 | 0 | 0 | F | 0.2 | 0.8 | 0 | 0 | 0 | ||
| 5 | R | 0 | 0 | 0.3 | 0.7 | 0 | 10 | R | 0 | 0 | 0.6 | 0.4 | 0 |
| t | 0 | 0.3 | 0.7 | 0 | 0 | t | 0 | 0.3 | 0.7 | 0 | 0 | ||
| e | 0 | 0.7 | 0.3 | 0 | 0 | e | 0 | 0.4 | 0.6 | 0 | 0 | ||
| u | 0 | 0.4 | 0.6 | 0 | 0 | u | 0 | 0.6 | 0.4 | 0 | 0 | ||
| d | 0.3 | 0.7 | 0 | 0 | 0 | d | 0 | 0.1 | 0.9 | 0 | 0 | ||
| m | 0 | 0.6 | 0.4 | 0 | 0 | m | 0 | 0.7 | 0.3 | 0 | 0 | ||
| s | 0.3 | 0.7 | 0 | 0 | 0 | s | 0 | 0.2 | 0.8 | 0 | 0 | ||
| F | 0 | 0.3 | 0.7 | 0 | 0 | F | 0 | 0.4 | 0.6 | 0 | 0 |
References
- Ali, S.H.; Giurco, D.; Arndt, N.; Nickless, E.; Brown, G.; Demetriades, A.; Durrheim, R.; Enriquez, M.A.; Kinnaird, J.; Littleboy, A.; et al. Mineral supply for sustainable development requires resource governance. Nature 2017, 543, 367–372. [Google Scholar] [CrossRef] [PubMed]
- Dubiński, J. Sustainable Development of Mining Mineral Resources. J. Sustain. Min. 2013, 12, 1–6. [Google Scholar] [CrossRef]
- Purhamadani, E.; Bagherpour, R.; Tudeshki, H. Energy consumption in open-pit mining operations relying on reduced energy consumption for haulage using in-pit crusher systems. J. Clean. Prod. 2020, 291, 125228. [Google Scholar] [CrossRef]
- Zhang, S.; Xia, X. Modeling and energy efficiency optimization of belt conveyors. Appl. Energy 2011, 88, 3061–3071. [Google Scholar] [CrossRef]
- Tabelin, C.B.; Dallas, J.; Casanova, S.; Pelech, T.; Bournival, G.; Saydam, S.; Canbulat, I. Towards a low-carbon society: A review of lithium resource availability, challenges and innovations in mining, extraction and recycling, and future perspectives. Miner. Eng. 2021, 163, 106743. [Google Scholar] [CrossRef]
- Ercelebi, S.G.; Bascetin, A. Optimization of shovel-truck system for surface mining. J. S. Afr. Inst. Min. Metall. 2009, 109, 433–439. [Google Scholar]
- Bao, H.; Knights, P.; Kizil, M.; Nehring, M. Electrification Alternatives for Open Pit Mine Haulage. Mining 2023, 3, 1–25. [Google Scholar] [CrossRef]
- Issa, M.; Ilinca, A.; Rousse, D.R.; Boulon, L.; Groleau, P. Renewable Energy and Decarbonization in the Canadian Mining Industry: Opportunities and Challenges. Energies 2023, 16, 6967. [Google Scholar] [CrossRef]
- Kim, H.; Lee, W.-H.; Lee, C.-H.; Kim, S.-M. Development of Monitoring Technology for Mine Haulage Road through Sensor-Connected Digital Device and Smartphone Application. Appl. Sci. 2022, 12, 12166. [Google Scholar] [CrossRef]
- Petrović, D.V.; Tanasijević, M.; Stojadinović, S.; Ivaz, J.; Stojković, P. Fuzzy Model for Risk Assessment of Machinery Failures. Symmetry 2020, 12, 525. [Google Scholar] [CrossRef]
- Gomilanovic, M.; Tanasijevic, M.; Stepanovic, S. Determining the Availability of Continuous Systems at Open Pits Applying Fuzzy Logic. Energies 2022, 15, 6786. [Google Scholar] [CrossRef]
- Djenadic, S.; Ignjatovic, D.; Tanasijevic, M.; Bugaric, U.; Jankovic, I.; Subaranovic, T. Development of the Availability Concept by Using Fuzzy Theory with AHP Correction, a Case Study: Bulldozers in the Open-Pit Lignite Mine. Energies 2019, 12, 4044. [Google Scholar] [CrossRef]
- Gomilanovic, M.; Bugaric, U.; Bankovic, M.; Stanic, N.; Stepanovic, S. Determining the Availability of Continuous Systems in Open Pits Using ANFIS and a Simulation Model. Energies 2024, 17, 1138. [Google Scholar] [CrossRef]
- Gomilanovic, M.; Tanasijevic, M.; Stepanovic, S.; Miletic, F. A Model for Determining Fuzzy Evaluations of Partial Indicators of Availability for High-Capacity Continuous Systems at Coal Open Pits Using a Neuro-Fuzzy Inference System. Energies 2023, 16, 2958. [Google Scholar] [CrossRef]
- Jovančić, P.; Tanasijević, M.; Milisavljević, V.; Cvjetić, A.; Ivezić, D.; Bugarić, U. Applying the Fuzzy Inference Model in Maintenance Centered to Safety: Case Study—Bucket Wheel Excavator. In Applications and Challenges of Maintenance and Safety Engineering in Industry 4.0; IGI Global: Hershey, PA, USA, 2020; pp. 142–165. [Google Scholar] [CrossRef]
- Khanlari, A.; Mohammadi, K.; Sohrabi, B. Prioritizing equipments for preventive maintenance (PM) activities using fuzzy rules. Comput. Ind. Eng. 2008, 54, 169–184. [Google Scholar] [CrossRef]
- Tanasijevic, M.; Ivezic, D.; Ignjatovic, D.; Polovina, D. Dependability as criteria for bucket wheel excavator revitalization. J. Sci. Ind. Res. 2011, 70, 13–19. [Google Scholar]
- Čelebić, M.; Bajić, D.; Bajić, S.; Banković, M.; Torbica, D.; Milošević, A.; Stevanović, D. Development of an Integrated Model for Open-Pit-Mine Discontinuous Haulage System Optimization. Sustainability 2024, 16, 3156. [Google Scholar] [CrossRef]
- Urošević, K.U.; Gligorić, Z.; Miljanović, I.M.; Čedomir; Beljić, B.; Gligorić, M.G.; Moreno-Jiménez, J. Novel Methods in Multiple Criteria Decision-Making Process (MCRAT and RAPS)—Application in the Mining Industry. Mathematics 2021, 9, 1980. [Google Scholar] [CrossRef]
- Halilović, D.; Gligorić, M.; Gligorić, Z.; Pamučar, D. An Underground Mine Ore Pass System Optimization via Fuzzy 0–1 Linear Programming with Novel Torricelli–Simpson Ranking Function. Mathematics 2023, 11, 2914. [Google Scholar] [CrossRef]
- Li, S.; Huang, Q.; Hu, B.; Pan, J.; Chen, J.; Yang, J.; Zhou, X.; Wang, X.; Yu, H. Mining Method Optimization of Difficult-to-Mine Complicated Orebody Using Pythagorean Fuzzy Sets and TOPSIS Method. Sustainability 2023, 15, 3692. [Google Scholar] [CrossRef]
- Bajić, S.; Bajić, D.; Gluščević, B.; Vakanjac, V.R. Application of Fuzzy Analytic Hierarchy Process to Underground Mining Method Selection. Symmetry 2020, 12, 192. [Google Scholar] [CrossRef]
- Jaderi, F.; Ibrahim, Z.Z.; Zahiri, M.R. Criticality Analysis of Petrochemical Assets using Risk Based Maintenance and the Fuzzy Inference System. Process. Saf. Environ. Prot. 2018, 121, 312–325. [Google Scholar] [CrossRef]
- Bakhtavar, E.; Hosseini, S.; Hewage, K.; Sadiq, R. Air Pollution Risk Assessment Using a Hybrid Fuzzy Intelligent Probability-Based Approach: Mine Blasting Dust Impacts. Nat. Resour. Res. 2021, 30, 2607–2627. [Google Scholar] [CrossRef]
- Tubis, A.; Werbińska-Wojciechowska, S.; Wroblewski, A. Risk Assessment Methods in Mining Industry—A Systematic Review. Appl. Sci. 2020, 10, 5172. [Google Scholar] [CrossRef]
- Jiskani, I.M.; Cai, Q.; Zhou, W.; Lu, X. Assessment of risks impeding sustainable mining in Pakistan using fuzzy synthetic evaluation. Resour. Policy 2020, 69, 101820. [Google Scholar] [CrossRef]
- Spanidis, P.-M.; Roumpos, C.; Pavloudakis, F. A Fuzzy-AHP Methodology for Planning the Risk Management of Natural Hazards in Surface Mining Projects. Sustainability 2021, 13, 2369. [Google Scholar] [CrossRef]
- Petrović, D.V.; Tanasijević, M.; Milić, V.; Lilić, N.; Stojadinović, S.; Svrkota, I. Risk assessment model of mining equipment failure based on fuzzy logic. Expert Syst. Appl. 2014, 41, 8157–8164. [Google Scholar] [CrossRef]
- Djenadic, S.; Tanasijevic, M.; Jovancic, P.; Ignjatovic, D.; Petrovic, D.; Bugaric, U. Risk Evaluation: Brief Review and Innovation Model Based on Fuzzy Logic and MCDM. Mathematics 2022, 10, 811. [Google Scholar] [CrossRef]
- Tanasijević, M.; Ivezić, D.; Jovančić, P.; Ignjatović, D.; Bugarić, U. Dependability assesment of open-pit mines equpment—Study on the bases of fuzzy algebra rules. Eksploat. I Niezawodn. 2013, 15, 66–74. [Google Scholar]
- Dimitrijević, B.; Šubaranović, T.; Stević; Kchaou, M.; Alqurashi, F.; Subotić, M. A Novel Hybrid Fuzzy Multiple-Criteria Decision-Making Model for the Selection of the Most Suitable Land Reclamation Variant at Open-Pit Coal Mines. Sustainability 2024, 16, 4424. [Google Scholar] [CrossRef]
- Ebrahimabadi, A.; Pouresmaieli, M.; Afradi, A.; Pouresmaeili, E.; Nouri, S. Comparing Two Methods of PROMETHEE and Fuzzy TOPSIS in Selecting the Best Plant Species for the Reclamation of Sarcheshmeh Copper Mine. Asian J. Water, Environ. Pollut. 2018, 15, 141–152. [Google Scholar] [CrossRef]
- Liang, W.; Dai, B.; Zhao, G.; Wu, H. Assessing the Performance of Green Mines via a Hesitant Fuzzy ORESTE–QUALIFLEX Method. Mathematics 2019, 7, 788. [Google Scholar] [CrossRef]
- Nehring, M.; Knights, P.; Kizil, M.; Hay, E. A comparison of strategic mine planning approaches for in-pit crushing and conveying, and truck/shovel systems. Int. J. Min. Sci. Technol. 2018, 28, 205–214. [Google Scholar] [CrossRef]
- Ivezić, D.; Tanasijević, M.; Ignjatović, D. Fuzzy Approach to Dependability Performance Evaluation. Qual. Reliab. Eng. Int. 2008, 24, 779–792. [Google Scholar] [CrossRef]
- Chen, S.M. Fuzzy system reliability analysis using fuzzy number arithmetic operations. Fuzzy Sets Syst. 1994, 64, 31–38. [Google Scholar] [CrossRef]
- Ebrahimipour, V.; Suzuki, K. A synergetic approach for assessing and improving equipment performance in offshore industry based on dependability. Reliab. Eng. Syst. Saf. 2006, 91, 10–19. [Google Scholar] [CrossRef]
- Emblemsvag, J.; Tonning, L. Decision support in selecting maintenance organization. J. Qual. Maint. Eng. 2003, 9, 11–24. [Google Scholar] [CrossRef]
- Knapp, G.M.; Mahajan, M. Optimization of maintenance organization and manpower in process industries. J. Qual. Maint. Eng. 1998, 4, 168–183. [Google Scholar] [CrossRef]
- Saraswat, S.; Yadava, G.S. An overview on reliability, availability, maintainability and supportability (RAMS) engineering. Int. J. Qual. Reliab. Manag. 2008, 25, 330–344. [Google Scholar] [CrossRef]
- Strandberg, K. IEC 300: The dependability counterpart of ISO 9000. In Proceedings of the Annual Reliability and Maintainability Symposium, Orlando, FL, USA, 29–31 January 1991; pp. 463–467. [Google Scholar]
- Seo, K.K.; Ahn, B.J. A learning algorithm based estimation method for maintenance cost of product concepts. Comput. Ind. Eng. 2006, 50, 66–75. [Google Scholar] [CrossRef]
- Wang, N.; Kang, R.; Jia, Z.; Wang, L. An algorithm for evaluation and analysis of stationary operational availability basing on mission requirements. Eksploat. I Niezawodn. Maint. Reliab. 2010, 46, 31–35. [Google Scholar]
- Jankovic, I. Optimisation of the Life Cycle Concept of Auxiliary MACHINERY at Lignite Open-Pit Mines. Doctoral Dissertation, Faculty of Mining and Geology, University of Belgrade, Beograd, Serbia, 2020. [Google Scholar]
- Todorovic, J. Technical Systems Maintenance Engineering; Yugoslav Society for Engines and Vehicles: Belgrade, Serbia, 1993. [Google Scholar]
- Tanaskovic, T. Maintenance of Mining Machines; Faculty of Mining and Geology, University of Belgrade: Belgrade, Serbia, 2001. [Google Scholar]
- Tanasijevic, M. Dependability of the Mechanical Components of Bucket Wheel. Doctoral Dissertation, Faculty of Mining and Geology, University of Belgrade, Belgrade, Serbia, 2007. [Google Scholar]
- Krunic, D.J. Development of Quality of Service Model for Auxiliary Equipment in Open Pit Lignite Mines. Doctoral Dissertation, Faculty of Mining and Geology, University of Belgrade, Belgrade, Serbia, 2021. [Google Scholar]
- Krunić, D.J.; Vujić, S.; Tanasijević, M.; Dimitrijević, B.; Šubaranović, T.; Ilić, S.; Maksimovic, S. Model Approaches to Life Cycle Assessment of Auxiliary Machines Based on an Example of a Coal Mine in Serbia. J. Min. Sci. 2018, 54, 404–413. [Google Scholar] [CrossRef]
- International Electrotechnical Vocabulary. Dependability and Quality of Service; IEC Standard: Geneva, Switzerland, 1990. [Google Scholar]
- Jovancic, P. Maintenance of Mining Machines; Faculty of Mining and Geology, University of Belgrade: Belgrade, Serbia, 2014; ISBN 978-86-7352-250-0. [Google Scholar]
- Wang, J.; Yang, J.B.; Sen, P. Safety Analyses and Synthesis Using Fuzzy Sets and Evidential Reasoning. Reliab. Eng. Syst. Saf. 1995, 47, 103–118. [Google Scholar] [CrossRef]


Disclaimer/Publisher’s Note: The statements, opinions and data contained in all publications are solely those of the individual author(s) and contributor(s) and not of MDPI and/or the editor(s). MDPI and/or the editor(s) disclaim responsibility for any injury to people or property resulting from any ideas, methods, instructions or products referred to in the content. |
© 2024 by the authors. Licensee MDPI, Basel, Switzerland. This article is an open access article distributed under the terms and conditions of the Creative Commons Attribution (CC BY) license (https://creativecommons.org/licenses/by/4.0/).