Article

Comparative Analysis of Concrete Cracking and Reinforcement Corrosion in Concrete and Ultra-High-Performance Concrete Short Columns after Accelerated Corrosion

1
School of Civil Engineering, Suzhou University of Science and Technology, Suzhou 215009, China
2
School of Civil Engineering, Southeast University, Nanjing 211189, China
3
School of Electrical Engineering, Northeast Electric Power University, Jilin 132012, China
*
Author to whom correspondence should be addressed.
Appl. Sci. 2024, 14(17), 7969; https://doi.org/10.3390/app14177969
Submission received: 14 August 2024 / Revised: 3 September 2024 / Accepted: 4 September 2024 / Published: 6 September 2024

Abstract

:
In this study, nine concrete short columns and nine UHPC (ultra-high-performance concrete) short columns were produced, and an accelerated corrosion test method was used to compare and analyze the cracking phenomena and reinforcement corrosion after different durations of electrical current application. The analysis revealed that the corrosion rate of the UHPC specimens was approximately half of that of the concrete specimens, demonstrating excellent corrosion resistance. Although the corrosion rate of the UHPC specimen was lower, the length of the internal steel reinforcement decreased more significantly under prolonged electrification. For example, after 38 days of accelerated corrosion, the internal steel reinforcement in the ordinary concrete specimen measured 48 mm in length, while in the UHPC specimen, it measured only 43 mm. It was also found that the corrosion rates of both the concrete and UHPC specimens were significantly lower than the theoretical corrosion rate. This discrepancy is attributed to the fact that Faraday’s law, used to calculate the theoretical corrosion rate, does not fully account for factors such as the thickness of the protective layer and chloride ion concentration. The actual corrosion rate of the concrete specimens was generally only 70% of the theoretical value, while the UHPC specimens showed a corrosion rate which was only 40% of the theoretical value.

1. Introduction

Reinforced concrete undergoes corrosion in environments rich in chloride ions, specifically manifesting as a reduction in the cross-sectional area and length of the rebar [1]. The corrosion of the rebar causes the concrete to expand and crack [2], leading to the premature failure of a structure and reducing the designated service life of buildings and infrastructure [3].
The corrosion of concrete occurs in both typical environments and marine environments, with distinct differences in the sources of chloride ions and the corrosion mechanisms. In typical environments, the chloride ions responsible for concrete corrosion primarily infiltrate the concrete through rainwater or rivers [4]. In contrast, in marine environments, chloride ions mainly originate from seawater and sea salt particles in the air [5]. As a result, concrete in marine environments is exposed to higher and more frequent concentrations of chloride ions, making it more prone to cracking and spalling [6]. Conversely, in general environments, where chloride ion concentrations are lower, localized pitting corrosion is more common [7]. De et al. [8] mentioned in their paper that uniform corrosion in reinforced concrete structures leads to the degradation of mechanical properties, which is reflected in stress and strain behaviors. The randomness in the depth and location of localized corrosion causes the mechanical properties of the structure to evolve in a more complex manner. In their study, bridge piers subjected to uniform corrosion exhibited significant spalling of the concrete protective layer and the development of cracks, particularly on the side facing the sea. Similarly, based on the analysis and images presented in the study of Zucca et al. [9], the corroded reinforced concrete bridge piers also experienced significant concrete spalling, with a corresponding reduction in the diameter and cross-sectional area of both longitudinal and transverse reinforcement.
Currently, there is extensive research on the corrosion of reinforced concrete [10,11,12]. Yuan et al. [13] studied the relationship between the mass loss rate, the corrosion height, and the seismic performance of bridge piers through numerical simulations. Li et al. [14] proposed a constitutive model based on the modified compression field theory, finding that the shear strength of concrete columns significantly decreases under high corrosion rates and high axial loads. Miao et al. [15] used numerical simulations to investigate the failure mode of longitudinal reinforcement under chloride ion attack, discovering a shift from column failure to beam failure over time. Samaneh et al. [16] developed a post-corrosion bond–slip model for ultra-high-performance concrete (UHPC), which showed good agreement with actual results. Musab et al. [17] studied the relationship between the degree of corrosion in recycled concrete and the content of recycled aggregates, with experimental results showing that a higher aggregate content leads to a more pronounced increase in the corrosion rate due to the high water absorption of recycled aggregates. Lin et al. [18] conducted a study on four different corrosion rates of reinforced concrete and found that the bond strength significantly increased at a 5% corrosion rate. However, as the corrosion rate increased and cracks developed, the bond strength rapidly decreased, with cracks forming at a 45-degree angle from the top. Christos et al. [19] used carbon fiber-reinforced polymers to mitigate the adverse effects of steel reinforcement corrosion. The experimental results showed that the restraining effect of carbon fiber-reinforced polymers was evident even at a high corrosion rate of 12%. Tung et al. [20] studied the shear strength of corroded reinforced concrete with steel fiber reinforcement and found that the shear span-to-depth ratio had a more significant impact on the shear strength of the concrete compared to the shear reinforcement ratio.
Although there has been substantial research on the corrosion of reinforced concrete, there are few studies on the corrosion rate of rebar in ultra-high-performance concrete (UHPC). This paper measures the corrosion rate in normal concrete and UHPC short columns, using accelerated corrosion testing methods to compare and analyze the cracking phenomena and rebar corrosion at different durations of electric current exposure.

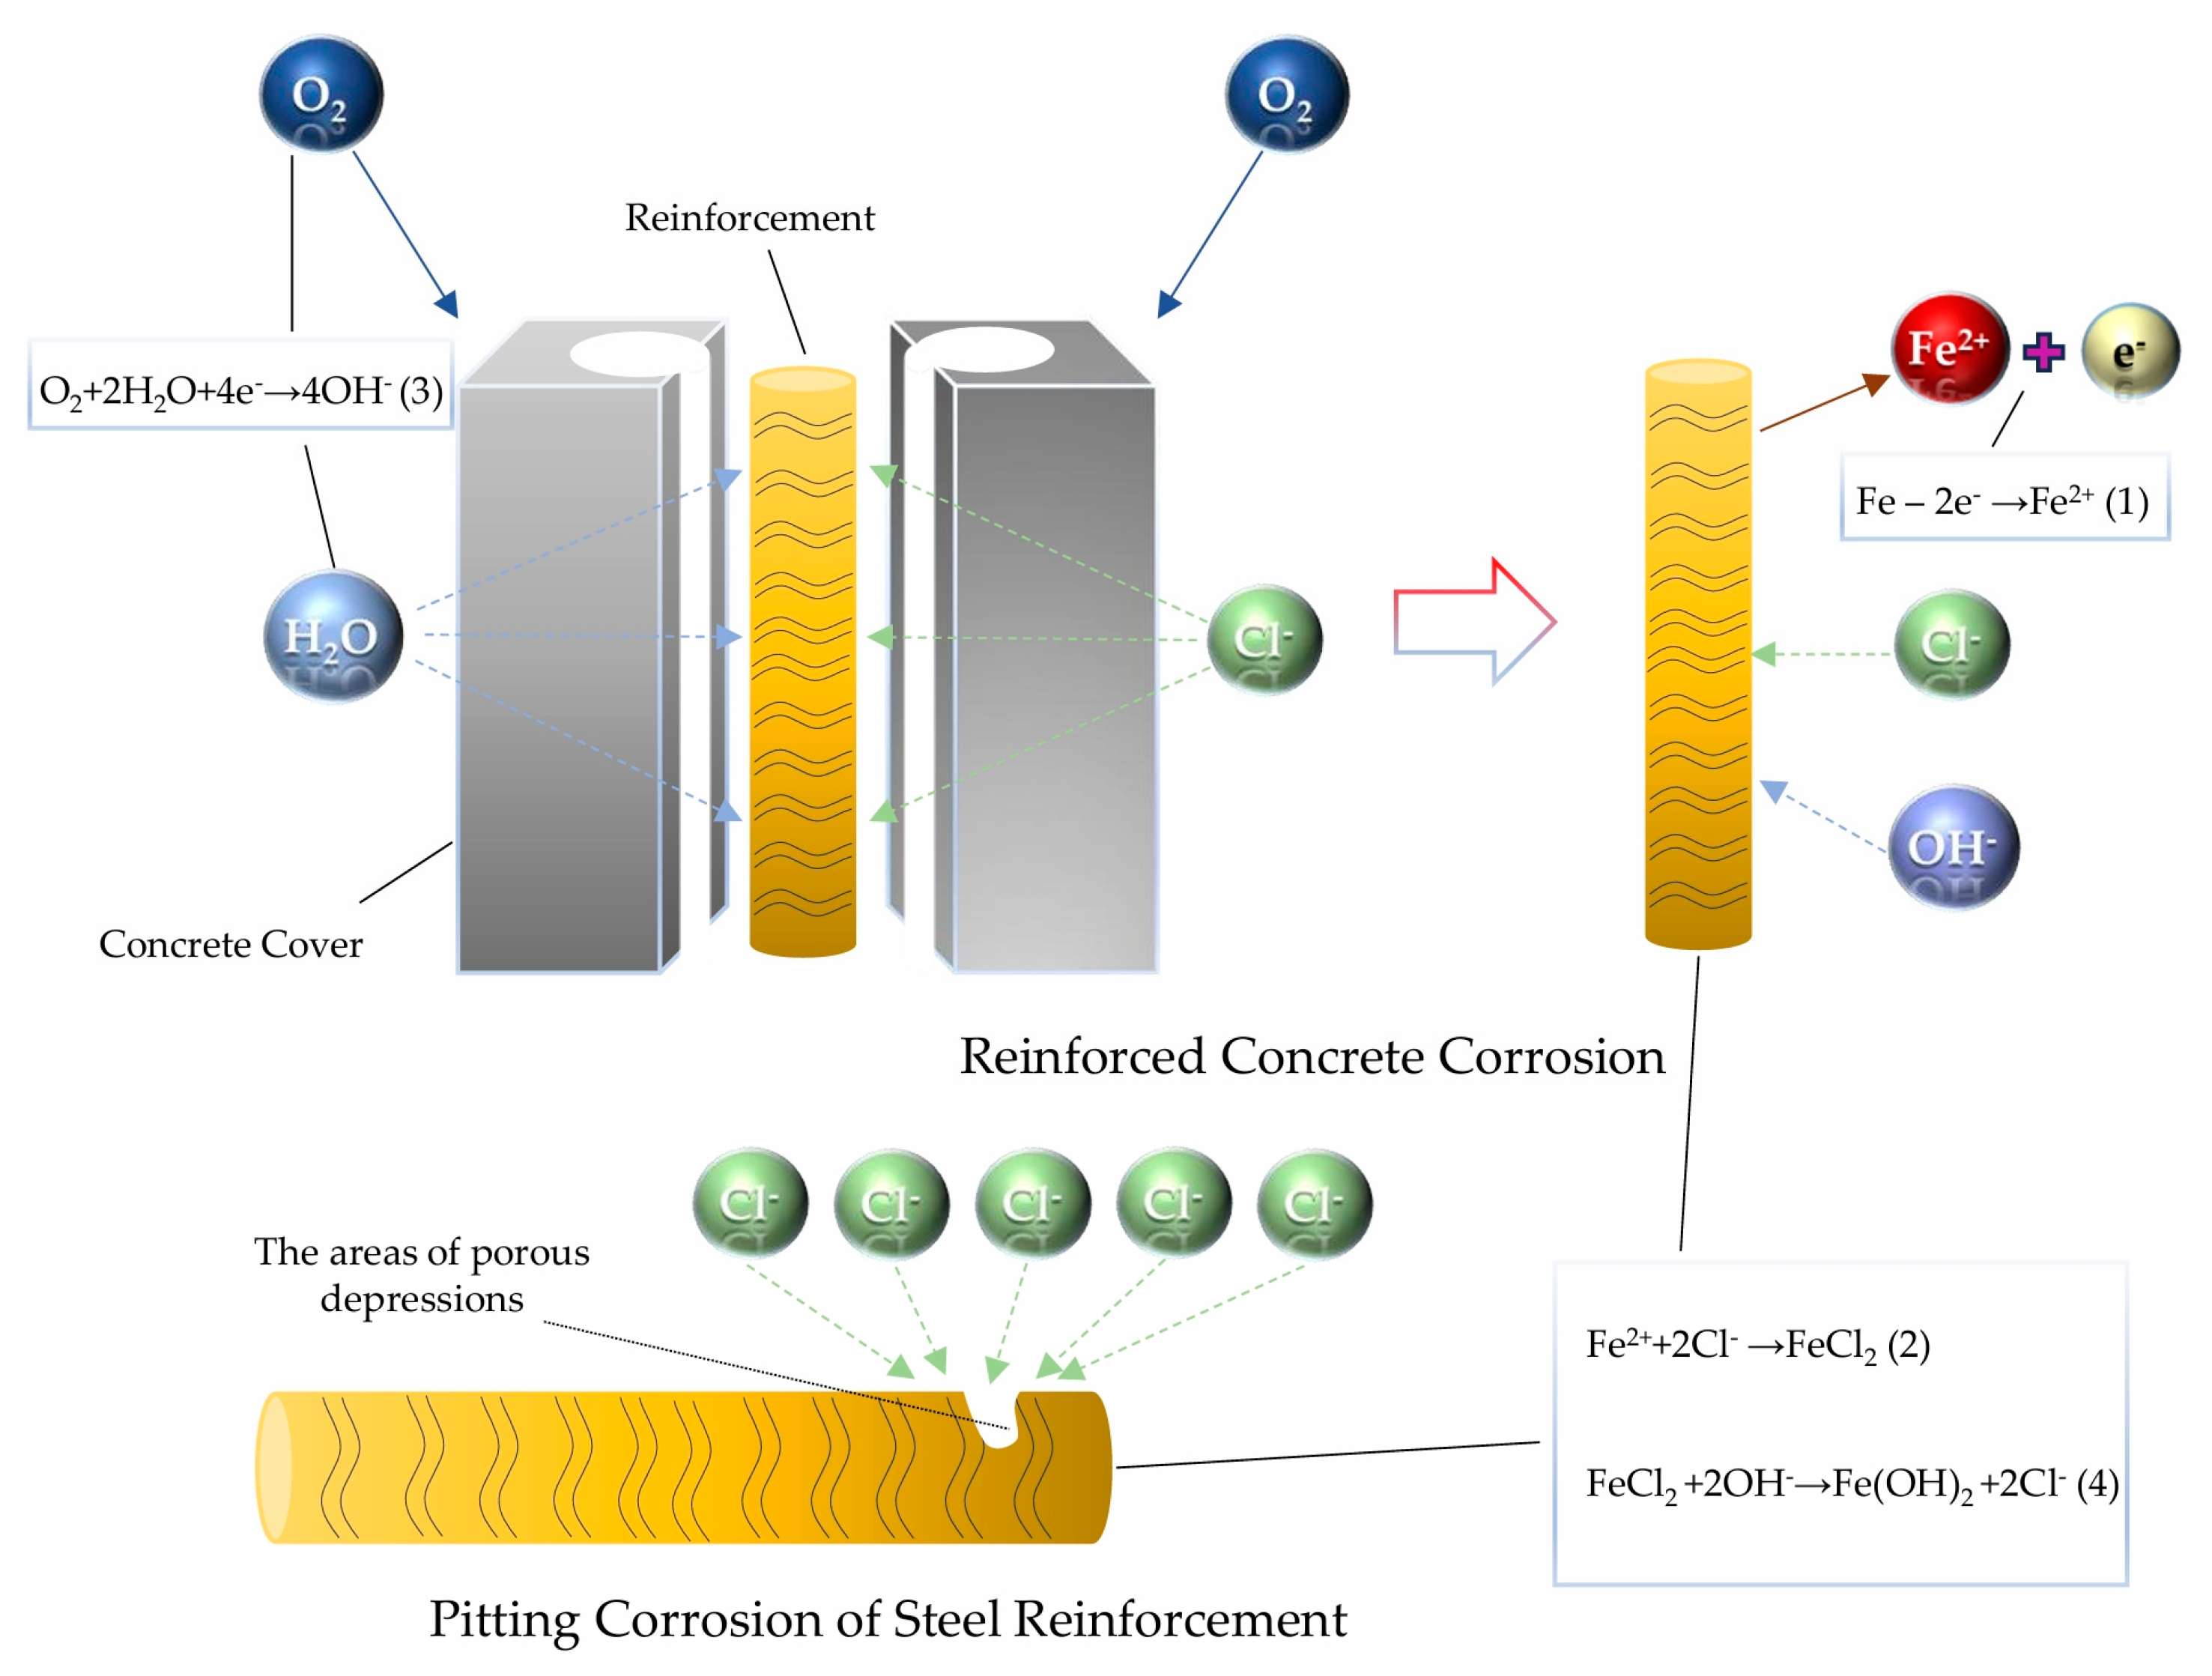
2. The Corrosion Mechanism of Reinforced Concrete

The corrosion of reinforced concrete occurs when chloride ions from the natural environment penetrate through the concrete’s pores, thereby destroying the protective layer on the steel reinforcement [21]. Generally, chloride ions enter concrete through free diffusion, hydrostatic pressure, and capillary absorption [22]. Once chloride ions penetrate the concrete cover and reach the steel surface, localized pitting corrosion is likely to occur [23]. This is because the surface of the steel is not perfectly smooth; hence, chloride ions are more likely to adhere to porous or recessed areas, leading to corrosion [24], as illustrated in Figure 1.
The corrosion process of steel reinforcement can be described as a microcell reaction occurring under the combined effects of water and air [25]. Various electrochemical reactions take place during corrosion, but the fundamental requirement is the presence of both ion and electron pathways [26]. During this process, ferrous ions (Fe2+) produced at the positive electrode enter the solution and react with chloride ions to form ferrous chloride (FeCl2) (Equation (1)). Electrons then travel through the steel to the negative electrode, where they react with water (H2O) and oxygen (O2) to form hydroxide ions (OH) (Equation (2)). Finally, hydroxide ions react with ferrous chloride to form the precipitate ferrous hydroxide (Fe(OH)2) (Equation (3)). Figure 1 illustrates the schematic of the corrosion reaction process of steel.
Fe 2 e Fe 2 +
Fe 2 + + 2 Cl 2 FeCl 2
O 2 + 2 H 2 O + 4 e 4 OH
FeCl 2 + 2 OH Fe OH 2 + 2 Cl
During the corrosion process, chloride ions (Cl) continuously participate in the electrochemical reactions, accelerating the transformation of ferrous ions (Fe2⁺) into hydroxide precipitates, without being consumed themselves. Therefore, as the concentration of chloride ions increases, the electrochemical process speeds up, with chloride ions acting as a catalyst [27].

3. Design of Reinforced Concrete Corrosion Testing

3.1. Corrosion Method

The corrosion methods for reinforced concrete specimens currently include natural corrosion, artificial climate simulation, and accelerated corrosion using applied current [28].
Natural corrosion involves exposing concrete specimens to real environmental conditions over an extended period to induce corrosion in the reinforcing steel, thereby assessing its durability. This method accounts for factors such as climate variation, humidity, temperature, and CO2 concentration. However, due to the long experimental period required, it is rarely used in research [29,30].
Artificial climate simulation is conducted in multi-functional climate chambers where parameters such as temperature, humidity, oxygen content, light duration, CO2 concentration, and chloride ion concentration are controlled to accelerate corrosion [28]. This method involves two stages: initiating corrosion and accelerating it. For instance, Ye et al. [31] induced and accelerated corrosion by subjecting specimens to a dry–wet cycle for 32 days followed by a humid environment. Compared to natural corrosion, artificial simulation offers a shorter corrosion duration and better simulates actual corrosion environments.
Accelerated corrosion using applied current is based on electrochemical principles, where an external current is applied to speed up the corrosion process. In this method, the reinforcing steel acts as the positive electrode, while a counter electrode serves as the negative electrode, with an electrolyte solution facilitating the corrosion [7]. The steel connected to the positive terminal undergoes oxidation, while the steel connected to the negative terminal undergoes reduction. This method, which forces electrochemical reactions in the specimen’s steel, has relatively low requirements for the experimental environment and demonstrates good adaptability [32]. Among the three corrosion testing methods, this study proposes using accelerated corrosion with applied current for testing short columns and bridge piers.

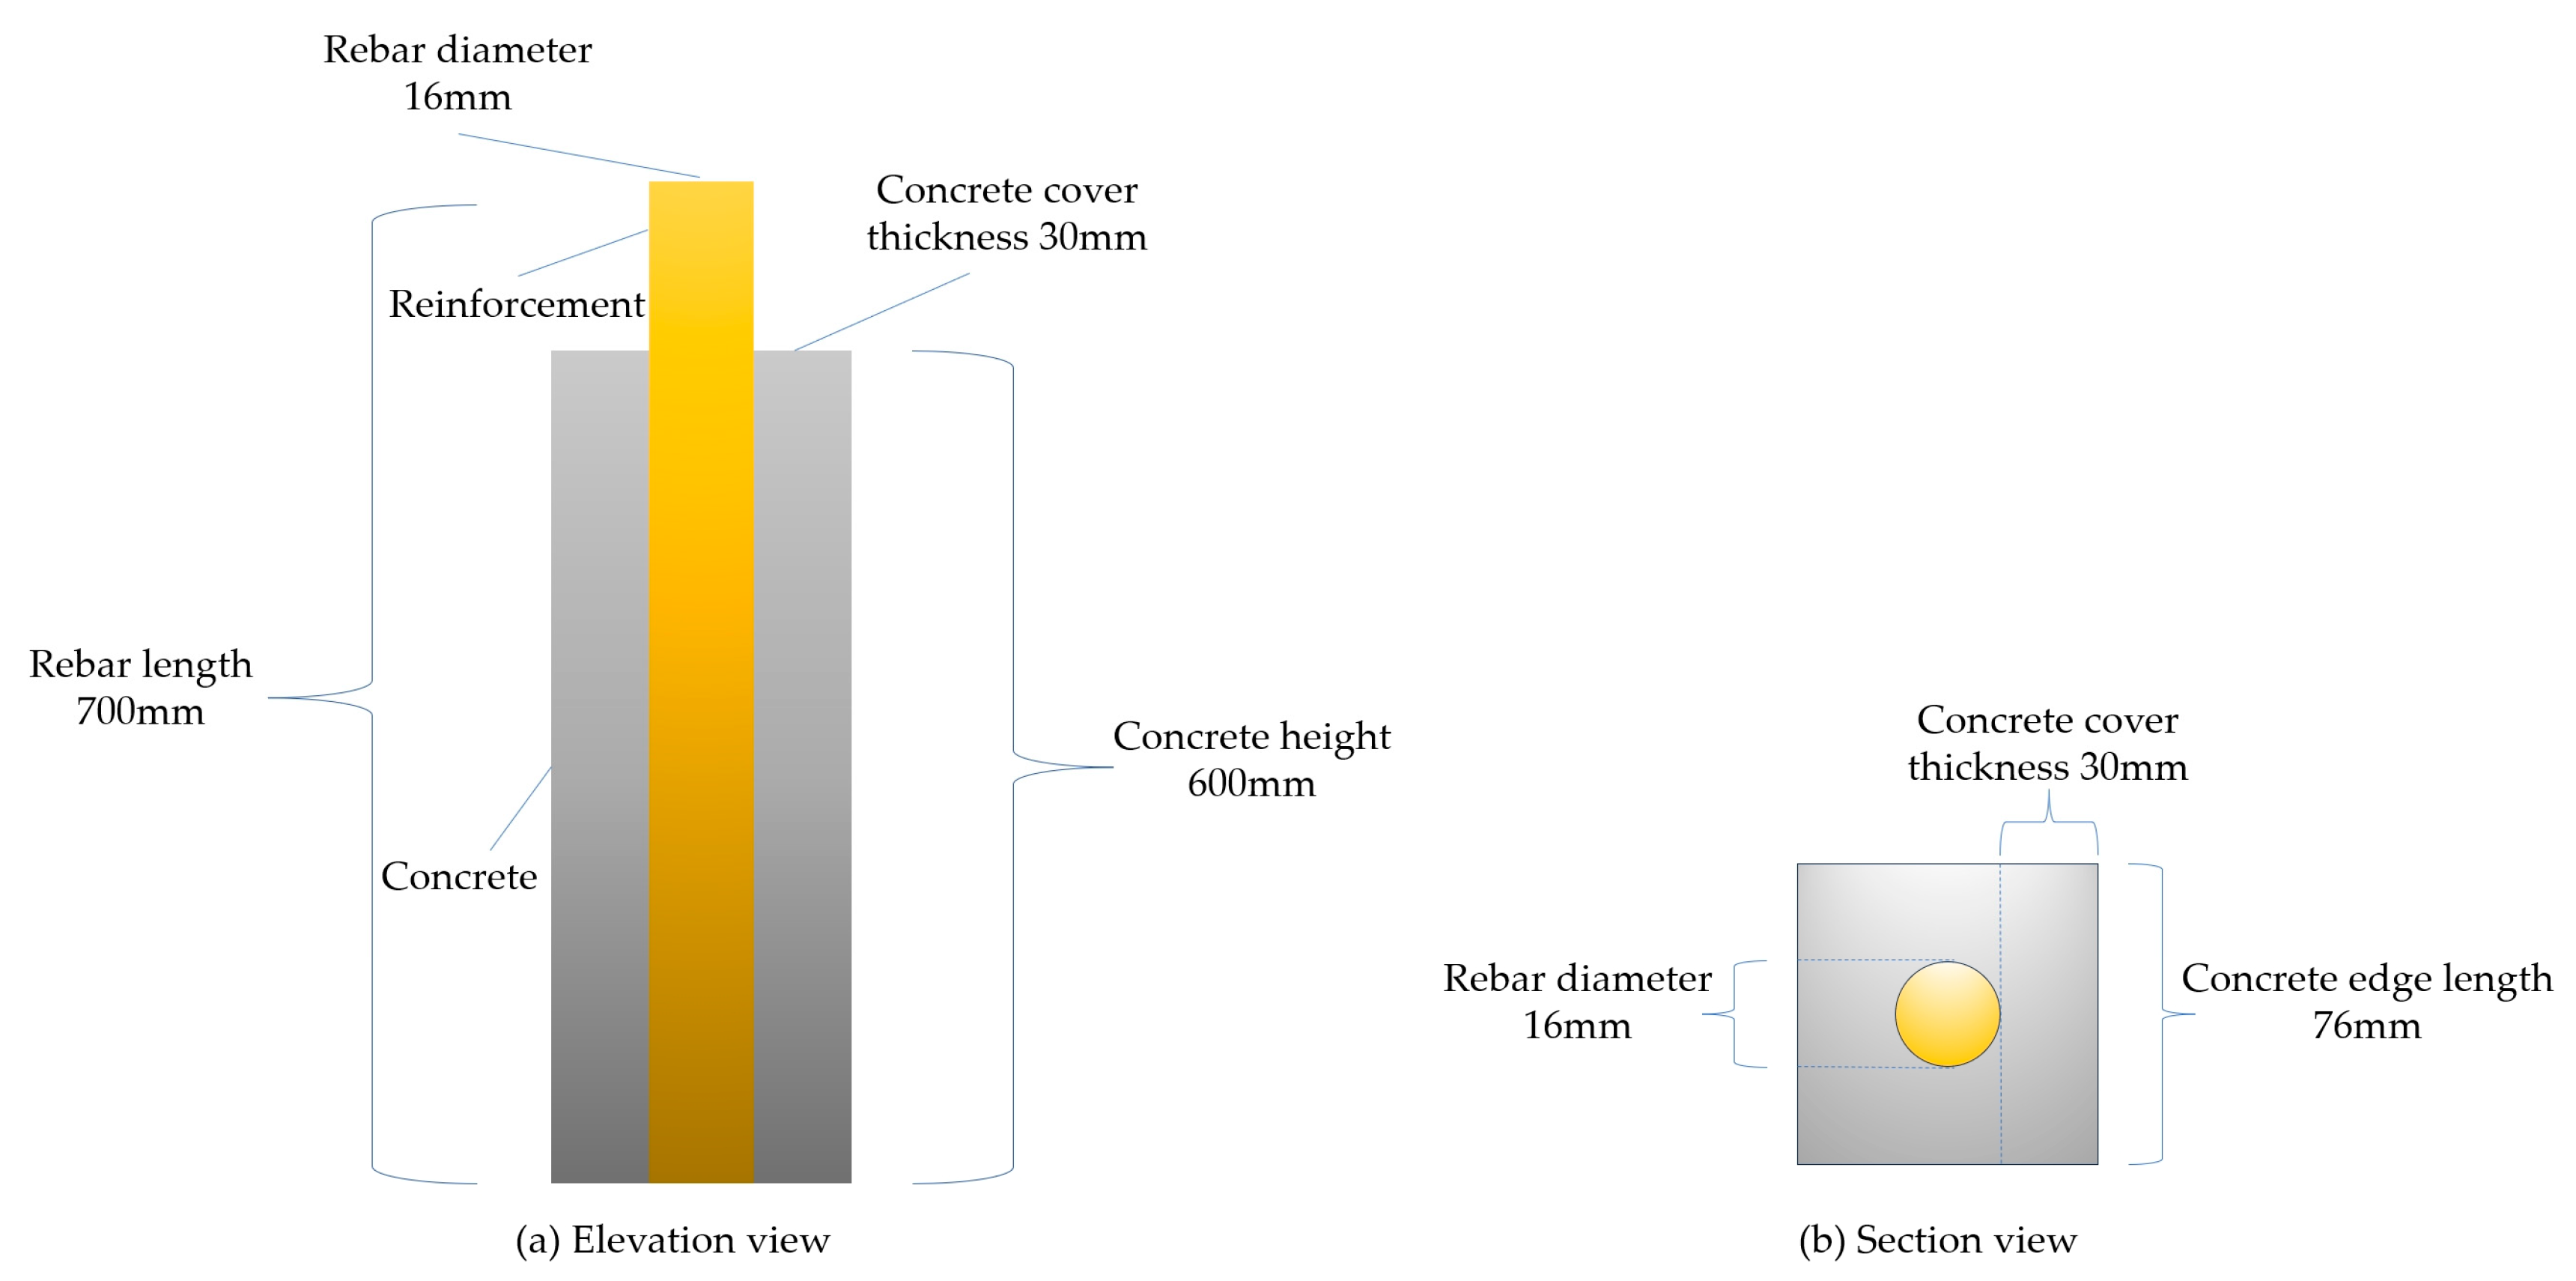
3.2. Preparation of Concrete and UHPC Short Column Specimens

The UHPC material was supplied by Jiangsu Sobute New Material Co., LTD. For one cubic meter UHPC, the mixture properties were 2232 kg preblended powder, 195 kg steel fiber (2.5% volume ratio), 199 kg water, and 15 kg superplasticizer. Normal concrete (NC) and steel reinforcement were provided by Smart Manufacturing of China Design Group in Yancheng, China. For one cubic meter NC, the mixture properties were 469 kg 42.5 cement, 1041 kg coarse aggregate, 122 kg fly ash, 150 kg water, 618 kg sand, and 6.6 kg water-reducing agent. Based on Chinese code GB/T50152-2012 [33] and Swiss Code SIA 2052 [34], the material properties of concrete were determined. The mechanical properties of normal concrete and UHPC are shown in Table 1, where fc,n and fc,u represent the cube compressive strength of concrete and UHPC, respectively; fck,n and fck,u represent the cylinder compressive strength of concrete and UHPC, respectively; and ft,u represents the dog–bone tensile strength of UHPC. Additionally, according to the data provided by these commercial companies, the porosity, sorptivity, and water absorption were 1.31%, 0.013 mm/min1/2, and 0.29% for UHPC, while they were 9.04%, 0.027 mm/min1/2, and 3.64% for NC.
Nine normal concrete specimens (N1–N9) and nine UHPC specimens (U1–U9) were fabricated for the experiment. To accurately reflect the actual corrosion condition of the reinforcement within the columns, the specimens used 16 mm diameter steel bars, the same as those used in the columns. The cover thickness was 30 mm, and no cover was applied at the bottom of the specimens to simulate the joint surface. The specimen dimensions are shown in Figure 2.
As shown in Figure 3, the short column specimens were placed vertically on either side of the container. The 500 mm high portion of the specimens was fully immersed in a 5% sodium chloride solution. The exposed steel bars at the top of the specimens were connected to the positive terminal of a DC power supply, while the stainless steel mesh was connected to the negative terminal.
Before corrosion testing, the average initial weight of the specimens was used as a reference. Steel bars with a weight deviation greater than 2% from the average were replaced. Additionally, one steel bar was selected as a reference for subsequent acid-washing calibration. The small specimen molds were made of wood, and the materials were cast using concrete and UHPC from the same batch as the bridge piers, with simultaneous casting. The specimens were cured in a standard curing room for 28 days. Afterward, they were placed in a natural environment for 3 months before testing was conducted.

3.3. Determination of Accelerated Corrosion Parameters

In electrical accelerated corrosion testing, Faraday’s laws are commonly used to determine various parameters. The specific equations are as follows [35,36]:
Δ m = M I t F n
I = i A
In the equation above, ∆m is the mass loss of the steel (kg); M is the molar mass of the corroded metal (g/mol), with the molar mass of iron being 55.845 × 10⁻³ kg/mol; I is the corrosion current (A); t is the duration of the current (h); i is the current density (A/m2); A is the corrosion surface area (m2); F is Faraday’s constant (96485 A·s); and n is the absolute value of the valence of the steel corrosion product, with n being 2 for ferrous ions.

3.3.1. Current Density

Under natural conditions, the corrosion current density of steel reinforcement in concrete fluctuates with environmental changes and gradually increases over time, typically remaining below 10 μA/cm2 [37]. For specimens subjected to accelerated corrosion methods, the corrosion current density is significantly higher than that under natural conditions and is maintained at a constant value. Liu et al. [38] used a current density of 200 μA/cm2 in their accelerated corrosion tests, Zhao et al. [39] controlled the current at 300 μA/cm2, and Wang et al. [40] maintained a constant current density of 900 μA/cm2 during their tests. However, there is currently no unified standard method for accelerated corrosion testing. Additionally, no research has yet demonstrated that different current intensities have varying effects on the corrosion of reinforced concrete. In theory, to observe the corrosion patterns of the specimens, it is only necessary to ensure that the current intensity is not excessively high, which would otherwise cause rapid corrosion. This approach can effectively simulate the corrosion phenomena of reinforced concrete under natural conditions.
In this experiment, considering factors such as field conditions and the proximity of accelerated corrosion to natural conditions, the corrosion current density was determined to be 900 μA/cm2.

3.3.2. Corrosion Height

Corrosion height refers to the height of the specimen immersed in the sodium chloride solution during the accelerated corrosion process. The corrosion height of the short column specimens was consistent with that of the bridge pier to reflect the actual corrosion rate. According to the Chinese standard JTG/T 2231-02—2021, the height of the potential plastic hinge region in the bridge pier is calculated based on Equation (7) [41].
l p = 0.08 l + 0.022 d s f y 0.044 d s f y
In the equation above, lp is the plastic hinge height of the pier, l is the height of the pier column, ds is the diameter of the longitudinal reinforcement, and fy is the yield strength. According to this equation, the plastic hinge height of the pier column in this experiment was 284.8 mm, and the height of the pier’s stirrup reinforcement zone was 500 mm. Therefore, a corrosion zone height of 500 mm above the cap was selected.

3.3.3. Theoretical Corrosion Rate

The relationship between the corrosion rate p t , corrosion time t, and current density i in this experiment can be derived from Equation (5) [42].
p t = M i A t F n
After determining the length of the corrosion section and combining it with the steel bar parameters used during specimen fabrication, the theoretical corrosion mass of the steel bars corresponding to different corrosion rates could be obtained. The theoretical corrosion rate of a single short column specimen was calculated using the surface area of the steel bars within the corrosion height range and the current density, according to Equation (8) [43]. The parameters for accelerated corrosion are shown in Table 2.

3.3.4. The Actual Corrosion Rate

According to the Chinese standard GB/T50082-2009 [44], the actual corrosion rate of the rebar is calculated as shown in Equation (9).
L g = g 0 g g 01 g 1 + g 02 g 2 2 g 0 × 100 %
In the equation above, Lg is the actual corrosion rate of the rebar (%), accurate to 0.01%; g0 is the mass of the uncorroded rebar; g is the mass of the corroded rebar after acid cleaning; g01 and g02 are the initial masses of two reference rebars; g1 and g2 are the masses of the two reference rebars after acid cleaning.

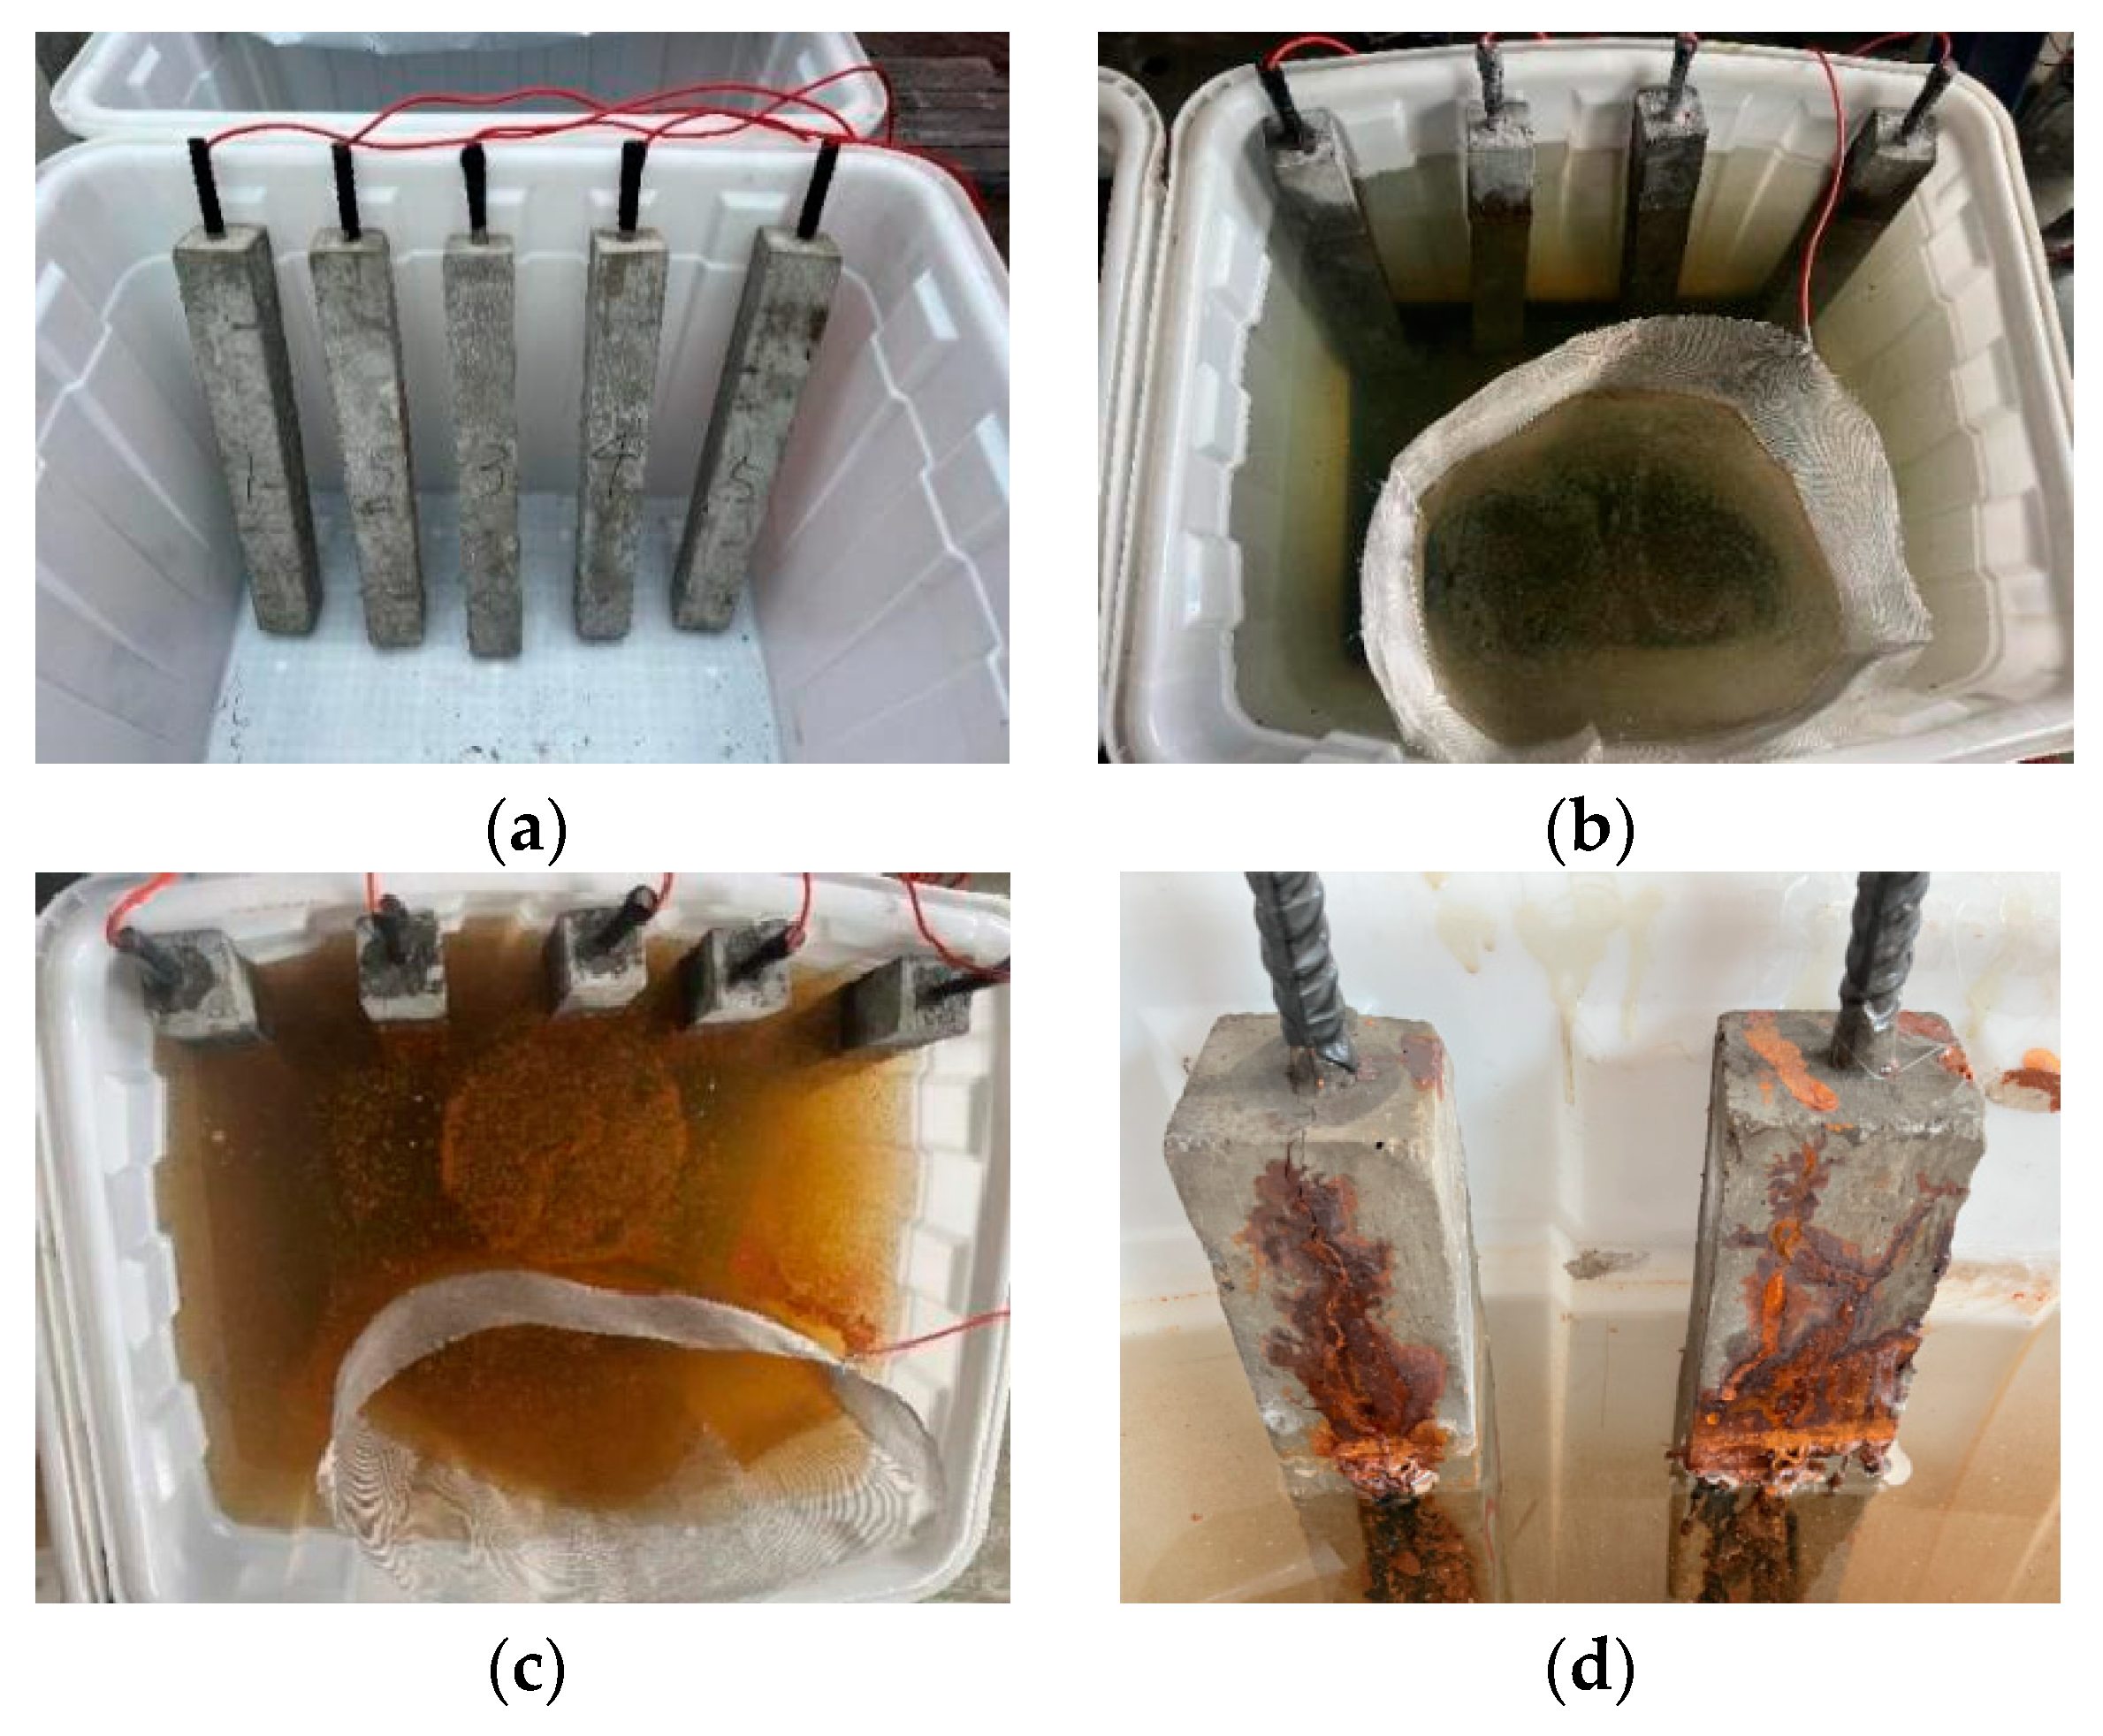
3.4. Accelerated Corrosion Testing Process

The specimens were placed on one side of the solution tank, and the stainless steel mesh (negative electrode) was fixed on the opposite side of the tank. The top steel bars of the short columns and the stainless steel mesh were connected to the positive and negative terminals of the power supply, respectively. A layer of epoxy resin was applied at the connection points, and after it solidified, they were wrapped with insulating tape. A 5% sodium chloride solution was added to a height of 500 mm and allowed to stand for 3 days before accelerated corrosion started. The accelerated corrosion testing process is shown in Figure 4.

4. Analysis of Accelerated Corrosion Results for Short Columns

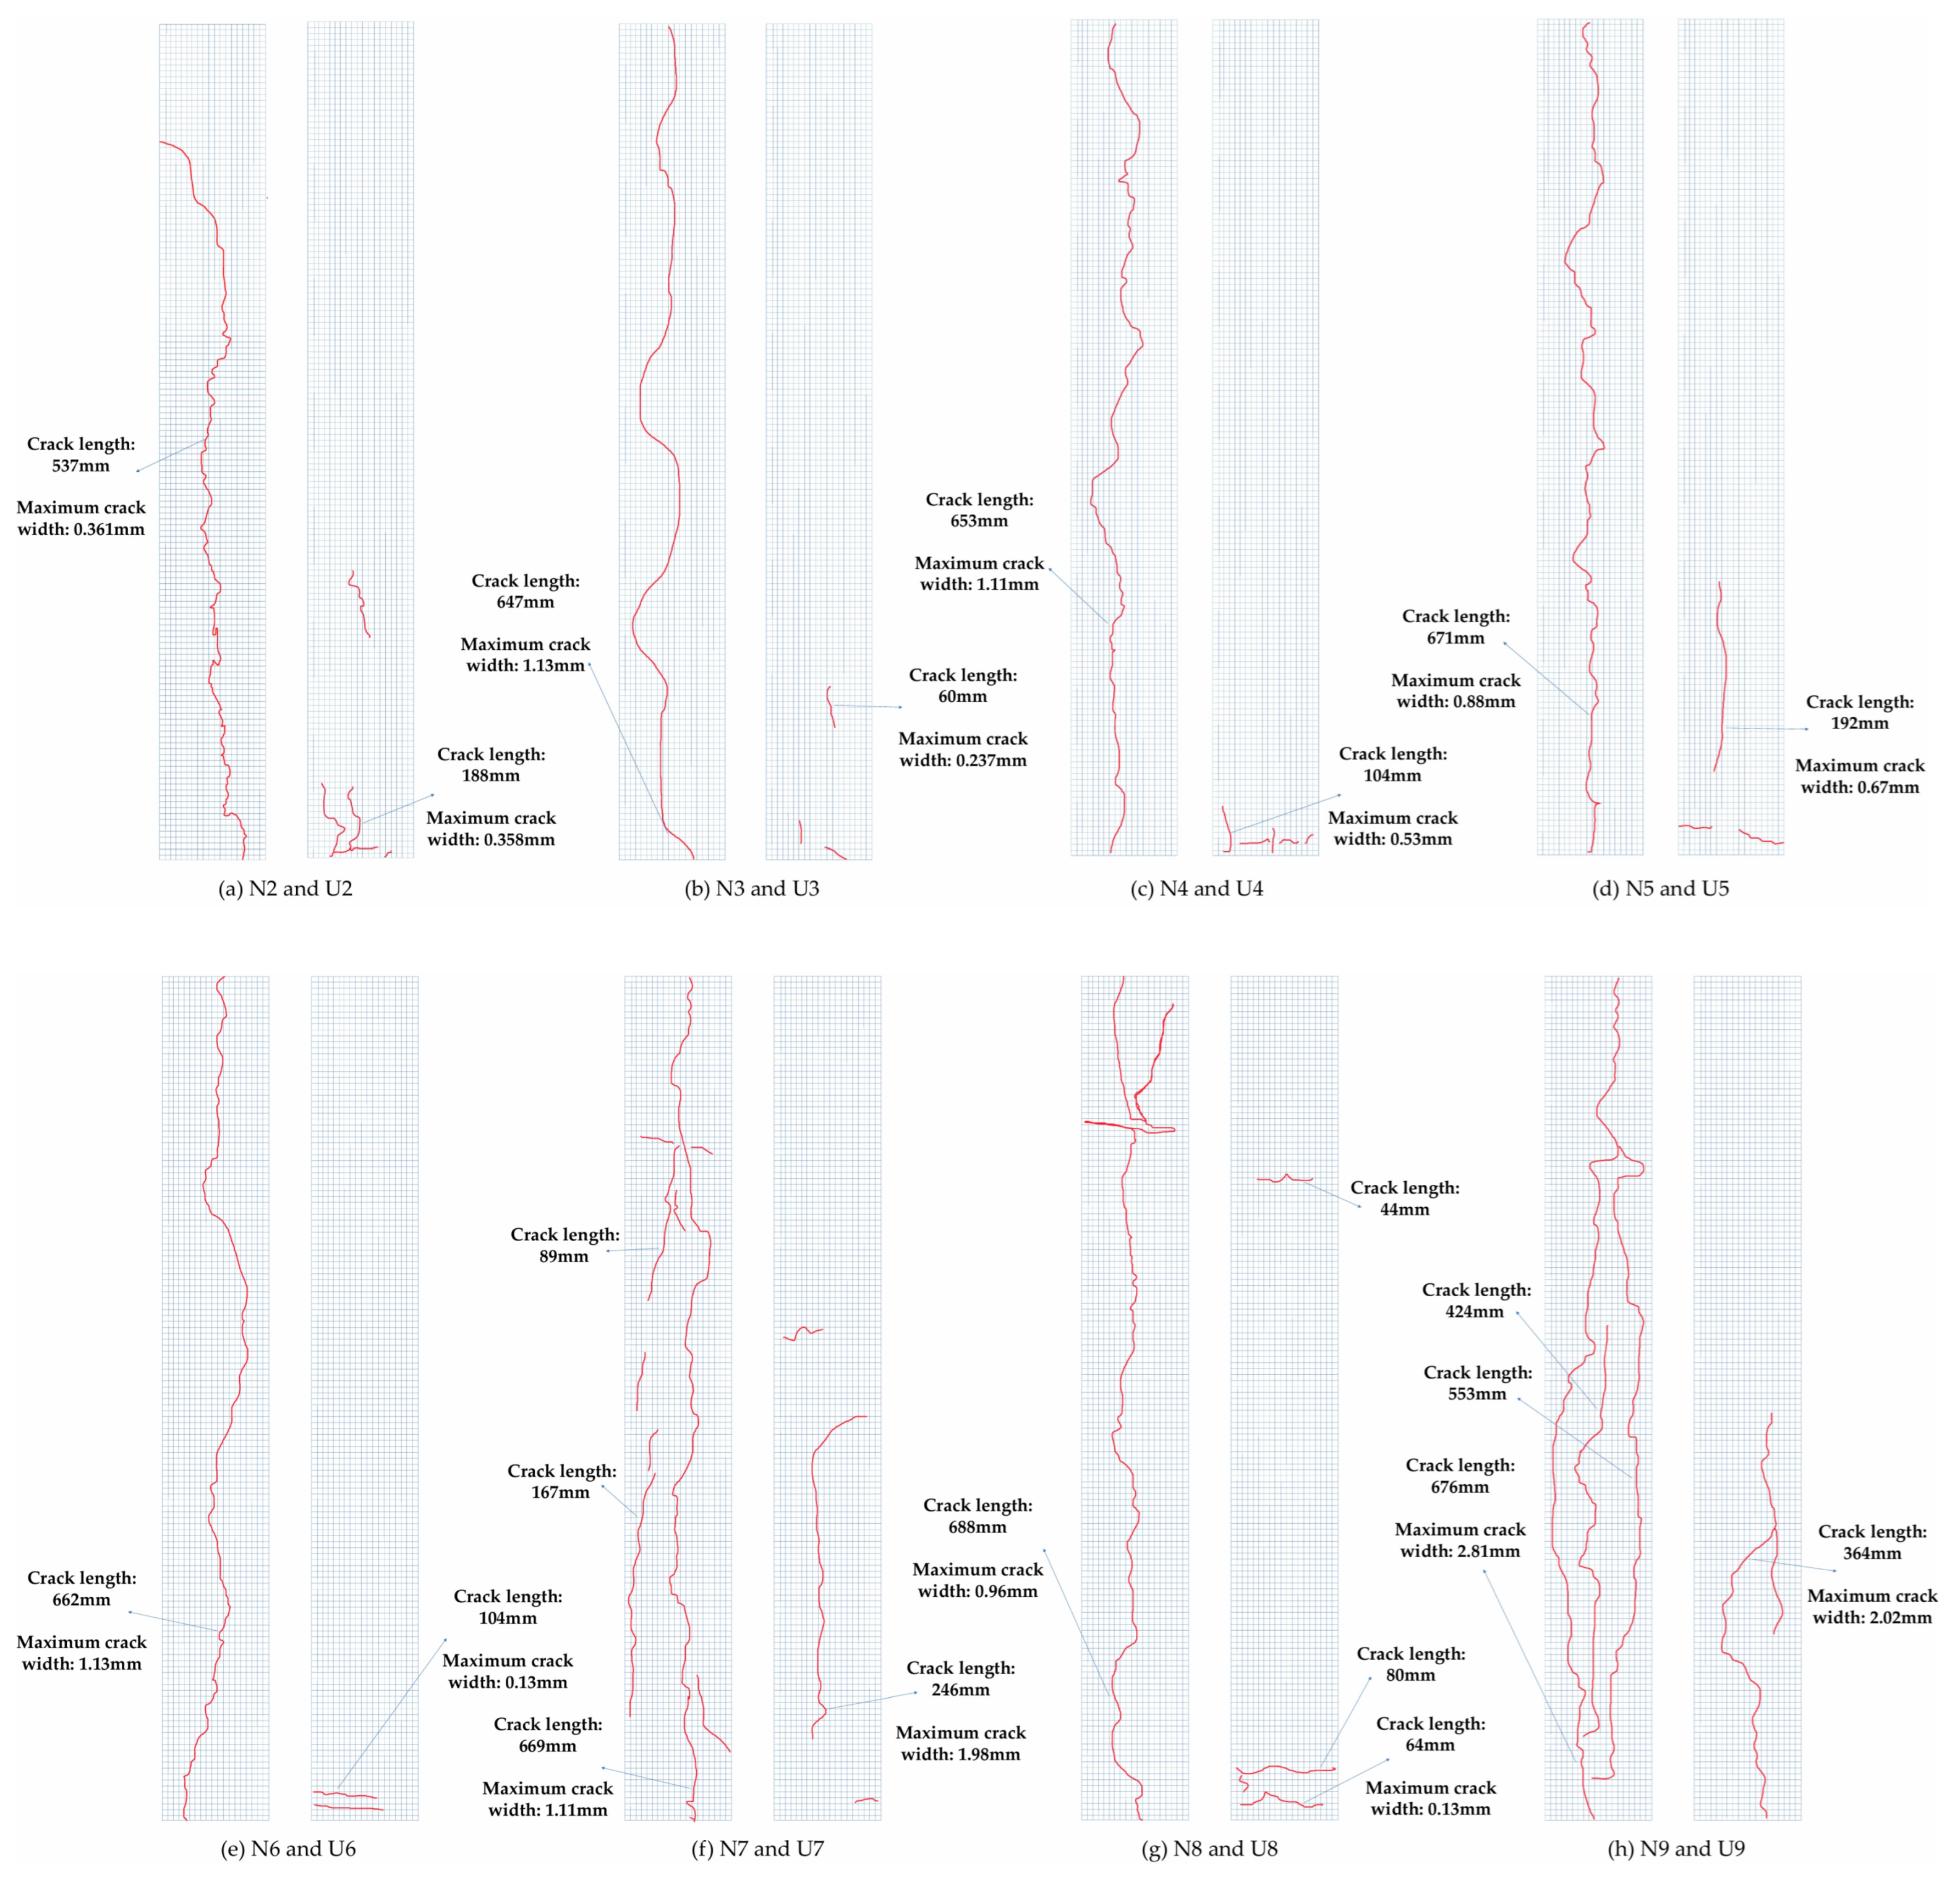
4.1. Analysis of Concrete Cracking Phenomena

The corrosion conditions of normal concrete (NC) and UHPC short columns are shown in Figure 5 and Figure 6, respectively. The diagram of the cracks in the NC and UHPC specimens is shown in Figure 7.
Except for the first set of specimens, all other specimens exhibited significant corrosion results. With the increase in the duration of electrical stimulation, corrosion products gradually accumulated at the cracks, and the width of the cracks progressively increased. No corrosion products were observed on the surfaces without cracks.
For specimens N2 to N9, with increasing corrosion severity, each specimen developed corrosion cracks that extended from the bottom upward, on one side. Starting from N3, cracks through the columns began to form. The width of the cracks and the corrosion products around them also increased, and corrosion products only appeared within the 500 mm range. Among them, specimens N2 to N8 developed a single main crack, while specimen N9 had three longitudinal main cracks.
Cracking phenomena in the UHPC specimens were less pronounced, though corrosion products did not show a significant decrease. Unlike the earlier formation of longitudinal cracks in the NC specimens, U1 to U3 showed more localized spot corrosion on one side, with no significant corrosion products on the other three sides. Starting from specimen U4, peeling appeared at the bottom.
The corrosion extent in the NC specimens was more pronounced compared to the UHPC specimens. On one hand, UHPC has a lower chloride ion permeability, leading to a significantly lower steel reinforcement corrosion rate in the early stages of accelerated corrosion. On the other hand, UHPC has better crack resistance compared to normal concrete, resulting in the delayed cracking of the UHPC specimens. The research results are similar to the findings of Zheng et al. [45], who observed that, as the degree of corrosion increases, concrete specimens develop more extensive cracks, often resulting in through-cracks from top to bottom.

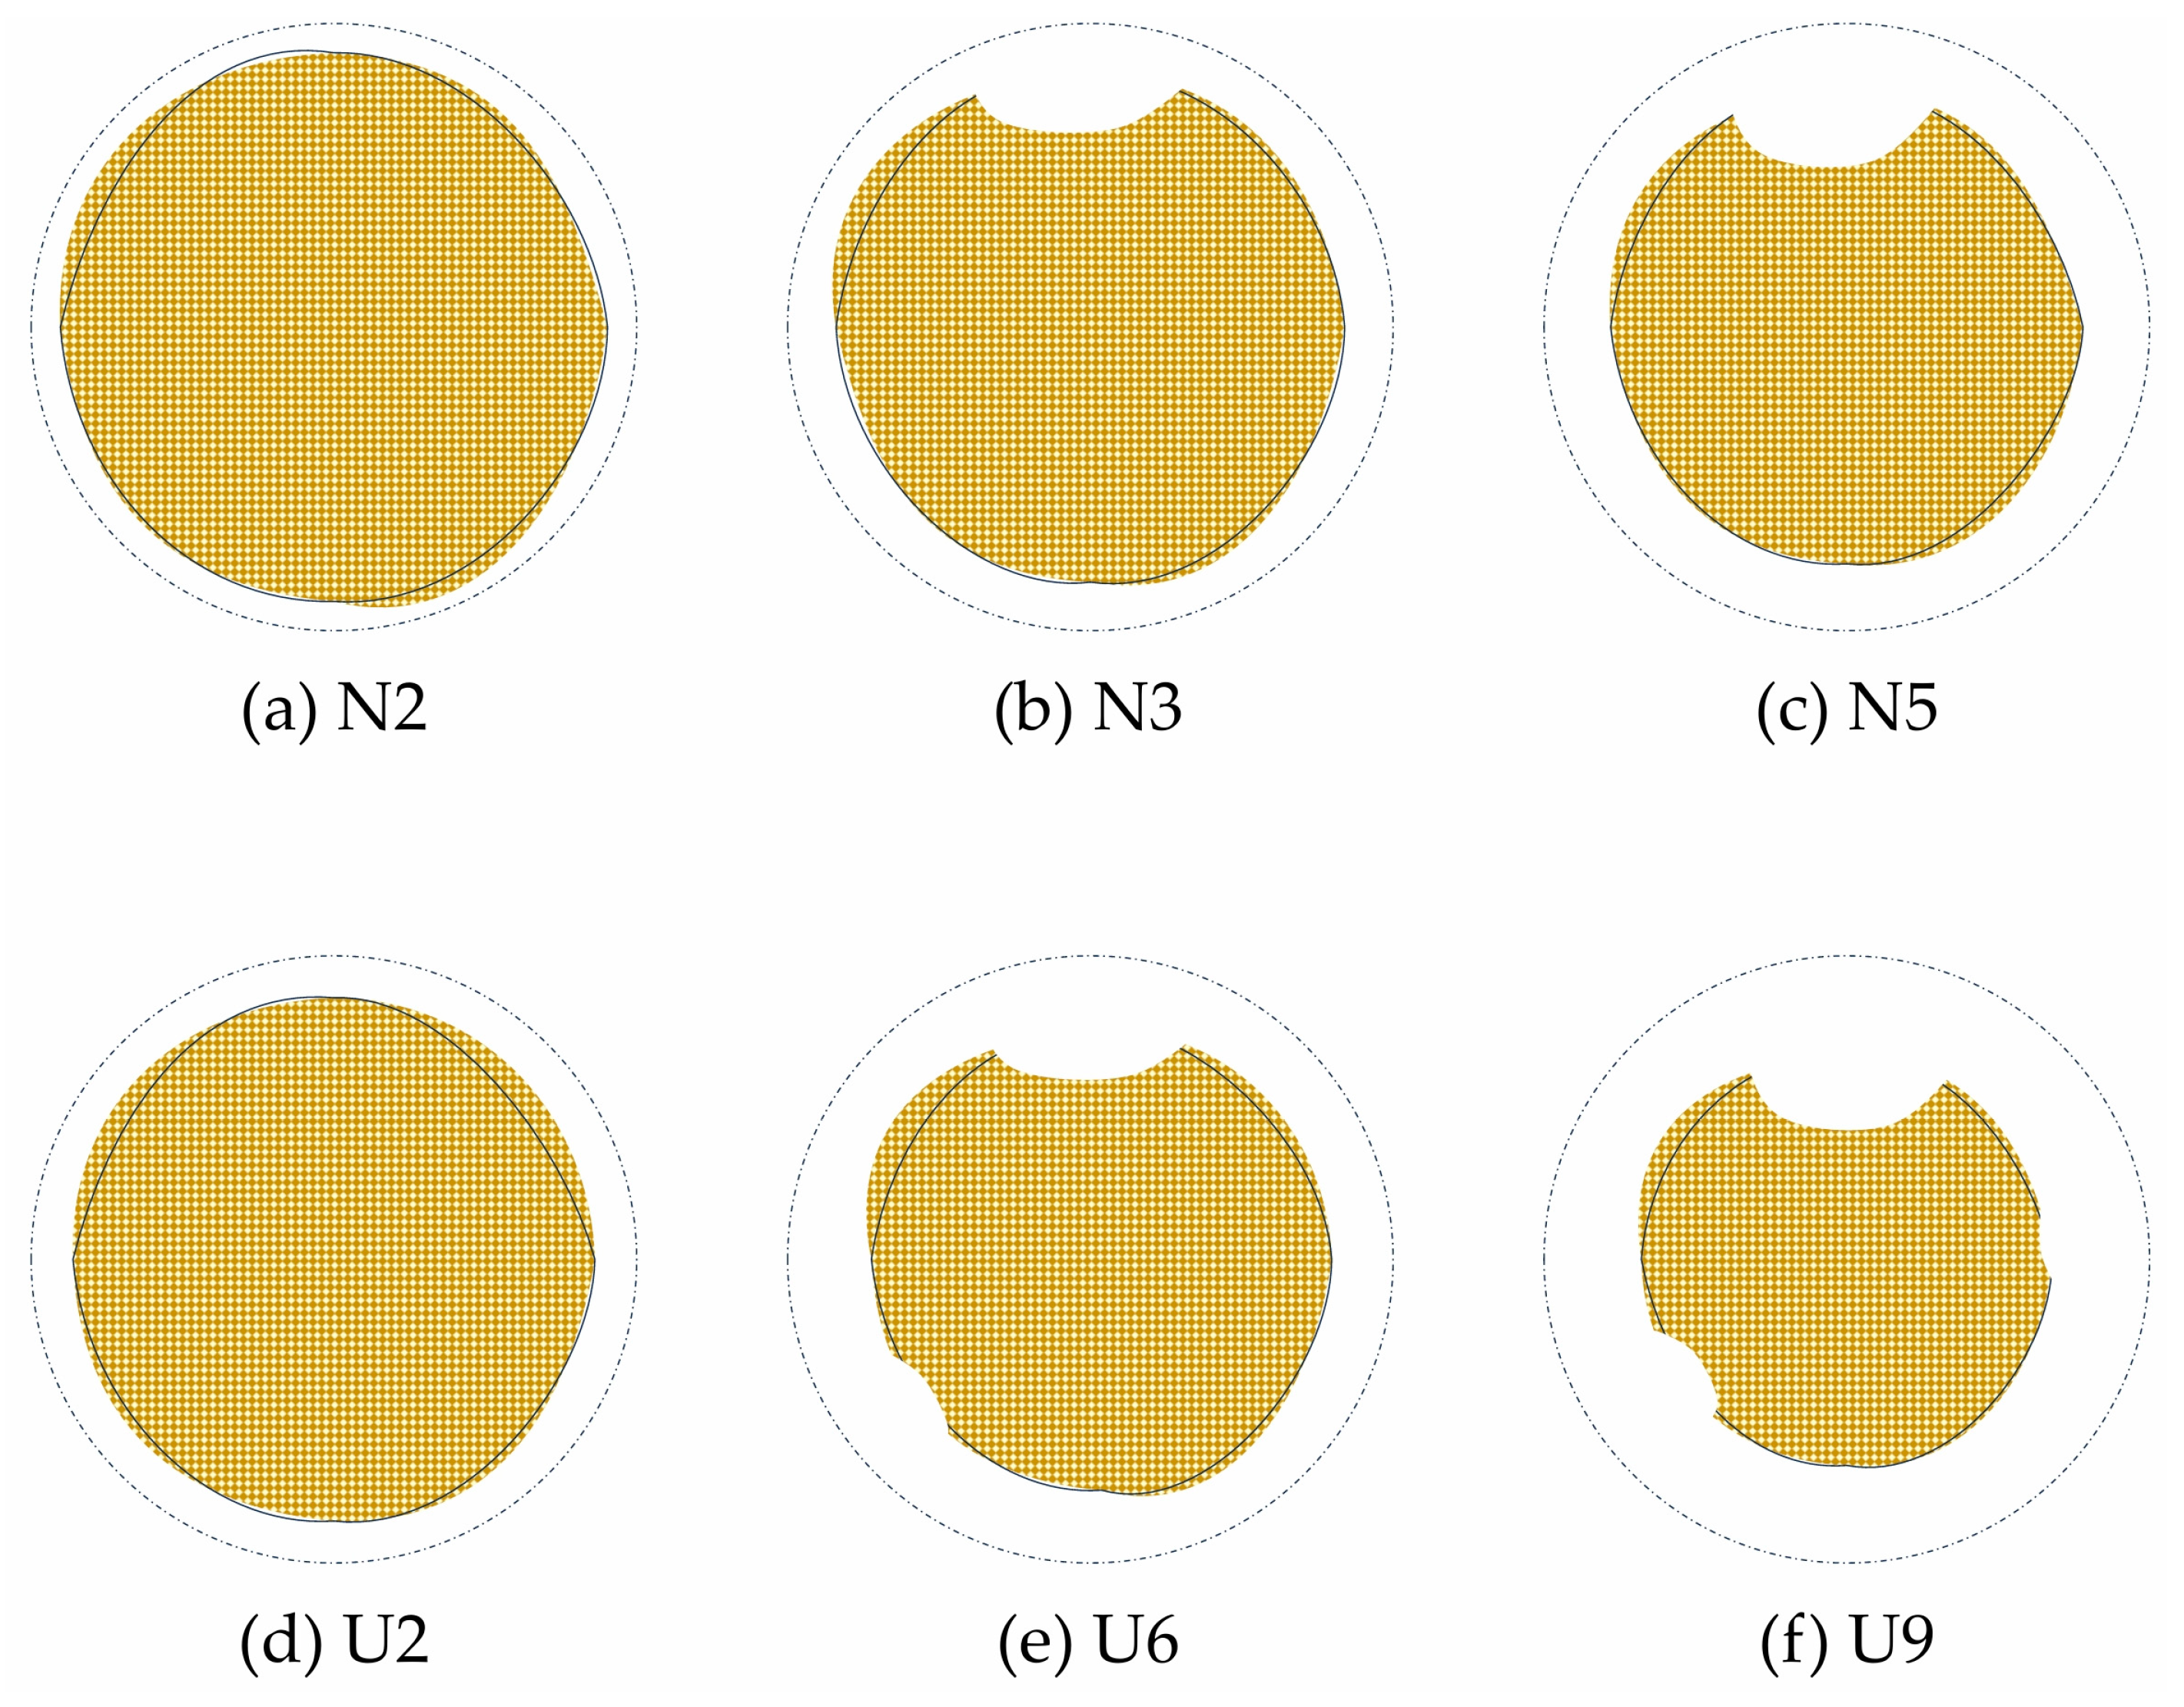
4.2. Analysis of Reinforcement Corrosion Phenomena

The actual corrosion of the reinforcement is shown in Figure 8. As the corrosion time increases, the corrosion of the reinforcement becomes progressively more evident.
For the concrete specimens, the reinforcement in the N2 specimen shows pitting corrosion on its surface. In the N3 specimen, noticeable uneven corrosion appears at the bottom of the reinforcement, with the cross-sectional area of the reinforcement on the side of the concrete cracks reducing significantly more than in other directions. Starting from the N5 specimen, the instances of uneven corrosion decrease, and the reinforcement exhibits more uniform corrosion along the cross-section. The cross-sectional corrosion of the reinforcement is illustrated in Figure 9.
For the UHPC specimens, the reinforcement in specimen U2 exhibited pitting corrosion on the surface. Subsequently, corrosion progressed slowly without significant uneven corrosion; however, the corrosion at the bottom of the reinforcement was more severe compared to the concrete specimens, with noticeable reductions in both the cross-sectional area and length. From specimen U6 onward, uneven corrosion began to appear at the bottom of the reinforcement. As the electrification duration increased, the corrosion phenomena moved upwards, with corrosion products mainly concentrated on the side of the corrosion cracks. Similar to the experimental results in this paper, Zheng et al. [45] also found that the corrosion of a reinforcement is more severe in locations where cracks develop in the concrete. Furthermore, as the degree of corrosion increased, the cross-sectional area of the reinforcement also decreased.
Due to the lack of protective layers, such as mortar at the bottom of the rebar, both the concrete and UHPC short columns experienced a reduction in length during the corrosion process. As shown in Table 3, compared to the concrete specimens, the UHPC specimens exhibited a greater length change with increasing corrosion levels. This is likely because the strong durability of UHPC makes it difficult for the internal rebar to corrode effectively, resulting in corrosion being concentrated only at the joint areas under the electrical current.

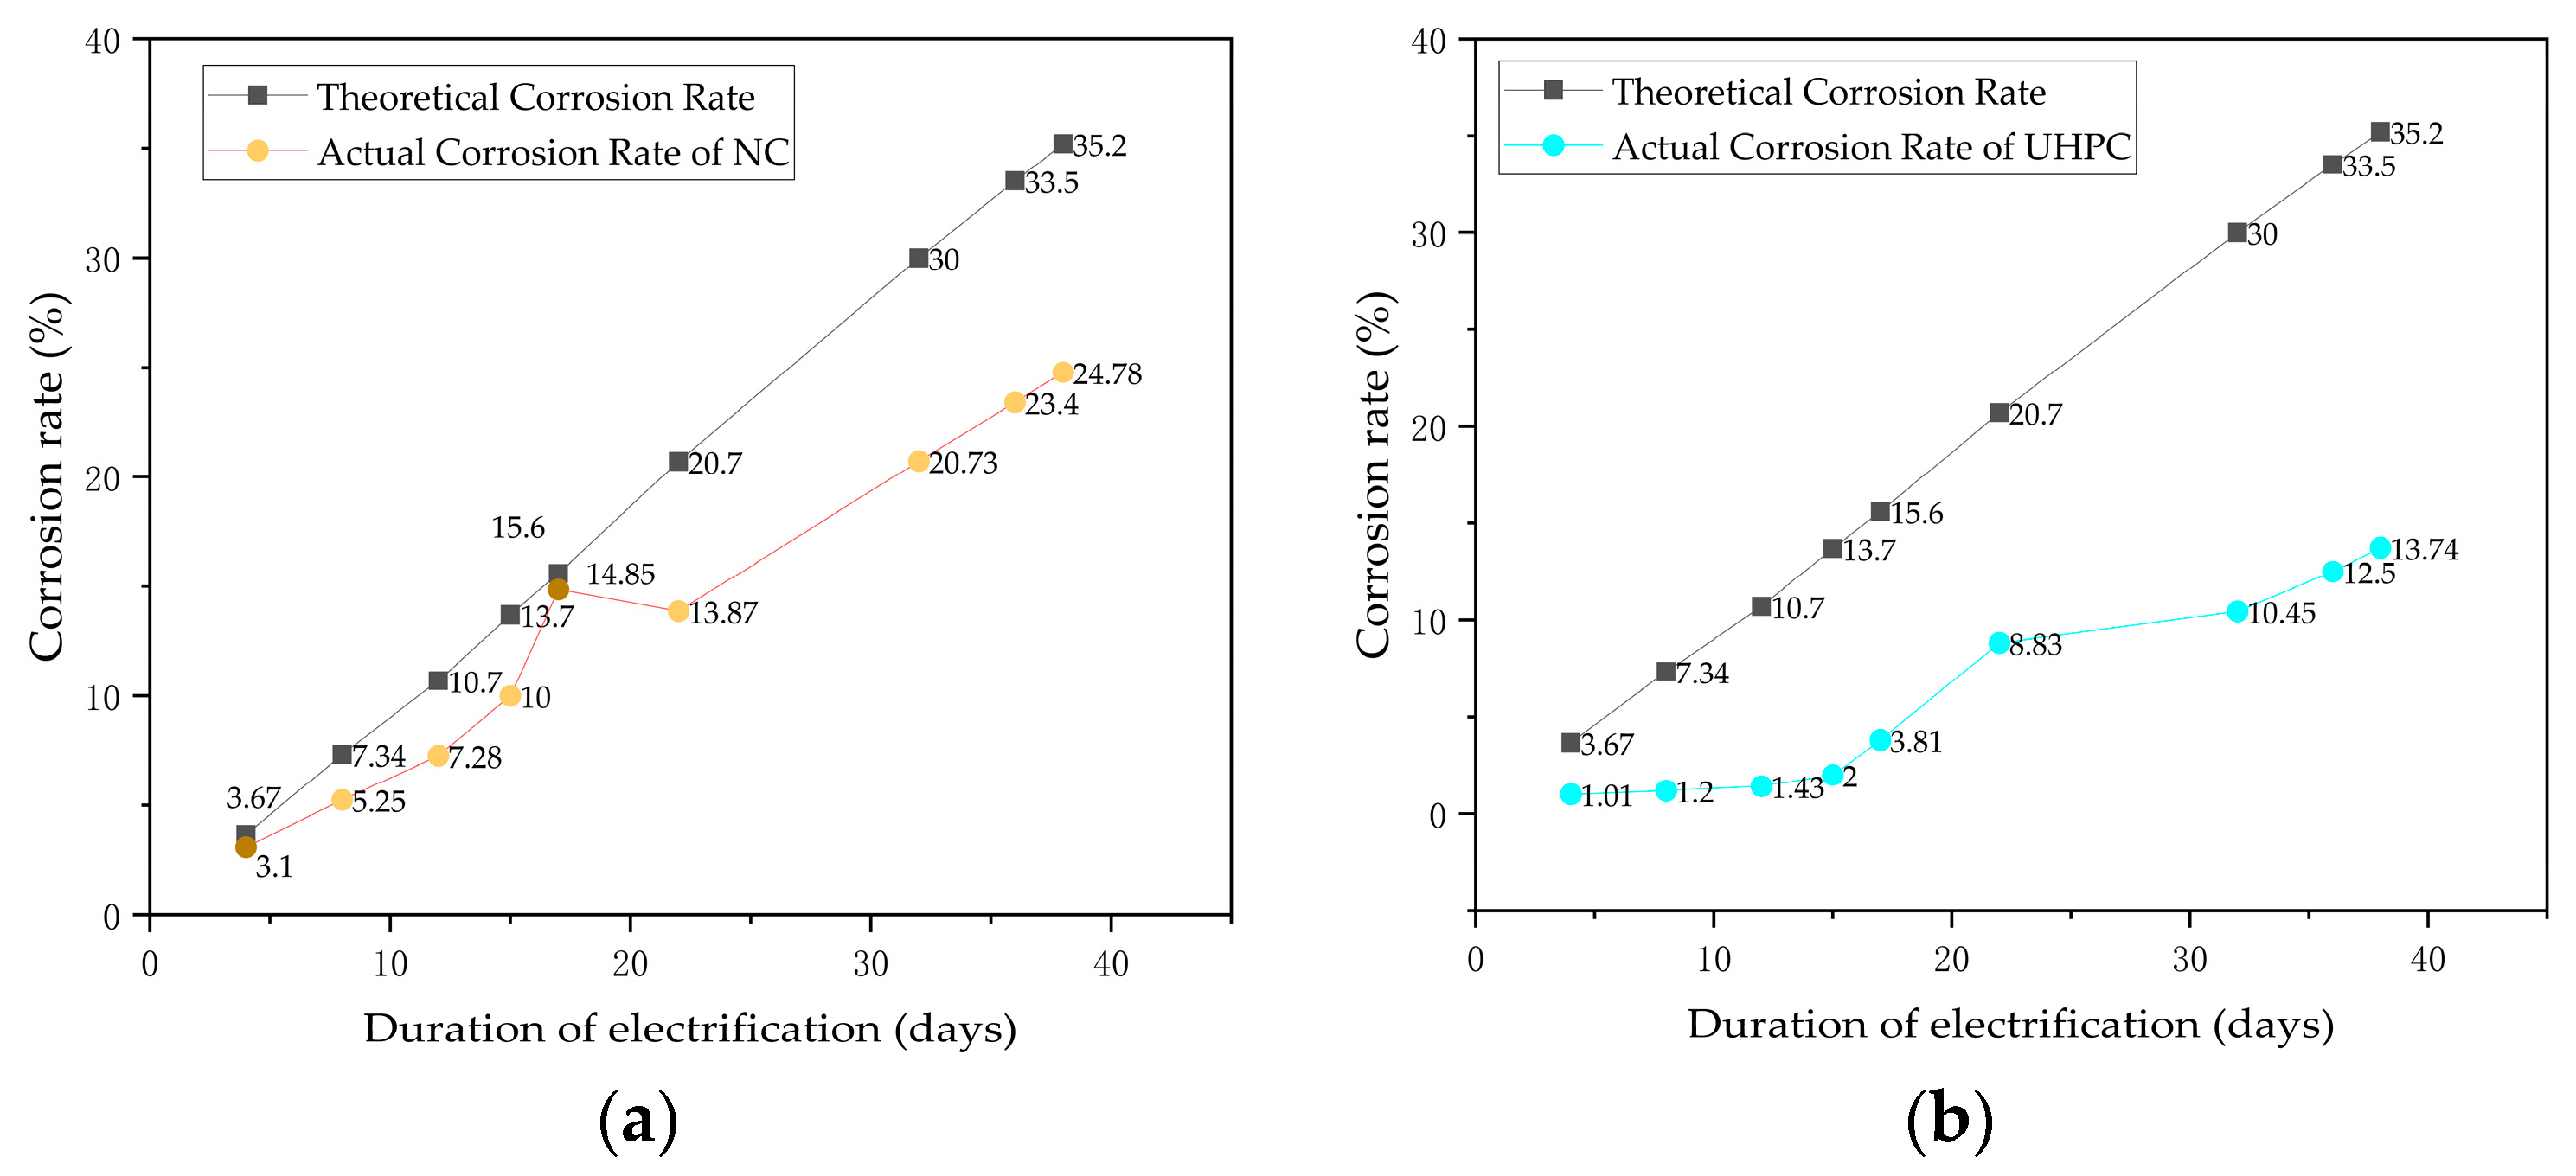
4.3. Analysis of the Corrosion Rate of Steel Reinforcements in Concrete and UHPC Short Columns

The relationship between the duration of electrical corrosion and the corrosion rate for concrete and UHPC short columns is shown in Figure 10. The theoretical corrosion rate and the actual corrosion rate in the figure have been calculated based on Equation (8) and Equation (9), respectively. The actual corrosion rate of the concrete specimens remains below the theoretical value throughout the corrosion process. Due to earlier cracking in the NC specimens, the rate of increase in steel reinforcement corrosion remains relatively stable, around 70% of the theoretical value. For the UHPC specimens, the corrosion rate increases very slowly in the early stages; as cracks develop, the rate of corrosion acceleration gradually increases, and, after 30 days, the corrosion rate for the UHPC specimens stabilizes around 40% of the theoretical value. This indicates a significant difference in the corrosion rate trends between the UHPC and concrete specimens. Similar to the conclusions from the above studies, research by Yalciner et al. [46,47] found that the actual corrosion rate of ordinary concrete after accelerated rusting is approximately between 60% and 70% of the theoretical corrosion rate. Additionally, Hakan’s study showed that concrete with a higher strength exhibited a lower corrosion percentage and was less prone to crack development after accelerated rusting [48].
The linear fitting of the actual corrosion rates for the concrete and UHPC short column specimens is shown in Figure 11. The fitting results indicate that the concrete specimens, which exhibit earlier cracking, can be represented with a single linear fit. In contrast, the UHPC specimens require two linear segments for fitting. This is because cracks in the UHPC specimens appear around day 17 (U5). Prior to crack formation, chloride ions have difficulty reaching the steel surface to cause corrosion. However, once corrosion reaches a certain level, the expansion caused by rusting increases crack formation, significantly accelerating the corrosion rate. This observation aligns with the experimental results.
From the analysis above, it can be observed that, regardless of the type of specimen, the change in the corrosion rate is related to the migration rate of chloride ions into the specimen, which is closely linked to the porosity of the concrete. This relationship is well-validated by the corrosion changes in UHPC specimens before and after crack formation, explaining why UHPC has significantly better corrosion resistance compared to ordinary concrete.

5. Conclusions

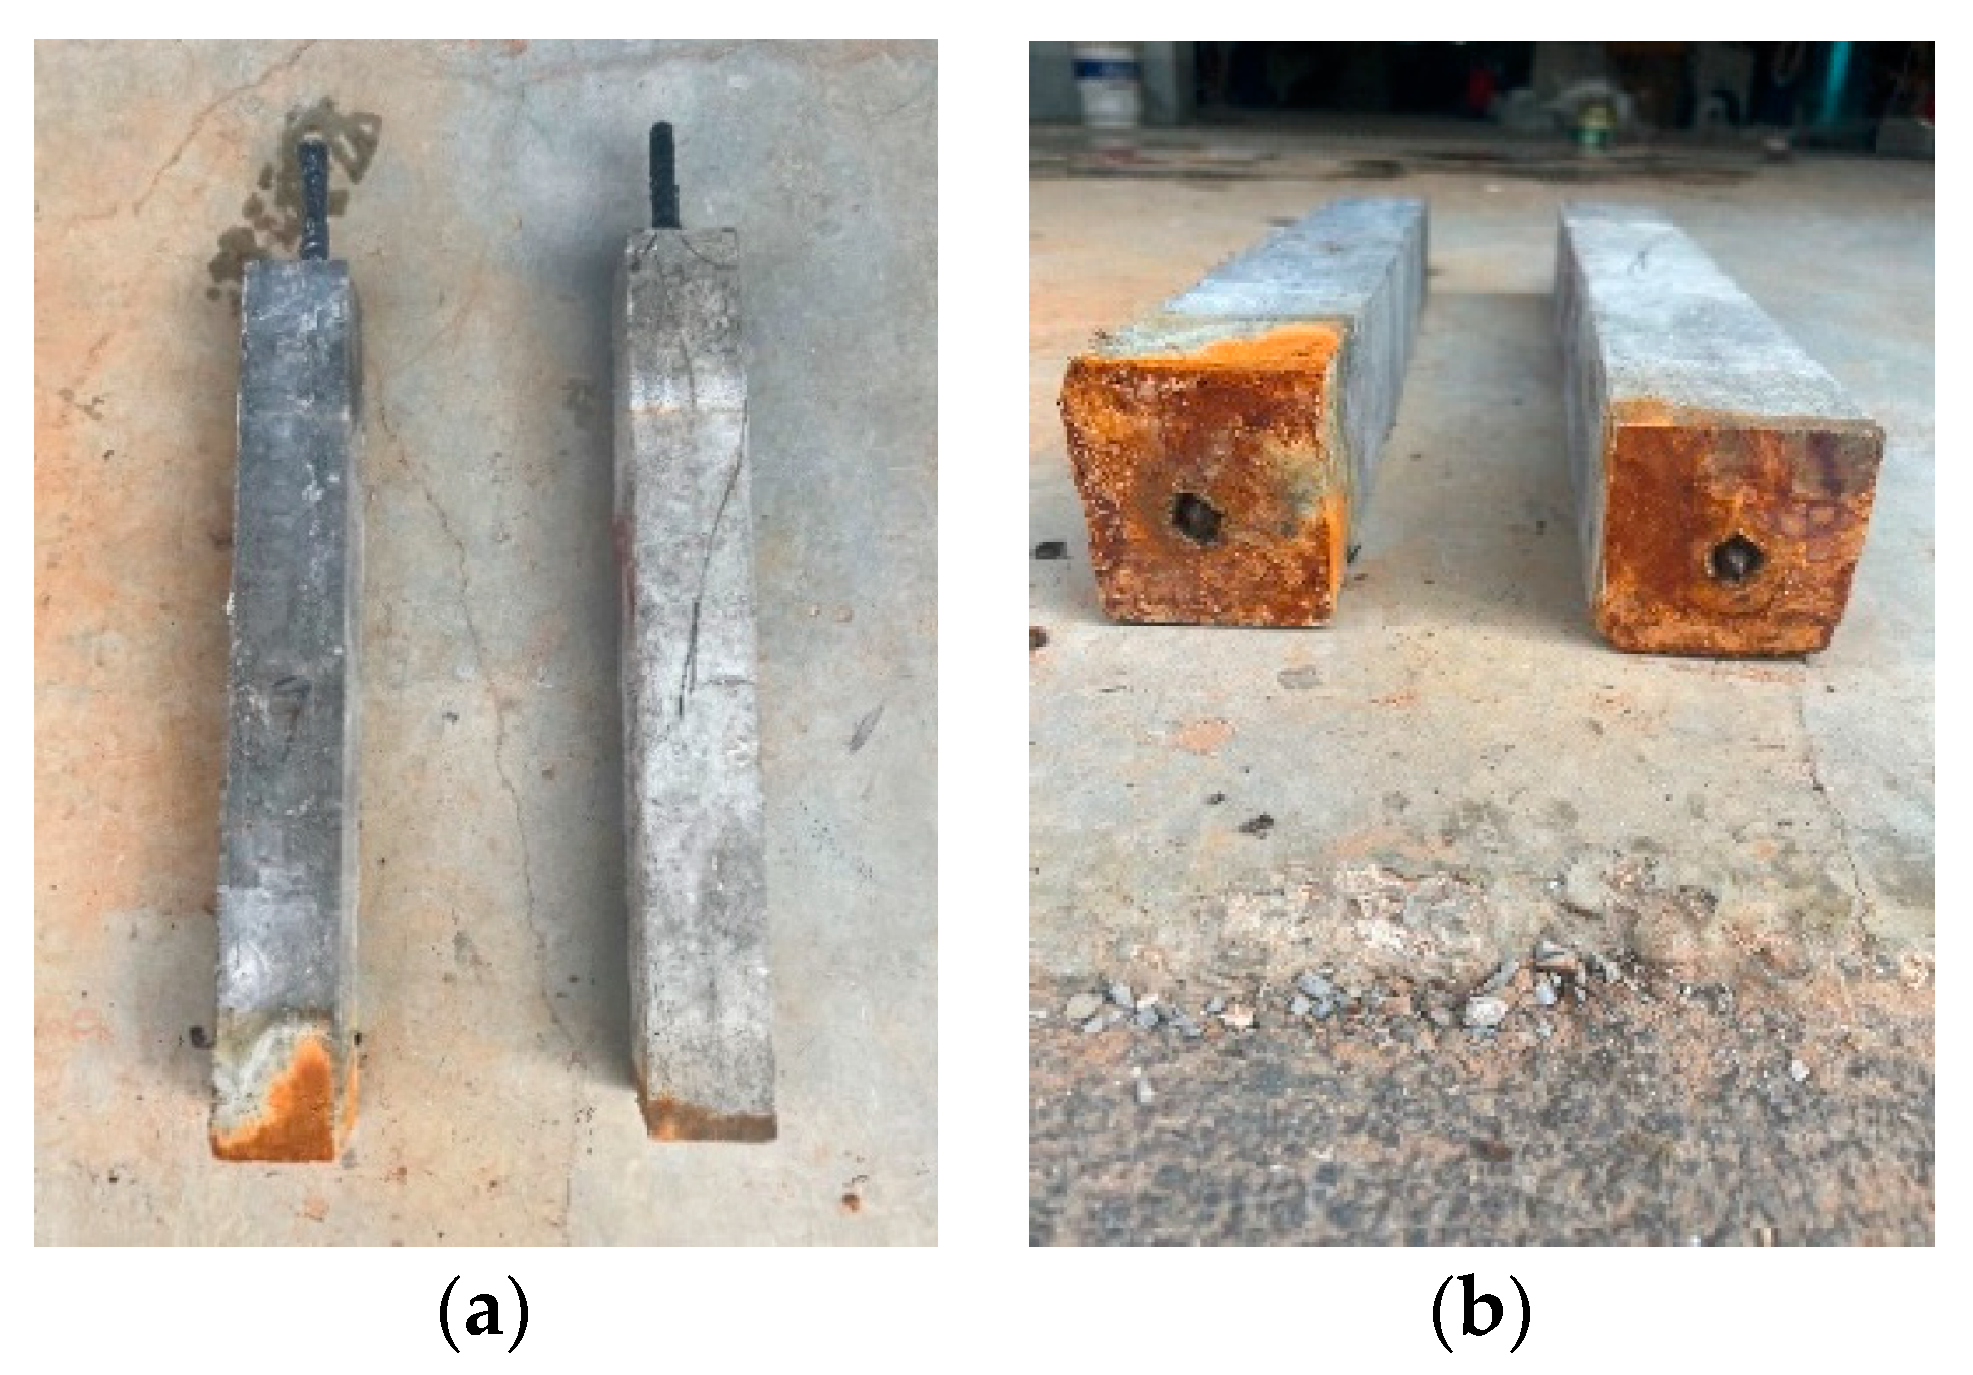
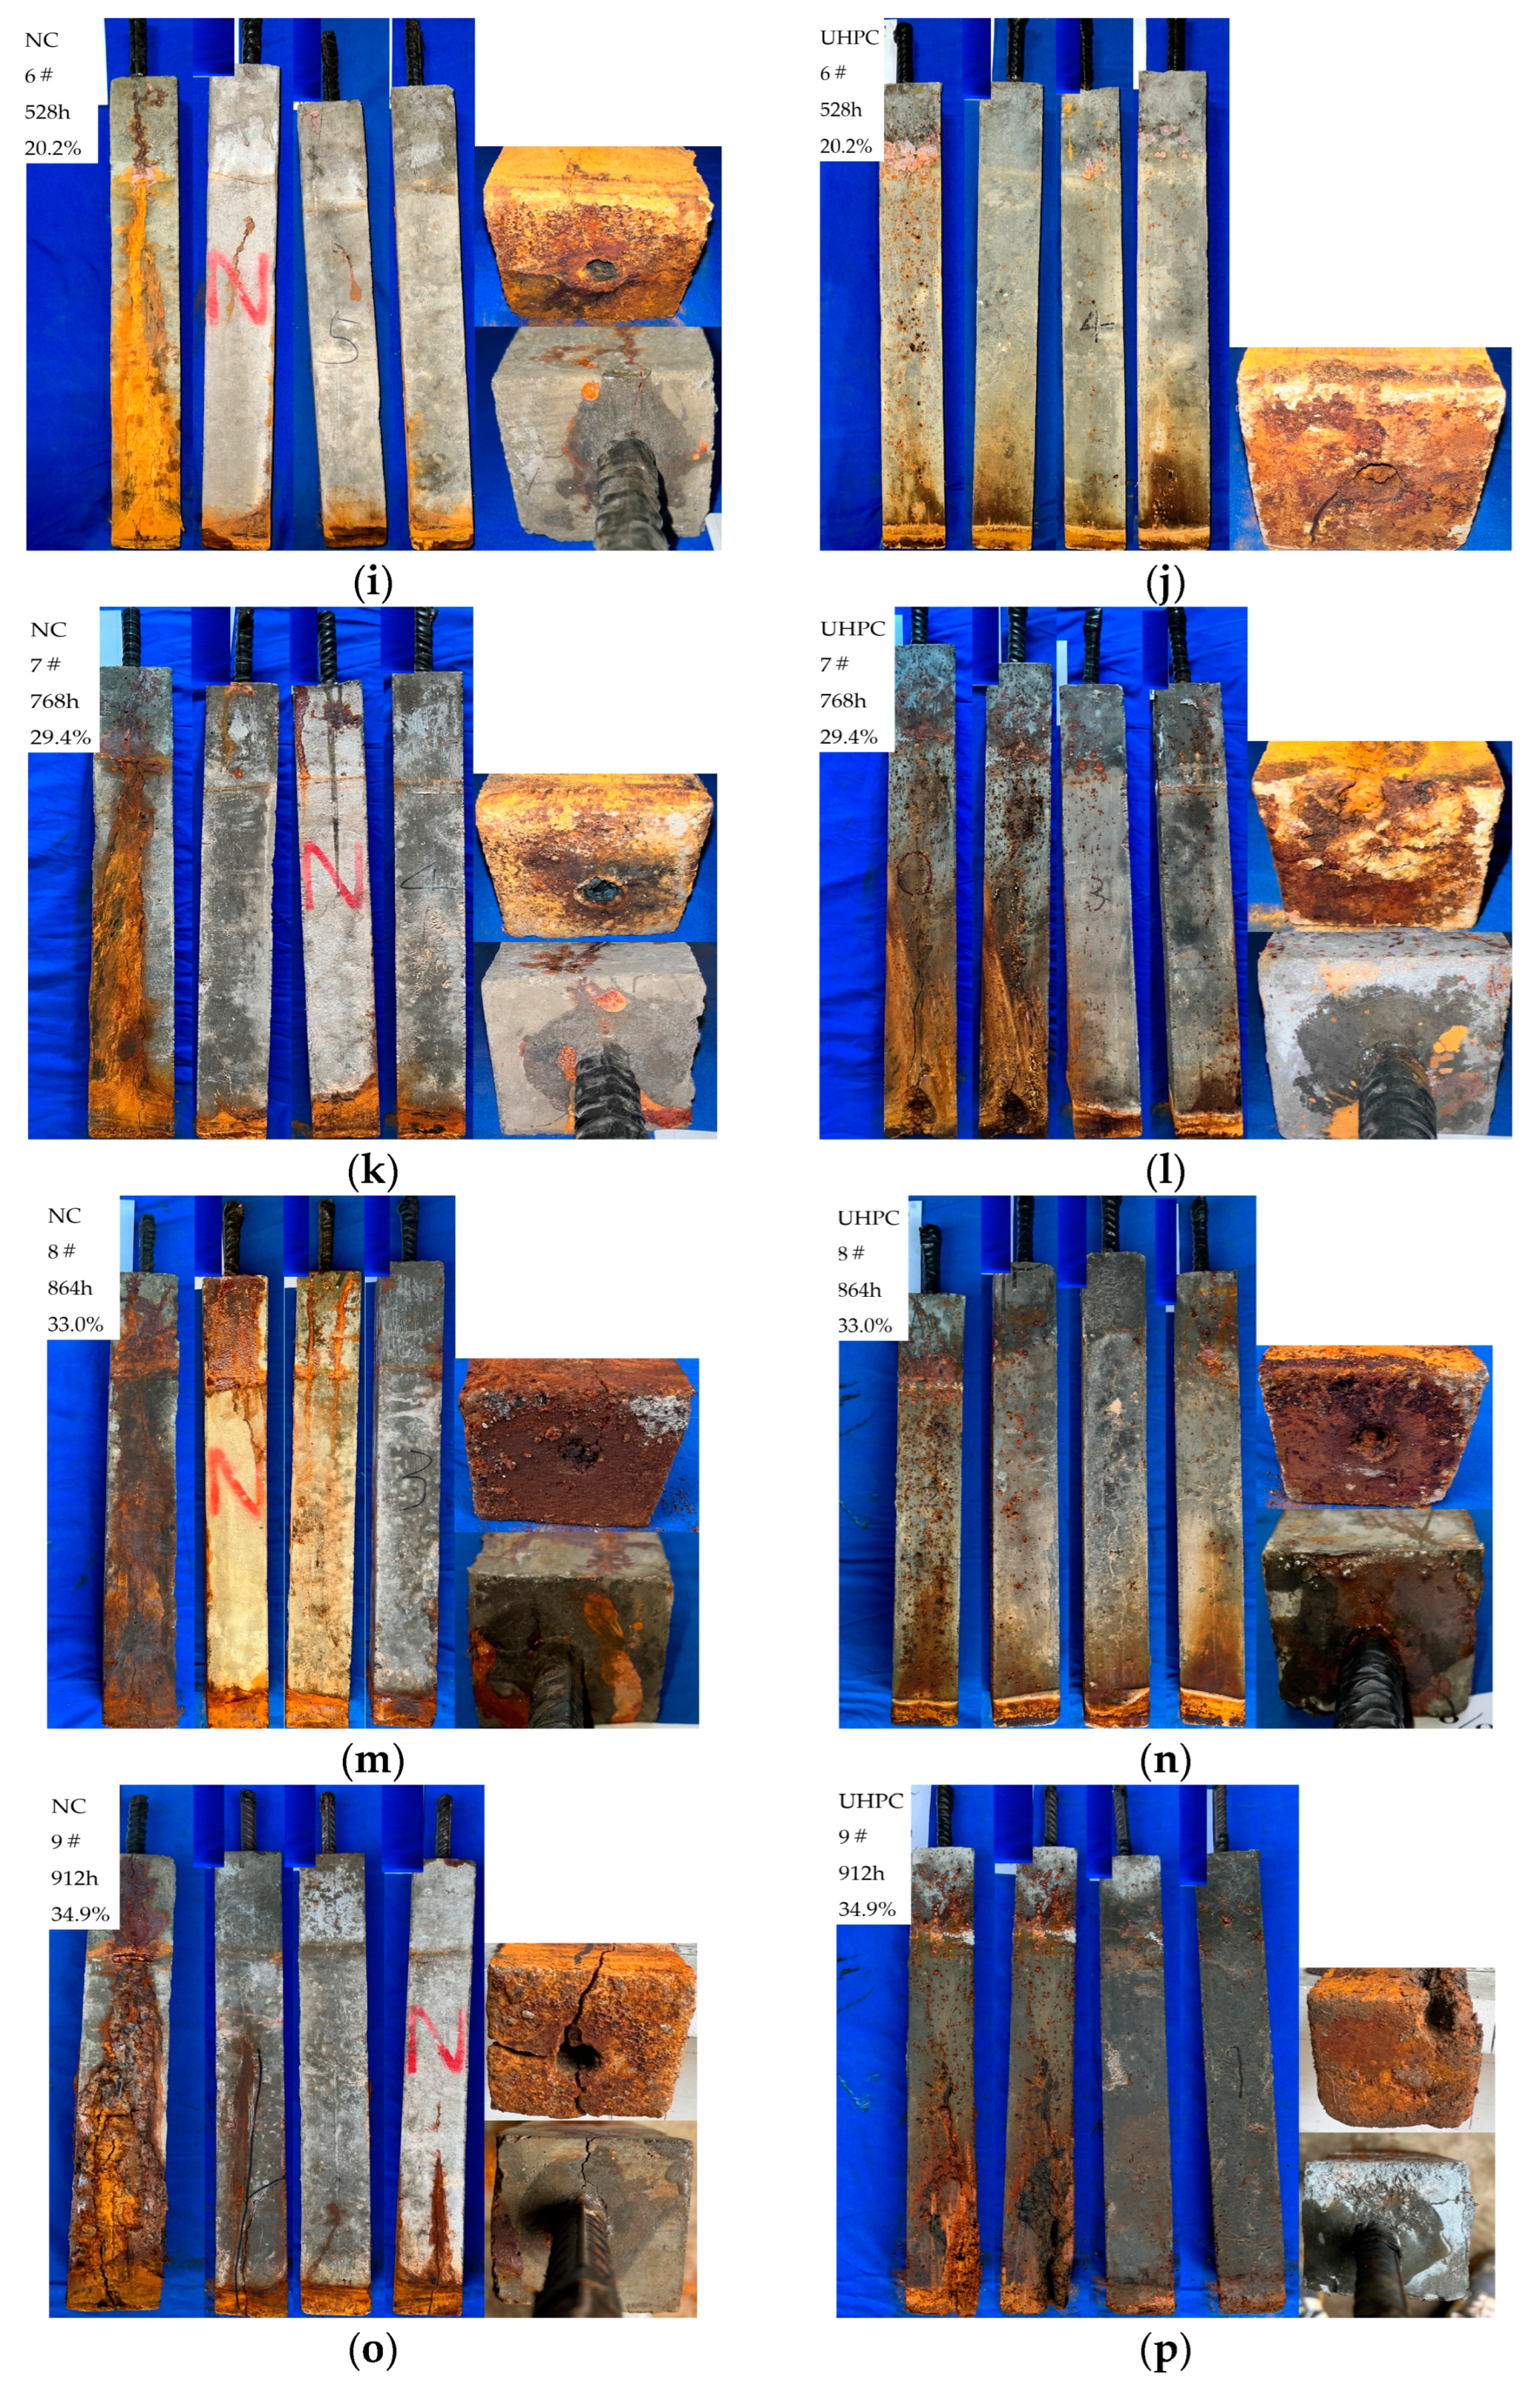
  • For the concrete specimens, as the corrosion rate increased, corrosion cracks in the concrete began at the bottom and gradually developed upwards. Specimen N3 exhibited longitudinal cracks through the material, with corrosion products continuously precipitating on the surface, extending from the bottom to the top along the cracks. In contrast, the corrosion phenomena in UHPC were less pronounced. In the early stages of corrosion, only a few point-like corrosion products appeared on one side of the UHPC specimens. Starting with specimen U4, corrosion cracks and spalling began on the side with more corrosion products, with an increase in the corrosion products. As corrosion progressed, spalling eventually occurred at the bottom of the UHPC specimens.
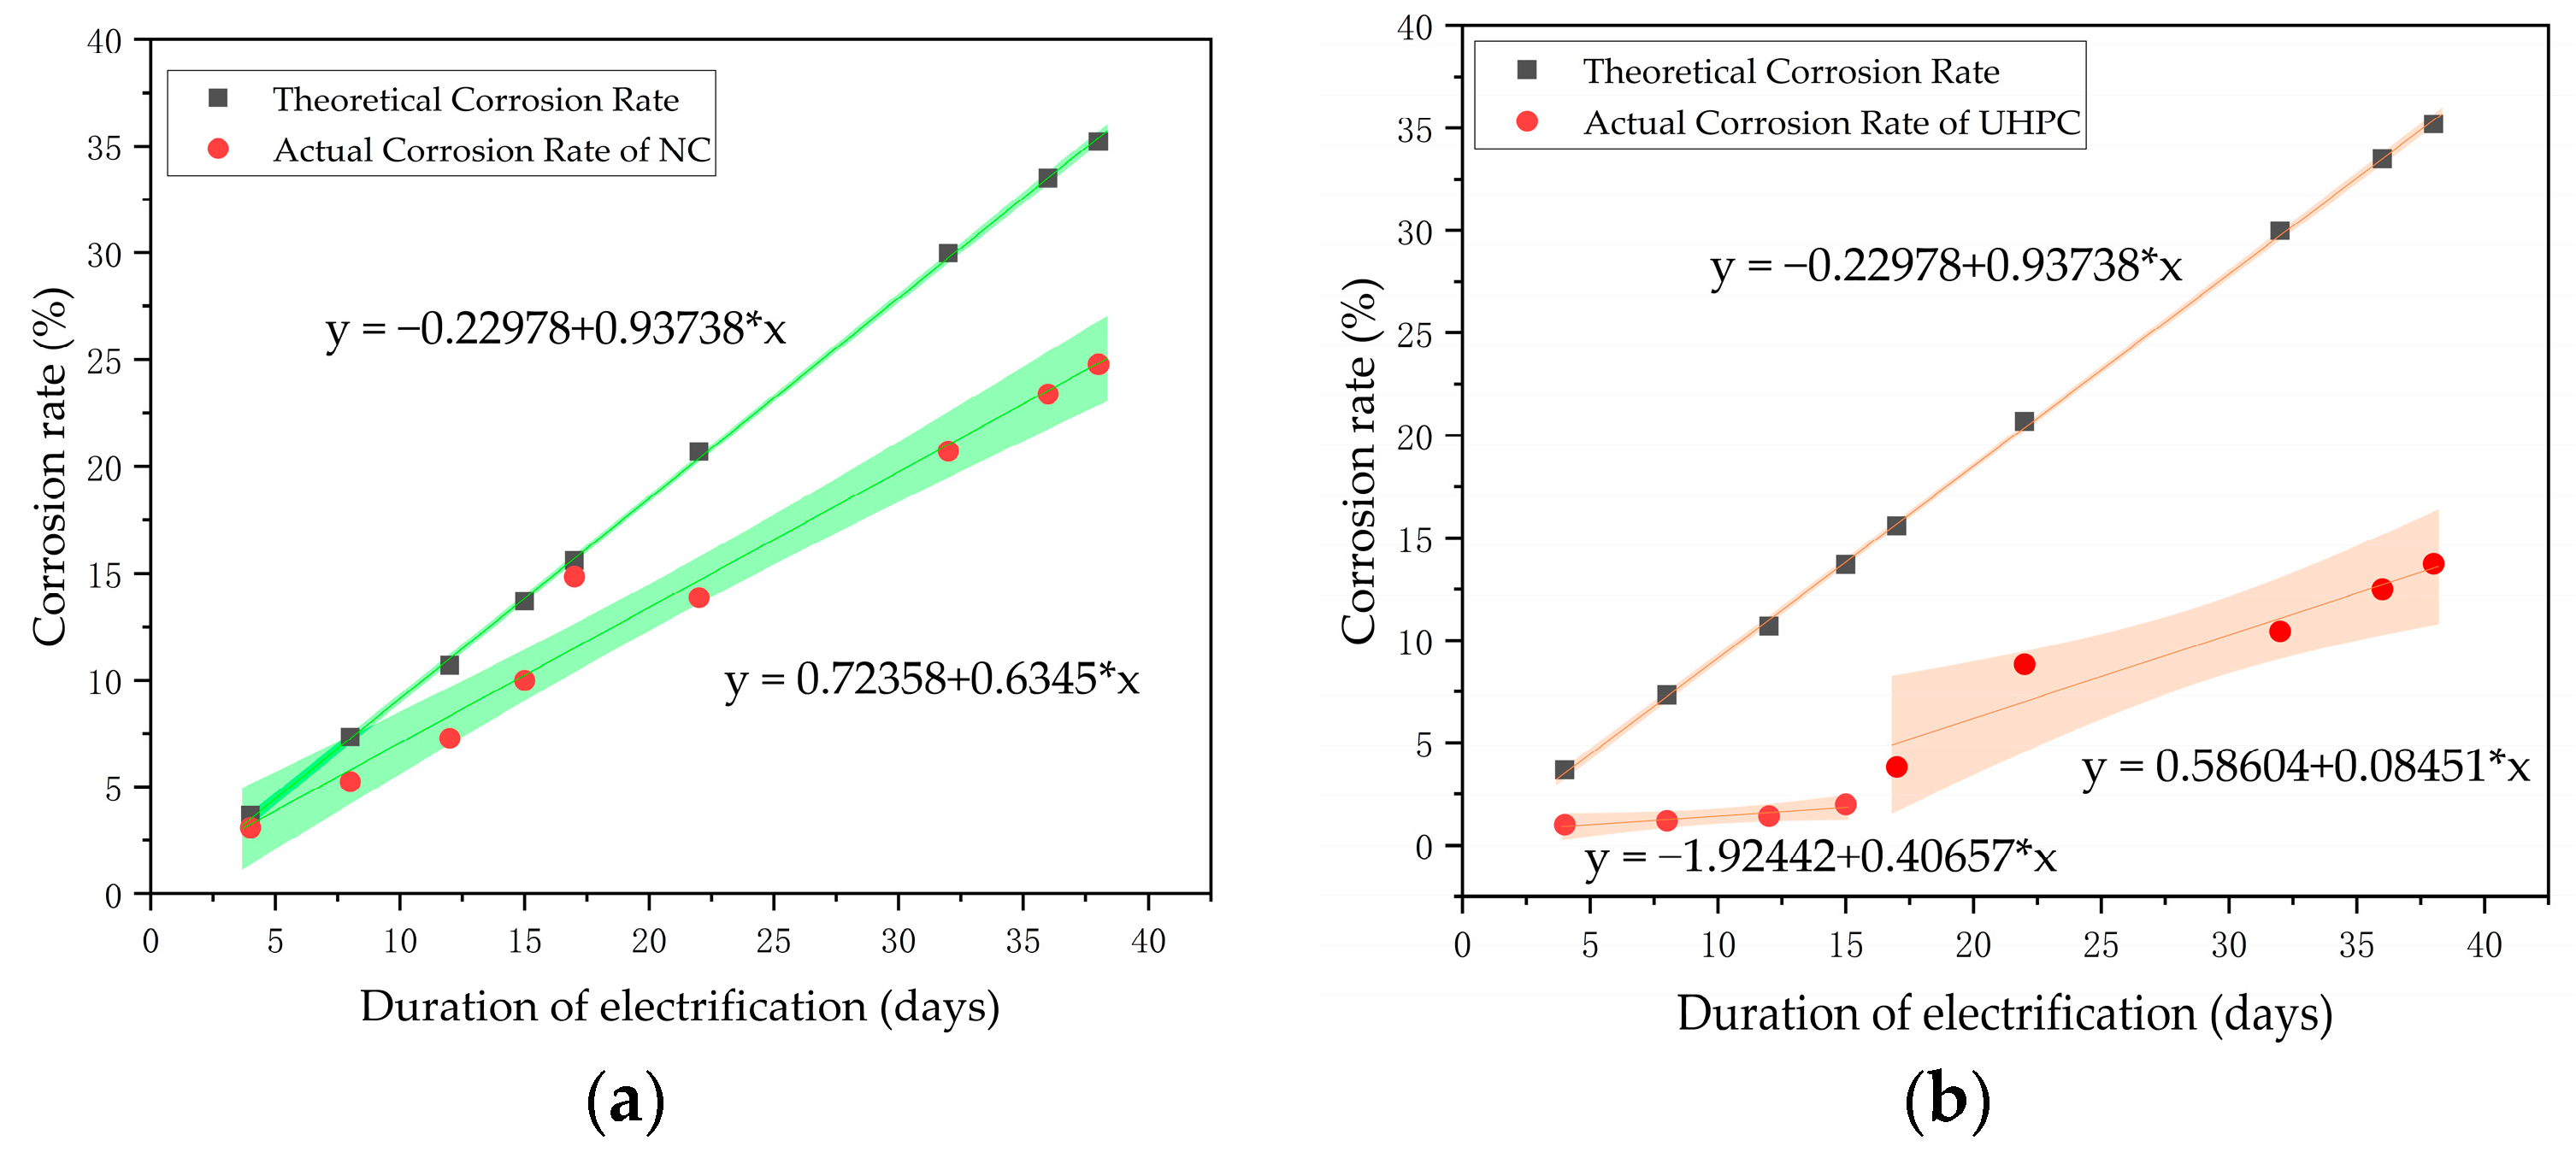
  • Starting from N3, the concrete short columns showed noticeable uneven corrosion of the reinforcing steel, whereas the UHPC short columns exhibited uniform corrosion throughout the entire process. Due to the earlier cracking of the concrete specimens, the corrosion rate of their reinforcing steel remained relatively stable, around 70% of the theoretical value. In contrast, the UHPC specimens performed better throughout the corrosion process, with the corrosion rate displaying two distinct phases. The overall actual corrosion rate of the UHPC reinforcing steel was around 40% of the theoretical value.
  • From the experimental observations, it is evident that the corrosion rates of both concrete and UHPC short columns after accelerated corrosion are significantly lower than the theoretical corrosion rates. This discrepancy has also been noted in previous research. The theoretical corrosion rates calculated based on Faraday’s law do not adequately account for factors such as chloride ion concentration and cover thickness. Therefore, it is suggested that future studies focus on this area to develop a more realistic corrosion rate calculation equation that better reflects actual engineering conditions.
  • This study compared the corrosion phenomena and patterns of ordinary concrete and UHPC specimens. This research allowed us to investigate the corrosion behavior of different material components in actual structures on a smaller scale and at a lower cost. Future research can build on this study to further explore the bond strength of internal steel reinforcements after corrosion and the seismic performance of both materials post corrosion.

Author Contributions

Conceptualization, T.T.; methodology, X.W.; software, H.W.; validation, H.W.; formal analysis, H.W.; investigation, H.W., J.H. and X.W.; resources, T.T.; data curation, H.W.; writing—original draft preparation, H.W.; writing—review and editing, H.W.; visualization, H.W.; supervision, T.T. and X.W.; project administration, T.T.; and funding acquisition, T.T. All authors have read and agreed to the published version of the manuscript.

Funding

This research received no external funding.

Institutional Review Board Statement

Not applicable.

Informed Consent Statement

Not applicable.

Data Availability Statement

The original contributions presented in the study are included in the article, further inquiries can be directed to the corresponding author.

Conflicts of Interest

The authors declare no conflicts of interest.

References

  1. Cairns, J.; Plizzari, G.; Du, Y.; Law, D.; Franzoni, C. Mechanical properties of corrosion-damaged reinforcement. ACI Mater. J. 2005, 102, 256–264. [Google Scholar]
  2. Chen, J.; Jia, J.; Zhu, M. Development of admixtures on seawater sea sand concrete: A critical review on Concrete hardening, chloride ion penetration and steel corrosion. Constr. Build. Mater. 2024, 411, 134219. [Google Scholar] [CrossRef]
  3. Babaee, M.; Castel, A. Chloride diffusivity, chloride threshold, and corrosion initiation in reinforced alkali-activated mortars: Role of calcium, alkali, and silicate content. Cem. Concr. Res. 2018, 111, 56–71. [Google Scholar] [CrossRef]
  4. Ji, H.; Tian, Y.; Fu, C.; Ye, H. Transfer learning enables prediction of steel corrosion in concrete under natural environments. Cem. Concr. Compos. 2024, 148, 105488. [Google Scholar] [CrossRef]
  5. Melchers, R.E. Long-Term Durability of Marine Reinforced Concrete Structures. J. Mar. Sci. Eng. 2020, 8, 290. [Google Scholar] [CrossRef]
  6. Kijjanon, A.; Sumranwanich, T.; Tangtermsirikul, S. Steel corrosion and critical chloride content in concrete with calcined kaolinite clay, fly ash, and limestone powder under natural and accelerated marine environments. Structures 2024, 62, 106211. [Google Scholar] [CrossRef]
  7. Tian, Y.; Zhang, G.; Ye, H.; Zeng, Q.; Zhang, Z.; Tian, Z.; Jin, X.; Jin, N.; Chen, Z.; Wang, J. Corrosion of steel rebar in concrete induced by chloride ions under natural environments. Constr. Build. Mater. 2023, 369, 130504. [Google Scholar] [CrossRef]
  8. De Domenico, D.; Messina, D.; Recupero, A. Seismic vulnerability assessment of reinforced concrete bridge piers with corroded bars. Struct. Concr. 2023, 24, 56–83. [Google Scholar] [CrossRef]
  9. Zucca, M.; Reccia, E.; Longarini, N.; Eremeyev, V.; Crespi, P. On the structural behaviour of existing RC bridges subjected to corrosion effects: Numerical insight. Eng. Fail. Anal. 2023, 152, 107500. [Google Scholar] [CrossRef]
  10. Duan, M.; Miao, J.; Wu, J.; Dong, F. Reliability Assessment Approach for Fire Resistance Performance of Prestressed Steel–Concrete Box Girder Bridges. Fire 2023, 6, 472. [Google Scholar] [CrossRef]
  11. Duan, M.; Xue, J.; Wang, X.; Wu, Y.; Tao, H. Experimental study on shear performance of perfobond steel plate in ultra-high performance concrete (UHPC)-normal concrete (NC) connection. Structures 2024, 66, 106783. [Google Scholar] [CrossRef]
  12. Wu, H.; Xu, F.; Li, B.; Gao, Q. Study on Expansion Rate of Steel Slag Cement-Stabilized Macadam Based on BP Neural Network. Materials 2024, 17, 3558. [Google Scholar] [CrossRef] [PubMed]
  13. Yuan, W.; Guo, A.; Li, H. Equivalent elastic modulus of reinforcement to consider bond-slip effects of coastal bridge piers with non-uniform corrosion. Eng. Struct. 2020, 210, 110382. [Google Scholar] [CrossRef]
  14. Li, Y.; Sun, Z.; Li, Y.; Zhu, W.; Zheng, H.; Zheng, S. Exploring the shear performance and predictive shear capacity of corroded RC columns utilizing the modified compression-field theory: An investigative study. Eng. Struct. 2024, 302, 117390. [Google Scholar] [CrossRef]
  15. Miao, Z.; Yuan, H.; Liu, Y.; Geng, X. Seismic performance analysis of coastal reinforced concrete frames considering the pitting corrosion in the longitudinal reinforcement bars. J. Build. Eng. 2024, 90, 109478. [Google Scholar] [CrossRef]
  16. Khaksefidi, S.; Ghalehnovi, M.; Rahdar, H. Bond-slip relationship between deformed rebar and ultra-high-performance concrete with corrosion effect. Case Stud. Constr. Mater. 2024, 21, e03585. [Google Scholar] [CrossRef]
  17. Alhawat, M.; Ashour, A. Bond strength between corroded steel reinforcement and recycled aggregate concrete. Structures 2019, 19, 369–385. [Google Scholar] [CrossRef]
  18. Lin, Y.; Zhong, S.; Yu, G.; Sun, L. Effect of corrosion on bond slipping between steel and concrete in SRC structures. J. Constr. Steel Res. 2024, 220, 108857. [Google Scholar] [CrossRef]
  19. Papakonstantinou, C.G.; Balaguru, P.N.; Auyeung, Y. Influence of FRP confinement on bond behavior of corroded steel reinforcement. Cem. Concr. Compos. 2011, 33, 611–621. [Google Scholar] [CrossRef]
  20. Tung Pham, T.; Tan Nguyen, N.; Thao Nguyen, T.-T.; Linh Nguyen, N. Numerical analysis of the shear behavior for steel fiber reinforced concrete beams with corroded reinforcing bars. Structures 2023, 57, 105081. [Google Scholar] [CrossRef]
  21. Haskett, M.; Oehlers, D.J.; Ali, M.S.M.; Wu, C. Yield Penetration Hinge Rotation in Reinforced Concrete Beams. J. Struct. Eng. 2009, 135, 130–138. [Google Scholar] [CrossRef]
  22. Ma, Z.; Zhao, T.; Zhao, Y. Effects of hydrostatic pressure on chloride ion penetration into concrete. Mag. Concr. Res. 2016, 68, 877–886. [Google Scholar] [CrossRef]
  23. Jensen, M.M.; De Weerdt, K.; Johannesson, B.; Geiker, M.R. Use of a multi-species reactive transport model to simulate chloride ingress in mortar exposed to NaCl solution or sea-water. Comput. Mater. Sci. 2015, 105, 75–82. [Google Scholar] [CrossRef]
  24. Tahri, W.; Hu, X.; Shi, C.; Zhang, Z. Review on corrosion of steel reinforcement in alkali-activated concretes in chloride-containing environments. Constr. Build. Mater. 2021, 293, 123484. [Google Scholar] [CrossRef]
  25. Marcotte, T.; Hansson, C.M. Corrosion products that form on steel within cement paste. Mater. Struct. 2006, 40, 325–340. [Google Scholar] [CrossRef]
  26. Neville, A. Chloride attack of reinforced concrete: An overview. Mater. Struct. 1995, 28, 63–70. [Google Scholar] [CrossRef]
  27. Ann, K.Y.; Song, H.-W. Chloride threshold level for corrosion of steel in concrete. Corros. Sci. 2007, 49, 4113–4133. [Google Scholar] [CrossRef]
  28. Okada, K.; KobayashiI, K.; Miyagawa, T. Influence of Longitudinal Cracking Due to Reinforcement Corrosion on Characteristics of Reinforced Concrete Members. Aci Struct. J. 1988, 85, 134–140. [Google Scholar]
  29. Fuhaid, A.F.A.; Niaz, A. Carbonation and Corrosion Problems in Reinforced Concrete Structures. Buildings 2022, 12, 586. [Google Scholar] [CrossRef]
  30. Naidu Gopu, G.; Joseph, S.A. Corrosion Behavior of Fiber-Reinforced Concrete—A Review. Fibers 2022, 10, 38. [Google Scholar] [CrossRef]
  31. Ye, H.; Jin, N.; Fu, C.; Jin, X. Rust distribution and corrosion-induced cracking patterns of corner-located rebar in concrete cover. Constr. Build. Mater. 2017, 156, 684–691. [Google Scholar] [CrossRef]
  32. Almusallam, A.A. Effect of degree of corrosion on the properties of reinforcing steel bars. Constr. Build. Mater. 2001, 15, 361–368. [Google Scholar] [CrossRef]
  33. GB/T50152-2012; Standard for Test Method of Mechanical Properties of Normal Concrete. Ministry of Housing and Urban-Rural Development of China: Beijing, China, 2012. (In Chinese)
  34. SIA 2052:2016 Bauwesen; Ultra-Hochleistungs-Faserbeton (UHFB)—Baustoffe, Bemessung und Ausführung. SIA Zurich: Zürich, Switzerland, 2016. (In German)
  35. Vu, N.S.; Yu, B.; Li, B. Stress-strain model for confined concrete with corroded transverse reinforcement. Eng. Struct. 2017, 151, 472–487. [Google Scholar] [CrossRef]
  36. Li, Y.; Zheng, S.; Shang, Z.; Chen, J.; Wang, D. Experimental study on the seismic behavior of ECE corroded reinforced concrete short pier columns. Constr. Build. Mater. 2022, 348, 128681. [Google Scholar] [CrossRef]
  37. Chen, L.; Mindess, S.; Morgan, D.R.; Shah, S.P.; Johnston, C.D.; Pigeon, M. Comparative Toughness Testing of Fiber Reinforced Concrete. In SP-155: Testing of Fiber Reinforced Concrete; American Concrete Institute: Indianapolis, IN, USA, 1995. [Google Scholar]
  38. Liu, Y.; Hao, H.; Hao, Y.; Cui, J. Experimental study of dynamic bond behaviour between corroded steel reinforcement and concrete. Constr. Build. Mater. 2022, 356, 129272. [Google Scholar] [CrossRef]
  39. Zhao, X.; Wu, J.; Zhang, L.; Yang, X. Bond properties between corroded steel bars and recycled aggregate concrete after high-temperature exposure. J. Build. Eng. 2024, 93, 109835. [Google Scholar] [CrossRef]
  40. Wang, X.; Li, S.; Lu, Y. Stochastic modeling for bond deterioration between rebar and concrete due to reinforcement corrosion. Structures 2024, 66, 106904. [Google Scholar] [CrossRef]
  41. JTG/T 2231-02—2021; Specifications for Seismic Performance Evaluation of Highway Bridges. Ministry of Transport of China: Beijing, China, 2021. (In Chinese)
  42. Maaddawy, T.A.E.; Soudki, K.A. Effectiveness of Impressed Current Technique to Simulate Corrosion of Steel Reinforcement in Concrete. J. Mater. Civ. Eng. 2003, 15, 41–47. [Google Scholar] [CrossRef]
  43. Vu, K.A.T.; Stewart, M.G. Structural reliability of concrete bridges including improved chloride-induced corrosion models. Struct. Saf. 2000, 22, 313–333. [Google Scholar] [CrossRef]
  44. GB/T50082-2009; Standard for Test Methods of Long-Term Performance and Durability of Ordinary Concrete. Ministry of Housing and Urban-Rural Development of PRC; General Administration of Quality Supervision, Inspection and Quarantine of PRC: Beijing, China, 2009.
  45. Zheng, Y.; Zheng, S.-S.; Yang, L.; Dong, L.-G.; Zhang, Y.-B. Experimental study and analytical model of the bond behavior of corroded reinforcing steel bars in concrete. Constr. Build. Mater. 2022, 327, 126991. [Google Scholar] [CrossRef]
  46. Yalciner, H.; Kumbasaroglu, A.; Ertuc, İ.; Turan, A.İ. Confinement Effect of Geo-grid and Conventional Shear Reinforcement Bars Subjected to Corrosion. Structures 2018, 13, 139–152. [Google Scholar] [CrossRef]
  47. Yalciner, H.; Kumbasaroglu, A.; Turan, A.İ. Torsional behavior of reinforced concrete beams with corroded reinforcement. Structures 2019, 20, 476–488. [Google Scholar] [CrossRef]
  48. Yalciner, H.; Eren, O.; Sensoy, S. An experimental study on the bond strength between reinforcement bars and concrete as a function of concrete cover, strength and corrosion level. Cem. Concr. Res. 2012, 42, 643–655. [Google Scholar] [CrossRef]
Figure 1. Process of reinforcement corrosion reaction.
Applsci 14 07969 g001
Figure 2. Dimensions of short column specimens.
Applsci 14 07969 g002
Figure 3. Layout of the electrical acceleration corrosion test for short columns.
Applsci 14 07969 g003
Figure 4. Accelerated corrosion testing process: (a) wiring of the specimens; (b) addition of sodium chloride solution; (c) corrosion products’ accumulation and precipitation; and (d) corrosion condition of short columns.
Applsci 14 07969 g004
Figure 5. Corroded N1 and U1 specimens: (a) front view and (b) bottom view.
Applsci 14 07969 g005
Figure 6. Corroded N2-N9 and U2-U9 short columns: (a) N2; (b) U2; (c) N3; (d) U3; (e) N4; (f) U4; (g) N5; (h) U5; (i) N6; (j) U6; (k) N7; (l) U7; (m) N8; (n) U8; (o) N9; and (p) U9.
Applsci 14 07969 g006aApplsci 14 07969 g006b
Figure 7. Diagram of cracks in NC and UHPC specimens.
Applsci 14 07969 g007
Figure 8. Steel reinforcements’ actual corrosion situation.
Applsci 14 07969 g008
Figure 9. Changes in the cross-sectional corrosion of reinforcement in concrete and UHPC short columns.
Applsci 14 07969 g009
Figure 10. The corrosion rate of the short column specimens over time: (a) the corrosion rate curve for the NC specimens and (b) the corrosion rate curve for the UHPC specimens.
Applsci 14 07969 g010
Figure 11. The fitted linear corrosion rate curves for the concrete and UHPC short columns: (a) the fitted corrosion rate curve for the NC specimens and (b) the fitted corrosion rate curve for the UHPC specimens.
Applsci 14 07969 g011
Table 1. The mechanical properties of normal concrete and UHPC.
fc,n (MPa)fc,u (MPa)fck,n (MPa)fck,u (MPa)ft,u (MPa)
55.7185.936.3121.69.8
Table 2. Accelerated corrosion parameters for short columns.
Sample NumberElectrification Duration (Days)Current Density (μA/cm2)Theoretical Corrosion Rate (%)
N149003.67
U1
N289007.34
U2
N31290011.00
U3
N41590013.8
U4
N51790015.6
U5
N62290020.2
U6
N73290029.4
U7
N83690033.5
U8
N93890035.2
U9
Note: N1 to N9 are normal concrete specimens, and U1 to U9 are UHPC specimens.
Table 3. The remaining length of the reinforcement after corrosion (cm).
Sample Number123456789
Concrete Short Column50.049.350.050.049.849.648.449.448.0
UHPC Short Column50.048.748.848.448.049.546.249.343.0
Difference0.00.61.21.61.8−0.12.20.15.0
Disclaimer/Publisher’s Note: The statements, opinions and data contained in all publications are solely those of the individual author(s) and contributor(s) and not of MDPI and/or the editor(s). MDPI and/or the editor(s) disclaim responsibility for any injury to people or property resulting from any ideas, methods, instructions or products referred to in the content.

