Article

Uniaxial Compression Test and Numerical Study on the Mechanical Mechanism of Crack Exhibition and Propagation in Layered Rocks

1
School of Resource and Environmental Engineering, Jiangxi University of Science and Technology, Ganzhou 341000, China
2
School of Civil and Surveying and Mapping Engineering, Jiangxi University of Science and Technology, Ganzhou 341000, China
3
Department of Civil and Environmental Engineering, Brunel University London, London UB8 3PH, UK
4
State Key Laboratory of Coastal and Offshore Engineering, Dalian University of Technology, Dalian 116024, China
*
Authors to whom correspondence should be addressed.
Appl. Sci. 2024, 14(17), 7970; https://doi.org/10.3390/app14177970
Submission received: 8 August 2024 / Revised: 20 August 2024 / Accepted: 23 August 2024 / Published: 6 September 2024

Abstract

:
Layered rocks are widely distributed in mining and underground engineering. The evolution processes, such as crack initiation, development and penetration, inevitably occur due to stress changes. This study carried out an experiment and numerical simulation to explore the correspondence between crack distribution and bedding dip, and to reveal the mechanical mechanism of layered rock fracturing. The results show that the layered rock specimens with different bedding dips obtained different stress combinations under the same uniaxial compression conditions. There are a total of five types of stress combinations, including pure compression type, compression shear type, pure shear type, tension shear type, and pure tension type. The Mohr circle is effective in characterizing the relationship between the stress combinations and failure modes. The failure mode of layered rocks in the range of 0° to 150° is presented the variation features of “tensile failure → compression-shear failure → shear failure → tensile shear failure → tensile failure”. Furthermore, the combined distributions of dominant and secondary cracks are summarized into the penetrating mode, the exfoliation mode, the feather crack mode, and the associated mode in high-dip of layered marbles. This paper provides research ideas for stability monitoring and crack tracking of layered rock mass engineering.

1. Introduction

Rock is one of the most widely used engineering materials in the field of engineering. Layer weak surface is a common form of natural defect in rock materials, so its adverse effects on rock engineering cannot be ignored [1]. The study of layered rock on different dips is always a hot topic in the field of rock mechanics [2]. The mechanism of the influence of stress combinations generated by different bedding structures on the failure mode of rock mass still needs to be further explored [3]. Previous studies have found that weak interlayers can lead to changes in the overall damage form and failure mechanism in the rock assemblage [4], and even affect the percolation characteristics of the coal and rock combination [5,6]. Zhong et al. [7] conducted Brazilian splitting experiments using layered coal and observed that the stress state at the crack tip and the crack propagation path are influenced by the bedding plane. The failure mode of the specimen is independent of the loading rate and depends on the direction of the bedding plane. Zhang et al. [8] conducted Brazilian splitting experiments on specimens containing cement interlayers and found that the thickness and strength of the interlayer affected the failure mode of the specimens, and the inclination of the interlayer significantly affected the formation of primary and secondary cracks. Miao et al. [9] conducted uniaxial compression tests on sandstone samples with varying defect inclinations and filling materials, analyzing the influences of different filling materials and defect inclinations on crack propagation behavior based on Coulomb friction theory.
The bedding orientation of the rock, interlayer bonding force and frictional contact play a very important role in the anisotropy of the rock, and have a significant impact on the failure strength, fracture pattern, and distribution of microcracks [10,11,12,13]. Shang et al. [14] conducted uniaxial loading tests on double-fractured coal samples with different inclusion inclinations, analyzed the influence of inclusion inclination on the type and angle of new cracks, and analyzed the evolution of the stress intensity factors at the tips of the cracks. Song et al. [15] conducted triaxial compression tests on layered soft-hard rock-like specimens with different inclinations and, using X-ray, CT technology, and numerical simulation, analyzed the internal crack propagation processes, as well as the damage modes and failure mechanisms of three-dimensional composite rock models with different inclinations. Zhou et al. [16] conducted uniaxial compression experiments on coal rocks with different bedding angles, establishing a microscopic analysis model to examine the impact of bedding angle on the compressive strength, failure mode, and crack distribution of the rock. Yuan et al. [11] used uniaxial compression tests and the Particle Flow Code (PFC2D) to study the mechanical properties, crack propagation, failure modes, and failure evolution characteristics of red sandstone with different pre-existing crack inclination angles. Chang et al. [17] developed a numerical model by inserting cohesive elements (CE) to simulate the evolution of fracture paths in layered rocks, which was validated by wedged splitting tests. The model revealed that the fracture penetration/deflection behavior on the bedding plane is controlled by two thresholds. Yin et al. [18] established simulation models of layered composite rocks using the BRM and SJM models for joint surface treatment. The SJM model more effectively reflects the anisotropic characteristics of the uniaxial compressive strength and elastic modulus of the sample and can independently calculate tensile and shear cracks. The macroscopic fracture surface of rock sample with the BRM model is more pronounced, and is also closer to the fracture surface of the physical sample than those with the SJM model.
The variation characteristics of rock mechanics and fracture properties under the influence of bedding angle have been studied. Jaeger [19] proposed the single plane hypothesis of shear failure in anisotropic rocks, which states that the shear strength of layered rocks varies with layer orientation. Changes in the angle of bedding can lead to differences in the influence of factors, such as rock water absorption and confining pressure, on the compressive strength of rock [20]. Some research results show that, under uniaxial compression, the cracking stress [21], and peak strength of rock specimens exhibit a trend of first decreasing and then increasing with the increase in bedding dip angle [22,23,24], with a minimum occurring at a bedding dip angle of 60° [2,16]. Gao et al. [24] found that the tensile strength, compressive and shear wave velocities of shale all exhibit strong anisotropy. The tensile strength along the bedding plane is about 300–360 times that of the perpendicular to the bedding plane, and the compressive wave velocity perpendicular to the bedding plane is the smallest, while the shear wave velocity parallel to the bedding plane is the smallest. Chen et al. [25] evaluated the effectiveness of lateral isotropy in the Long maxi shale formation and found that, under low confining pressure, even if both surfaces are perpendicular to the beddings, there are more fractures on the surface perpendicular to the maximum principal stress than on the surface perpendicular to the intermediate principal stress. He et al. [26] performed uniaxial compression experiments at different strain rates using shale samples with various bedding orientations and found that the bedding orientation and strain rate significantly affect the failure mode of the specimens. Moreover, by adjusting the strain rate, the failure mode of the rock can be altered under different bedding conditions [27]. Song et al. [28] investigated the stress–strain relationship and the mechanical properties’ anisotropy of hard sandstone under the influence of bedding angle and summarized the variation of failure modes with the bedding angle.
The inclination of the internal layered structure in the rock also has an impact on the microtopography of the crack surface. Under the combined action of compression and shear, the fracture morphology of the wing cracks changes from complex to simple as the angle of pre-existing fracture increases, while the fracture morphology of the anti-wing cracks and secondary cracks becomes relatively rougher, with a higher number of trans-granular and intergranular cracks [29]. Wang et al. [30] found that, when both defective pores and prefabricated cracks with different angles are present, the prefabricated crack angle outweighs the effect of pore location on the mechanical properties of the rock. The greater the angle, the shorter the initial crack length, and the more cracks at final failure. The perspective of bedding also affects the dynamic properties of rocks [31]. Under the action of impact load, samples with high-angle and low-angle beddings primarily fail in tension, while those with intermediate-angle beddings are more prone to shear and mixed failures. Moreover, by changing the angle between the bedding plane and the direction of stress wave propagation, one can alter the extent of rock failure and the size of fragments [32]. The bedding orientation also affects the effect of confining pressure on the failure mode in triaxial compression tests [33]. Wu et al. [34] tested shale samples under different bedding orientations and confining pressure conditions, concluding that samples with a 45°inclination angle were the least sensitive to confining pressure, while those with a 60° inclination angle were the most sensitive. In addition, there are also a large number of research results on the direct impact of bedding angle on rock failure modes [35,36,37,38]. Overall, these results can be summarized as follows: at low bedding angles, rock mainly undergoes trans-layer tensile fracture, at moderate bedding angles, it undergoes shear failure along layers or composite shear failure across layers and along layers and, at high bedding angles, it undergoes shear failure along layers independent of bedding.
Despite the above research and results revealing the variation law of the failure mode of layered rock under different bedding angles, the deep mechanical mechanism of bedding angle affecting rock failure mode still needs to be supplemented. Therefore, the objective of this study is to enrich the research in this gap. In this study, different stress combinations were divided according to the different positions of the Mohr circle. The differences in crack modes and distribution of rocks under different stress combinations were discussed. Numerical models of rocks with different bedding dips were established for numerical experiments to achieve different stress combinations and reveal the influence mechanism of stress combinations on crack modes. The uniaxial compression mechanics experiment on rock was carried out, the image of the surface crack of the rock specimen was monitored by a camera, and the difference in the crack distribution on the rock surface at different bedding dips was analyzed, including the dip of the dominant crack, the development of secondary cracks, and the spatial distribution of the two. Based on the results of numerical simulation and mechanical experiments, the influence of stress combination on the uniaxial compressive crack mode and crack distribution of rock was studied.

2. Materials and Methods

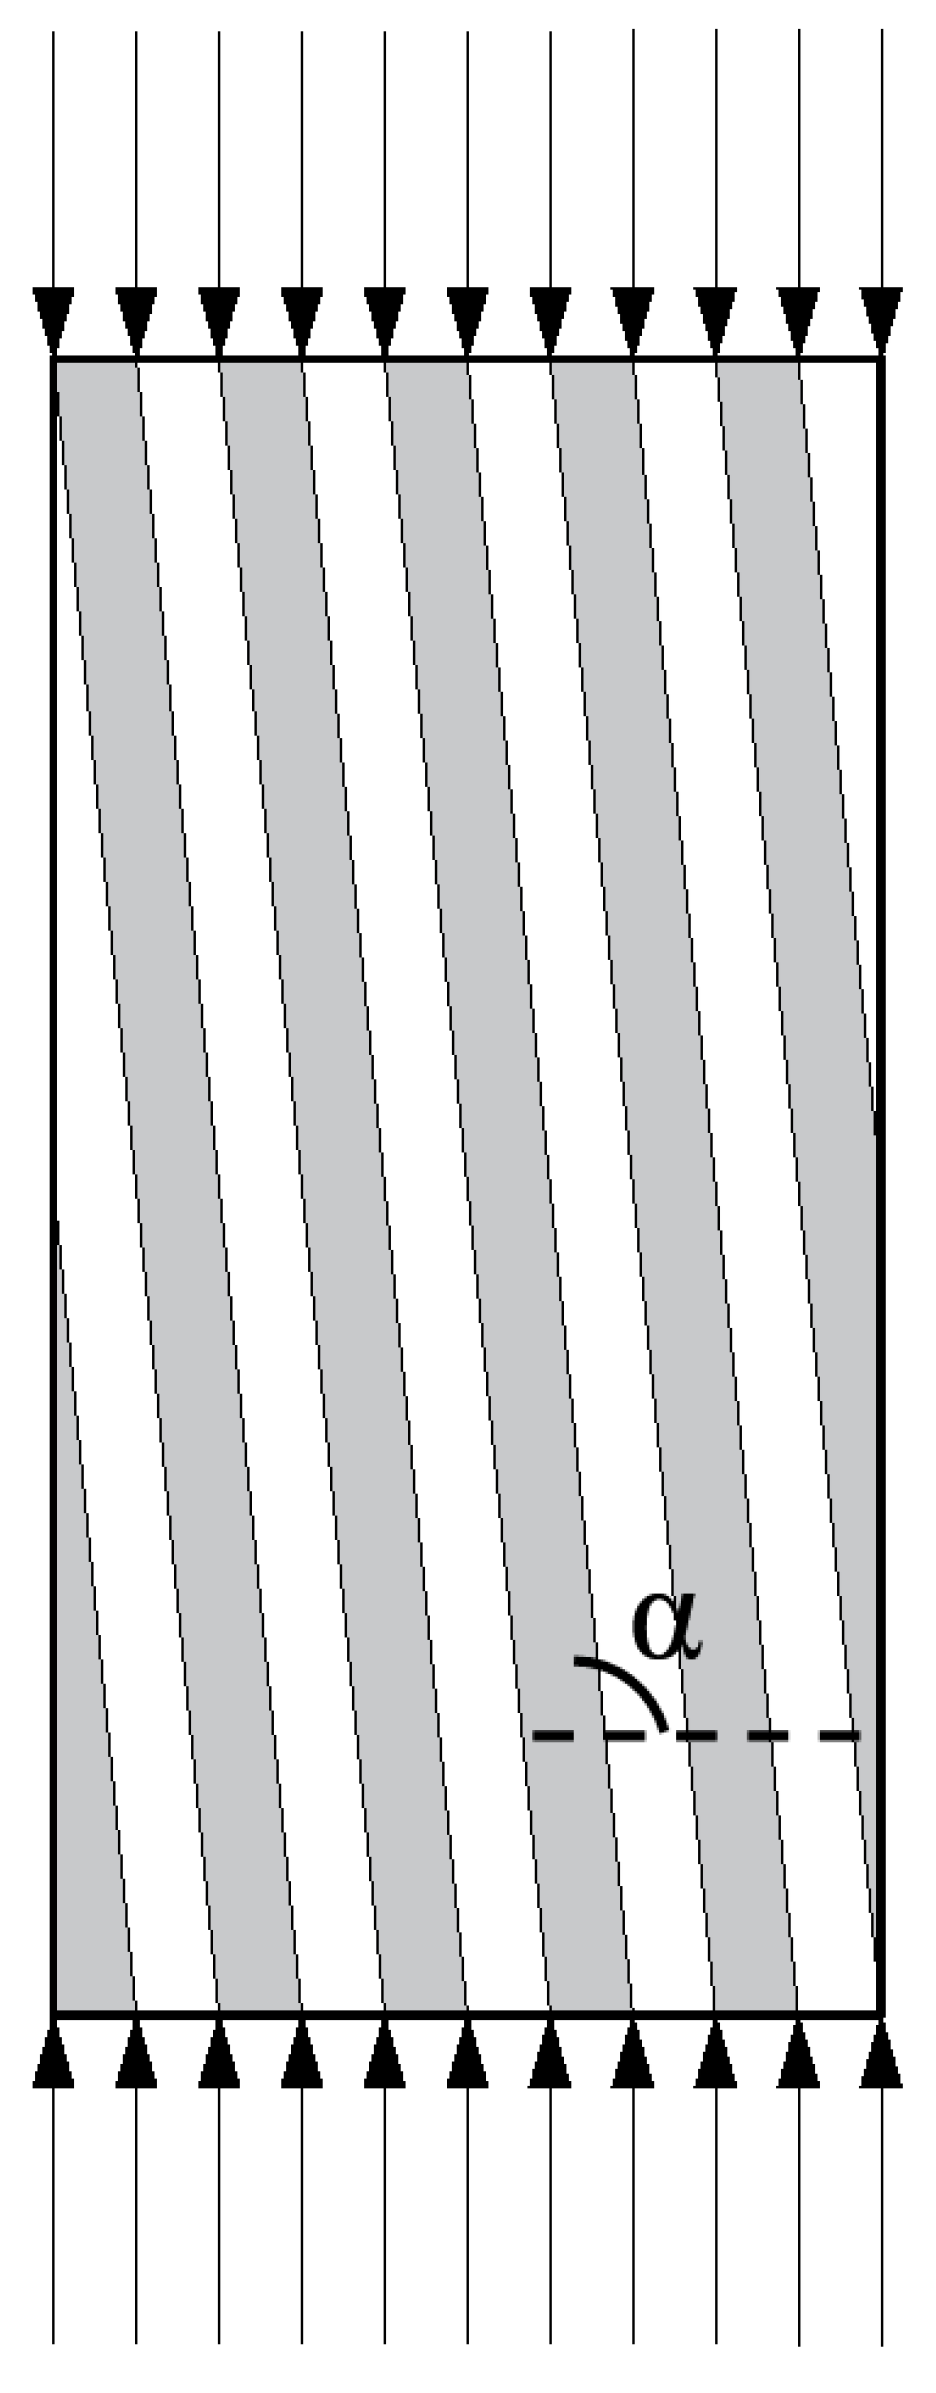
2.1. Numerical Experiments of Uniaxial Compressive on Layered Rock

The PFC2D 5.0 program is based on particle flow discrete elements and is widely used to simulate the generation and propagation of cracks in media. Simulation is performed by PFC (2D) 5.0, and the macroscopic mechanical parameters of the calculated model can be simulated by simply setting the meso-mechanical parameters of the particles. The PFC program provides two particle bonding models, contact bond (CB) junction and parallel bond (PB), and the parallel bond model can be used to simulate the adhesion of cementitious material between two adjacent particles; when the normal or tangential stress exceeds the corresponding parallel bond strength, tensile microcracks or shear microcracks and parallel bond failure will occur.
Figure 1 shows the loading conditions of the layered rock specimens. α is the bedding dip. The numerical model with PFC2D setting different bedding inclination dips (0° to 180°, one every 30°) is used for numerical simulation, the model size is 50 mm × 100 mm, and the displacement loading method is used for simulation (Figure 2).
In this paper, the axial displacement loading rate is set to 0.0005 m/s, and the calculation termination condition is as follows: stop the calculation when the residual strength of the model reaches 60% of the peak strength. In order to better reflect the mechanical properties of rock, the parallel bond model is used as the contact model between particles, and the smooth joint model is used between bedding planes. The initial parameters of the model are derived from the research results of Xia [39] and Yin [18], and then adjusted according to the macroscopic mechanical parameters and failure modes. The final meso-mechanical parameters of the numerical calculation model are shown in Table 1.
Jaeger [19] proposed the single weak surface principle, which assumed that the transversely isotropic rock material consists of a rock medium and a set of parallel bedding weak surfaces. The failure of rock medium and weak bedding follows the Mohr–Coulomb criterion [40], but the cohesion and internal friction dip of rock medium and weak bedding are not equal. Therefore, the breaking criterion is formulated as follows:
For the destruction of rock materials,
τ = c + σ tan φ
For the destruction of bedding surfaces,
τ θ = c w + σ θ tan φ w
where c and φ are the cohesive force and internal friction dips of the rock medium, respectively, and cw and φw are the cohesion and internal friction dips of the bedding surface. τ and σ are tangential stress and normal stress, respectively. τθ and σθ are the tangential stress and normal stress when the dip of the bedding plane is θ, respectively.
As shown in Figure 3, there is a weak surface in the rock, and the dip between this weak surface and the minimum principal stress is β . From the single weak surface theory, it can be seen that the conditions for failure along the weak surface are
σ 1 = σ 3 + 2 ( c w + σ 3 tan φ w ) ( 1 tan φ w cot β ) sin 2 β
By taking the derivative of β so that the first derivative is zero, then we can find that the condition satisfying the minimum σ1 is,
β = π 4 + φ w 2
When the rock sample does not fail along the weak surface, its strength is equal to that of the rock, and the dip between the crack surface and σ1 is
β 0 = π 4 + φ 0 2
From a large number of laboratory test results, it can be concluded that, for layered rock specimens, when the dip of the bedding plane is 60°, the uniaxial compressive strength reached the minimum value, and the sample underwent slip failure along the bedding plane.

2.2. Failure Laboratory Test on Uniaxial Compression of High-Rise Polytechnic Marble

In the uniaxial compression test, a total of 4 marble specimens are loaded, and the bedding dips of these 4 rock specimens are 90°, 100°, 105° and 110°, respectively. The rock specimen is a 50 mm × 50 mm × 100 mm cuboid (Figure 4). The rock mechanics’ test system of TAW-3000 is used for the test. The uniaxial compression test is performed with displacement loading in the direction parallel to the longest size of the specimen and applied at a loading rate of 0.002 mm/s. At the beginning of the experiment, the loading system and the high-speed camera are running simultaneously. The loading system can record the axial load, axial displacement and other parameters of the loading process. The high-speed camera (Prosilica GX2750C) produced by the Allied Vision Technologies company in Germany is used to record high-resolution images at a rate of 10 fps for analysis of the development of surface cracks in rock specimens.

3. Results

3.1. Numerical Simulation Experiment Results

In the numerical models and the corresponding failure results, the models with different dip bedding show different crack distribution states (Figure 5). The bedding plane is shown as a light blue dotted line, the tensile cracks are represented by TF(Tensile Failure), and the shear-slip along the bedding plane is represented by SP (Shear-Slip). The model with a bedding dip of 0° almost only produces tensile cracks (TF-0A and TF-0B in Figure 5a), which are distributed between the bedding planes and do not penetrate them. When the bedding dip is 30°, the model mainly undergoes shear-slip along the bedding plane (SP-30 in Figure 5b), and secondary tensile cracks (TF-30A and TF-30B in Figure 5b) develop during the slip process. When the bedding inclination increases to 60°, the model basically only generates two major cracks, and a slip occurs (SP-60 in Figure 5c). The model with a bedding inclination dip of 90° produces tensile cracks along the vertical bedding plane (TF-90A and TF-90B in Figure 5d). The cracks generated by the models with bedding inclination dips of 120° and bedding inclination dips of 150° are symmetrical with the models with bedding inclination dips of 60° and 30°, respectively, but basically only the shear-slip surfaces SP-120 and SP-150 are generated, and there are almost no obvious tensile cracks (Figure 5e,f).
With the increase in the dip of the bedding, the failure mode of the numerical model undergoes a process of “tensile failure → compression-shear failure → shear failure → tensile shear failure → tensile failure”. The slip phenomenon along the bedding plane can be observed in the numerical models with bedding inclination dips of 30°, 60°, 120°, and 150°, among which the slip phenomenon is most obvious in the models with bedding dips of 60° and 120°, which is consistent with the results derived from the single weak surface principle in Chapter 2.1.2. When the bedding plane is perpendicular or parallel to the loading direction, the model is dominated by tensile failure, and the bedding plane is obliquely intersected with the loading direction. The model is dominated by shear-slip failure, which is consistent with the results of [12].

3.2. Uniaxial Compression Experiment Results

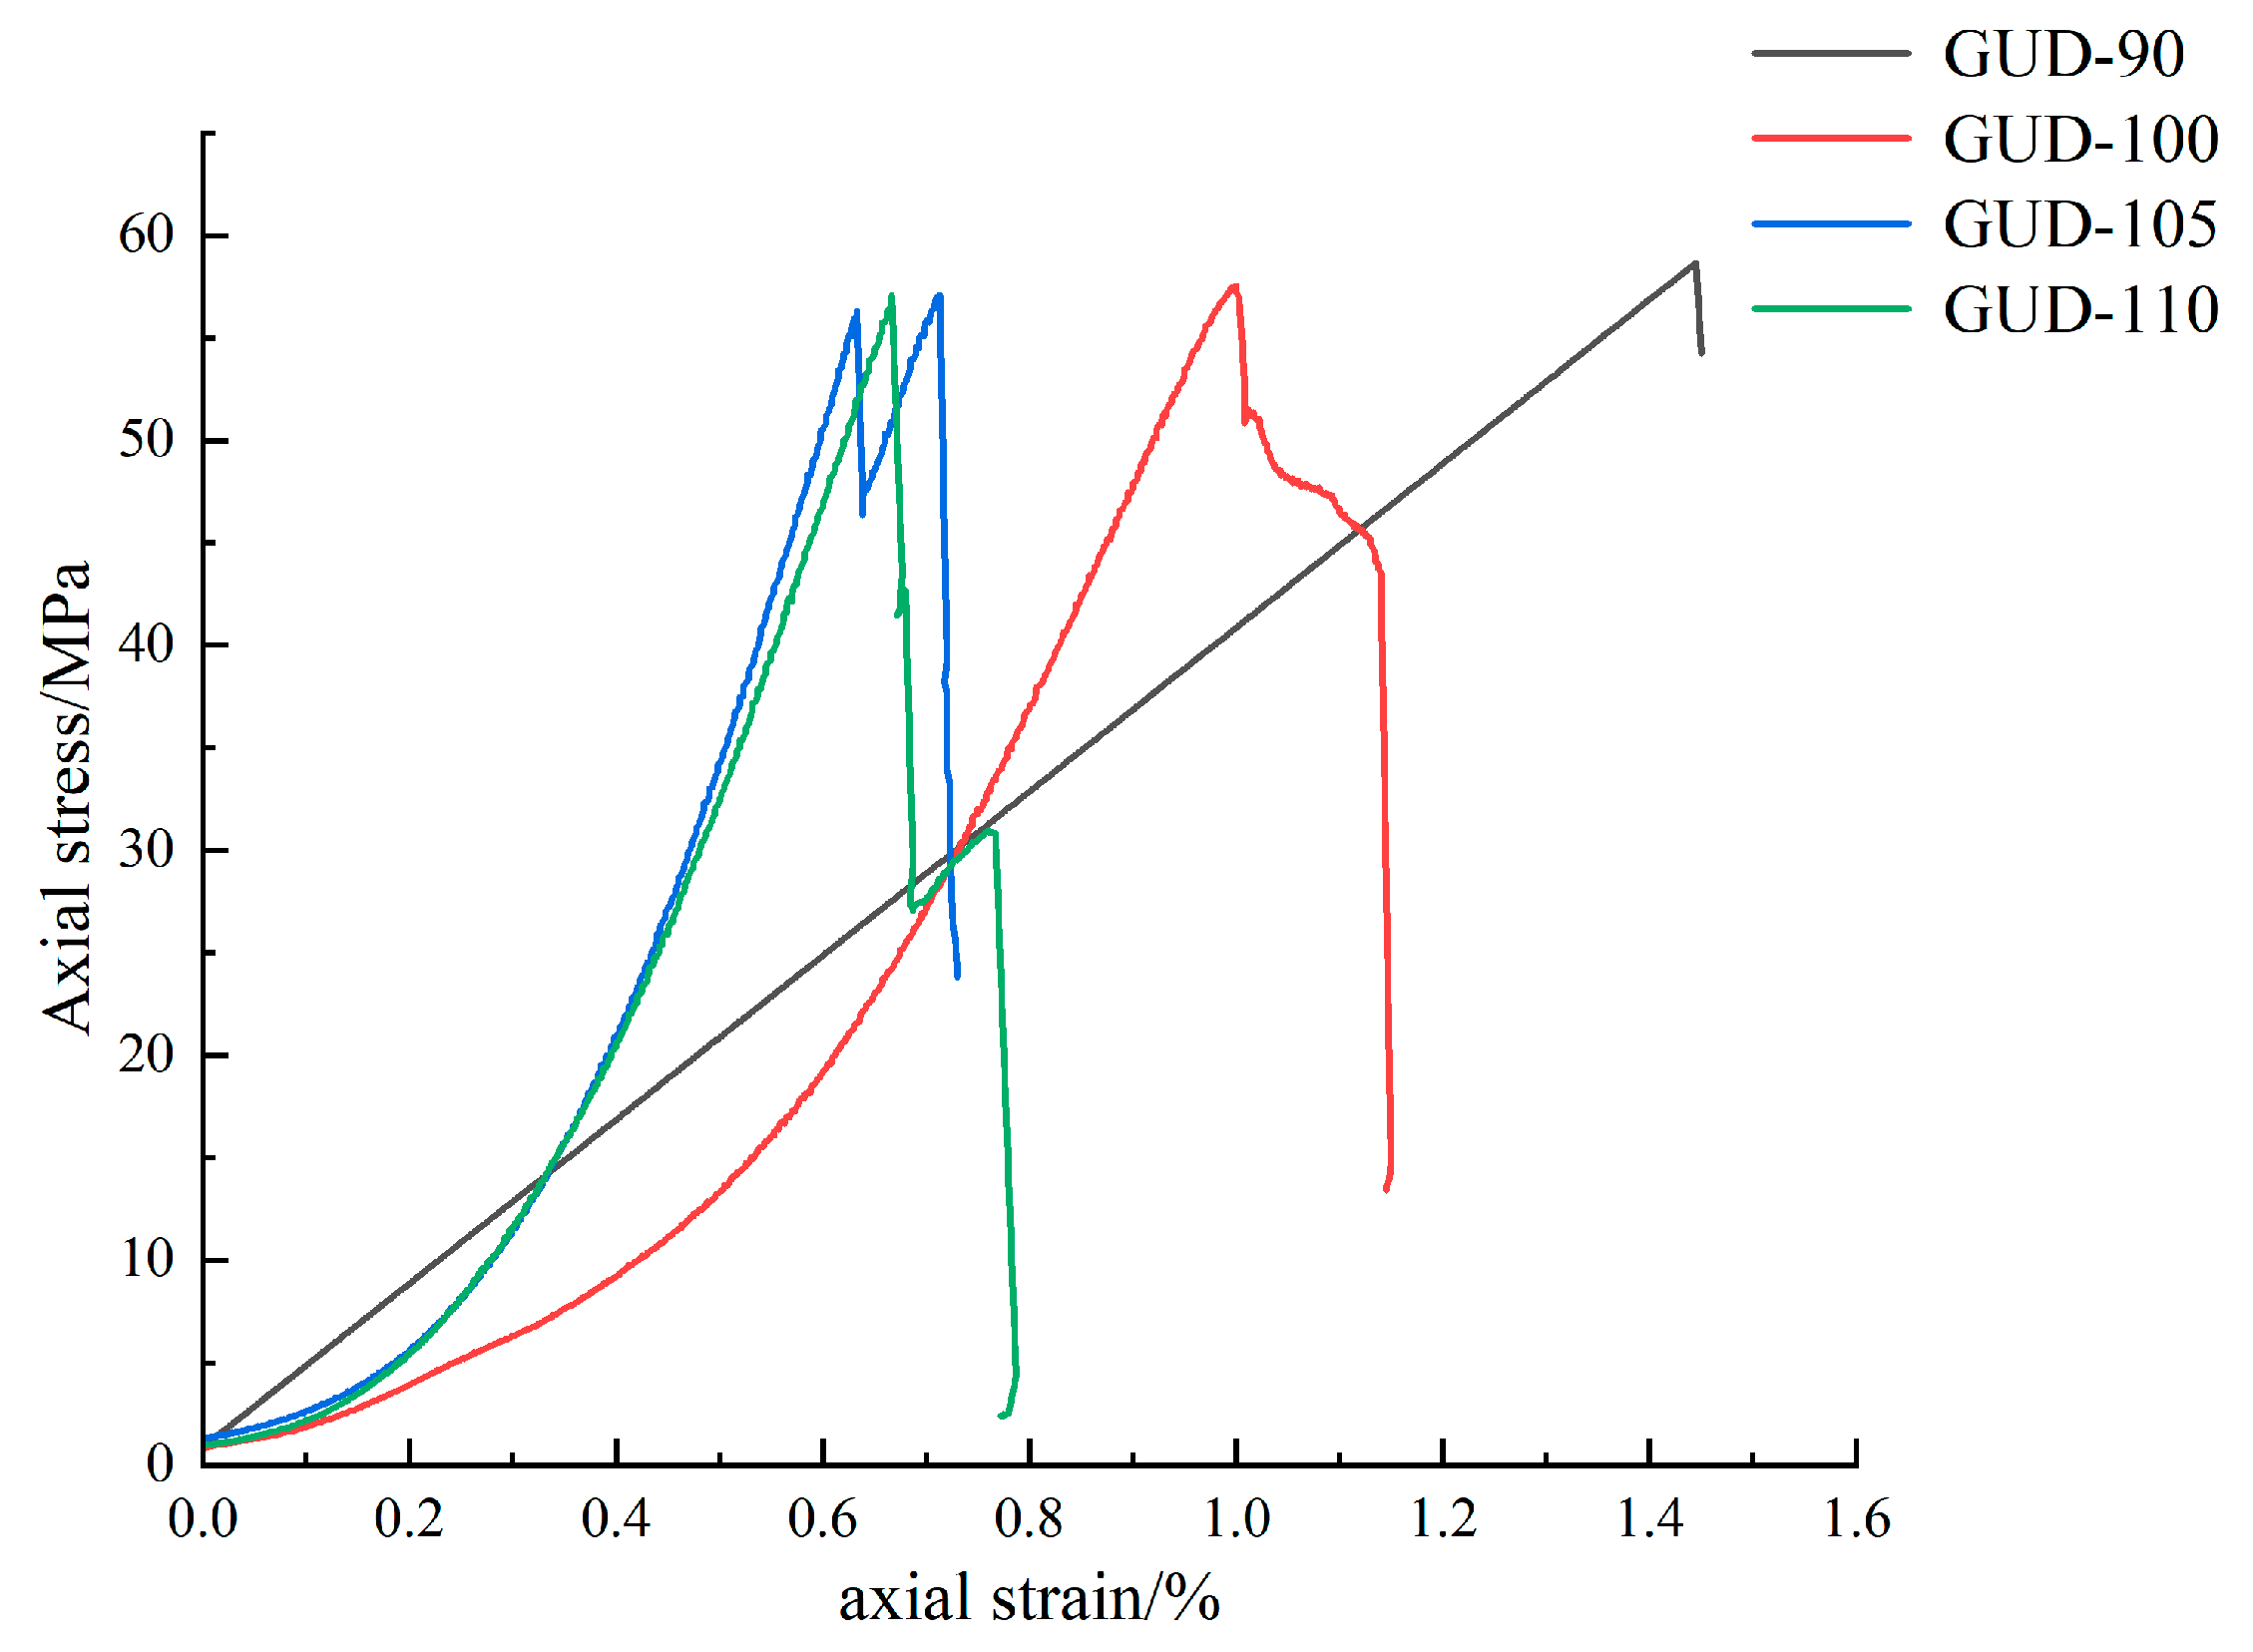
3.2.1. Mechanical Analysis of Rock Failure Process of Different Bedding Structures

The stress-strain curves of rock specimens with different dip bedding are shown in Figure 6. There is no significant difference in the peak strength of rock specimens at different bedding dips, but the peak strain decreases with the increase in bedding dip. The elastic modulus of the rock specimen increases with the increase in bedding dip. In addition, the increase in bedding inclination leads to the shortening of the compaction stage and elastic stage of the micro-cracks on the stress–strain curve, as well as the early appearance of the peak stress. Compared with other specimens, the stress–strain curve of GUD-90 specimen is different from that of typical rock stress–strain curves, but shows an obvious linear growth trend, and the specimen suddenly fails after reaching the peak strength, showing obvious brittle features, which is consistent with the tensile failure mode of GUD-90 specimens. Before the GUD-105 specimen reaches its peak strength, the stress on the stress–strain curve drops sharply and then rises, which is caused by the slippage of the internal bedding surface of the specimen, but does not cause the overall failure of the specimen, and then the axial load continues to increase, the key parts of the bedding and rock medium are damaged, the stress–strain curve reaches the peak point, and the overall failure of the specimen occurs.

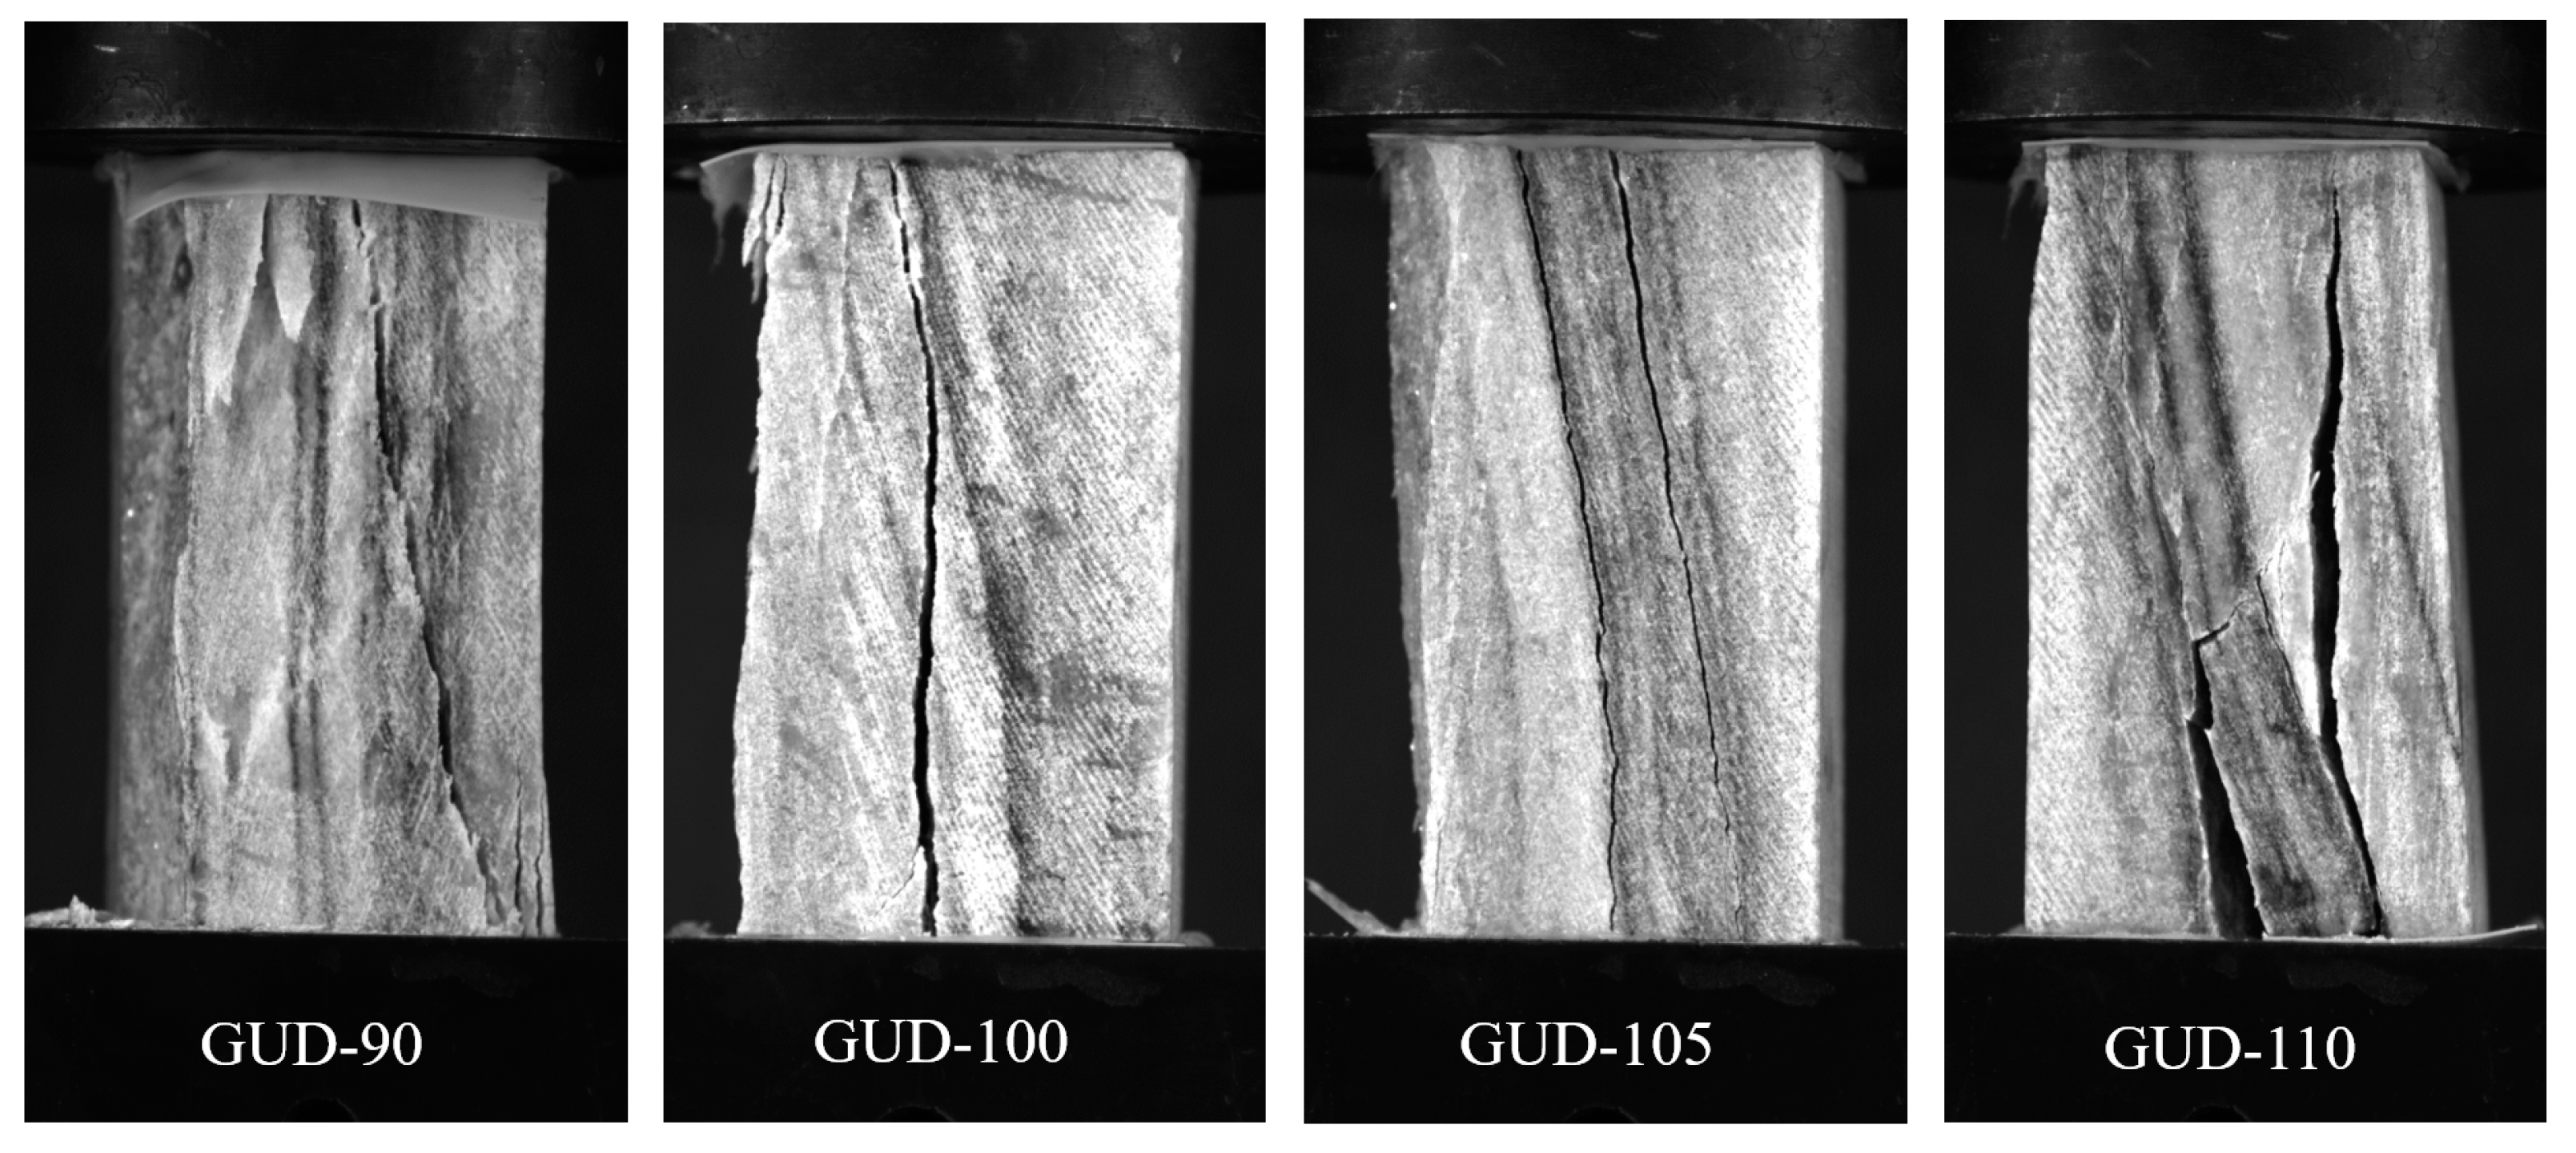
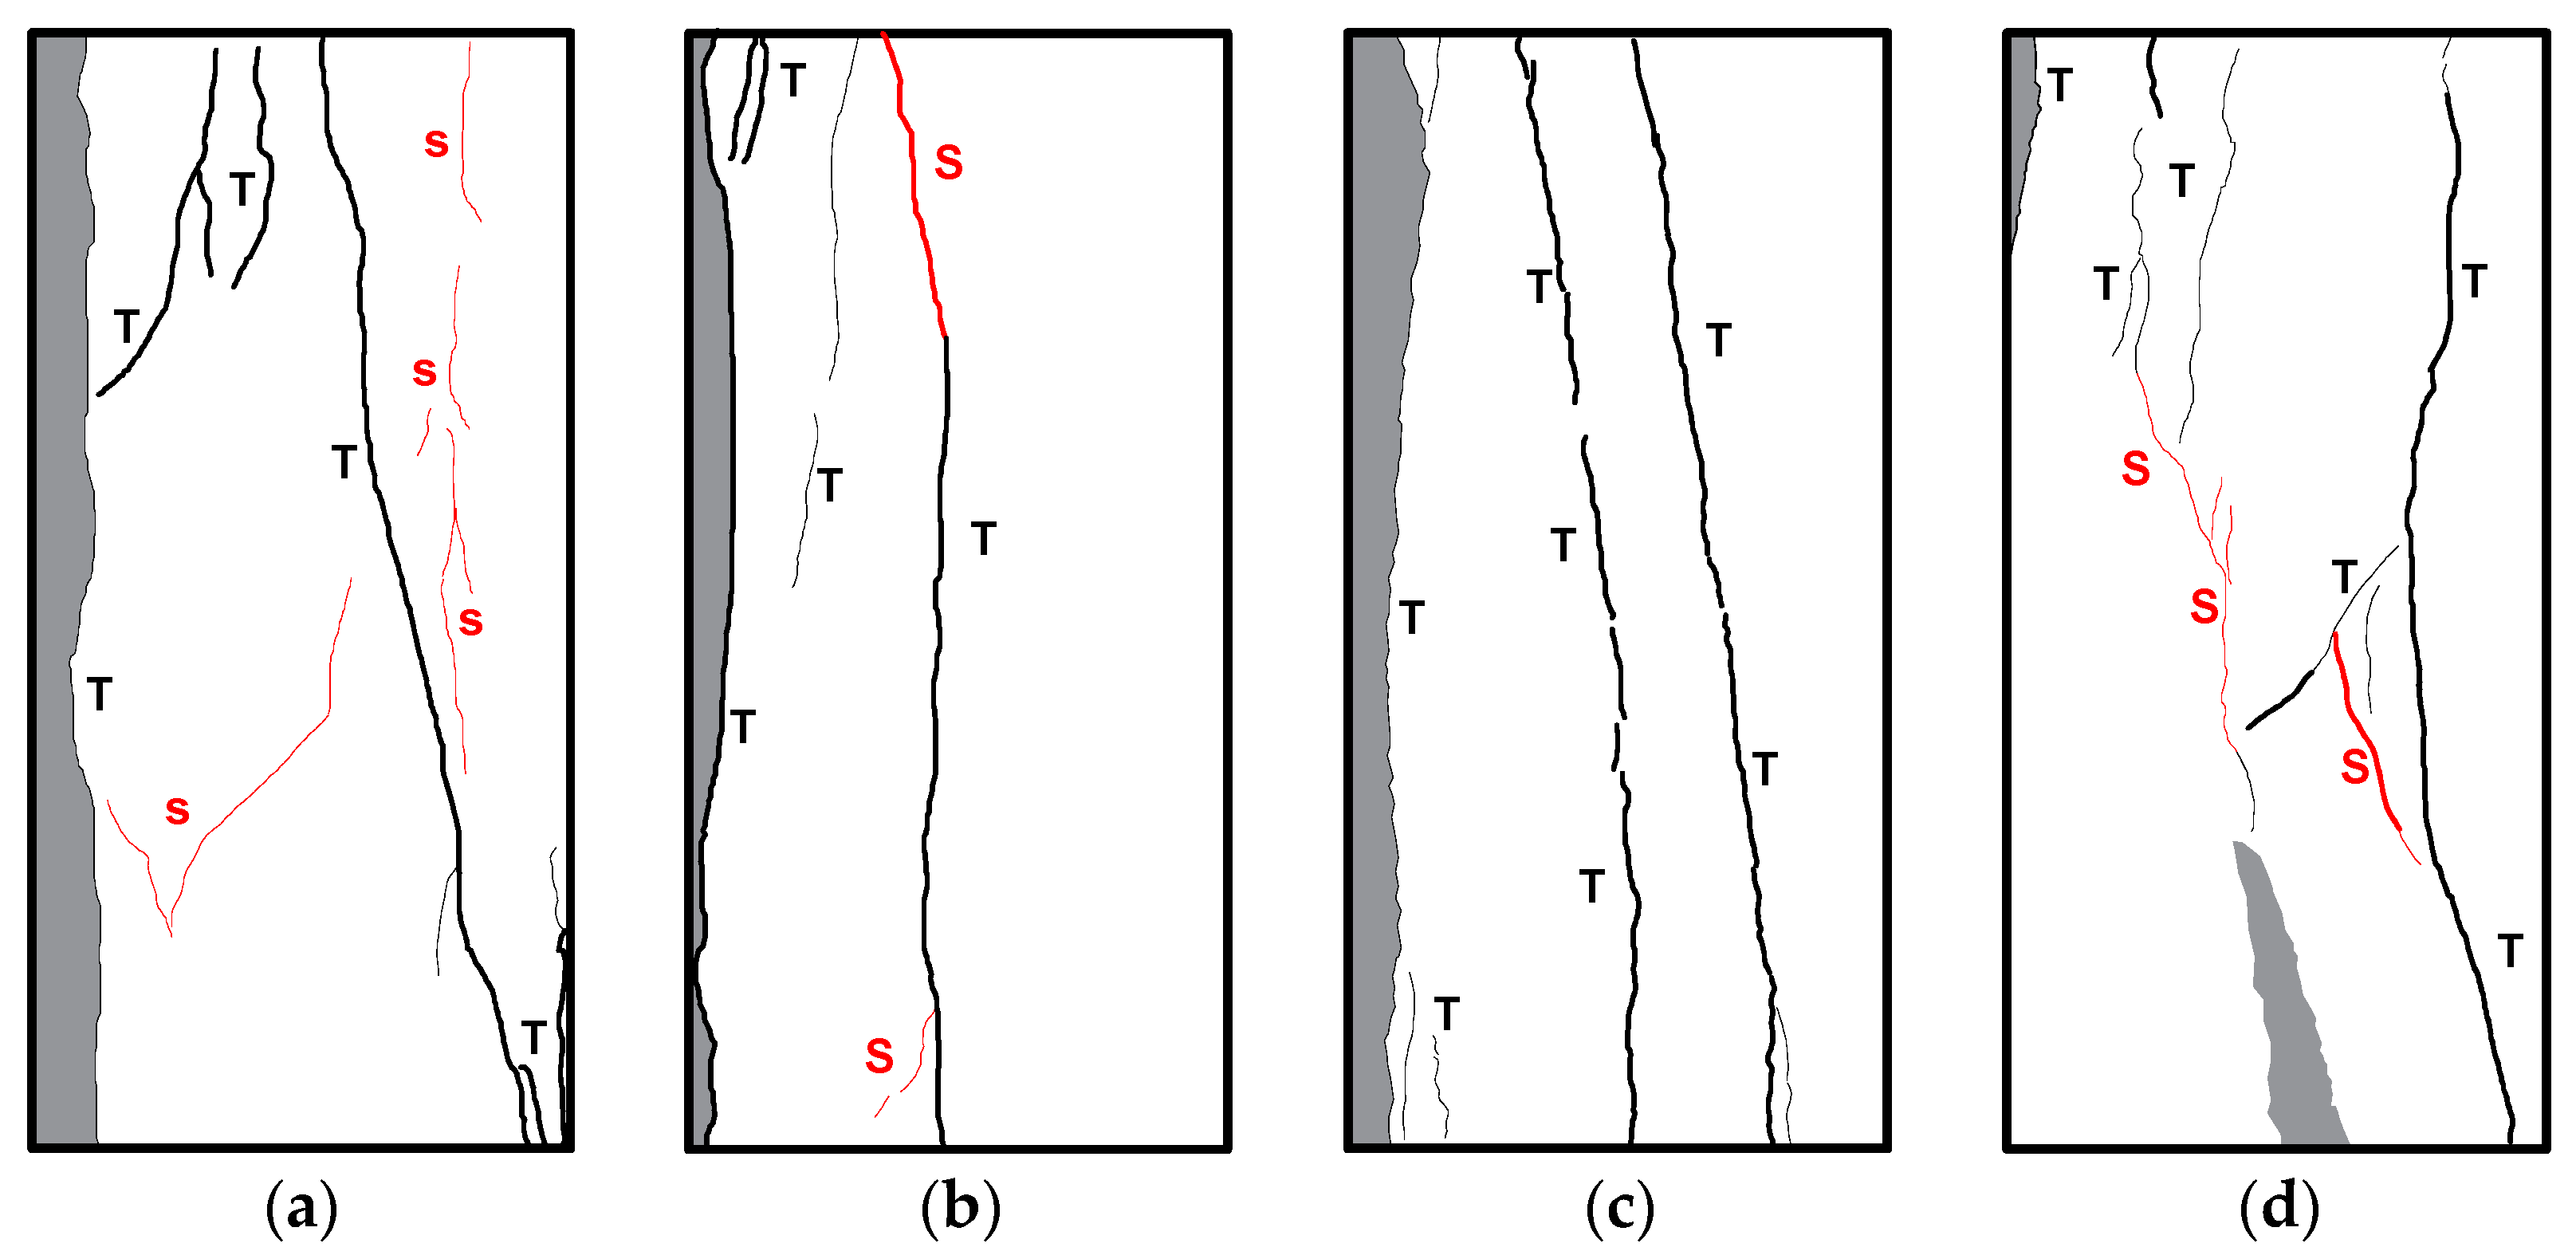
3.2.2. Crack Distribution in the Failure of Rocks with Different Bedding Structures

The failure of rock specimens is a complex process and, according to Griffith’s hypothesis, crack begins due to pre-existing cracks and defects in brittle materials. Microcracks occurred when the local stress exceeds the local strength, and the merging of multiple microcracks would lead to macroscopic cracks. Crack initiation, propagation, and overall sample failure were different continuous processes. The failure of rock specimen began with the growth of microfracture and ended with the complete crack of the specimen [3]. High-speed cameras record high-resolution images at a rate of 10 fps for analysis of the development of surface cracks in rock specimens. Figure 7 shows the photos of each rock specimen after uniaxial compression failure collected by the high-speed camera. From all the collected photos, those of cracks, crack propagation and final failure on the surface of each rock specimen were screened out. The surface crack images of the rock specimens in these photos were depicted to form a schematic diagram of the relative position of the surface crack distribution of the rock specimens (Figure 8A–D).
At the beginning, a small part of the thin section peels off in the upper left corner of the GUD-90 specimen, and the initial dominant crack Y-90a is formed on the left side of the specimen. It is arranged in a continuous manner parallel to the bedding plane but does not penetrate it. Subsequently, the opening of the crack Y-90a increases rapidly, resulting in an I-type crack and detachment (S1). The dominant crack Y-90b originates from the center of the top surface of the specimen and extends to the bottom right corner with an inclination dip of 100°, and finally forms a type II crack and penetrates through the specimen. The secondary cracks C-90a and C-90b originate from the center of the top of the specimen, and they are distributed at equal intervals to form feathered cracks, with inclination dips of 75° and 84°, respectively, and the edges of the two groups of cracks result in surface flakes of debris peeling. The secondary crack C-90c is Y-shaped, and the secondary crack C-90d is combined into a continuous plume crack in the same direction, with an inclination dip of about 87°.
The GUD-100 specimen produces the dominant crack group Y-100a from the center of the apex, which is discontinuous, with an inclination dip between 90° and 99°, which is basically parallel to the bedding plane. As the loading continues, the dominant crack Y-100b is generated on the left side of the top of the specimen, which is distributed in a goose-shaped crack with an inclination dip of about 83°, and the crack falls off along the crack on the left side of the specimen. The discontinuous cracks of Y-100a in the dominant crack group are gradually connected, and eventually penetrate the upper and lower surfaces of the specimens, forming I-type cracks. The initiation position of the secondary crack C-100a is close to that of the crack group Y-100a, with a dip of 76°–84°. The crack extends from the middle of the specimen to the lower left corner. After the left end of the specimen peels, the spalling surface becomes a free surface, and the secondary crack C-100b sprouts at the upper left end of the specimen, which is almost connected to the spalling surface.
The initial crack of the GUD-105 specimen originates on the right side of the bottom end, and the modified crack extends to the top of the specimen along the direction of the bedding plane, with an inclination dip of about 90°–105°, then forming the dominant crack Y-105a. The dominant crack Y-105b originates in the middle of the bottom end and expands rapidly in the direction parallel to the bedding plane, and penetrates the upper and lower end faces of the specimen. As the loading continues, a vertical tensile dominant crack Y-105c appears on the left side. It initially has an inclination dip of 102°, which is parallel to the bedding plane, and rapidly expands when it extends to the middle, resulting in an I-type crack with an inclination dip of about 90°. Then, rock spalling appears on the left side. The width of the dominant cracks Y-105a and Y105b continues to increase, and both of them penetrate through the upper and lower surfaces, forming I-type cracks. The secondary crack C-105a appears near the germination position of the dominant crack Y-105a at a dip of about 100°. The secondary crack C-105b parallel to the spalling surface appeared at both ends of the left spalling surface, with a dip of 90°–98°, while C-105c displayed a dip of about 78°.
The primary crack of the GUD110 specimen is the dominant crack Y-110a, which originates in the middle of the bottom end, and the inclination dip of the crack is 94°–102°, which is roughly parallel to the bedding plane. A group of wing-shaped dominant cracks Y-110b (dip 91°–114°) are generated in the middle of the top. Y-110a and Y-110b are connected in the middle to form a wing-shaped crackY-110c. As the loading continued, the crack at the formation of Y-110a expands, and a second dominant crack Y-110d parallel to the bedding germinates on the right side of the bottom end, and Y-110d initially develops along the bedding plane at a dip of about 104° and quickly extends vertically upward. After continuous loading, the upper left corner of the specimen produced a thin section peeling, the opening of Y-110a and Y-110d increases sharply, the specimen expands, and the I-type crack occurs along the two dominant cracks. The secondary crack C-110a germinates in the middle of the top, develops to the lower left and connects with the dominant crack Y-110a. In the middle of the specimen, the shear crack C-110b is generated between the dominant crack Y-110a and Y-110d, which is arranged in a plume through the bedding plane with an inclination dip of about 52°. Crack C-110b connects with two dominant cracks, and the opening gradually increases, resulting in type II cracks.

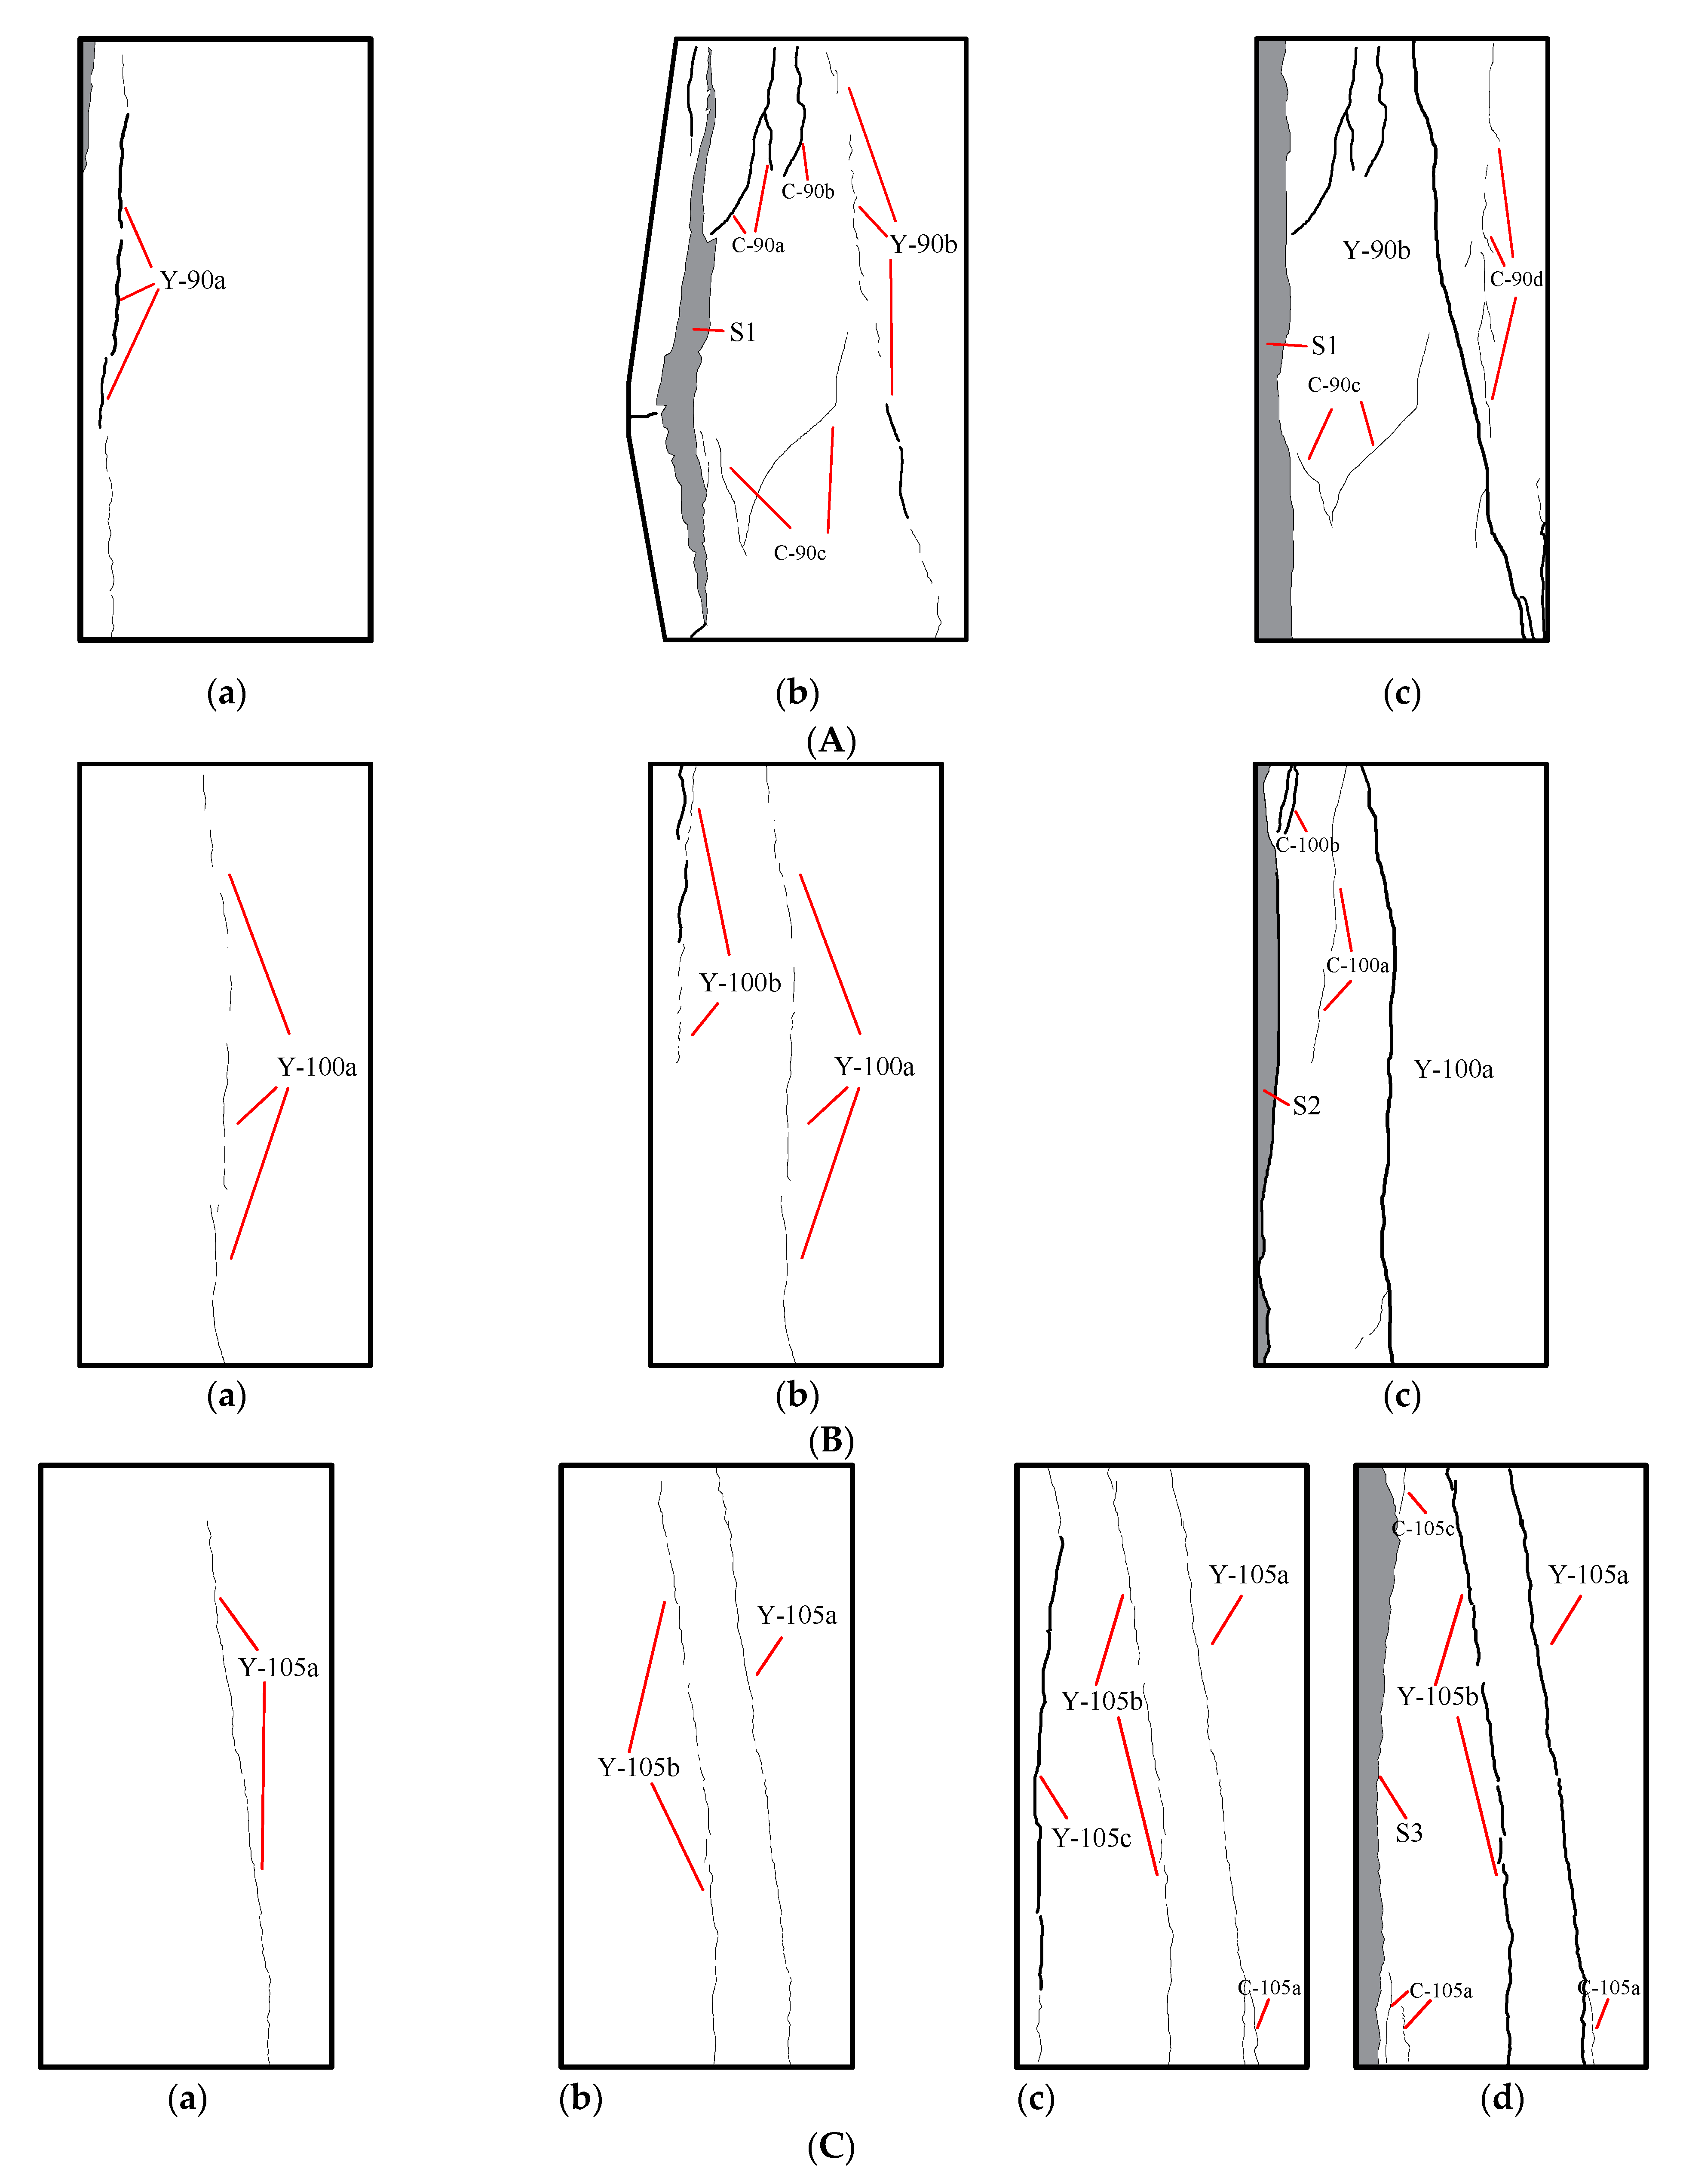
3.2.3. The Distribution of Cracks in High-Rise Marble

According to the relationship between the initiation and development of cracks on the surface of rock specimens and their relative positions, the crack distribution is divided into the following four categories: penetrating type, shedding type, pinnae type, and associated type. The distribution of each type is as follows.
Penetrating type: Penetrating cracks are mainly dominant tensile cracks related to bedding planes, and most of these types of cracks originate from the end face of the specimen, gradually extend and expand to the middle of the specimen, and finally penetrate the upper and lower ends of the specimen (Figure 8A(c) Y-90b, Figure 8B(c) Y-100a, Figure 8C(c) Y-105a and Y-105b, Figure 8D(c) Y-110d).
Shedding type: Similar to through-type cracks, shedding cracks are also generated from the end face of the specimen, but most of them extend vertically and expand rapidly before the final crack occurs, resulting in the rock on the outside of the crack bending and cracking, and finally falling off (Figure 8A(c) S1, Figure 8B(c) S2, Figure 8C(d) S3).
Pinnae type: Most of this type are secondary cracks, which are formed during the extension of dominant cracks, and appear as branches of dominant cracks, or appear plume-like by themselves, at a certain dip with the dominant cracks, mainly as tensile cracks (Figure 8A(c) C-90b, Figure 8B(c) C-100a, Figure 8C(c) C-105a, Figure 8D(c) C-110b).
Associated type: This mainly forms by the interaction due to spatial location during the propagation of dominant cracks, or near the shedding surface, as secondary shear cracks that penetrate between the dominant cracks (Figure 8A(c) C-90a, Figure 8D(c) C-110b), or dominant tensile cracks roughly parallel to the shedding surface (Figure 8A(c) C-90a and C-90b, Figure 8B(c) C-100b and C-100c, Figure 8C(c) C-105b).

4. Discussion

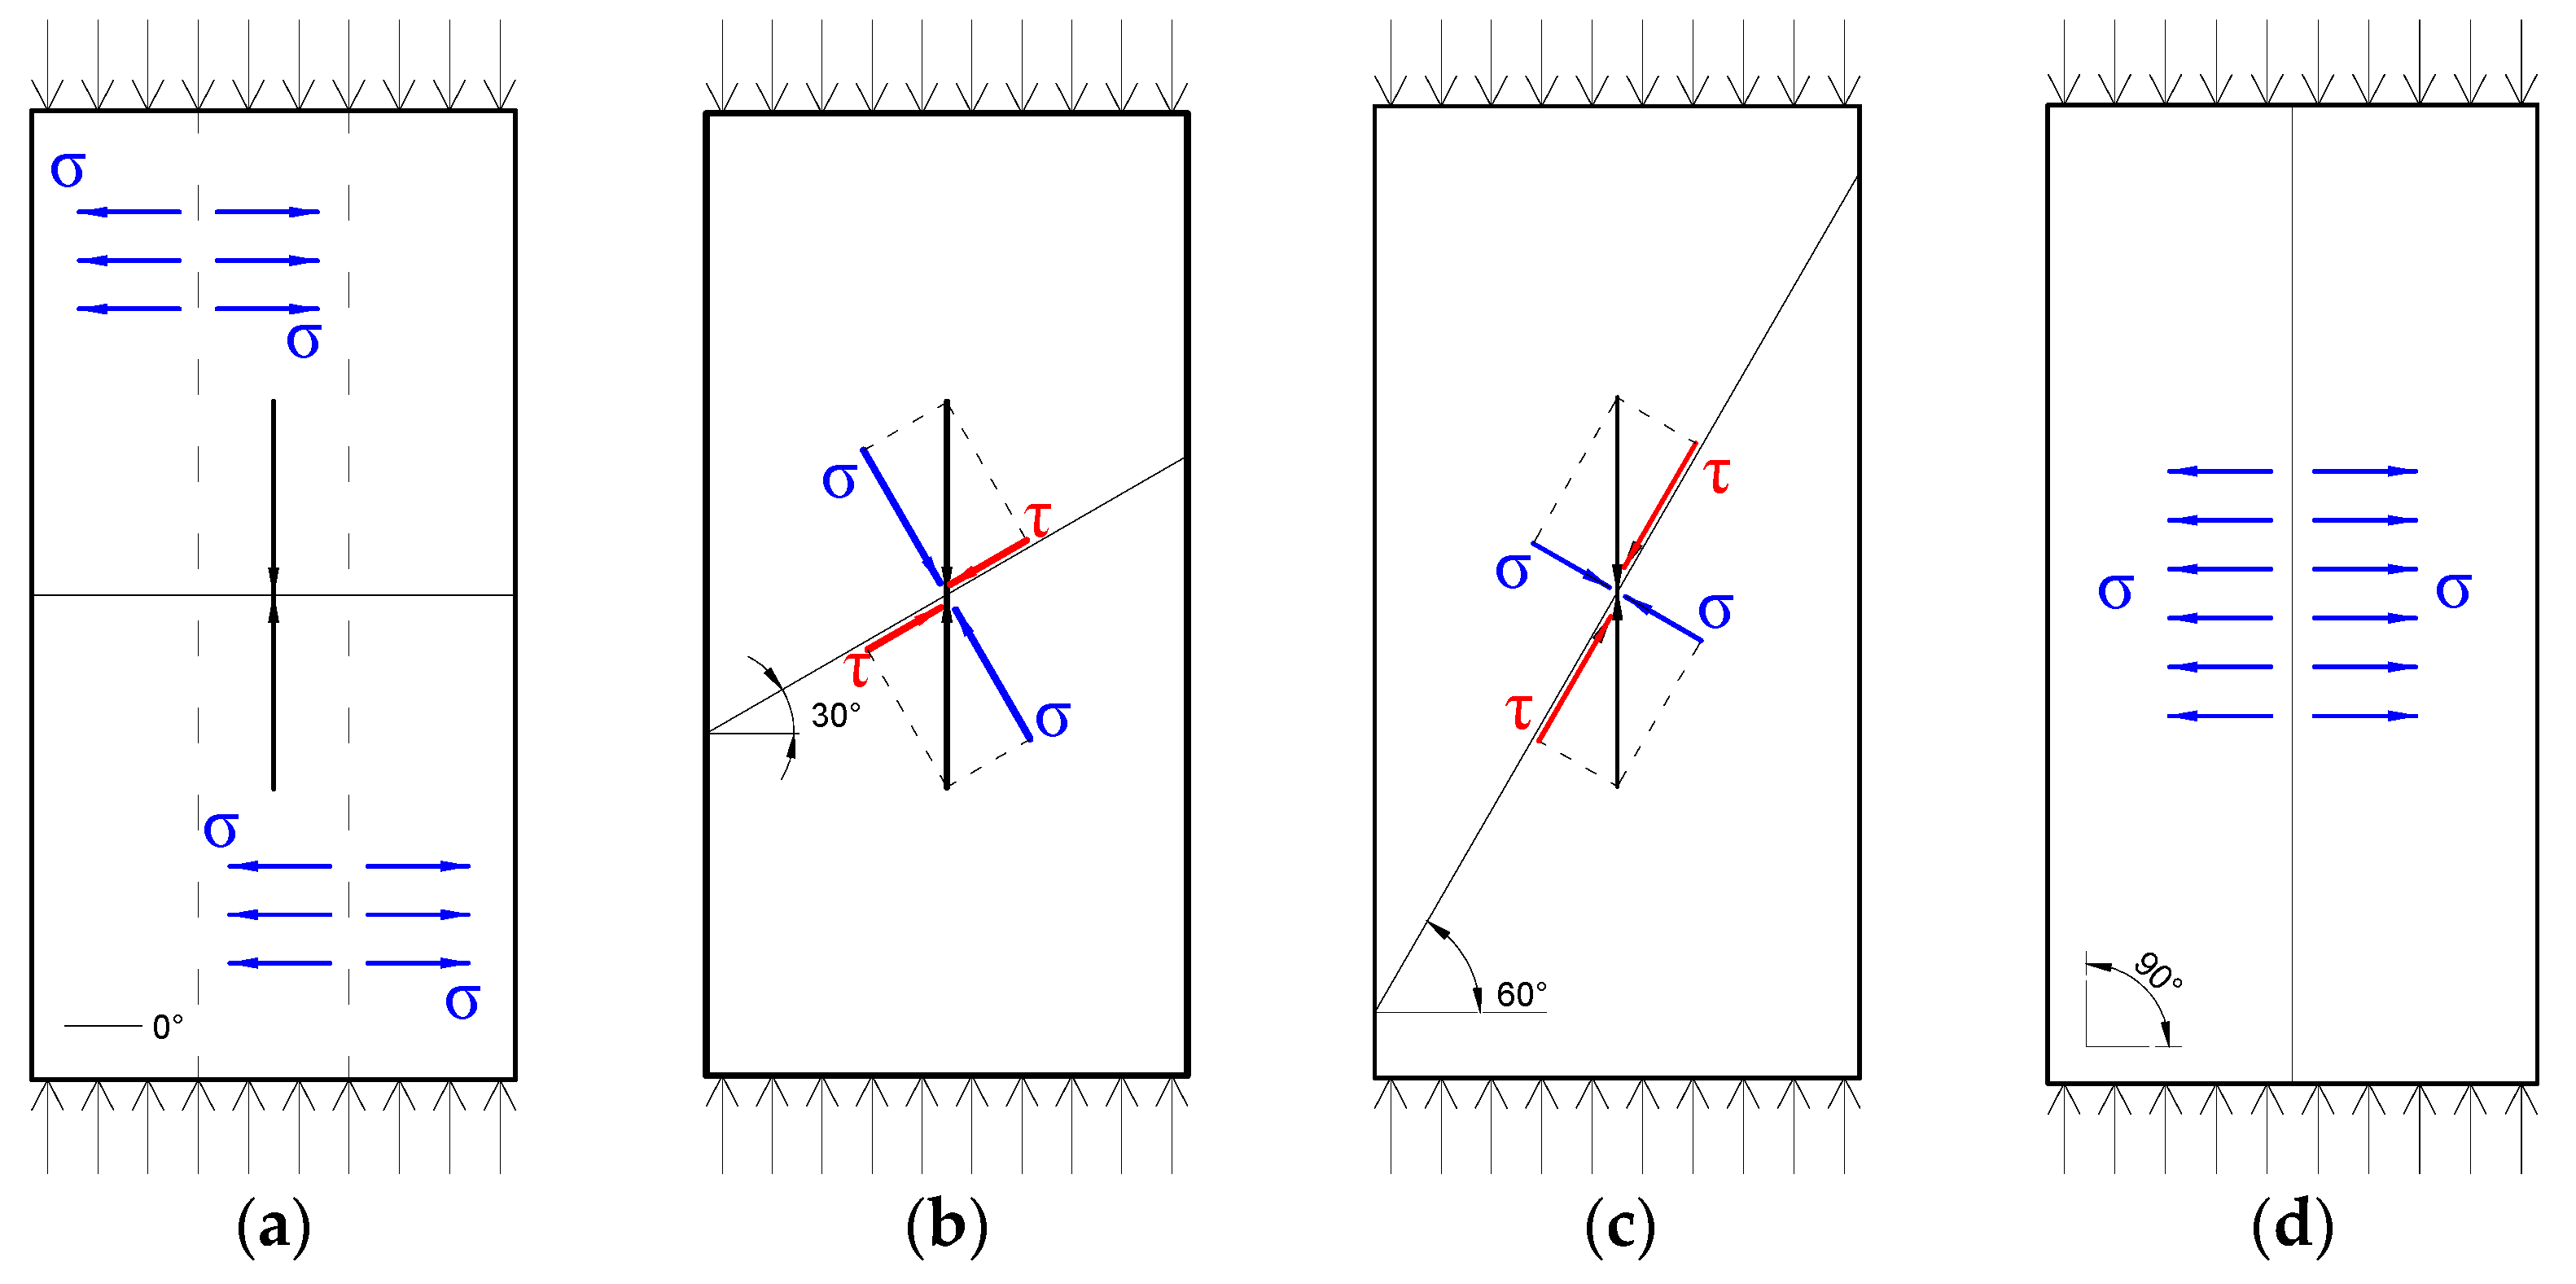
4.1. Relationship between Crack Distributions and Stress States

4.1.1. The Correlation between Dominant Cracks and Principal Stress Field

Under the same loading conditions, rock specimens with different bedding dips will form different internal principal stress distribution states. Stress analysis is performed on the bedding planes at different dips, and the results are shown in Figure 9. When the bedding dip is 0°, the principal stress inclination dip will increase with the vertical direction due to the vertical principal stress generated by the axial load and the bedding surface, and the vertical tensile crack inclination dip will increase with the increase in the bedding dip, and according to the crack distribution generated by the uniaxial compression experiment of the rock specimen (Figure 9a–d). It can be seen that the dominant crack inclination dip increases with the principal stress inclination dip, and the dominant crack inclination dip of the GUD-90 specimen is 90°–100°. The dominant crack inclination dip of the GUD-100 specimen is 90°–99°, the dominant crack inclination dip formed by the GUD-105 specimen is about 102°, and the dominant crack inclination dip of the GUD-110 specimen is about 104°. From the perspective of fault type, with the increase in bedding dip, the crack mode of rock specimens has formed a trend from I–II composite fault.
Based on the stress decomposition of the bedding plane and the results of the uniaxial compression experiment of the rock specimen, the distribution of the dominant cracks is basically consistent with the direction of the principal stress as the bedding plane tends from horizontal to vertical. According to the origin of cracks, the surface cracks of rock specimens can be divided into two types, shear crack and tensile crack (Figure 10). From the distribution of dominant cracks, the rock specimen with a bedding dip of 90° produces tensile cracks under uniaxial compression, and the failure mode is also a typical tensile failure. The dominant cracks penetrate the bedding plane and do not show a directional correlation with the bedding plane, which indicates that the bedding has no effect on the crack mode of the specimen at this time, the tensile cracks occur in the rock with the direction of principal stress, and the bedding dip is 100°. The dominant cracks generated by the rock specimens are parallel to the bedding plane at the initial initiation but, with the continuous loading, the dominant cracks are separated from the bedding plane in the development process, which also indicates that the strength of the rock specimen has nothing to do with the bedding plane with an inclination dip of 100°, the “tension shear” comprehensive failure of the specimen occurs with the direction of the principal stress, and the bedding inclination dip is 105°.
The failure mode and the feature of the dominant cracks show a strong correlation with the bedding plane, and the whole process from the initiation to the gradual extension and expansion of the dominant cracks basically coincides with the bedding plane, leading to the formation of tension cracks. The failure of the bedding dip of 110° rock specimens is basically dominated by the bedding plane, and the two main dominant cracks are formed in the type I fault of the bedding plane, and new cracks evolve in the development process. The above situation shows that when the bedding inclination dips are 105° and 110°, the bedding plane is basically the same as the principal stress direction, and the main failure of the specimen is carried out along the bedding plane direction.

4.1.2. The Correlation of Secondary Cracks and Secondary Stress Field

α = 0°, there are many secondary cracks in the model, which are mainly distributed between the bedding planes. The number of microcracks is large, the correlation between crack distribution and bedding is not large, and the difference with the dominant cracks is mainly that the crack size is small. α is 30°, the secondary cracks generated in the model show the branches of the dominant cracks, and the friction on the two sides of the dominant shear cracks during the slip process of the dominant shear cracks produces frictional effect on the block, so that the block produces tensile stress and forms secondary tensile cracks. α is 60°, the crack surface mainly develops along the bedding plane, and the crack surface coincides with the bedding plane, indicating that the stress state on the bedding at this dip is in the ultimate equilibrium state, and the number of secondary cracks is the least, which is consistent with the genesis of the secondary cracks in the 30° model, and the secondary stress field is also the tensile stress caused by the friction of the slip surface. α is 90°, the secondary cracks, like the dominant cracks, are basically parallel to the bedding plane, which is tensile cracks, and secondary cracks also appear at the loading ends, indicating that the secondary stress field is the tensile stress inside the block between the bedding planes.
The distribution of secondary cracks shows a pattern similar to that of dominant cracks. When the bedding inclination dip is 90°, most of the secondary cracks do not show the correlation with the bedding plane, or even the dominant cracks, and are vertically arranged plume cracks. There are few secondary cracks in the rock specimens with a bedding inclination dip of 100°, and the germination position is close to the dominant cracks, but the extension direction is not consistent with the dominant cracks, and there is no correlation with the bedding plane, and a few secondary cracks are formed due to the expansion and extension of the dominant cracks, which are the branches of the dominant cracks. Rock specimens with a bedding dip of 105°, the secondary cracks are all germinated due to the expansion of the dominant cracks, and the number is very small, and the crack length is short. When the bedding dip increases to 110°, most of the secondary cracks generated in the early stage of failure are parallel to the bedding plane, some of the secondary cracks are generated when the dominant cracks expand and develop along the bedding plane, and the remaining secondary cracks are generated between the two dominant cracks and connect the two dominant cracks through the bedding plane.

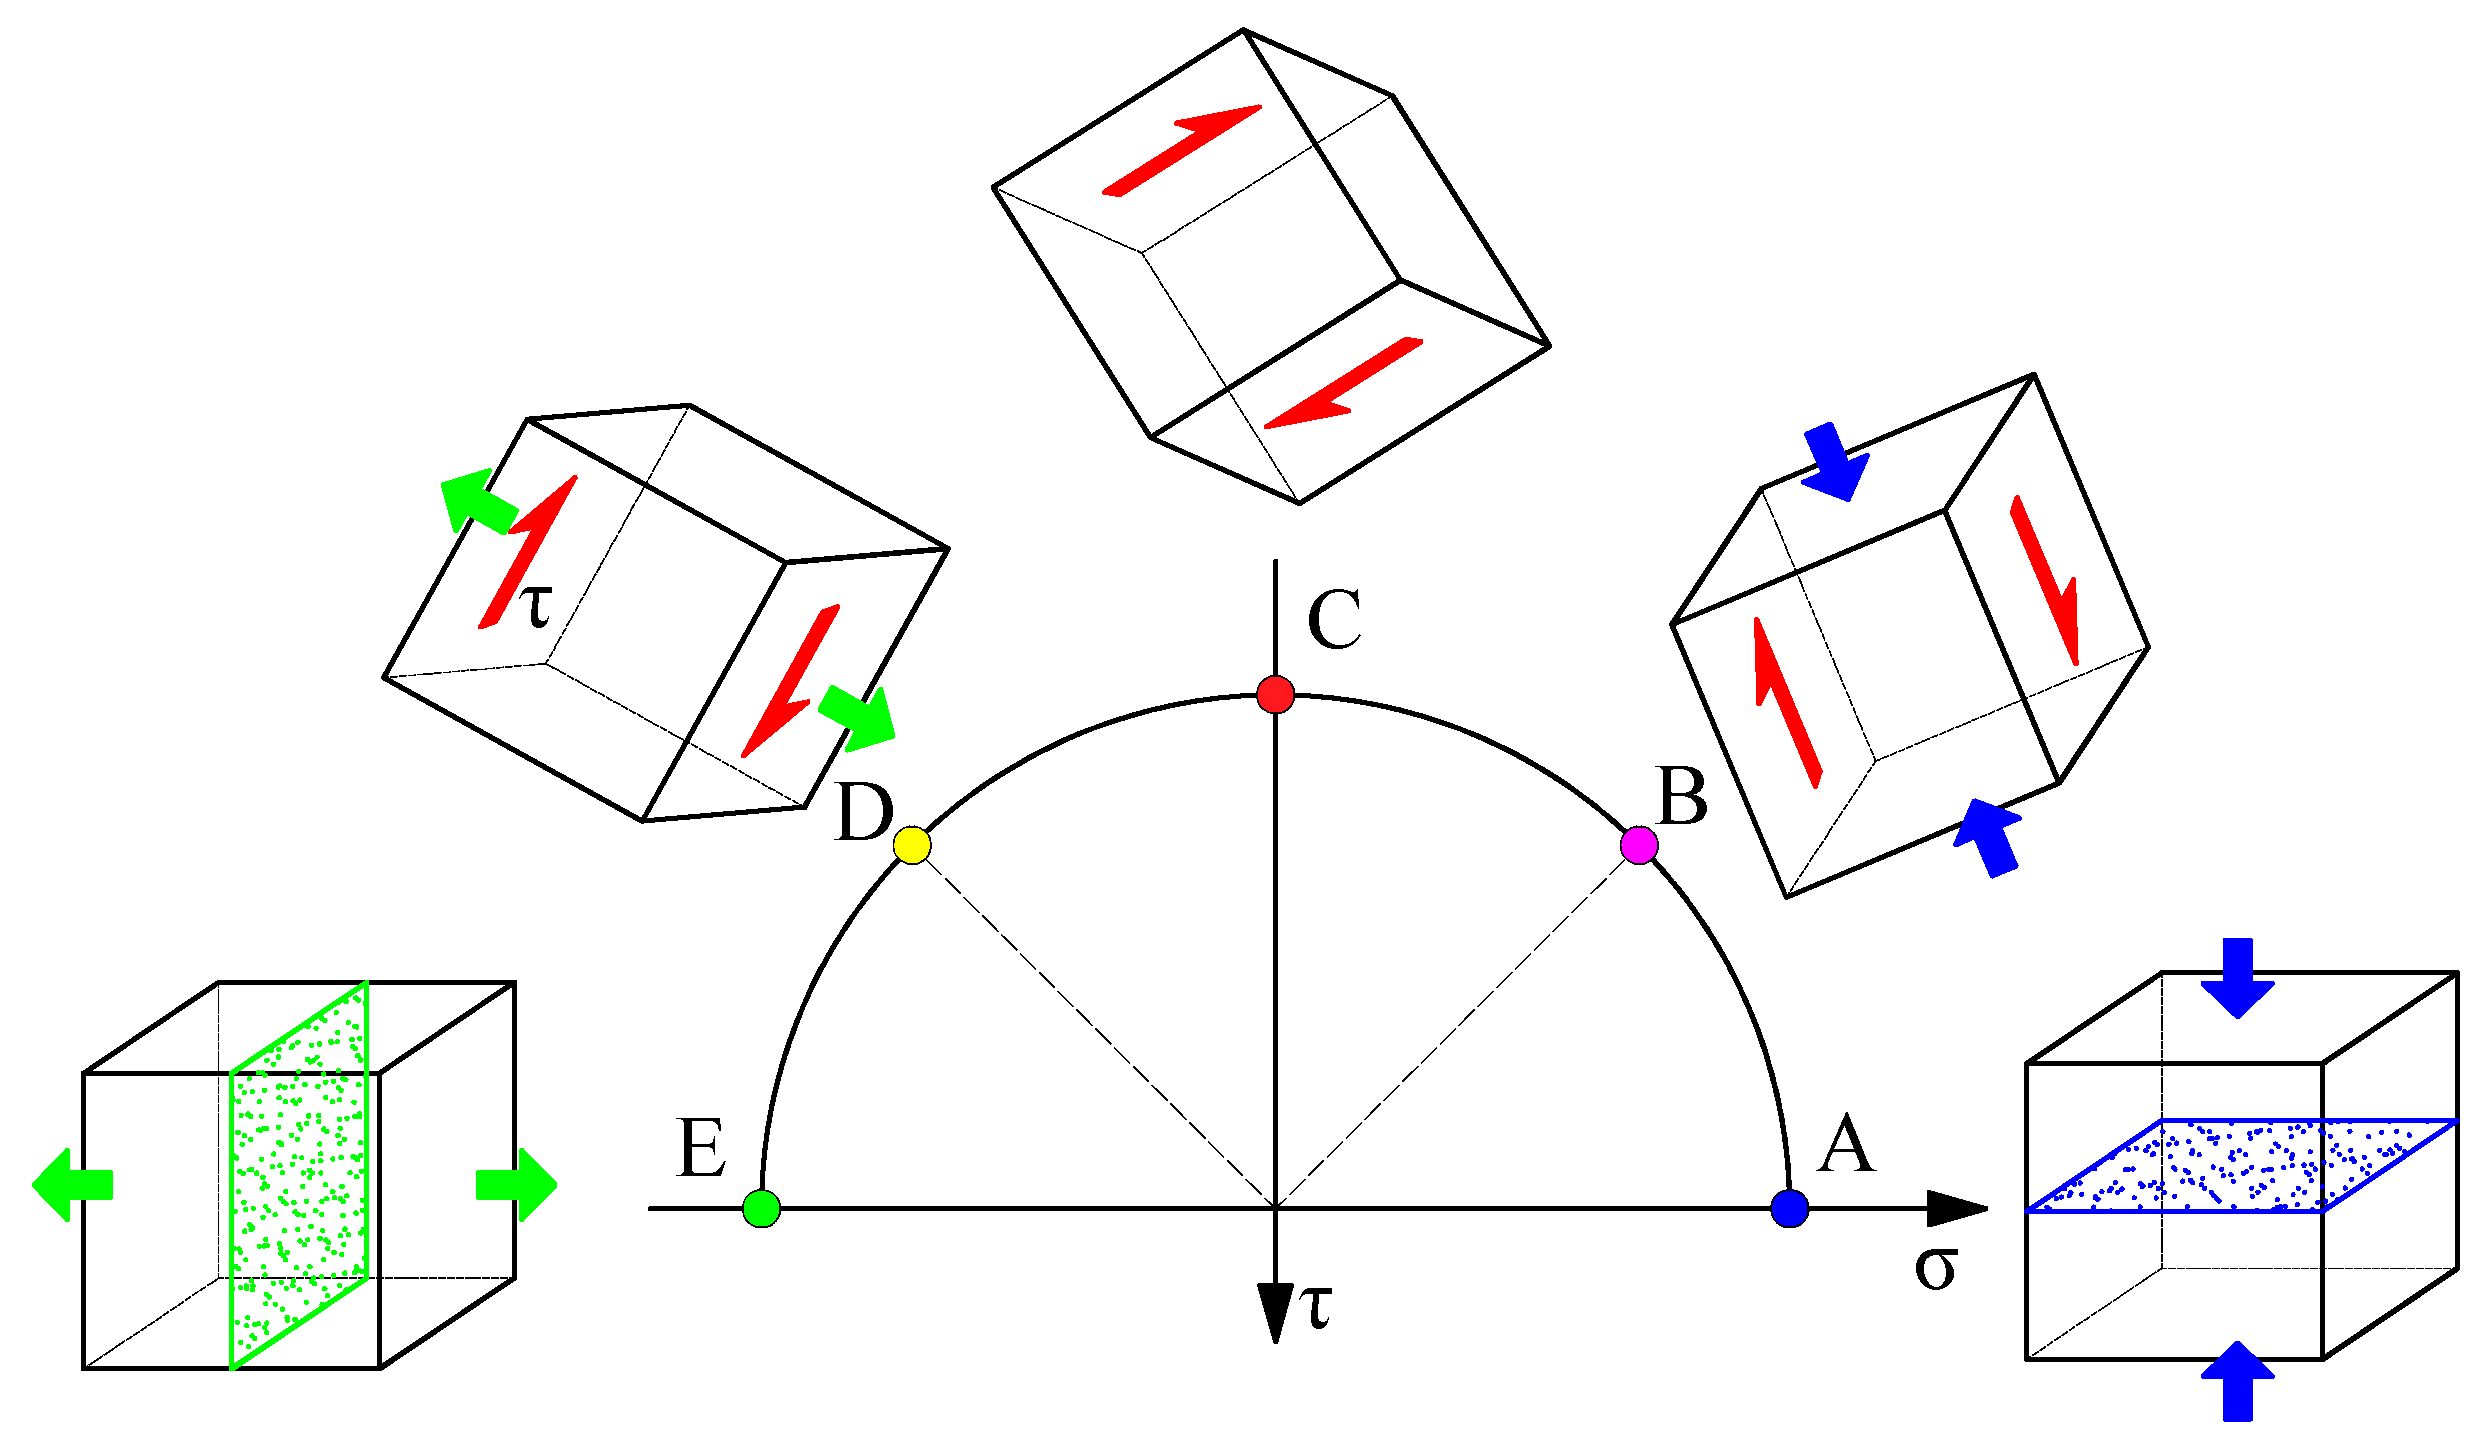
4.2. Relationship between the Stress Combinations and the Failure Modes

Accordingly, different positions on Mohr circle, different stress states are shown in Figure 11. In the model with a bedding inclination dip of 0° or 180°, the actual force in the area near the bedding plane is in a pure compressive state at point A (Figure 11). And as a whole the tensile crack mainly occurs in the model, and there are also intervened tensile cracks along the bedding plane (Figure 12a). When the bedding inclination dip is 30°, the actual force in the area near the bedding plane is at point B (Figure 11), which is a compressive shear state. In addition to the slip dislocation along the bedding plane, the compression-shear crack surface also appears in the model (Figure 12b). When the bedding inclination dip is 60°, the actual force near the bedding plane is mainly shear force, which is regarded as state C (Figure 11), and a shear crack surface appears (Figure 12c). It can be seen from the crack distribution of the model (Figure 12d) that there is slip on each bedding plane, and tensile cracks also appear on each slip surface, which indicating that when the bedding inclination dip is 120°, the actual force near the bedding plane is state D (Figure 11). When the bedding inclination dip is 90°, the actual force in the area near the bedding plane is state E, and the tensile cracks parallel to the bedding plane mainly appear in the model (Figure 12e). Xu et al. [38] divided the failure modes of bedding rocks into three categories, i.e., the cross-layer slip failure, the layer-slip failure, and the combination of layer-slip failure and layer-based tensile crack.
After testing the phyletic under directional loading, Duan et al. [37] divided the failure modes into tensile crack along or across layers, slip failures along layers, and composite shear failures along layers. In this study, combined with the different stress states of the bedding at different inclination dips, the crack genesis and the crack type, the failure modes were summarized into five types: pure compression, compression shear, pure shear, tension shear, and pure tension. Therefore, different positions of the Mohr circle represent different stress combinations, the crack modes of bedding rocks under different stress combinations are different, and the bedding dip of the rocks determines the crack modes. The dips of 30° and 150° are exactly the opposite of the horizontal dips, but the Mohr circle clearly shows the difference in the stress states. This reflects the definite anisotropy of the layered rocks.

5. Conclusions

In order to explore the correspondence between crack distribution and bedding dip, and to reveal the mechanical mechanism of layered rock fracturing, uniaxial compression mechanics experiments on rock were conducted in the laboratory, corresponding numerical simulations were carried out using PFC2D numerical simulation software, a systematic study of failure modes of rocks with different bedding angles was carried out from the stress combination and crack distribution perspectives, and the following conclusions were obtained:
(1)
Bedding dips make an impact on the stress distributions of layered rock fracturing under the same uniaxial loading condition. Through the different bedding dips of layered rock specimen, it is possible to divide stress combination into the pure compression type, the compression shear type, the pure shear type, the tension shear type, and the pure tension type.
(2)
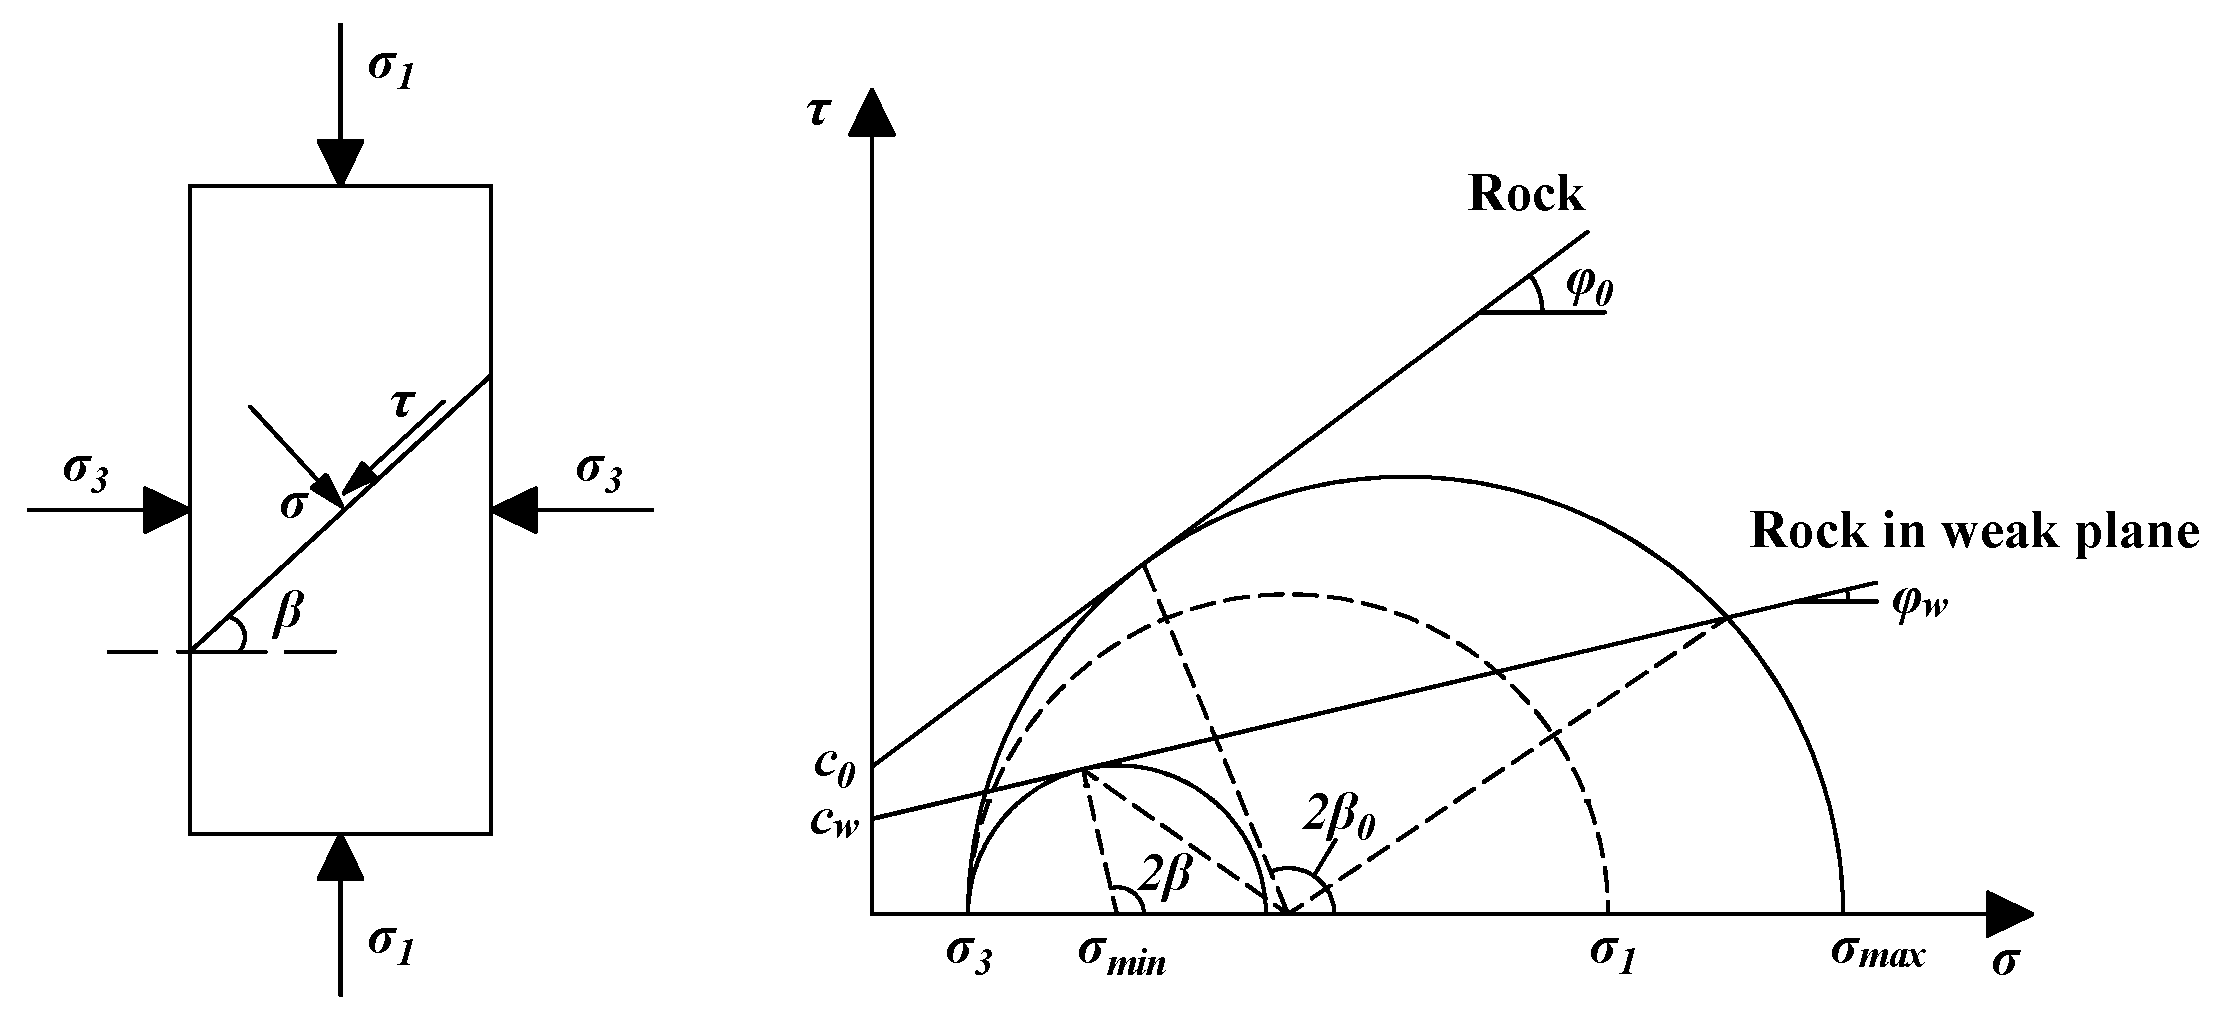
The relationship between the stress combinations and the failure modes are characterized by Mohr circles. The crack mode of layered rock specimen is controlled by the bedding dip, and five failure modes exist in the bedding dip around the range of 0° to 150°, showing the change process of “tensile failure → compression-shear failure → shear failure → tension shear failure → tensile failure”.
(3)
The combined distribution of dominant and secondary cracks is summarized into four types: penetrating type, shedding type, pinnae type and associated type. Layered marbles with high bedding dips (90° to 110°) have different crack distribution rules, the dominant crack shows an en echelon distribution and the secondary crack a pinnae distribution.

Author Contributions

Z.Z.: Investigation, Formal analysis, Data Curation, Writing—Original Draft; X.L. (Xiangxin Liu): Conceptualization, Investigation, Supervision, Funding acquisition, Writing—Review and Editing; B.G.: Conceptualization, Methodology, Supervision, Writing—Review and Editing; Z.L.: Formal analysis, Software, Resources; X.L. (Xianxian Liu): Formal analysis, Validation; X.Y.: Formal analysis, Visualization. All authors have read and agreed to the published version of the manuscript.

Funding

The authors give thanks for the financial support by the Jiangxi Provincial Natural Science Foundation (No. 20232ACB214007) and the National Natural Science Foundation of China (No. 41977219).

Institutional Review Board Statement

Not applicable.

Informed Consent Statement

Not applicable.

Data Availability Statement

The datasets generated and/or analyzed during the current study are available from the corresponding author upon request.

Conflicts of Interest

The authors declare no conflicts of interest.

References

  1. Huang, K.; Yu, F.; Zhang, W.; Tong, K.; Li, S.; Guo, J.; Dai, Z. Experimental and numerical simulation study on the influence of gaseous water on the mechanical properties of red-layer mudstone in central Sichuan. Rock Mech. Rock Eng. 2023, 56, 3159–3178. [Google Scholar] [CrossRef]
  2. Li, L.; Kong, D.; Liu, Q.; Cai, H.; Chen, L. Correction to: Study on law and prediction of surface movement and deformation in mountain area under repeated mining of shallow coal seam. Bull. Eng. Geol. Environ. 2023, 82, 76. [Google Scholar] [CrossRef]
  3. Ganesan, G.; Mishra, A.K.; Mathanlal, K. A generalized failure mode model for transversely isotropic rocks using a machine learning classification approach. Rock Mech. Rock Eng. 2024, 57, 2773–2791. [Google Scholar] [CrossRef]
  4. Zuo, J.; Wang, Z.; Zhou, H.; Pei, J.; Liu, J. Failure behavior of a rock-coal-rock combined body with a weak coal interlayer. Int. J. Min. Sci. Technol. 2013, 23, 907–912. [Google Scholar] [CrossRef]
  5. Wang, D.; Lv, R.; Peng, M.; Wei, J.; Yao, B.; Liu, Y. Experimental study on anisotropic permeability rule of coal bearing methane. J. China Coal Soc. 2018, 4, 1008–1015. [Google Scholar]
  6. Chen, Y.; Zhang, Y.; Tang, J.; Yang, J. Experimental study of the influence of bedding effect on methane adsorption-desorption and seepage. J. Min. Saf. Eng. 2018, 35, 859–868. [Google Scholar]
  7. Zhong, C.; Zhang, Z.; Geng, X.; Hao, S. The deformation, cracking and failure behavior of lithological layered coal disk in Brazilian experiment. Environ. Earth Sci. 2023, 82, 477. [Google Scholar] [CrossRef]
  8. Zhang, L.; Jing, H.; Liu, H.; Yin, Q.; Meng, Y. Effects of a weak interlayer zone on the indirect tensile strength and failure characteristics of rock. Environ. Earth Sci. 2023, 82, 59. [Google Scholar] [CrossRef]
  9. Miao, S.; Pan, P.Z.; Wu, Z.; Li, S.; Zhao, S. Fracture analysis of sandstone with a single filled flaw under uniaxial compression. Eng. Fract. Mech. 2018, 204, 319–343. [Google Scholar] [CrossRef]
  10. He, J.; Afolagboye, L.O. Influence of layer orientation and interlayer bonding force on the mechanical behavior of shale under Brazilian test conditions. Acta Mech. Sin. 2018, 34, 349–358. [Google Scholar] [CrossRef]
  11. Yuan, Y.; Fu, J.; Wang, X.; Shang, X. Experimental study on mechanical properties of prefabricated single-cracked red sandstone under uniaxial compression. Adv. Civ. Eng. 2020, 2020, 8845368. [Google Scholar] [CrossRef]
  12. Zhu, J.; Hu, G.; Xu, J.; Yang, N.; Wang, T.; Wang, H.; Qin, W. The influence of coal seam bedding on the effect of fracturing coal and enhancing permeability by microwave. J. China Coal Soc. 2023, 49, 2324–2337. [Google Scholar]
  13. Kranz, R.L. Microcracks in rocks: A review. Tectonophysics 1983, 100, 449–480. [Google Scholar] [CrossRef]
  14. Shang, R.; Wang, L.; Liu, H.; Zhu, C.; Li, S.; Chen, L. The influence of dip of rock bridge on mechanical properties and fracture characteristics of fractured coal body at three-dimensional scale. Rock Mech. Rock Eng. 2023, 56, 8927–8946. [Google Scholar] [CrossRef]
  15. Song, Y.; Yang, S.Q.; Li, K.S.; Yin, P.F.; Pan, P.Z. Mechanical behavior and fracture evolution mechanism of composite rock under triaxial compression: Insights from three-dimensional DEM modeling. Rock Mech. Rock Eng. 2023, 56, 7673–7699. [Google Scholar] [CrossRef]
  16. Zhou, Y.; Li, C.; Wang, W.; Lin, Z. A meso-level study on mechanical properties of bedding coal under uniaxial compression. J. Cent. South Univ. (Sci. Technol.) 2022, 53, 4036–4047. [Google Scholar]
  17. Chang, X.; Zhao, H.; Cheng, L. Fracture propagation and coalescence at bedding plane in layered rocks. J. Struct. Geol. 2020, 141, 104213. [Google Scholar] [CrossRef]
  18. Yin, P.; Yang, S.; Gao, F.; Tian, W. Application of different joint models in stratified composite rock DEM simulation. J. Min. Saf. Eng. 2023, 40, 164–173+183. [Google Scholar]
  19. Jaeger, J.C. Shear failure of anistropic rocks. Geol. Mag. 1960, 97, 65–72. [Google Scholar] [CrossRef]
  20. Zhang, Q.; Fan, X.; Chen, P.; Ma, T.; Zeng, F. Geomechanical behaviors of shale after water absorption considering the combined effect of anisotropy and hydration. Eng. Geol. 2020, 269, 105547. [Google Scholar] [CrossRef]
  21. Lin, H.; Li, B.; Li, S.; Song, Z.; Wang, P.; Luo, R.; Wei, Z.; Qin, L. Thermal-hydraulic-mechanical-damage coupling model and numerical simulation research of layer coal fracturing by liquid nitrogen. Chin. J. Rock Mech. Eng. 2024, 43, 1–14. [Google Scholar]
  22. Meier, T.; Rybacki, E.; Backers, T.; Dresen, G. Influence of bedding dip on borehole stability: A laboratory investigation of transverse isotropic oil shale. Rock Mech. Rock Eng. 2015, 48, 1535–1546. [Google Scholar] [CrossRef]
  23. Masri, M.; Sibai, M.; Shao, J.F.; Mainguy, M. Experimental investigation of the effect of temperature on the mechanical behavior of Tournemire shale. Int. J. Rock Mech. Min. Sci. 2014, 70, 185–191. [Google Scholar] [CrossRef]
  24. Gao, Q.; Tao, J.; Hu, J.; Yu, X.B. Laboratory study on the mechanical behaviors of an anisotropic shale rock. J. Rock Mech. Geotech. Eng. 2015, 7, 213–219. [Google Scholar] [CrossRef]
  25. Chen, J.; Lan, H.; Macciotta, R.; Wu, Y.; Li, Q.; Zhao, X. Anisotropy rather than transverse isotropy in Longmaxi shale and the potential role of tectonic stress. Eng. Geol. 2018, 247, 38–47. [Google Scholar] [CrossRef]
  26. He, J.; Afolagboye, L.O.; Zheng, B.; Mao, T.; Wu, Y.; Li, G.; Li, X. Effect of strain rate on anisotropic mechanical behavior of the shale under uniaxial compression conditions. Rock Mech. Rock Eng. 2022, 55, 5297–5305. [Google Scholar] [CrossRef]
  27. Feng, X.; Gong, B.; Liang, Z.; Wang, S.; Tang, C.A.; Li, H.; Ma, T. Study of the dynamic failure characteristics of anisotropic shales under impact brazilian splitting. Rock Mech. Rock Eng. 2024, 57, 2213–2230. [Google Scholar] [CrossRef]
  28. Song, Z.; Liu, H.; Zheng, F.; Cheng, Y.; Sun, Y.; Song, W. Mechanical behavior and failure response characteristics of hard sandstones considering bedding dips. Coal Geol. Explor. 2023, 51, 167–175. [Google Scholar]
  29. Chen, J.; Zhou, C.; Zhou, T. Experimental study on strain evolution and failure behavior of sandstone containing a single pre-existing flaw under compressive-shear loading. Chin. J. Rock Mech. Eng. 2023, 42, 1743–1758. [Google Scholar]
  30. Wang, X.; Tian, L. Mechanical and crack evolution characteristics of coal–rock under different fracture-hole conditions: A numerical study based on particle flow code. Environ. Earth Sci. 2018, 77, 297. [Google Scholar] [CrossRef]
  31. Wu, R.; Li, H. Multi-scale failure mechanism analysis of layered phyllite subject to impact loading. Explos. Shock. Waves 2019, 39, 083106. [Google Scholar]
  32. Ye, H.; Qian, Z.; Lei, T.; Weng, Y.; Li, R. Bedding effect and macro-micro mechanism of graphite ore dynamic mechanical properties under impact loads. Explos. Shock. Waves 2023, 43, 123102. [Google Scholar]
  33. Tien, Y.M.; Kuo, M.C.; Juang, C.H. An experimental investigation of the failure mechanism of simulated transversely isotropic rocks. Int. J. Rock Mech. Min. Sci. 2006, 43, 1163–1181. [Google Scholar] [CrossRef]
  34. Wu, Y.; Li, X.; He, J.; Zheng, B. Mechanical properties of longmaxi black organic-rich shale samples from south china under uniaxial and triaxial compression states. Energies 2016, 9, 1088. [Google Scholar] [CrossRef]
  35. Khanlari, G.; Rafiei, B.; Abdilor, Y. Evaluation of strength anisotropy and failure modes of laminated sandstones. Arab. J. Geosci. 2015, 8, 3089–3102. [Google Scholar] [CrossRef]
  36. Cheng, J.; Wan, Z.; Zhang, Y.; Li, W.; Peng, S.S.; Zhang, P. Experimental study on anisotropic strength and deformation behavior of a coal measure shale under room dried and water saturated conditions. Shock. Vib. 2015, 2015, 290293. [Google Scholar] [CrossRef]
  37. Duan, G.; Li, J.; Zhang, J.; Assefa, E.; Sun, X. Mechanical properties and failure modes of rock specimens with specific joint geometries in triaxial unloading compressive test. Adv. Mater. Sci. Eng. 2019, 2019, 1340934. [Google Scholar] [CrossRef]
  38. Xu, G.; He, C.; Su, A.; Chen, Z. Experimental investigation of the anisotropic mechanical behavior of phyllite under triaxial compression. Int. J. Rock Mech. Min. Sci. 2018, 104, 100–112. [Google Scholar] [CrossRef]
  39. Xia, L.; Zeng, Y.W.; Zhang, S. Influence of meso-mechanical parameters of bedding plane on strength characteristics of layered rock mass. J. Yangtze River Sci. Res. Inst. 2016, 33, 68. [Google Scholar]
  40. Labuz, J.F.; Zang, A. Mohr–Coulomb failure criterion. In The ISRM Suggested Methods for Rock Characterization, Testing and Monitoring: 2007–2014; Springer International Publishing: Cham, Switzerland, 2014; pp. 227–231. [Google Scholar]
Figure 1. Numerical model loading conditions.
Applsci 14 07970 g001
Figure 2. Numerical model of bedding rock. (a) The bedding dip is 0°; (b) the bedding dip is 30°; (c) the bedding dip is 60°; (d) the bedding dip is 90°; (e) the bedding dip is120°; (f) the bedding dip is 150°.
Applsci 14 07970 g002
Figure 3. Schematic diagram of the theoretical prediction of failure stress by a single weak surface.
Applsci 14 07970 g003
Figure 4. Rock specimens with different bedding dips.
Applsci 14 07970 g004
Figure 5. Numerical model of layered rock with different dip bedding. (a) The bedding dip is 0°; (b) the bedding dip is 30°; (c) the bedding dip is 60°; (d) the bedding dip is 90°; (e) the bedding dip is 120°; (f) the bedding dip is 150°.
Applsci 14 07970 g005
Figure 6. Stress–strain curve of each rock specimen.
Applsci 14 07970 g006
Figure 7. Photographs of each rock sample at its ultimate rupture.
Applsci 14 07970 g007
Figure 8. Schematic diagram of the relative location of the crack distribution of the rock specimens. (A) GUD-90; (B) GUD-100; (C) GUD-105; (D) GUD-110.
Applsci 14 07970 g008aApplsci 14 07970 g008b
Figure 9. Schematic diagram of stress decomposition on bedding plane. (a) The bedding dip is 0°; (b) the bedding dip is 30°; (c) the bedding dip is 60°; (d) the bedding dip is 90°.
Applsci 14 07970 g009
Figure 10. Crack in rock specimen. (a) the bedding dip is 90°; (b) the bedding dip is 100°; (c) the bedding dip is 105°; (d) the bedding dip is 110°. The red letters ‘S’ and black letters ‘T’ represent shear cracks and tensile cracks, respectively.
Applsci 14 07970 g010
Figure 11. Schematic diagram of different stress combinations.
Applsci 14 07970 g011
Figure 12. Schematic diagram of failure modes corresponding to different stress combinations. (a) Compression failure; (b) compression-shear failure; (c) shear failure; (d) tension shear failure; (e) tension failure.
Applsci 14 07970 g012
Table 1. Numerical model mesoscopic parameters.
Parameter CategorySpecific ParameterValue
particle parametersporosity of material0.01
minimum radius/m0.0002
maximum radius/m0.0004
density/kg/m32700
elastic modulus/GPa6.9
stiffness ratio0.86
coefficient of friction0.5
parallel bond parameterselastic modulus/GPa6.9
stiffness ratio0.86
normal strength/MPa60
tangential strength/MPa6
dip of friction/°30
smooth joint parametersnormal stiffness/GPa/m9000
tangential stiffness/GPa/m9000
coefficient of friction1.6
normal strength/MPa15
tangential strength/MPa8
Disclaimer/Publisher’s Note: The statements, opinions and data contained in all publications are solely those of the individual author(s) and contributor(s) and not of MDPI and/or the editor(s). MDPI and/or the editor(s) disclaim responsibility for any injury to people or property resulting from any ideas, methods, instructions or products referred to in the content.

