Article

Electrical Bioimpedance in Milk Adulterated with Water: Measurement Methodology for Quantification, Influence of Temperature, and Mathematical Modelling

by
Wemerson de Castro Oliveira
1,*,†,
Ana Maria Geller
1,†,
Renato Hartwig Neuenfeld
1,
Claudia Wollmann Carvalho
1,
Humberto Moreira Húngaro
2,
Luciano Carvalho Ayres
1,†,
Maria Beatriz Prior Pinto Oliveira
3 and
Rodrigo Wolff Porto
4,†
1
Federal Institute of Education, Science and Technology of Sul-rio-grandense—IFSul, Lajeado 95910-016, RS, Brazil
2
Faculty of Pharmacia, Federal University of Juiz de Fora—UFJF, Juiz de Fora 36036-900, MG, Brazil
3
Associated Laboratory for Green Chemistry, University of Porto, 4099-002 Porto, Portugal
4
Federal Institute of Education, Science and Technology of Rio Grande do Sul—IFRS, Porto Alegre 91791-508, RS, Brazil
*
Author to whom correspondence should be addressed.
These authors contributed equally to this work.
Appl. Sci. 2024, 14(17), 8026; https://doi.org/10.3390/app14178026 (registering DOI)
Submission received: 6 July 2024 / Revised: 20 August 2024 / Accepted: 3 September 2024 / Published: 8 September 2024

Abstract

:
Milk has a high nutritional value and is also one of the most versatile products in the food industry. Unfortunately, fraud involving the product is constant and needs to be combated. This work presents a measurement methodology to perform the electrical impedance analysis in food. The influence of temperature on the measurements has been evaluated through mathematical models specially developed for identifying the fraudulent activity of adding water to milk. The bioimpedance measurements have been performed in a sample container with a four-electrode measurement system and a digital oscilloscope. Samples of 150 mL were analysed, prepared using whole UHT milk adulterated with distilled water in different % by volume (V/V), at temperatures of 16, 28, and 37 °C. The proposed measurement methodology has been validated and showed sensitivity for analysis in milk, revealing the influence of temperature on the impedance values; from the results mathematical models were proposed for investigating adulteration in milk. This work deals with the design of a device capable of measuring bioimpedance in milk with a view to its application in physicochemical analyses. The influence of temperature on the impedance values was also evaluated to propose mathematical models to facilitate analysis with complex factors and matrices.

1. Introduction

The Brazilian dairy production chain sells more than 25.01 billion litres per year through its 1,171,190 dairy farms [1], and it generated revenues of BRL 70.2 billion for the country’s dairy industry in 2017, a 4% increase over 2016 [2]. Among the most consumed products are long-life milk, commonly known as UHT (ultra-high temperature), reaching 7.026 billion litres in 2017, 2.8% more than in 2016. According to the Brazilian Long-Life Milk Association (ABVL), this growth was mainly due to low consumer prices throughout the year and a continuous increase in its share of the total volume of drinking milk [2]. In addition to these factors, the preference for long-life milk consumption by about 80% of the population is due to its practicality in storage without the need for refrigeration and extended shelf life [3,4]. We must consider that the thermal process of ultra-pasteurisation maintains the nutritional and organoleptic characteristics of fresh milk [5] and, according to Gennari, Grave, Wagner, Mallmann, and Souza (2014) [6], does not significantly alter the physical and chemical properties of the milk. However, it is not only the nutritional qualities that define a good-quality food. The physical and chemical characteristics of milk can be altered due to the biological and environmental conditions of the cows, such as the breed, feeding (nutrition plan and physical form of the feed), ambient temperature, management and the interval between milking, milk production and infection of the mammary gland [7], and fraud in the processes of obtaining, storing, transporting, and processing milk [3]. The relationship between milk components is stable and this condition is the basis for tests aimed at pointing out the occurrence of problems that alter its composition [8]. The most common adulterants in milk are water, whey, colostrum, amylaceous substances, gum, sucrose, salt and other kinds of milk [9]. To prevent fraud and maintain the quality of milk and its derivatives in Brazil, MAPA’s Normative Instruction No. 30/2018 makes official the Manual of Official Methods for Analysis of Food of Animal Origin [10]. According to Pinheiro (2015) [11], the adulteration of milk by adding water may harm the health of the consumer, since the quality of this diluent is unknown, in addition to reducing the nutritional value of its components. The results of the above-mentioned author, based on the physical quantities of density and specific heat, which generate the volumetric thermal capacity, made it possible to quantify the percentage of added water in the samples compared to the reference methods (cryoscopy and density) up to an adulteration of 10%. Frequently, routine official analyses are not always efficient in detecting irregularities when they are performed with small additions of adulterants [12]. Some of the techniques provided by legislation for evaluating milk quality, such as freezing point (cryoscopy) [13] and density, can be falsified by the simultaneous addition of water and restorers like sodium chloride and ethanol [14]. Substances like sodium bicarbonate, for example, can be used to restore acidity, thereby masking reference techniques such as the Dornic method [13]. Detecting the most common frauds involves the use of sophisticated techniques such as spectroscopy, gel electrophoresis, absorption spectroscopy, and liquid chromatography [9,15], and for this reason the scientific community is seeking new alternatives, preferably faster and cheaper, such as electrical bioimpedance [16,17,18] and the method of wave propagation through the material using piezoelectric diaphragms [19].
Electrical bioimpedance presents an alternative for detecting and monitoring biological parameters and processes, with the advantage of being relatively inexpensive [20] and non-invasive [21,22,23]. This method stands out for its efficiency and practicality compared to traditional techniques for analysing physicochemical parameters which are widely used in the investigation of fraud. According to [24], the electrical impedance technique eliminates the need for sample preparation, dilutions, use of standards, reagents, high-purity solvents, and reliance on the analyst’s time and experience. In contrast, conventional methods are characterised by their complexity, slowness, and high cost. Additionally, electrical impedance offers several comparative advantages, including versatility of application [25], favourable cost effectiveness, the availability of affordable equipment, and the possibility of performing on-site analyses. The technique does not require prior sample preparation and allows for real-time results. In [26], it is demonstrated that the electrical impedance method shows high accuracy, repeatability, and recovery, with values ranging from 88.2% to 94%, which is comparable to the precision obtained with high-performance liquid chromatography (HPLC) in the analysis of ofloxacin in raw milk. The electrical properties of biological materials can be measured by employing a set of electrodes arranged and connected to an electronic circuit, which are responsible for both the injection of electrical current and the measurement of voltage, being called the measurement channel. Thus, the value of the complex impedance Z, in ohms ( Ω ), between the measuring electrodes, can be obtained by the ratio of the voltage between the measuring electrodes and the electrical current applied, provided that the magnitude and phase information of both is available [27]. There are several studies using bioimpedance in milk, Bertemes-Filho, Valicheski, Pereira, and Paterno (2018) [28] analysed pure bovine milk, finding a bioimpedance value of 89   Ω , different from milk adulterated with distilled water and hydrogen peroxide, where the bioimpedance changed to 114   Ω , and 82   Ω , respectively. Veiga and Bertemes-Filho (2012) [29] evaluated the change in milk fat content through impedance spectra and conductivity measurements. The same authors indicated that such a technique could help in the development of sensors to measure milk quality, such as for the detection of mastitis. Recently, Schumacher et al. (2019) [17] used electrical bioimpedance to evaluate the quality of fat in bovine milk, and Mabrook and Petty [30] presented the behaviour of fat and lactose with a lower amount of liquids and electrolytes, which causes a decrease in electrical conductivity, and consequently, a high value of electrical impedance. However, no reports have been found in the literature on the construction of a specific tool for food analysis, in addition to evaluating the influence of temperature on electrical impedance. In addition, there is a lack of mathematical models that consider complex food factors and matrices. Bioimpedance spectroscopy (BIS) analysis from a low-cost prototype is necessary to improve the quality control of milk, and consequently, ensure a safer product for the population consuming this food. Thus, this work aimed to measure electrical bioimpedance in samples of whole UHT milk adulterated in a laboratory with distilled water to develop a mathematical model capable of identifying and quantifying the fraudulent activity of adding water to milk.

2. Materials and Methods

The electrical bioimpedance measurements were performed in a system which consists of a cylindrical container with dimensions of 80 m m diameter and 50   m m height, with a four-electrode measurement channel incorporated. The sample container was designed using computer-aided design (SolidWorks v. 2015; Dassault Systèmes, Waltham, MA, USA) and 3D-printed (XYZ Printing Da Vinci 1.0A; Shenkeng District, New Taipei City, Taiwan) with a 1.75   m m acrylonitrile butadiene styrene (ABS) plastic filament. The contact electrodes, adapted from M4 × 0.5   m m stainless steel screws with a 7   m m diameter head, were equally spaced, and fitted in the inner surface of the container at a height of 20 mm, as shown in Figure 1.
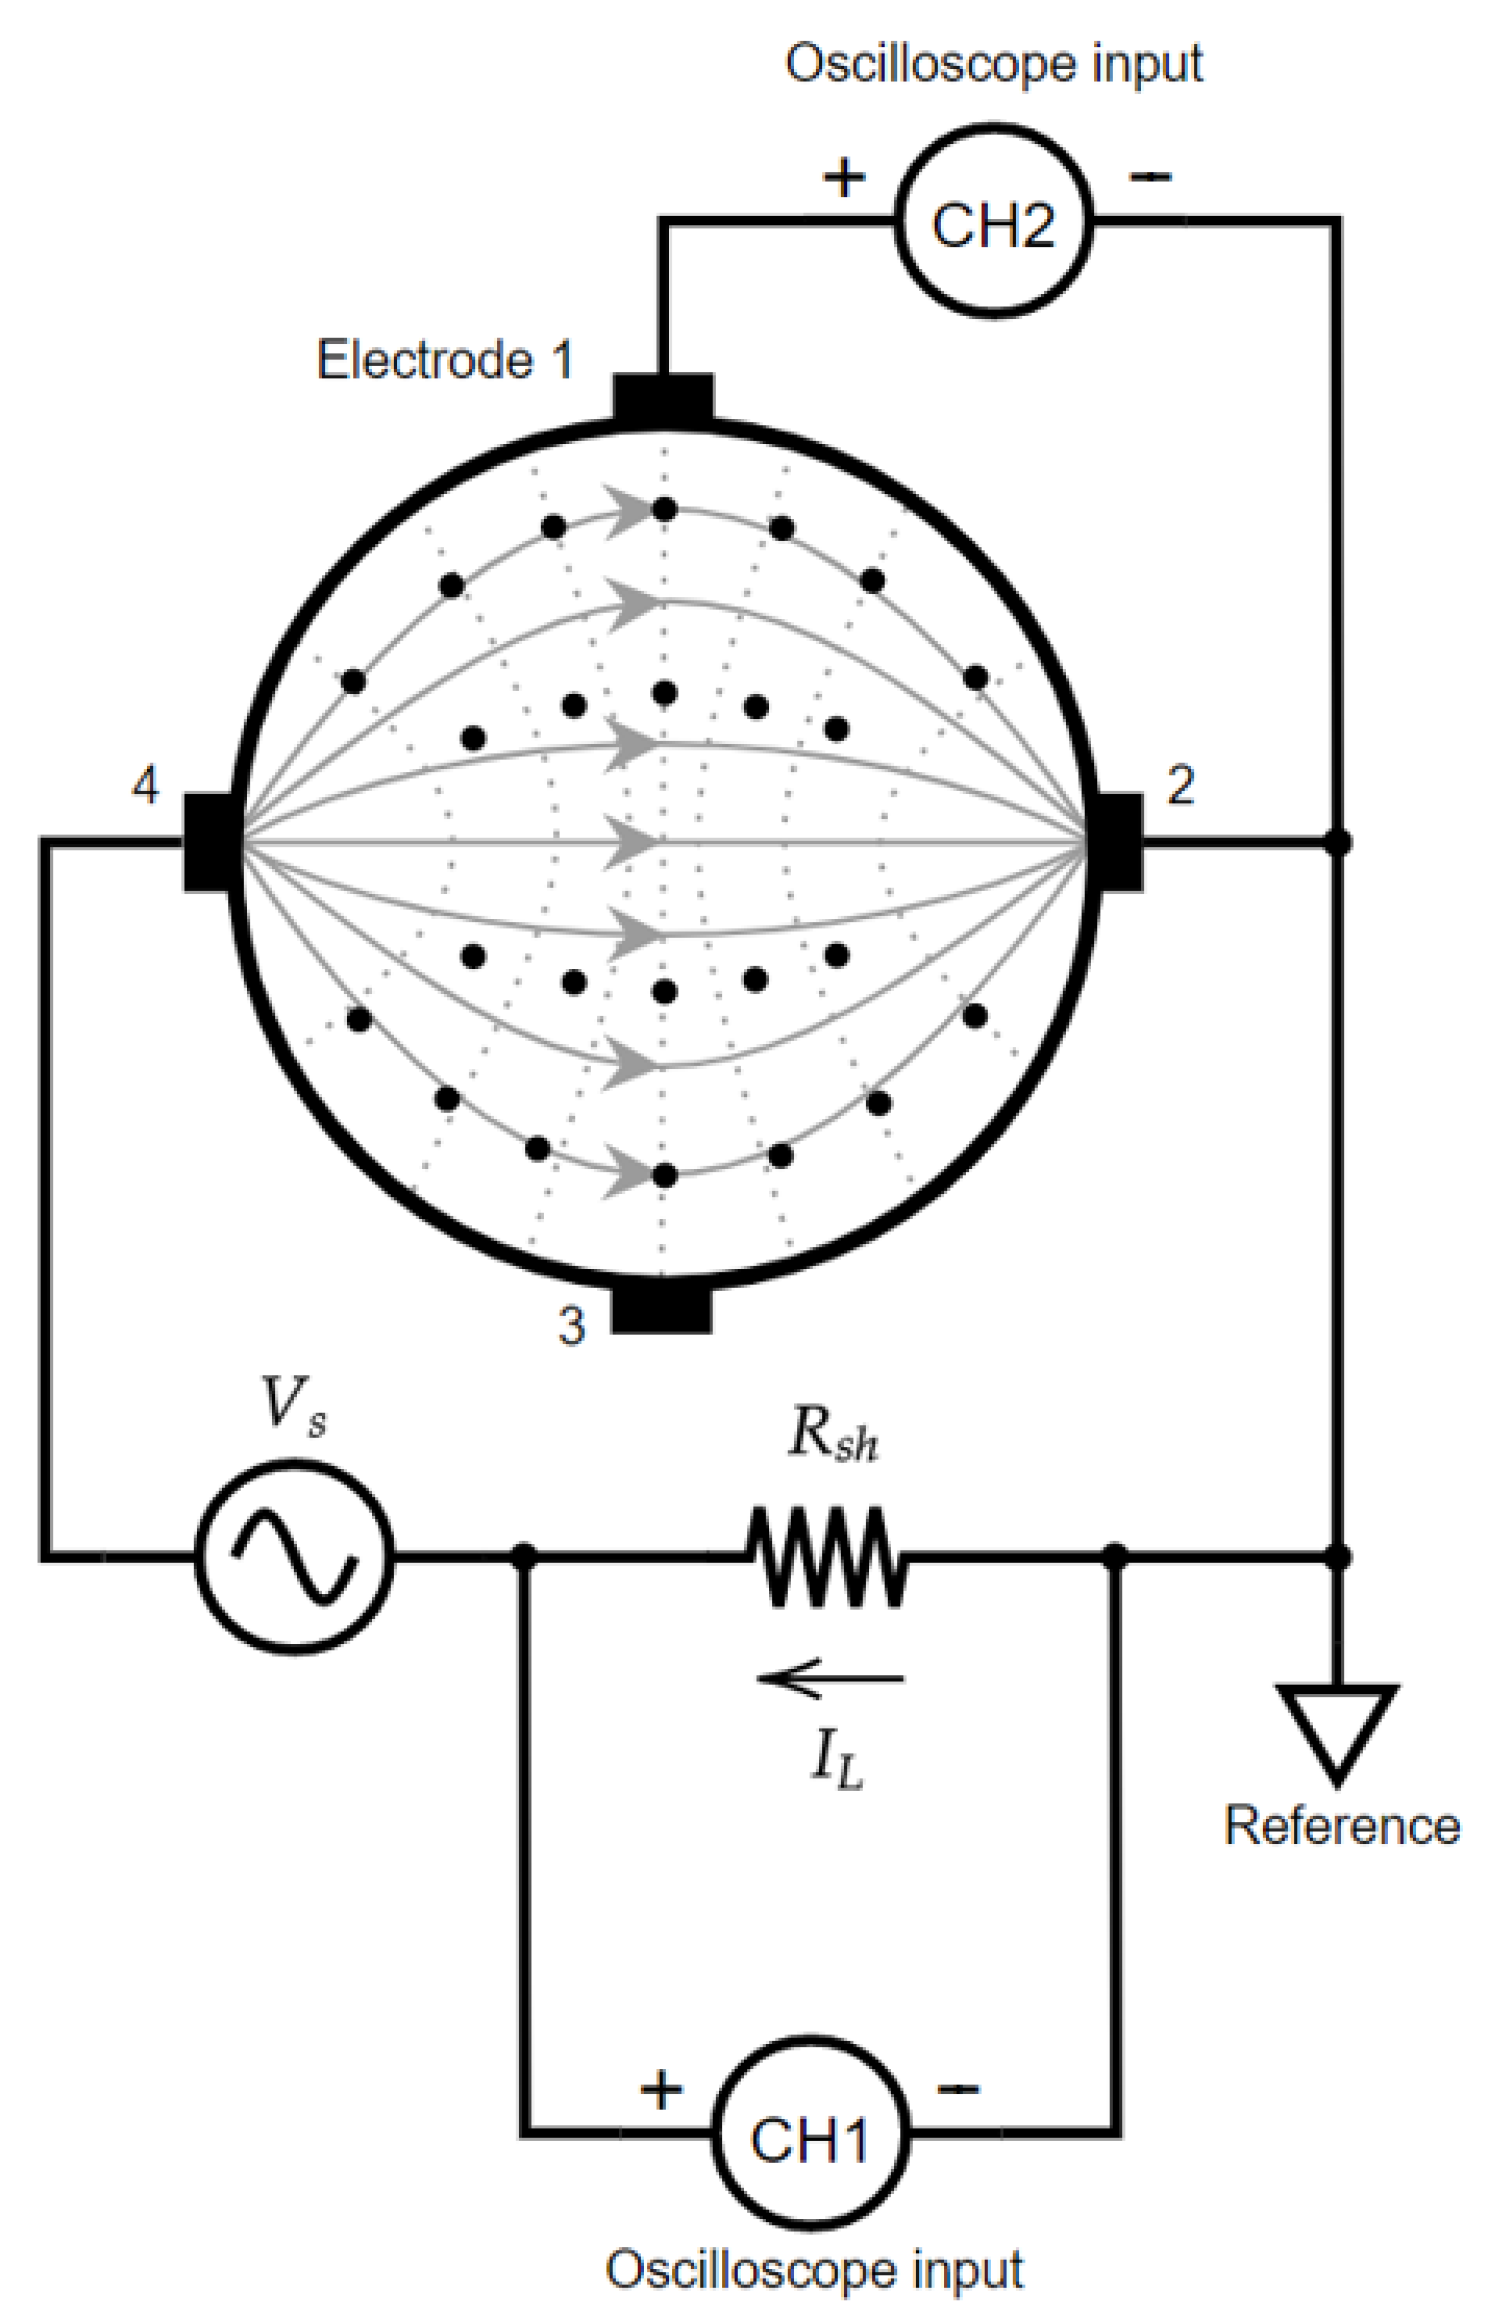
The proposed bioimpedance measurement method, represented in Figure 2, has a sine wave voltage source (GF-320 function signal generator; Instrutherm, São Paulo, Brazil) defined by a frequency (f) and a peak-to-peak amplitude ( V S ), along with a low-inductance metal-film resistor ( R s h ) of 120   Ω and 1/4 W. The electrical voltage is applied to the path formed by electrodes 2 and 4, thus establishing the flow of the excitation electric current ( I L ) through the milk sample in the container. The solid grey lines represent the idealised electric current flow in the sample under test, while the dashed lines show the expected distribution of the equipotential lines along a plane whose height is defined by the four lateral electrodes. A set of 24 voltage measuring points distributed along such a plane is represented by circular points in Figure 2. All measurements in the experiment were made with a 2-channel (CH1 and CH2) digital oscilloscope (TBS1072B; Tektronix, Beaverton, OR, USA) and passive voltage probes (TPP0101; Tektronix, Beaverton, OR, USA).
Several methods for impedance measurement have been proposed in the literature and many of them are based on four-wire sensing or the Kelvin method [31]. Using a pair of wires for excitation separated from another pair of wires for measuring minimises the errors due to cables and electrode impedances. The impedance measurement method proposed in Figure 2 is based on the opposite current injection method, which was first proposed by Hua, Webster, and Tompkins for electrical impedance tomography applications [32]. The voltage measurements can be performed at any pair of electrodes in contact with the sample under test. Several voltage-measuring configurations are analysed in [33,34]. In this work, electrode 2 is shared with the current injection and voltage measurement reference. Therefore, an electrode impedance error can be introduced at this point. However, such impedance can be evaluated and treated as a systematic error.
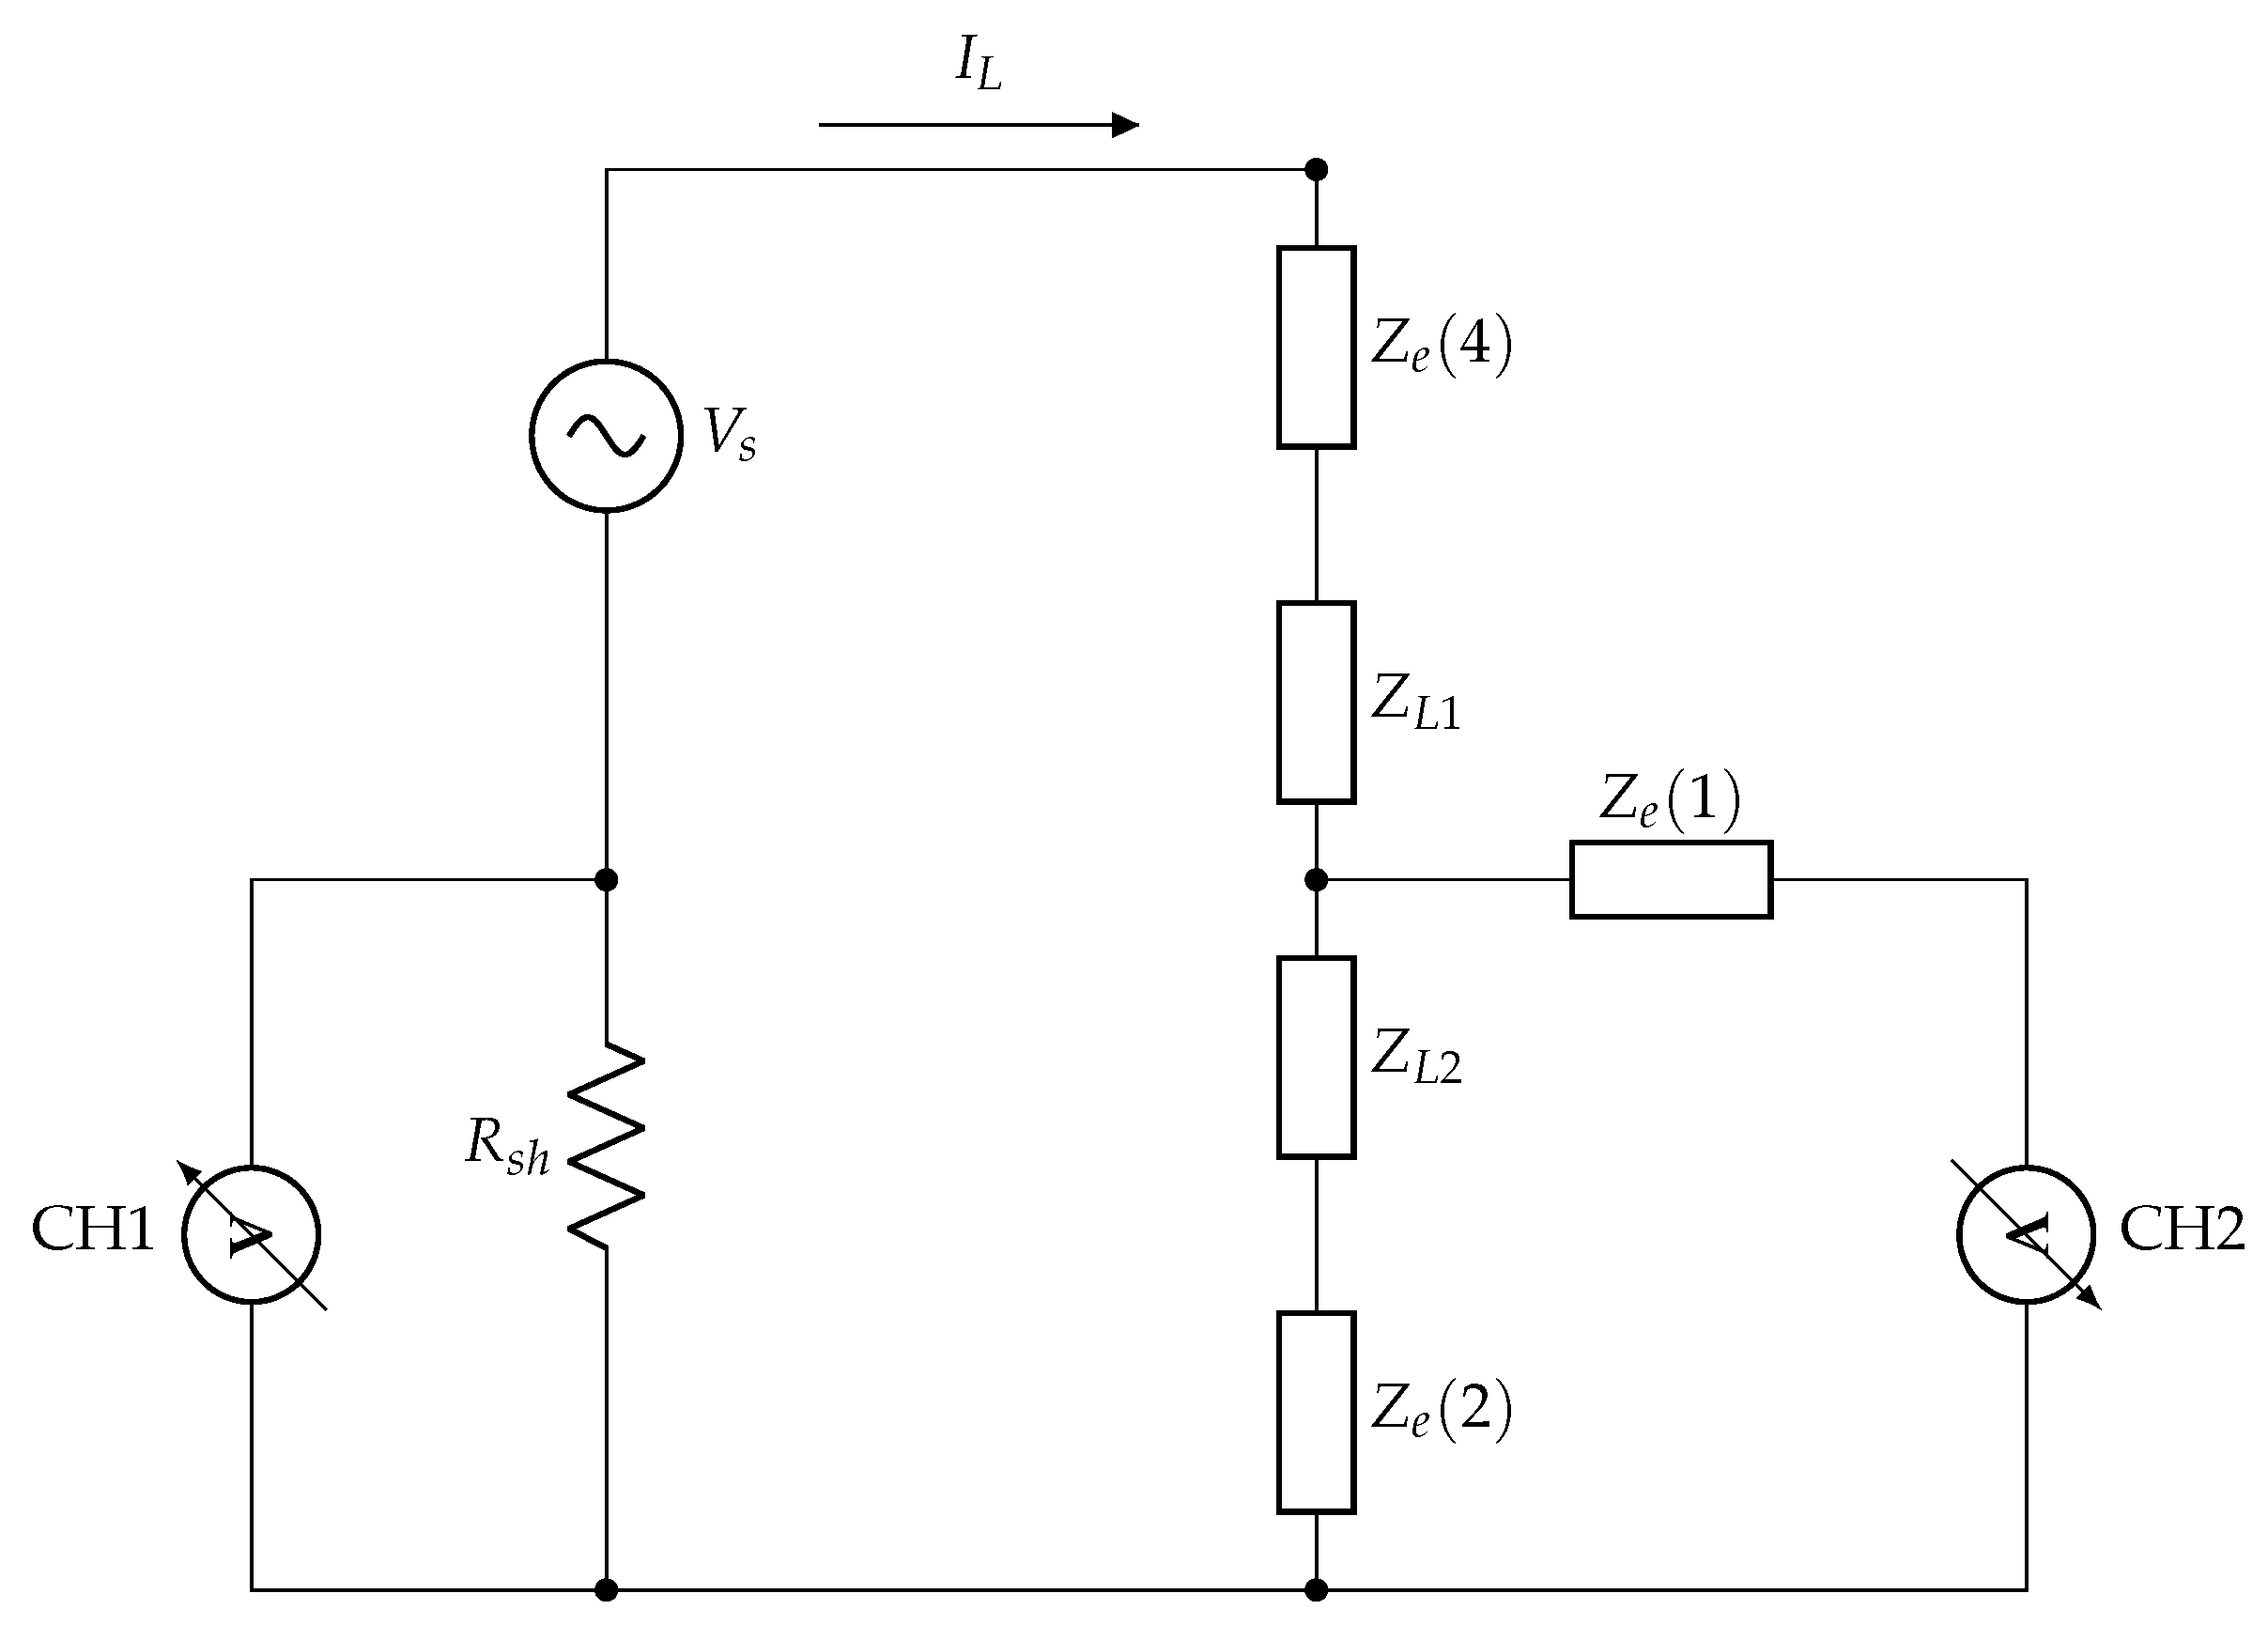
The proposed bioimpedance measurement method can be represented by the electrical equivalent circuit of Figure 3. The generic impedances Z e ( n ) represent the effect of the respective electrode (n) in the circuit. We assume that the electrode impedances Z e are composed of a parallel resistor–capacitor (RC) network [35,36]. As we have performed only AC voltage measurements, the electrodes’ half-cell potential has been neglected in the model. As the excitation frequency increases, less influence of the electrode impedance is observed on the circuit current I L . Furthermore, since the voltage measurements are performed with high input impedance, the electrode impedance Z e ( 1 ) can be neglected. Concerning the voltage measurements, a small influence caused by the electrode impedance Z e ( 2 ) is expected, while the sample impedance Z L 2 is much greater than Z e ( 2 ) .
The sample under test has a total impedance ( Z L 1 + Z L 2 ) that can be estimated by measuring the voltage between electrodes 4 and 2. In order to minimise the influence of the electrode impedance, the voltage measurements can be performed between electrodes 1 and 2, or alternatively, between electrodes 3 and 2, according to Figure 2. From the equivalent electrical circuit of Figure 3, the voltage measurement evaluates the equivalent impedance from electrodes 1 and 2, which consists of the sample impedance Z L 2 in series with electrode 2’s impedance Z e ( 2 ) . We assume that the sample is homogeneous and impedance variations occur equally both in Z L 1 and Z L 2 . In this sense, we can evaluate the electrical properties of the sample by observing Z L 2 . The value of the complex bioimpedance ( Z L 2 ), measured in ohms ( Ω ), observed between electrodes 1 and 2 can be estimated by the ratio of the measured voltage V C H 2 (channel 2) to the I L current, according to
Z L 2 V C H 2 I L = R s h · V C H 2 V C H 1 θ 2 θ 1
where θ 1 and θ 2 are the angles of the measured voltage phasors V C H 1 and V C H 2 , respectively. In this way, it is possible to determine the components of magnitude | Z L 2 | = R s h · ( V C H 2 / V C H 1 ) and phase θ L = ( θ 2 θ 1 ) , from the impedance Z L 2 . The behaviour of the impedance Z L 2 concerning the variation of the excitation frequency (f), ranging from 10 Hz to approximately 2.3 · 10 6 Hz in this experiment, is described by the Cole–Cole model [35].

2.1. Validation of the Prototype

In determining the electrical conditions of the prototype, NaCl salt solution (BIOTEC batch: 48943; São José dos Pinhais, Paraná, Brazil) was used in a concentration of 2 mol · L 1 , and from this, dilutions at concentrations of 12.5%, 25%, 37.5%, 50%, 75%, and 100% V/V with distilled water were made. For the bioimpedance measurement, 150   m L of sample was used. A portable conductivity tester (Hanna HI98304 Dist 4; Woonsocket, RI, USA) was used to measure electrical conductivity and temperature.

2.2. UHT Milk Analysis

Samples of UHT milk were purchased from the same manufacturer, with batch variations (three replications), in a local supermarket, with the nutritional characteristics, defined according to current legislation, of whole milk. To adulterate the matrix composition, samples were prepared with the addition of distilled water, in dilutions of 0.0% (unadulterated milk), 25%, 50%, 75%, and 100% V/V (pure distilled water). In addition, random dilutions were prepared within the mentioned range (97.9%, 95.8%, 93.8%, 91.7%, 87.5%, 83.3%, 67%, 62.5% V/V). For the measurement of bioimpedance, 150 mL of milk sample was used at various temperatures: 16 ± 0.8 ° C , 28 ± 0.5 ° C , and 37 ± 0.3 ° C .

2.3. Statistical Analysis and Mathematical Validation Model

A fourth-order polynomial multiple regression method [37] was used to obtain a mathematical model capable of characterising the electrical bioimpedance measurements of adulterated milk samples:
| Z L | = Y = β 00 + β 10 X 1 + β 01 X 2 + β 20 X 1 2 + β 02 X 2 2 + β 03 X 2 3 + β 04 X 2 4 + β 14 X 1 X 2 4
where the dependent variable Y corresponds to the magnitude of the electrical bioimpedance ( | Z L | ) and the independent variables X 1 and X 2 represent the temperature ( ° C ) and dilution (percentage of water) of the sample, respectively. The regression coefficient β 00 represents the constant portion of the model, β 10 and β 01 the linear effect of temperature and dilution, respectively, and β 02 and β 20 their quadratic effects. The coefficients β 03 and β 04 represent the cubic and fourth-order dilution effects, and finally, β 14 the interaction effect. The regression polynomial of Equation (2), the value of its coefficients, and the statistical analysis of the experimental data were determined from the Minitab software (version 16; State College, PA, USA), at low ( 10 1 Hz), medium ( 10 3 Hz), and high frequency ( 10 6 Hz). The statistically non-significant terms of the complete polynomial were gradually excluded from the model to improve the quality of the data fit, as well as the terms limited by the degrees of freedom of the variables. For the validation of the model, varied samples with different water percentages were analysed at random temperatures (between 16 and 37 ° C ) and frequencies ( 10 1 , 10 3 , and 10 6 Hz).

3. Results and Discussion

Electrical bioimpedance is a technique with great potential for food analysis, but still not frequently used. However, in this research, it was possible to identify differences in the percentage of water present in milk and generate mathematical models with the potential to be applied in the future to verify adulteration of this food. Also, the influence of temperature on the final impedance values was verified. In the literature, there are historical reports of scandals and research that have detected fraud in the various types milk, mainly due to the presence of water [38,39,40,41]. Due to this fraudulent behaviour, it is necessary to guarantee the health of the consumer through a constant process of investigation of the quality of the marketed milk [3]. The analyses (titulometry, polarimetry, colourimetry, gravimetry, densitometry, butyrometry) used to detect such frauds are still lengthy, laborious, and costly [10]. Furthermore, the bioimpedance technique for milk monitoring analysis, can still be considered environmentally friendly compared to the traditional techniques recommended by current legislation, as it does not use organic solvents, involves fewer steps, and consequently requires less analysis time, allowing real-time monitoring and preventing the need for processes for the environmental disposal of residual material.

3.1. Bioimpedance Measurement Prototype Validation

The proposed measurement system has been initially validated considering the magnitude and phase response of the electrical impedance of distilled water at various temperature levels. Figure 4 shows the frequency response of the distilled water impedance. One can observe that such a response resembles that of an RC low-pass circuit. High impedance values are found at lower frequencies due to the limited availability of charge carriers. In fact, distilled water exhibits dielectric properties and can be modelled as an equivalent capacitor in series with a resistor. The impact of temperature on the measurements is primarily observed in the low-pass frequency band. The impedance variation regarding the temperature from 10   Hz to 10   k Hz has a mean value of 53.3 Ω / ° C . However, temperature has a lesser impact on the impedance phase measurements.
Figure 5 presents the complex impedance measurements for NaCl saline solutions; it is assumed that NaCl solutions have a simpler electrical model than milk. One can observe that the presence of ions modifies the frequency response and reduces the impedance magnitude in comparison to Figure 4. A decreasing behaviour of the impedance magnitude up to 10 3 Hz is observed in the results in Figure 5A. At this point, one can notice that the concentration percentage modifies the curve’s offset, and the greater the concentration, the closer the curves. The NaCl concentration directly affects the impedance magnitude in an inverse way. In addition to that, the decay of the impedance magnitude with increasing frequency from 10 Hz to 10 3 Hz is coherent with an impedance electrode response. Thus, impedance measurements should be performed at least one decade greater than 10 3 Hz. Figure 5B shows the same information, but from another perspective. The inverse behaviour of the impedance magnitude with respect to the NaCl concentration is clear. One should notice that from concentrations greater than 1.5 mol · L 1 no significant impedance magnitude variations can be expected. Figure 5C,D show the impedance phase measurements. The predominance of negative angle values is coherent with the presence of capacitive loads. In this experiment, parasitic capacitances are mostly present at the electrode impedances. At higher frequencies, the phase values turn to positive, which is compatible with an inductive load response. Cabling inductance can interfere with the measurements at a frequency range of MHz. From Figure 5D, one should notice that the NaCl concentration affects the impedance phase somewhat. Such a result is coherent with the saline solution’s electrical characteristics. Increasing the concentration does not add more reactance to the total load impedance. From this experiment, one can observe that the proposed impedance measurement method works properly within the frequency range from 10 3 Hz to 10 5 Hz.
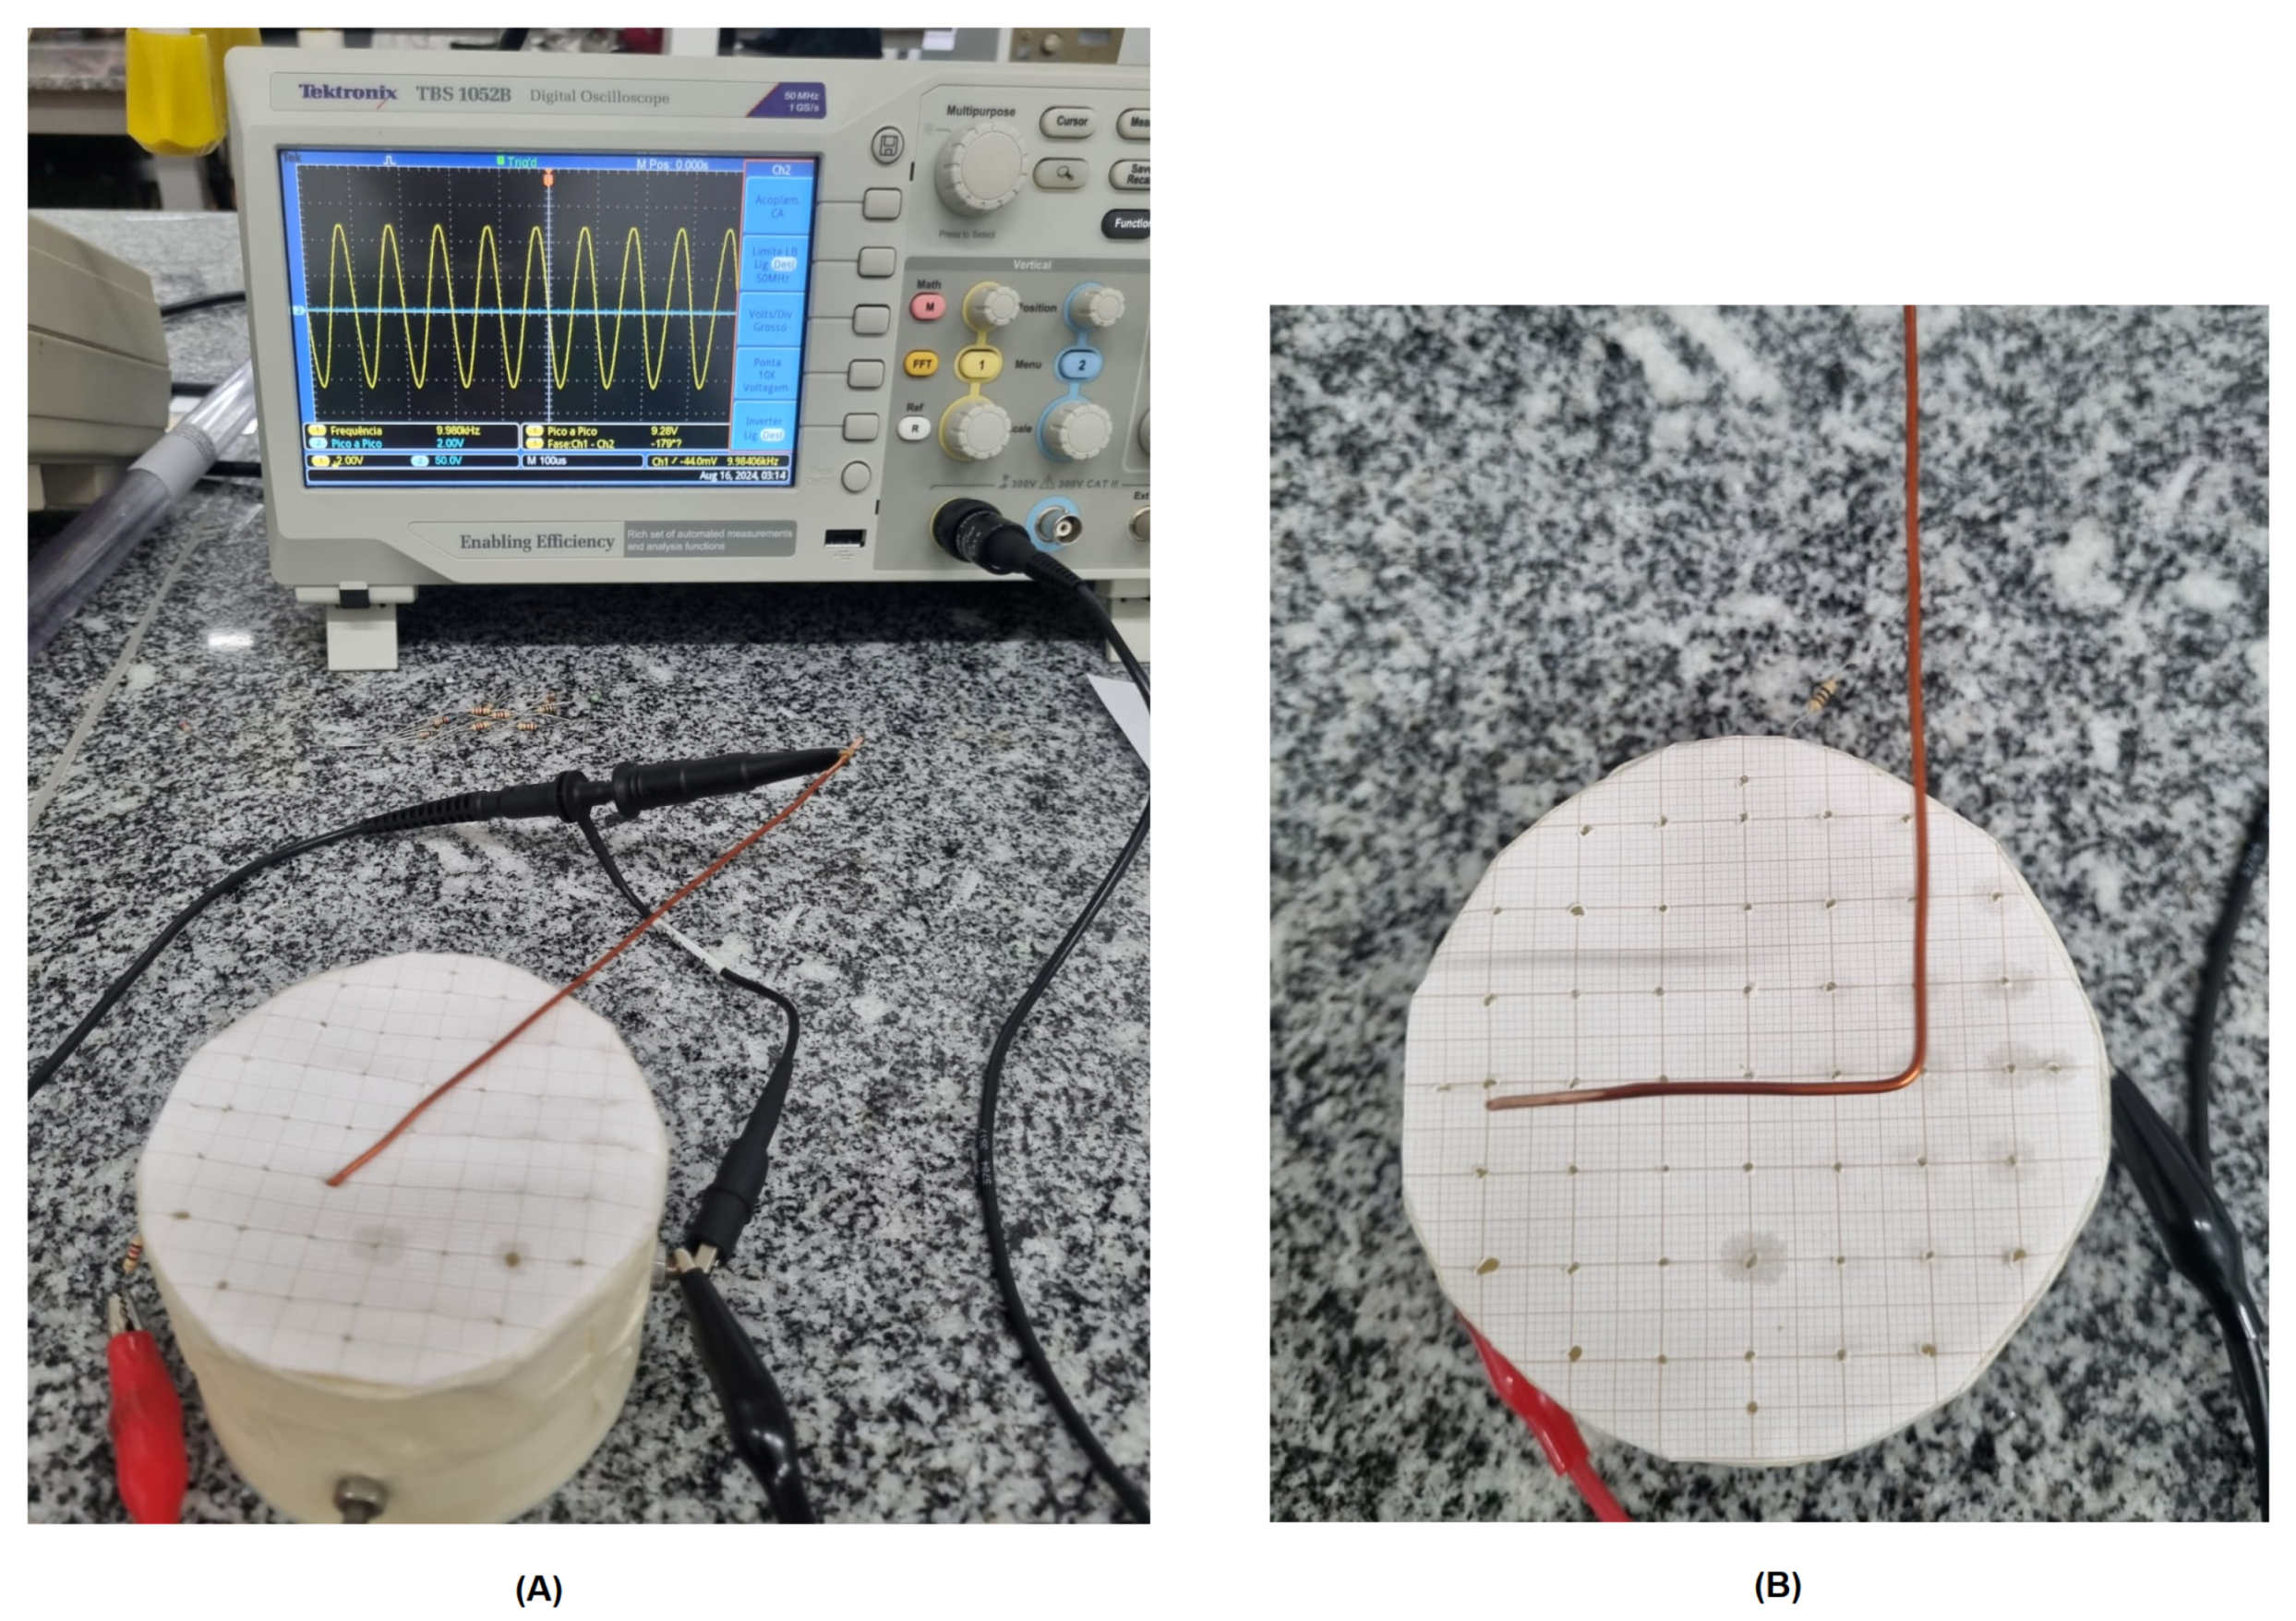
When a potential difference is applied to a pair of electrodes in contact with a liquid medium, the ions are forced to move because an electric field is present in the sample volume. The electric potential is distributed along the sample, from higher values close to electrode 4 (see Figure 2) to lower values close to electrode 2 (reference). The points within the sample that have the same potential values form the so-called equipotential surface. Figure 6A shows the experimental setup used to evaluate the equipotential lines along a measurement plane at a height of 20 m m from the container bottom. Millimetre paper has been fixed at the top of the container to control the measurement position. Figure 6B shows the copper electrode used to evaluate the potential measurements.
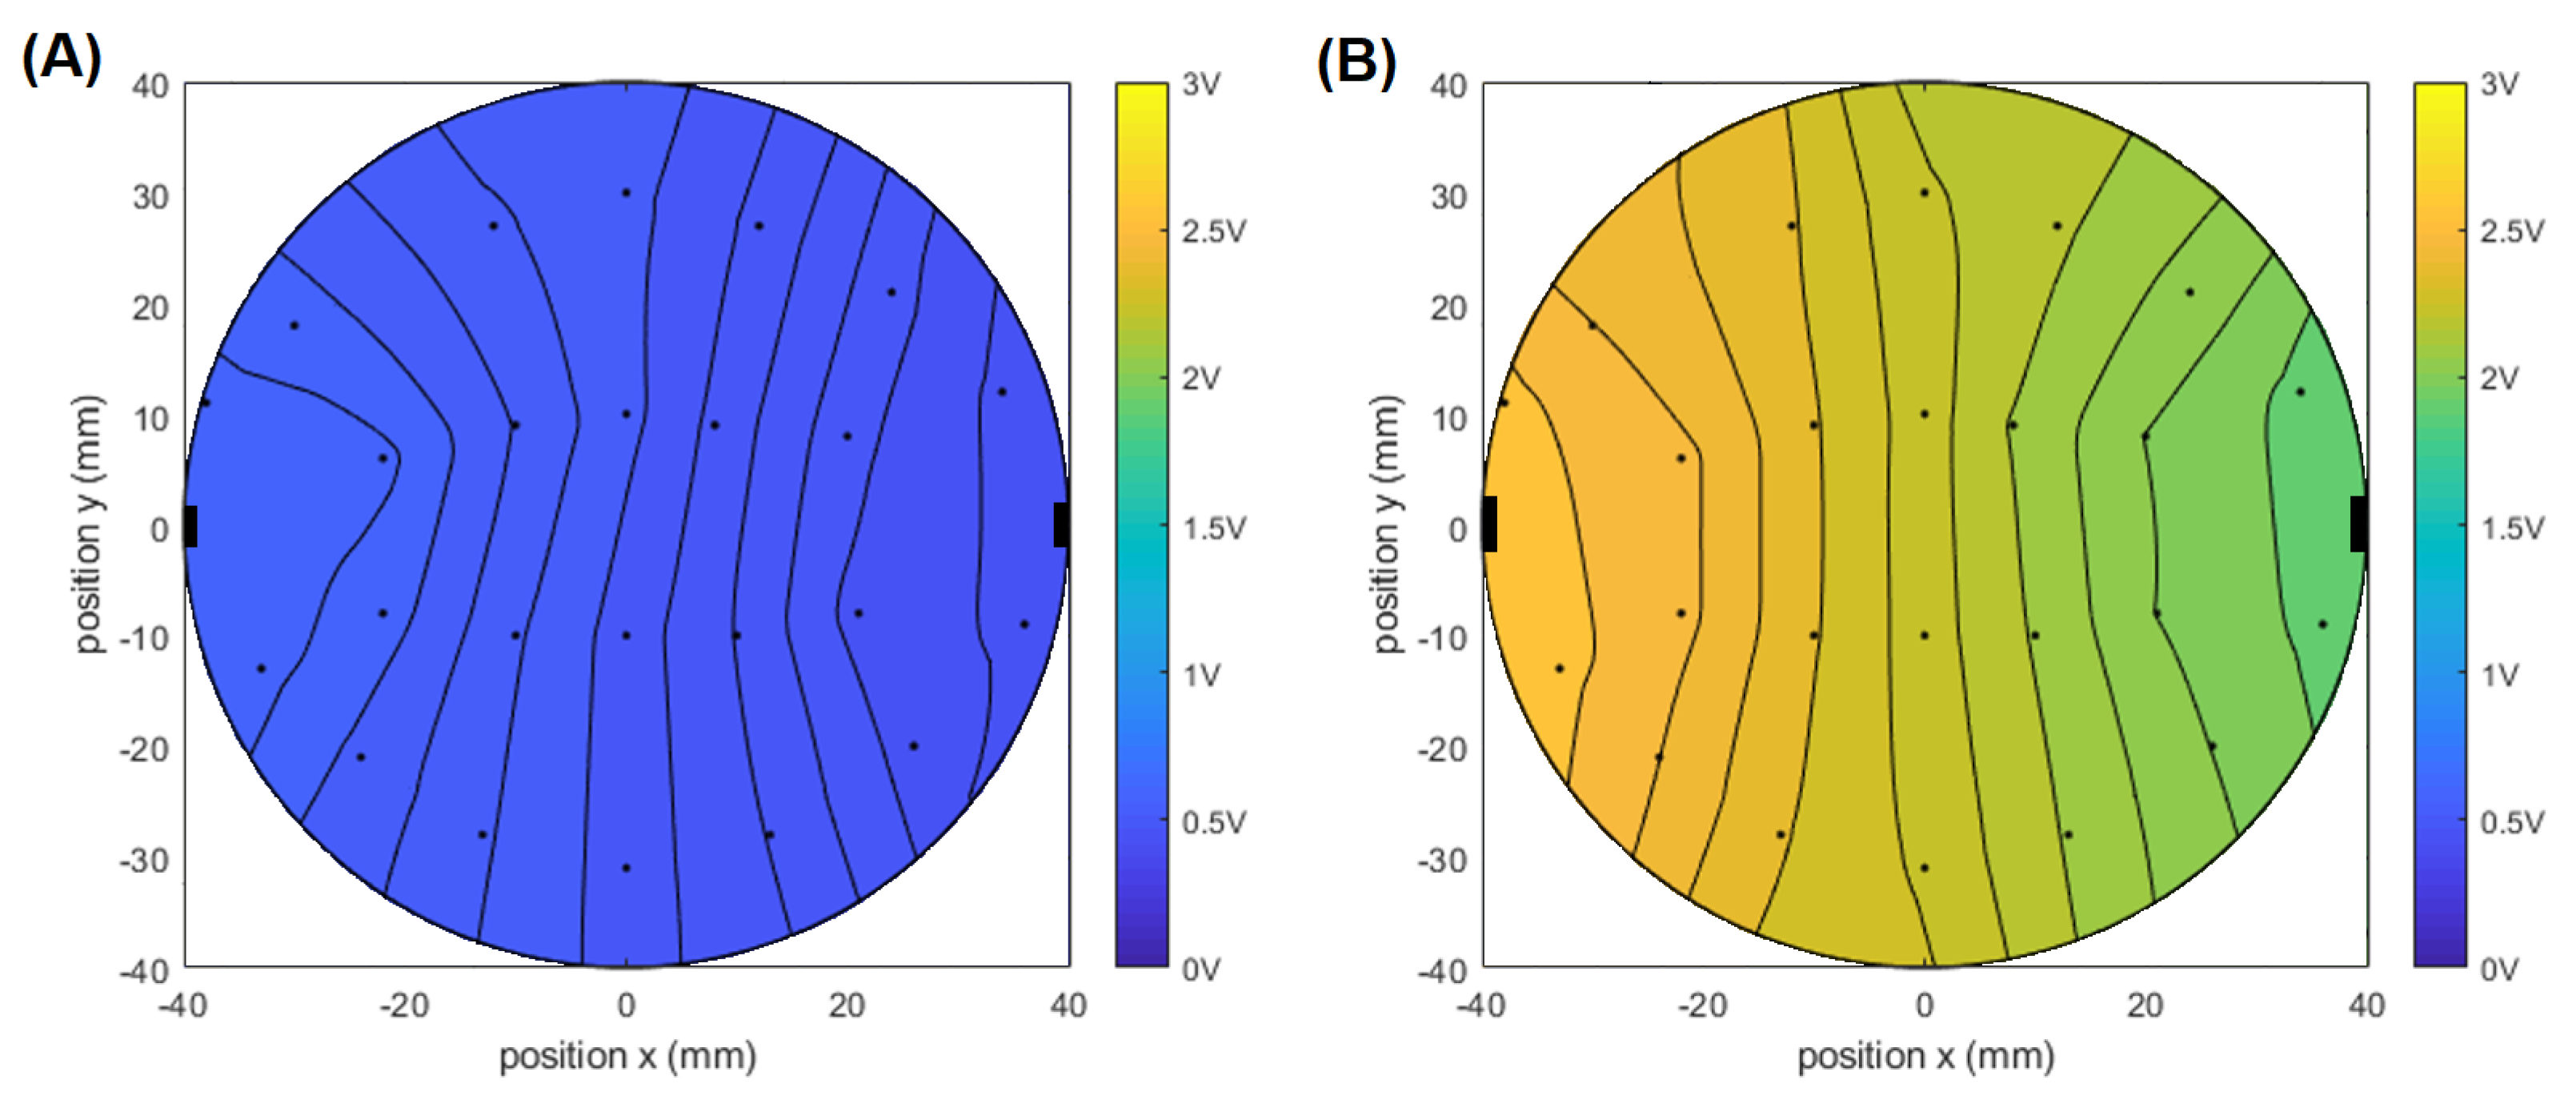
Figure 7 shows graphically the voltage magnitude measured at 24 points inside the NaCl solution at a height of 20 mm from the container bottom. From the measurements, one can estimate the equipotential lines that can be evaluated at the lateral border of the container by the electrodes. The black rectangles represent the current injection electrodes. The equipotential lines provide a visual feedback to help the electrode positioning. The voltage measurements cannot be performed between electrodes that are linked at the same equipotential line. The experimental results of Figure 7 resemble the expected equipotential lines of Figure 2. The colour intensity variation between Figure 7A and Figure 7B is due to the change in impedance magnitude caused by the difference in concentration of the saline solution and it is coherent with the results shown in Figure 5. At high concentrations, there are many ions available for electrical current transportation. Thus, the impedance magnitude is lower and the voltage drop across the load is quite small, as shown in Figure 7A. For lower concentrations, the impedance magnitude is higher. As a consequence, the voltage drop across the load is greater. From Figure 7B, one can notice a voltage drop of 1   V , approximately. The distilled water used to make the dilutions has an approximate impedance value of 7 k Ω with a frequency variation up to 10 5 Hz.

3.2. Analysis of Adulterated Milk and the Influence of Temperature

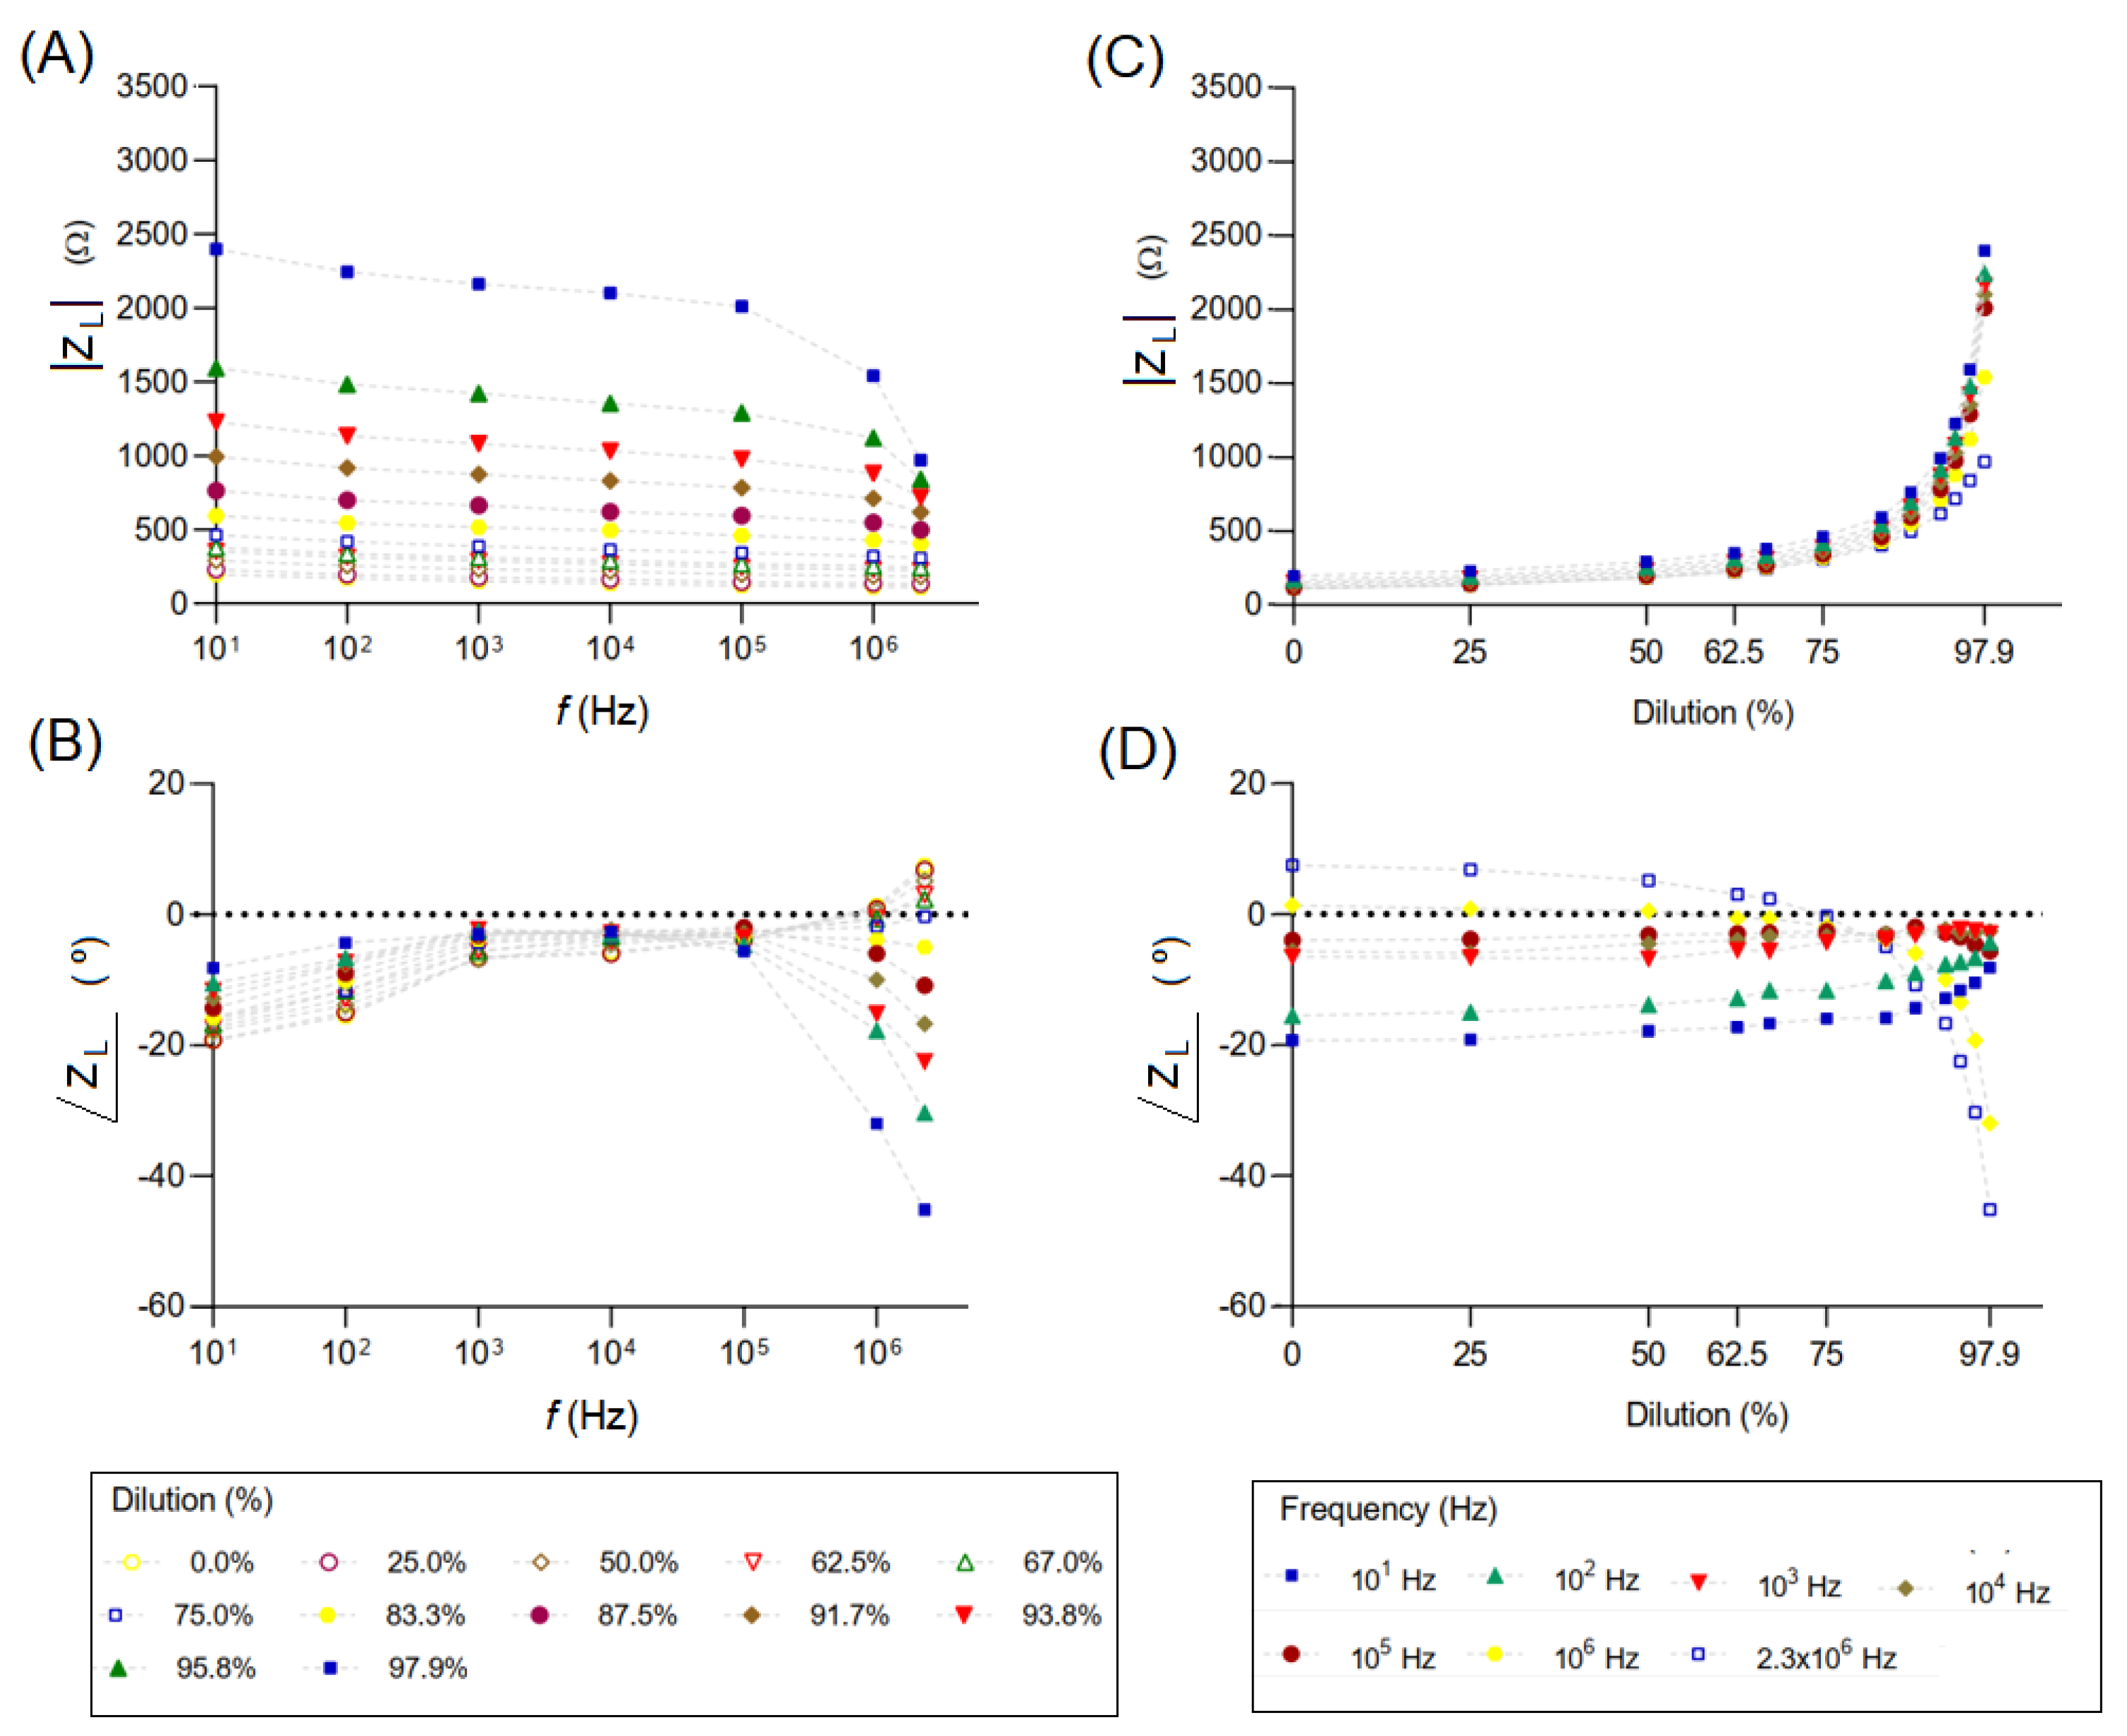
Like any other method or technique of food analysis, bioimpedance can vary according to the conditions under which it is applied, and standardisation of sample conditions is necessary to obtain reliable results. Several factors can interfere with the response, such as type of food, ion concentration, hydrophobic and hydrophilic properties, pH, temperature, and others, i.e., whenever the electrical conditions of the system are modified. As observed in Figure 8, water content directly influences the bioimpedance values. In Figure 8A,B the frequency response of the milk sample at 16 ° C is presented.
If one sets a working frequency, the impedance magnitude is highly affected by the water dilution. However, at frequencies greater than 100   k Hz we notice a sharp drop, mainly at higher dilution percentages. At lower dilution percentages the impedance magnitude is almost flat with the frequency. Figure 8C presents such a response from other perspective. Thus, for fixed-frequency testing, the variations in impedance magnitude can be used to estimate the water content in a sample. Alternatively, if one applies the frequency response, unadulterated milk shows a flat frequency response trend. The impedance phase response shown in Figure 8B,D can also indicate water content in milk, especially at frequencies greater than 100   k Hz , where higher phase variations have been found. Table 1 summarises the complex impedance measurements in both unadulterated and milk samples adulterated with distilled water. The sample temperature was 16 ° C .
Figure 9 presents the results for the complex impedance measurements in milk samples at 28 ° C . The phase results in Figure 9B,D are quite similar to the measurements presented in Figure 8B,D. However, the impedance magnitude measurements are affected by the sample temperature.
Table 2 summarises the complex impedance measurements in both unadulterated and adulterated milk samples with distilled water at 28 ° C .
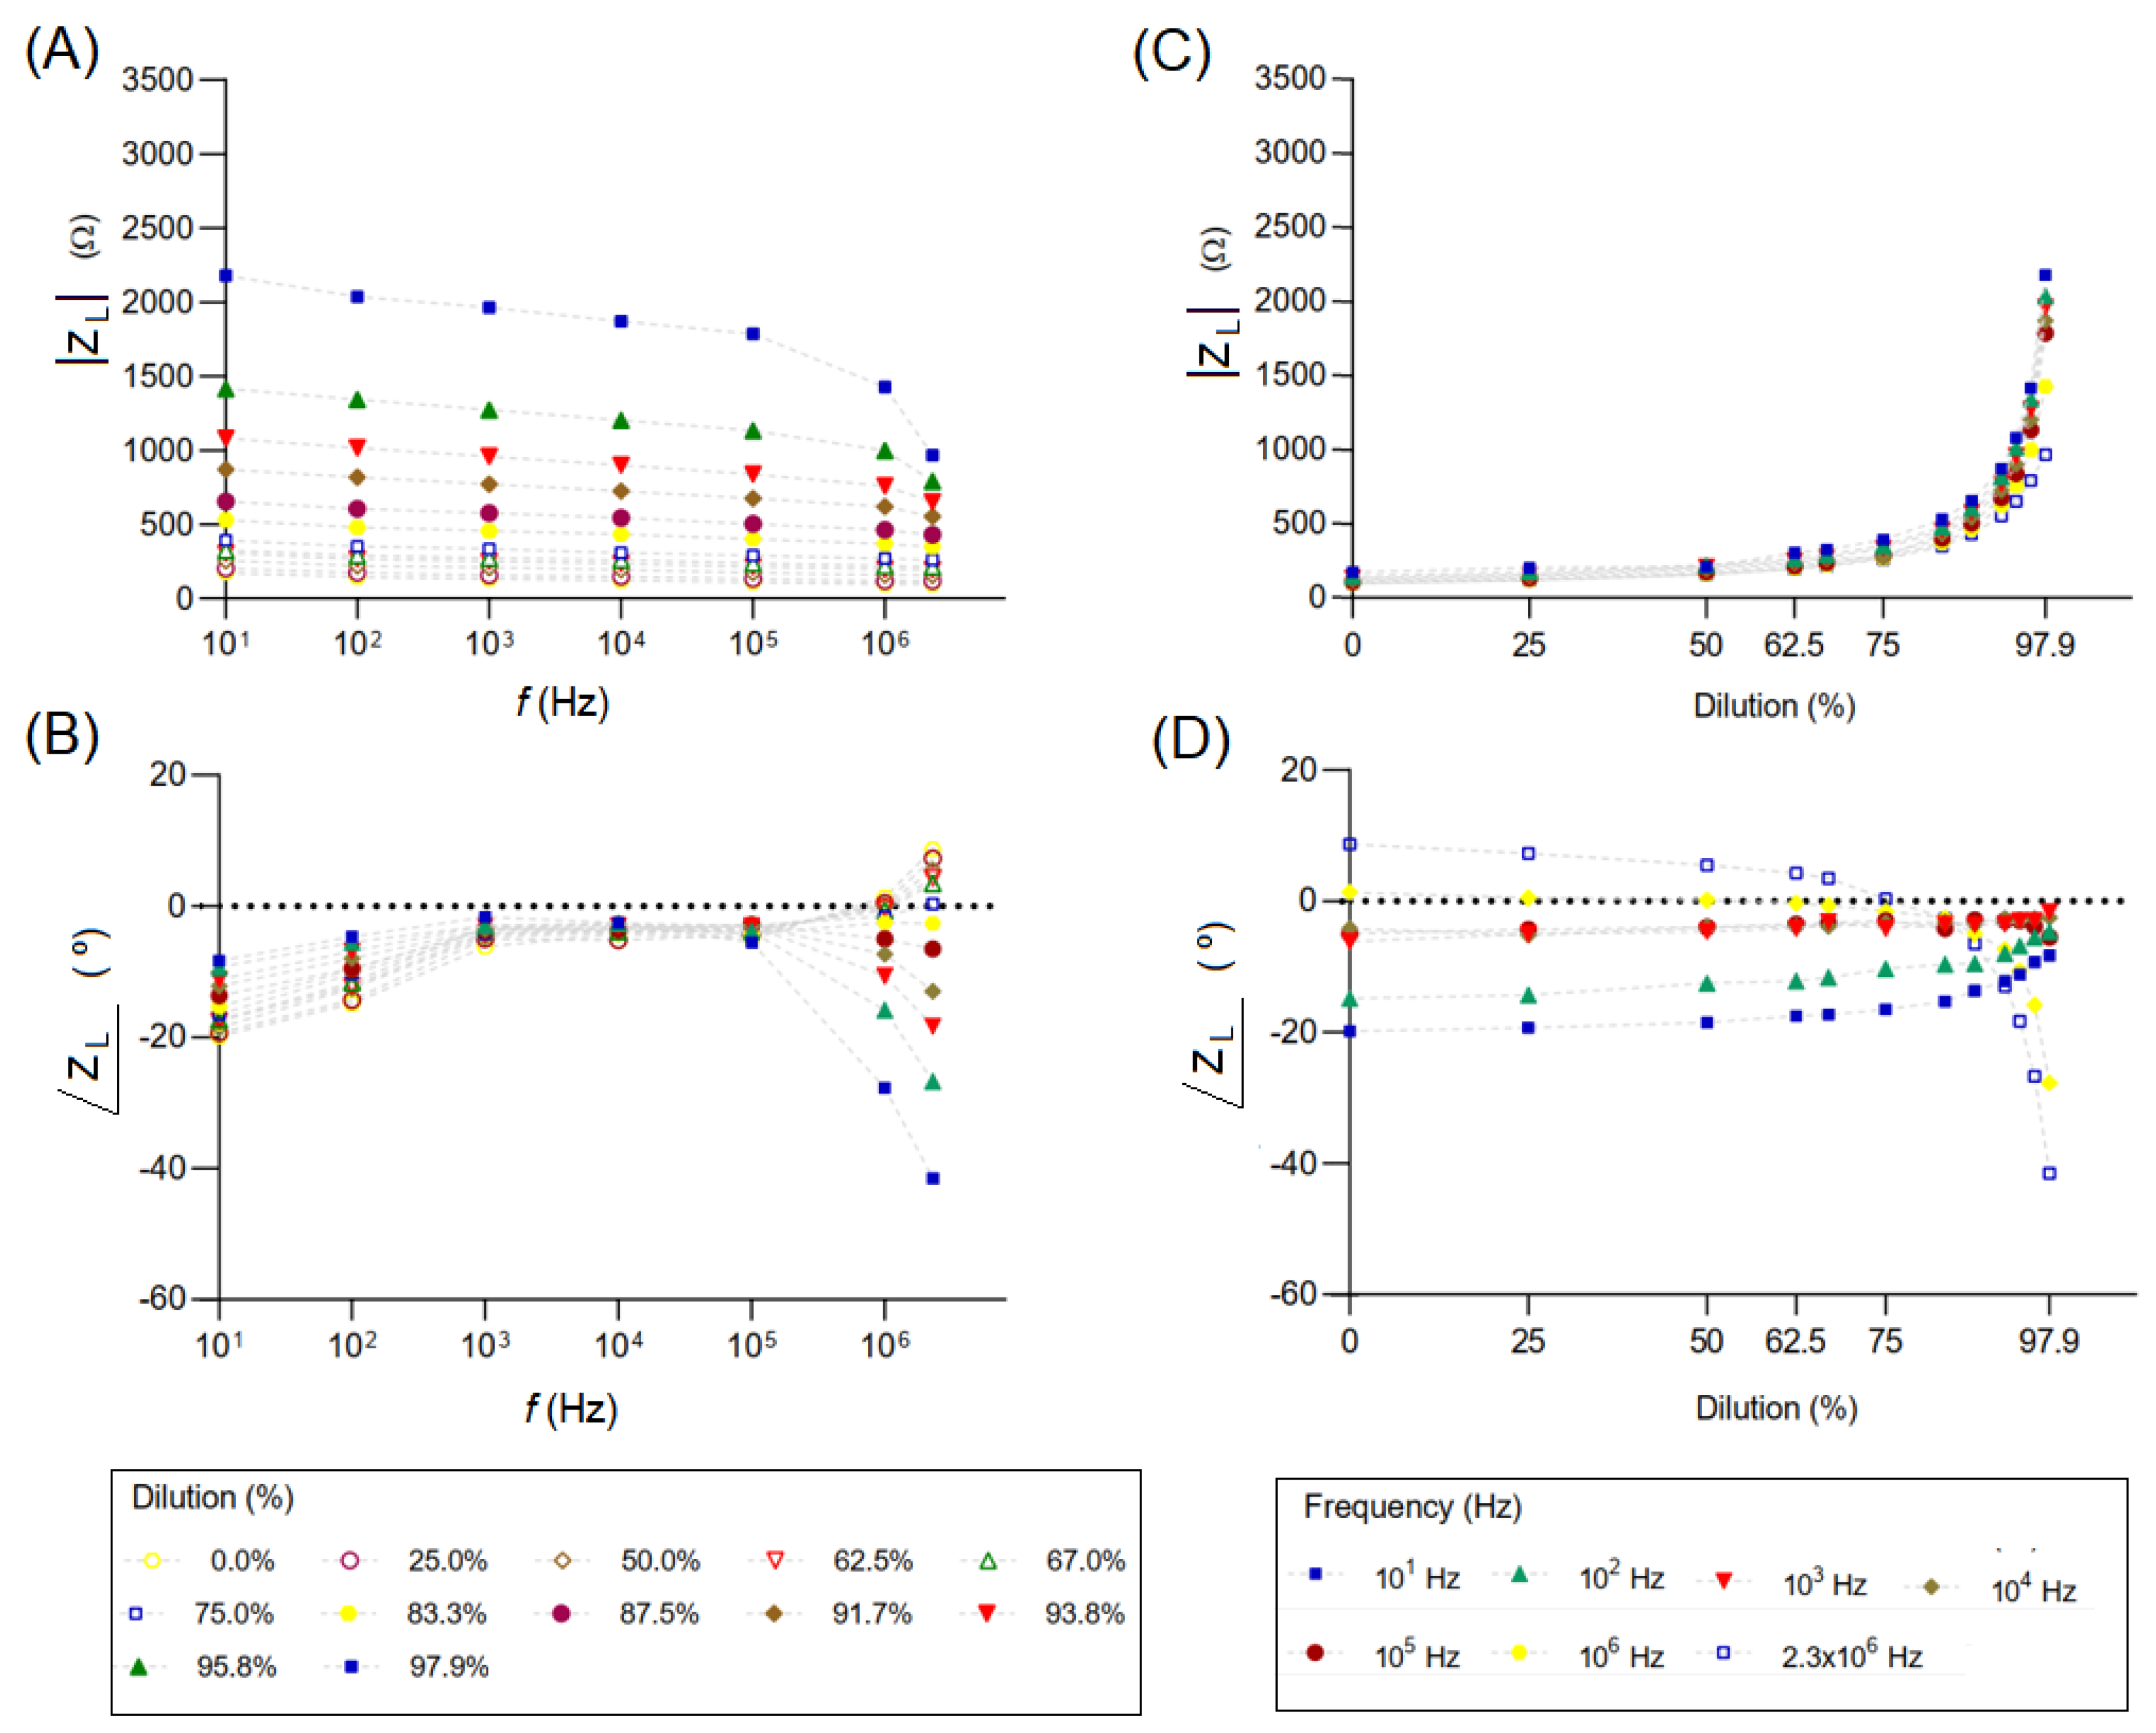
Figure 10 presents the results for the complex impedance measurements in milk samples at 37 ° C . The phase results in Figure 10B,D are quite similar to those presented at 16 ° C and 28 ° C . The impedance magnitude measurements continue to decrease with the sample temperature. Table 3 summarises the complex impedance measurements in both unadulterated and adulterated milk samples with distilled water at 37 ° C .
For each frequency level and percentage of water in milk, the complex impedance was measured three times according to the proposed methodology. The standard deviations shown in Table 1, Table 2 and Table 3 reflect the uncertainty inherent in the experimental results. There are many causes of variability in experimental data. Fluctuations in the amplitude of the excitation signal lead to variability in the excitation current, and consequently, in the impedance calculations. Additionally, all voltage measurements are performed with an oscilloscope, and its accuracy depends on how the data are acquired. Another source of uncertainty is the electrode impedance, which has not been evaluated in this work. Finally, there are variations in the sample composition itself and its volume. The experiment was repeated with milk from different production batches. All these sources of uncertainty propagate to the impedance measurement calculations.
The results analysis shows that bioimpedance values are inversely proportional to the temperature; i.e., the higher the temperature of the analysed sample, the lower the bioimpedance values. For an increase in temperature, the mobility and the number of ions increase in solution, causing a decrease in the electrical impedance value [42]. The mean values obtained from all Z L impedance magnitude measurements were 820.96   Ω , 633.44   Ω , and 563.04   Ω for temperatures of 16, 28, and 37 ° C , respectively. The determination of a usual impedance value for milk samples is difficult to predict, as it depends on conditions such as breed of animal, seasonal changes, composition, storage conditions, lactation period, and the health and nutrition status of the animal [28,29,43,44]. The impedance behaviour profile, along with the increase in frequency of diluted samples, was the same for all temperatures, despite the variations in the impedance magnitude values. The linear behaviour with a slight decline was observed up to 83.3% dilutions and at all tested frequencies (Figure 8, Figure 9 and Figure 10 and Table 4) and it was also verified by Durante, Becari, Lima, and Peres [45], both for low and medium frequencies (between 10 3 Hz and 10 6 Hz) with or without water adulteration, or even hydrogen peroxide (H2O2) up to 10% V/V. The electrical impedance values decrease as the frequency increases, suggesting a resistive model for milk, due to the type of ions in its matrix [44,46]. A similar result of impedance stability at high frequencies was observed by Veiga and Bertemes-Filho [29] in milk samples. However, in dilutions from 87.5% there is a greater decline at higher frequencies.
The frequency variation ( 10 1 to 2.3   ×   10 6 Hz) also interferes with the values and behaviour of the bioimpedance (Figure 8, Figure 9 and Figure 10 and Table 4). However, the variation between the diluted samples (0% and 97.9%), at various times, measured at the 10 1 Hz frequency was not influenced by temperature (16 ° C = 12.6 times; 28 ° C = 12.1 times; and 37 ° C = 12.6 times). However, at a frequency of 10 6 Hz the temperature was influenced, with a slight increase in temperature variation up to 37 ° C (16 ° C = 13.0 times; 28 ° C = 13.7 times; and 37 ° C = 14.6 times). It is worth noting that for the higher frequency of 10 6 Hz ( 2.3   ×   10 6 Hz) this variation is more noticeable (16 ° C = 7.3 times; 28 ° C = 8.8 times; and 37 ° C = 10.0 times). When considering the percentage of water in the milk sample and the frequency, a difference in bioimpedance behaviour was observed with increased frequency (Figure 8, Figure 9 and Figure 10 and Table 4). The bioimpedance variations between 0% and 50% water in milk at frequencies of 10 1 and 10 6 Hz were reduced, with little influence of temperature: 16 ° C = 1.5/1.6 times; 28 ° C = 1.5/1.6 times; and 37 ° C = 1.2/1.6 times, respectively. This behaviour is observed for all frequencies in between this interval. For calculations considering higher percentages of water, 50% and 97.9%, a large variation with higher temperatures was observed: 16 ° C = 8.5/8.0 times; 28 ° C = 8.3/8.4 times; and 37 ° C = 10.4/9.0 times ( 10 1 / 10 6 Hz), respectively. It is interesting to note that at the frequency 2.3   ×   10 6 Hz and the lower percentages of water in milk (0% and 50%), the variation profiles were similar to the other frequencies (1.6 times for all temperatures). However, at the higher percentages (50% and 97.9%) the variation was reduced by half and was influenced by temperature (16 ° C = 4.5 times; 28 ° C = 5.3 times; and 37 ° C = 6.2 times).
Also, paying attention to the percentage of water in the milk sample only, it can be seen that at dilutions greater than 75% water, the inclination of the reduction of bioimpedance was more accentuated with the increase in frequency and the behaviour remained similar between the tested temperatures of 16 ° C (0%: AC = 0.03 and R 2 = 0.32; 75%: AC = 0.05 and R 2 = 0.41; 97.9%: AC = 0.82 and R 2 = 0.95), 28 ° C (0%: AC = 0.02 and R 2 = 0.39; 75%: AC = 0.04 and R 2 = 0.47; 97.9%: AC = 0.54 and R 2 = 0.94) and 37 ° C (0%: AC = 0.02 and R 2 = 0.39; 75%: AC = 0.04 and R 2 = 0.47; 97.9%: AC = 0.53 and R 2 = 0.89) (Figure 8, Figure 9 and Figure 10 and Table 4). Also, in Figure 8, Figure 9 and Figure 10 the behaviour of the frequency profile along the milk dilutions is represented. Linearity, with slight growth, is noted at all analysed frequencies up to the milk samples with 75% water. From this, a sharp increase in impedance values occurs. The behaviour of distilled water at 16 ° C was the same as that of adulterated milk samples, with a reduction in impedance value of 5.6 times between the frequencies 10 1 and 10 6 Hz. Considering the frequency of 2.3   ×   10 6 Hz, the reduction was even higher, rising to 13.8 times. The highest impedance value was obtained at frequency 10 1 Hz ( 8748.39   Ω ) and the lowest at 2.3   ×   10 6 Hz ( 634.62   Ω ).
In Figure 8, Figure 9 and Figure 10, the behaviour of the phase θ of impedance at different temperatures and with increasing frequency is also represented. The mean values obtained from all impedance phase measurements were 8.39 ° , 7.55 ° , and 6.91 ° for temperatures of 16, 28, and 37 ° C , respectively. The highest phase impedance value was found at 37 ° C and the lowest at 16 ° C , both at 2.3   ×   10 6 Hz.
The temperature varied slightly with the value of the impedance phase, with the highest values at the highest temperatures. The response of the impedance phase is different depending on the frequency applied. At a temperature of 16 ° C , the impedance phase gradually increases to the frequency of 10 5 Hz. At temperatures of 28 and 37 ° C , the increase is more pronounced up to 10 3 Hz, and then, remains similar up to 10 5 Hz (Figure 8, Figure 9 and Figure 10). At all temperatures, an abrupt reduction in the values of the impedance phase is observed after 10 5 Hz frequency; i.e., up to 10 5 Hz the value of the impedance phase is directly proportional to the increase in frequency, and after, it presents an inversely proportional characteristic. In the milk samples with a percentage above 67% water, a greater difference between the phase values is observed. The phase angle allows the measurement of the delay between the external excitation electrical signal and the electrical response. Given this, if adulterants are added to the milk, the ionic content present in the sample changes, i.e., the electrical behaviour of the milk increases or decreases depending on the formation or dissolution of protein particles [16].
The impedance phase behaviour at frequencies higher than 10 6 Hz assumed a behaviour contrary to that of the other analysed frequencies (Figure 8, Figure 9 and Figure 10). At the lower frequencies, gradual growth is observed with the increase in the percentage of water, already in the frequencies above 10 6 Hz, a phase decay occurs, with a sudden reduction above 83% water. This action is even more noticeable at the frequency of 2.3   ×   10 6 Hz. Temperature had the greatest influence on the phase behaviour at frequencies above 10 6 Hz. At 16 ° C , the drop in values is sharper than at other temperatures. Moreover, it is more abrupt from 62.5% water and at temperatures of 28 and 37 ° C from 75% water. The increase in temperature provided higher phase values for frequencies above 10 6 Hz. Table 1, Table 2 and Table 3 summarise the measured impedance and phase values in both unadulterated and adulterated milk samples with distilled water, at some frequency points and temperatures of 16 ° C , 28 ° C , and 37 ° C .

3.3. Mathematical Models

Mathematical models have already been applied in many areas of food technology and various processes, from microbiological to physical–chemical control. The combination of methods and processes, such as the use of bioimpedance and mathematical modelling, has been researched for various purposes, mainly to verify the change in physical–chemical aspects in food, as in the case of milk adulteration. Nascimento et al. [18] have proposed statistical models based on conductance and phase angle; i.e., electrical parameters, to assess changes due to milk adulteration with ethanol, sodium chloride, and sodium bicarbonate. According to the authors, the research aimed to establish a correlation between the results of the electrical measurement and the added substances.
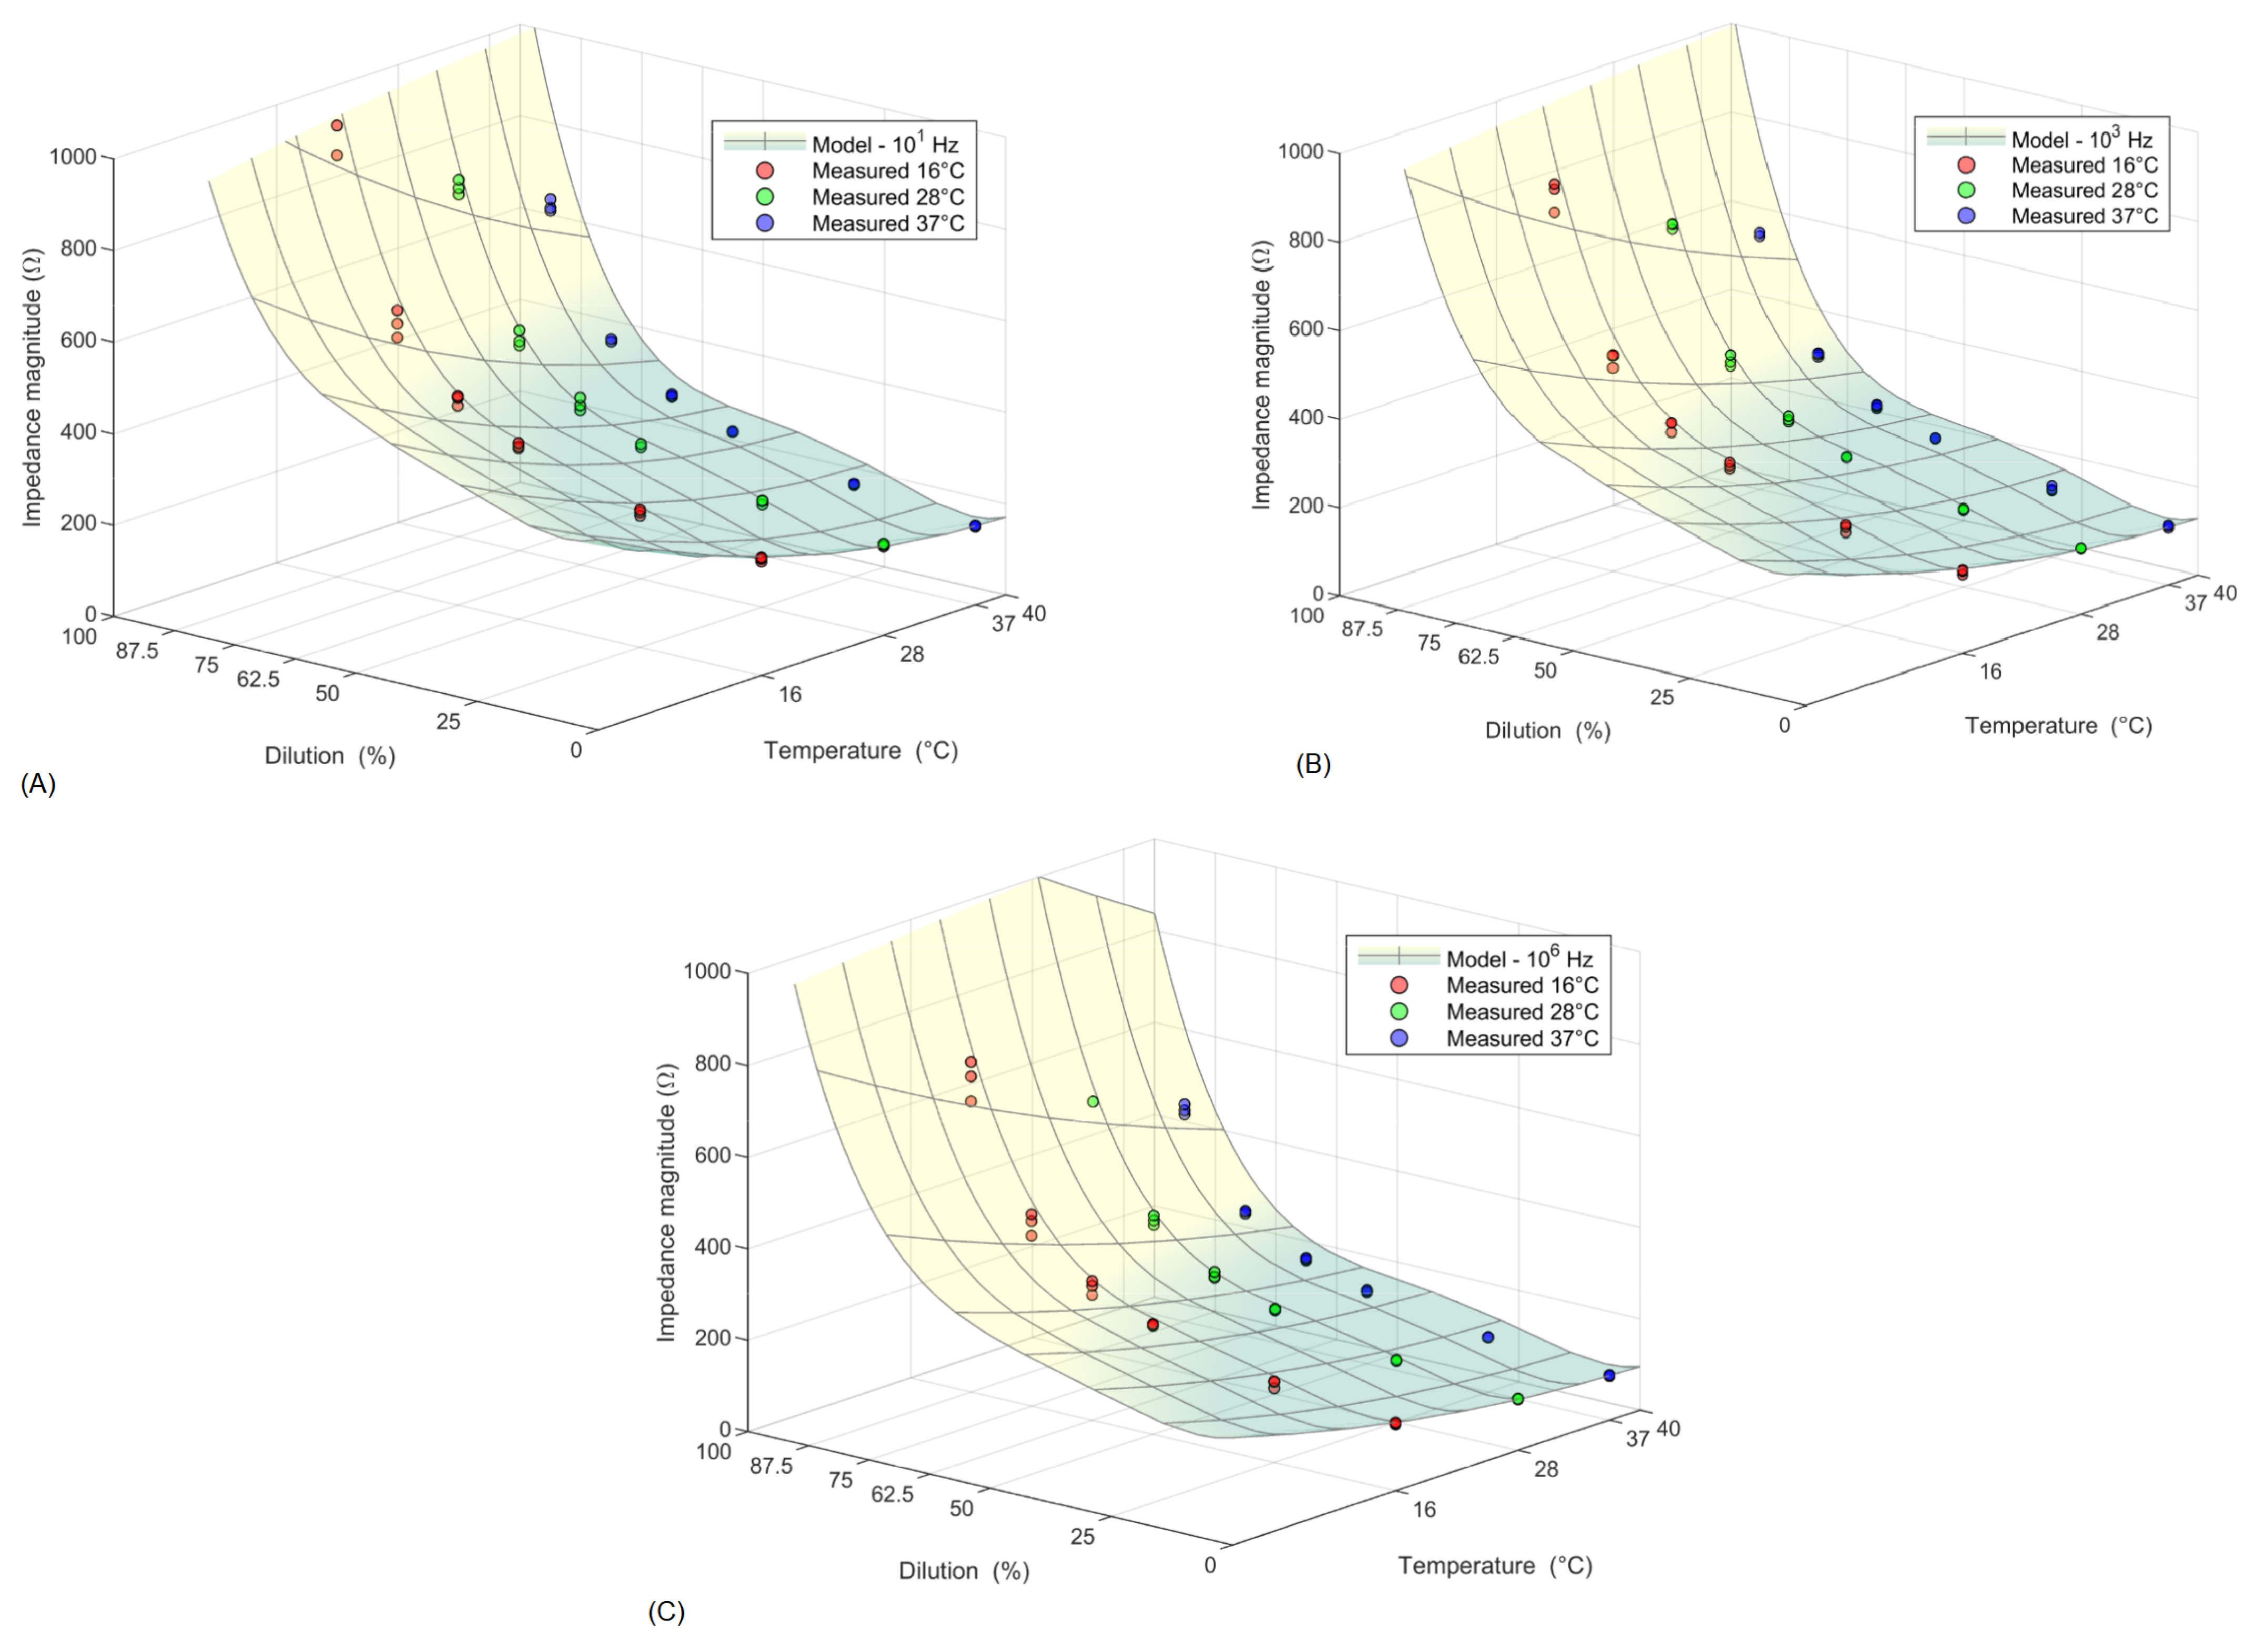
Table 5 presents the statistical parameters of the proposed mathematical models from the experimental measurements for the frequencies 10 1 , 10 3 , and 10 6 Hz, i.e., low, medium, and high frequency and Equations (3)–(5) are, respectively, the mathematical models to predict the impedance magnitude as a function of temperature (T) and dilution (D). Figure 7 presents the regression surfaces of the models. The possibility of using mathematical models is important because if there is a correlation of factors, a methodology can be proposed to identify adulteration by these substances from these models [18].
| Z L | = 414.73 12.0732 · T 4.81235 · D + 0.1490 · T 2 + 0.434274 · D 2 0.0092 · D 3 + 7.04196 × 10 5 · D 4 1.79283 × 10 7 · T · D 4
| Z L | = 298.425 8.38551 · T 4.74573 · D + 0.103552 · T 2 + 0.413078 · D 2 0.0086 · D 3 + 6.47784 × 10 5 · D 4 1.44913 × 10 7 · T · D 4
| Z L | = 233.488 6.47223 · T 3.50796 · D + 0.0750184 · T 2 + 0.30982 · D 2 0.0065 · D 3 + 5.02774 × 10 5 · D 4 1.31422 × 10 7 · T · D 4
It should be noted that the equation models for 10 1 Hz, 10 3 Hz, and 10 6 Hz were similar to the significance of the terms and the interactions between the variables. In all of them, the linear, quadratic, cubic, and fourth-order factors of dilution (% water) have statistical significance (p < 0.05), as well as the temperature (T) × dilution (D) interaction for the analysis of milk adulterated with water. However, the high-order temperature terms showed no significance in any of the models, leaving only their linear effect. The adjustment of impedance values in the regression models resulted in a coefficient of determination ( R 2 ) of approximately 0.99 for all models. The same value (0.99) was found for the adjusted R 2 . Nascimento et al. [18] presented a coefficient of determination for their models with values greater than 0.94 for milk adulterated with ethanol, sodium chloride, and sodium bicarbonate. The value of R 2 indicates the ratio between the variation explained and the total variation, representing a measure of the degree of adjustment [47], and values close to unity imply that most of the variability in the magnitude of Z is explained by the regression model, which indicates that the model has a good degree of adjustment [37]. Given this, the model showed a good fit, which can be seen in the regression surface graph (Figure 11). The probability values were lower than 0.05, indicating that the terms of the model have significant effects on the impedance response variable, i.e., the model is adequate at the 95% confidence level (Table 5).
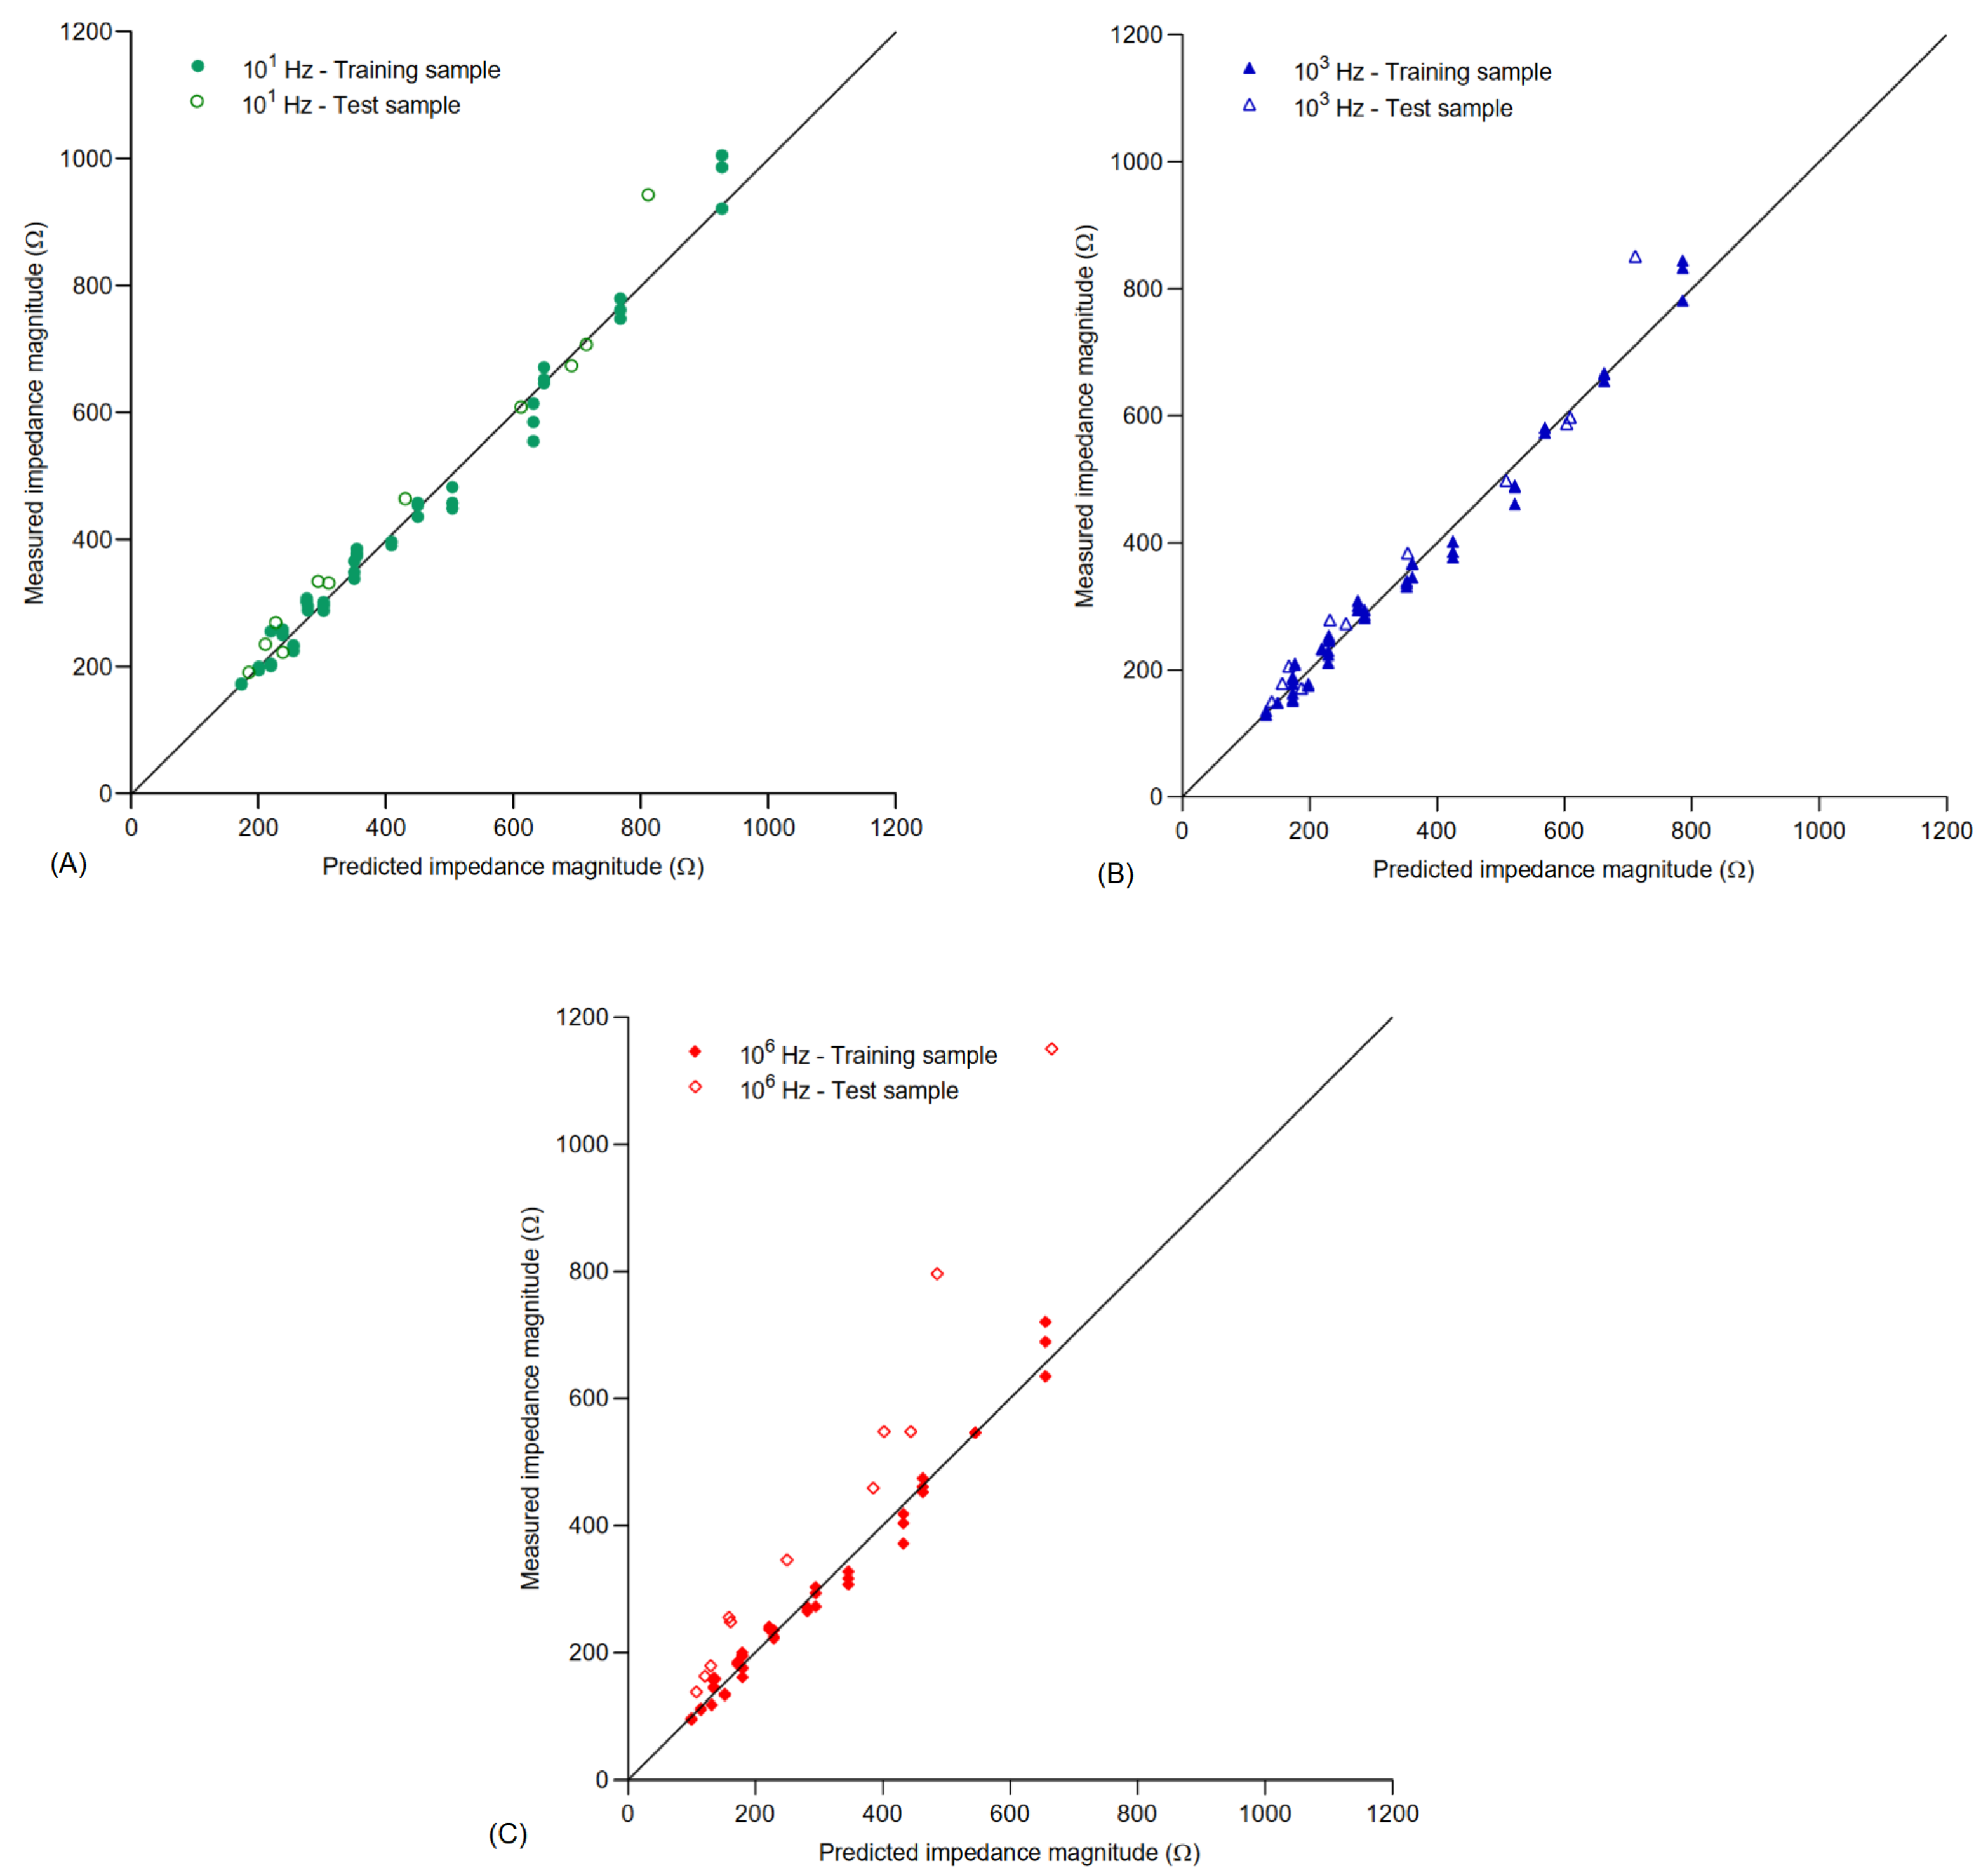
Figure 12A–C show the relationship between the measured impedance values and the values predicted by the proposed models, considering the frequencies 10 1 , 10 3 , and 10 6 Hz, for the samples in the simulation of the fraudulent addition of distilled water. Also, to extend the validation of the model, samples were analysed at random temperatures (between 16 and 37 ° C ) and frequency variation. It is observed that the measured impedance values compare adequately with the predicted values in all situations. Therefore, the model provides a valid description of the data used to generate them. Also, because of the similarity between the measured and predicted impedance values, the model obtained can be used directly to estimate the percentage of water in adulterated milk samples. However, despite the good results, we consider it important to test the model at other temperatures, close to 4 ° C because, according to current legislation, this is the temperature at which the product is stored and transported between the farm and the processing plants.

4. Conclusions

Techniques capable of detecting milk fraud are of great interest not only for economic reasons but mainly for health purposes. Therefore, the bioimpedance technique, based on resistance to electrical conductivity, should be improved and explored as an alternative in detecting fraud involving compounds that modify the electrical properties of milk. It should also be noted that temperature is a variable that directly influences impedance measurements and should be considered for a more reliable analysis and in the construction of mathematical models. In this context, electrical bioimpedance emerges as a promising technology for the food sector, particularly for dairy products, such as detecting milk adulteration, monitoring milk quality during storage and transportation, and evaluating the nutritional composition of dairy products. Compared to other analytical technologies, bioimpedance offers significant advantages, including being faster and having lower operational costs, the ability to perform real-time and on-site analyses, and producing accurate and reliable results. Additionally, it presents an attractive cost–benefit ratio for the production chain, not requiring highly skilled labour for its operation. It can be used by both producers and regulatory agents, making it an accessible and practical technique. Bioimpedance is also distinguished by its lower environmental impact, being more environmentally friendly as it does not require the use of reagents for analysis. Case studies have demonstrated its effectiveness in various applications, and the technology complies with regulatory standards to ensure food safety and quality. This technology has the potential to promote a more technical and less empirical approach to livestock farming, increasing predictability, reducing losses, and ensuring preventive animal health. Consequently, it contributes to improving the quality of products and processes, and promotes environmental sustainability. Future developments in the technology may lead to advancements in analysis accuracy and new applications, further establishing bioimpedance as a valuable tool in the food sector. In this context, the present research constitutes a pilot project for developing a portable bioimpedance device with unique configurations aimed at food analysis.

Author Contributions

Conceptualisation: W.d.C.O. and R.W.P.; methodology: W.d.C.O., R.W.P., A.M.G., R.H.N. and L.C.A.; validation, W.d.C.O., A.M.G., R.H.N., L.C.A. and C.W.C.; formal analysis, W.d.C.O., A.M.G., H.M.H. and M.B.P.P.O.; investigation, W.d.C.O., R.W.P., A.M.G., R.H.N., L.C.A. and C.W.C.; writing—original draft preparation, W.d.C.O. and R.W.P.; writing—review and editing, W.d.C.O., R.W.P., H.M.H. and M.B.P.P.O.; funding acquisition: W.d.C.O. All authors have read and agreed to the published version of the manuscript.

Funding

This work was supported by Sul-rio-grandense Federal Institute of Education, Science and Technology Pro-Dean of Research, Innovation and Postgraduate Studies (PROPESP-IFSUL), project no. PE01191019/125 and PE01191019/127, and the National Council for Scientific and Technological Development (CNPq). This work has been also supported by FAPERGS—Fundação de Amparo à Pesquisa do Estado do Rio Grande do Sul, project no. 24/2551-0000610-9.

Institutional Review Board Statement

Not applicable.

Informed Consent Statement

Not applicable.

Data Availability Statement

The data supporting the findings of this study are available upon request from the corresponding author, Dr. Wemerson de Castro Oliveira ([email protected]). Data is not publicly available due to privacy restrictions. However, abstracts or de-identified datasets may be made available upon request to the corresponding author.

Conflicts of Interest

The authors declare no conflicts of interest. The funders had no role in the design of the study; in the collection, analyses, or interpretation of data; in the writing of the manuscript or in the decision to publish the results.

References

  1. IBGE. IBGE Indicators: Livestock Production Statistics; Technical report; IBGE: Rio de Janeiro, Brazil, 2020.
  2. EMBRAPA. Milk Yearbook 2018: Indicators, Trends and Opportunities for Those Living in the Dairy Sector; Technical Report; EMBRAPA: São Paulo, Brazil, 2018. [Google Scholar]
  3. Bertolini, A.B.; Rossi, G.A.M. Physical-chemical analysis and fraud detection in heat-treated milk processed by ultra-high temperature (UAT) sold in the Midwest Region of the State of São Paulo. J. Hyg. Anim. Sanity 2017, 11, 374–381. [Google Scholar] [CrossRef]
  4. Oliveira, K.B.; Kobori, C.N.; Ubaldo, J.C.S.R. Assessment of physico-chemical quality, labelling and occurrence of adulteration in UHT milk samples. Dairy Inst. Mag. Cândido Tostes 2019, 74, 195–206. [Google Scholar]
  5. Cunha, M.F. Review: UHT Milk and the Gelatinization Phenomenon. Food Process. Res. Cent. Bull. 2001, 19, 341–352. [Google Scholar]
  6. Gennari, A.; Grave, E.; Wagner, E.; Mallmann, G.; Souza, C.F.V. Physical-Chemical and Microbiological Evaluation of Milk During Processing. Mag. Acad. Highlights 2014, 6, 91–95. [Google Scholar]
  7. Behmer, M.L.A. Milk Technology: Production, Industrialization and Analysis.; Nobel: São Paulo, Brazil, 1984. [Google Scholar]
  8. Brito, M.A.; Brito, J.R.; Arcuri, E.; Lange, C.; Silva, M.; Souza, G. Composition; Technical report; Brazilian Agricultural Research Corporation: Brasilia, Brazil, 2007. [Google Scholar]
  9. Abrantes, M.R.; Campêlo, C.S.; Silva, J.B.A. Milk fraud: Methods of detection and implications for the consumer. Adolfo Lutz Inst. Mag. 2014, 73, 244–251. [Google Scholar]
  10. MAPA. Normative Instruction No. 30. Officializes the Manual of Official Methods for Analysis of Food of Animal Origin; Technical report; MAPA: Brasília, Brazil, 2018. [Google Scholar]
  11. Pinheiro, L.A.F. Detection of Fraud in Milk with Water by Volumetric Thermal Capacity. Master’s Thesis, Faculty of Pharmacy and Biochemistry of Federal University of Juiz de Fora, Juiz de Fora, MG, Brazil, 2015. [Google Scholar]
  12. Wanderley, C.H.; Silva, A.C.O.; Silva, F.E.R.; Márcio, E.T.; Junior, C.A.C. Evaluation of the sensitivity of analytical methods for checking fluid milk fraud. Life Sci. J. 2012, 32, 34–42. [Google Scholar]
  13. BRASIL. Normativa nº 68, de 12 de Dezembro de 2006. Oficializa os Métodos Analíticos Oficiais Físico-Químicos, Para Controle de Leite e Produtos Lácteos; Techreport 68; Diario Oficial da Uniao: Brasilia, Brazil, 2006. [Google Scholar]
  14. Andrade, J.; Pereira, C.G.; de Almeida Junior, J.C.; Viana, C.C.R.; de Oliveira Neves, L.N.; da Silva, P.H.F.; Bell, M.J.V.; de Carvalho dos Anjos, V. FTIR-ATR determination of protein content to evaluate whey protein concentrate adulteration. LWT 2019, 99, 166–172. [Google Scholar] [CrossRef]
  15. Fagnani, R. The Main Frauds in Milk; Techreport; Milkpoint: Piracicaba, Brazil, 2016. [Google Scholar]
  16. Lopes, A.M.; Machado, J.A.T.; Ramalho, E.; Silva, V. Milk characterization using electrical impedance spectroscopy and fractional models. Food Anal. Methods 2018, 11, 901–912. [Google Scholar] [CrossRef]
  17. Schumacher, L.L.; Viégas, J.; Naetzold, S.; Tonin, T.J.; Rocha, L.; Cauduro, L.; Moro, A.B.; Robalo, S.S. Use of electrical bioimpedance analysis to evaluate the quality of bovine raw milk. S. Afr. J. Anim. Sci. 2019, 49, 727–734. [Google Scholar] [CrossRef]
  18. Nascimento, W.L.; Anjos, L.; Bell, V.; José, M. Mathematical models for correlating electrical parameters and milk adulterants. QUARKS Braz. Electron. J. Phys. Chem. Mater. Sci. 2020, 2, 27–33. [Google Scholar] [CrossRef]
  19. Santos, M.M., Jr. Identification of Bovine Milk Adulteration by the Wave Propagation Method in Medium Material Using Piezoelectric Diaphragms. Master’s Thesis, Faculty of Electrical Engineering of Paulista State University, Bauru, SP, Brazil, 2019. [Google Scholar]
  20. Bakr, A.A.; Radwan, A.G.; Madian, A.H.; Elwakil, A.S. Aging effect on apples bio-impedance using AD5933. In Proceedings of the 3rd International Conference on Advances in Computational Tools for Engineering Applications (ACTEA), Beirut, Lebanon, 3–5 July 2019; pp. 158–161. [Google Scholar]
  21. Freeborn, T.J.; Elwakil, A.S.; Maundy, B. Variability of Cole-model bioimpedance parameters using magnitude-only measurements of apples from a two-electrode configuration. Int. J. Food Prop. 2017, 20, 507–509. [Google Scholar] [CrossRef]
  22. Khaled, D.E.; Castellano, N.N.; Gazquez, J.A.; Garcia, S.R.M.; Manzano-Agugliaro, F. Cleaner quality control system using bioimpedance methods: A review for fruits and vegetables. J. Clean. Prod. 2017, 140, 1749–1762. [Google Scholar] [CrossRef]
  23. Al-Ali, A.A.; Elwakil, A.S.; Maundy, B.J. Bio-impedance Measurements with Phase Extraction using the Kramers-Kronig transform: Application to Strawberry Aging. In Proceedings of the IEEE 61st International Midwest Symposium on Circuits and Systems (MWSCAS), Windsor, ON, Canada, 5–8 August 2018; pp. 468–471. [Google Scholar]
  24. BRASIL. Manual de Métodos Oficiais Para Análise de Alimentos de Origem Animal; Techreport; MAPA: Brasilia, Brazil, 2007. [Google Scholar]
  25. Geller, A.M.; Ayres, L.; Carvalho, C.W.; Neuenfeld, R.H.; Oliveira, W.C. Ciência, Tecnologia e Inovação: Do Campo à Mesa; Chapter Escaneamento por Bioimpedância em Leite: Explorando a Técnica; IIDV: Recife, Brazil, 2020; Volume 1, pp. 653–674. [Google Scholar]
  26. Hui, G.; Ying, Y. Quantitative rapid analysis method for ofloxacin in raw milk based on molecule-specific recognition and electrochemical impedance spectrum. Trans. ASABE 2017, 60, 1439–1443. [Google Scholar] [CrossRef]
  27. Moro, L.C.; Porto, R.W. Single frequency electrical impedance tomography system with offline reconstruction algorithm. In Proceedings of the IEEE 6th Latin American Symposium on Circuits and Systems (LASCAS), Montevideo, Uruguay, 25–27 February 2015; pp. 1–4. [Google Scholar]
  28. Bertemes-Filho, P.; Valicheski, R.; Pereira, R.M.; Paterno, A.S. Bioelectrical impedance analysis for bovine milk: Preliminary results. In Proceedings of the International Conference on Electrical Bioimpedance, Gainesville, FL, USA, 4–8 April 2018; pp. 1–4. [Google Scholar]
  29. Veiga, E.A.; Bertemes-Filho, P. Bioelectrical impedance analysis of bovine milk fat. In Proceedings of the First Latin-American Conference on Bioimpedance (CLABIO), Joinville, Brazil, 6–9 November 2012; pp. 1–5. [Google Scholar]
  30. Mabrook, M.F.; Petty, M.C. Effect of composition on the electrical conductance of milk. J. Food Eng. 2003, 60, 321–325. [Google Scholar] [CrossRef]
  31. Doebelin, E.O. Measurement Systems: Application and Design; McGraw-Hill: New York, NY, USA, 2004. [Google Scholar]
  32. Hua, P.; Webster, J.G.; Tompkins, W.J. Effect of the measurement method on noise handling and image quality of EIT imaging. In Proceedings of the 9th International Conference of the IEEE Engineering in Medicine and Biology Society, New Orleans, LA, USA, 4–7 November 1987; pp. 1429–1430. [Google Scholar]
  33. Bera, T.K.; Nagaraju, J. Studying the resistivity imaging of chicken tissue phantoms with different current patterns in Electrical Impedance Tomography (EIT). Measurement 2012, 45, 663–682. [Google Scholar] [CrossRef]
  34. Tarabi, N.; Mousazadeh, H.; Jafari, A.; Taghizadeh-Tameh, J.; Kiapey, A. Experimental evaluation of some current injection-voltage reading patterns in electrical impedance tomography (EIT) and comparison to simulation results - Case study: Large scales. Flow Meas. Instrum. 2022, 83, 102087. [Google Scholar] [CrossRef]
  35. Martinsen, O.G.; Grimnes, S. Bioimpedance and Bioelectricity Basics; Academic Press: London, UK, 2008. [Google Scholar]
  36. Geddes, L.A.; Baker, L.E. Principles of Applied Biomedical Instrumentation; Wiley-Interscience: New York, NY, USA, 1991. [Google Scholar]
  37. Montgomery, D.C.; Peck, E.A.; Vinning, G.G. Introduction to Linear Regression Analysis; John Wiley and Sons: Hoboken, NJ, USA, 2015. [Google Scholar]
  38. Caldeira, L.A.; Rocha, V.R.; Fonseca, C.M.; Melo, L.M.; Cruz, A.G.; Oliveira, L.L.S. Characterization of milk commercialized in Janaúba-MG. Aliment. E Nutr. 2010, 21, 191–195. [Google Scholar]
  39. Kartheek, M.; Smith, A.A.; Muthu, A.K.; Manavalan, R. Determination of adulterants in food: A review. J. Chem. Pharm. Res. 2011, 3, 629–636. [Google Scholar]
  40. Mareze, J.; Marioto, L.R.M.; Gonzaga, N.; Tamanini, G.C.D.R.; Beloti, V. Detection of adulteration of pasteurised milk by official tests. Semin. Biol. Health Sci. 2015, 36, 283–290. [Google Scholar]
  41. Rosa, L.S.; Garbin, C.M.; Zamboni, L.; Bonacina, S.M. Evaluation of the physicochemical quality of ultra pasteurised milk marketed in the municipality of Erechim-RS. Health Surveill. Discuss. 2015, 3, 99–107. [Google Scholar]
  42. Oshima, M. Empirical formula for correcting electrical conductivity values of milk in relation to temperature. Jpn. J. Zootech. Sci. 1978, 49, 180–188. [Google Scholar]
  43. Das, S.; Sivaramakrishna, M.; Biswas, K.; Goswami, B. A low cost instrumentation system to analyze different types of milk adulteration. ISA Trans. 2015, 56, 268–275. [Google Scholar] [CrossRef]
  44. Tripathy, S.; Ghole, A.R.; Deep, K.; Vanjari, S.R.K.; Singh, S.G. A comprehensive approach for milk adulteration detection using inherent bio-physical properties as ‘Universal Markers’: Towards a miniaturized adulteration detection platform. Food Chem. 2017, 217, 756–765. [Google Scholar] [CrossRef] [PubMed]
  45. Durante, G.; Becari, W.; Lima, F.A.S.; Peres, E.M. Electrical impedance sensor for real-time detection of bovine milk adulteration. IEEE Sens. J. 2016, 16, 861–865. [Google Scholar] [CrossRef]
  46. Sude, M.; Ghodinde, K. Electrical impedance sensor for real-time detection of urea and starch in milk. In Proceedings of the 3rd International Conference on Trends in Electronics and Informatics (ICOEI), Tirunelveli, India, 23–25 April 2019; pp. 431–434. [Google Scholar]
  47. Bahçeci, K.S.; Acar, J. Modeling the combined effects of pH, temperature and ascorbic acid concentration on the heat resistance of Alicyclobacillus acidoterrestis. Int. J. Food Microbiol. 2007, 120, 266–273. [Google Scholar] [CrossRef] [PubMed]
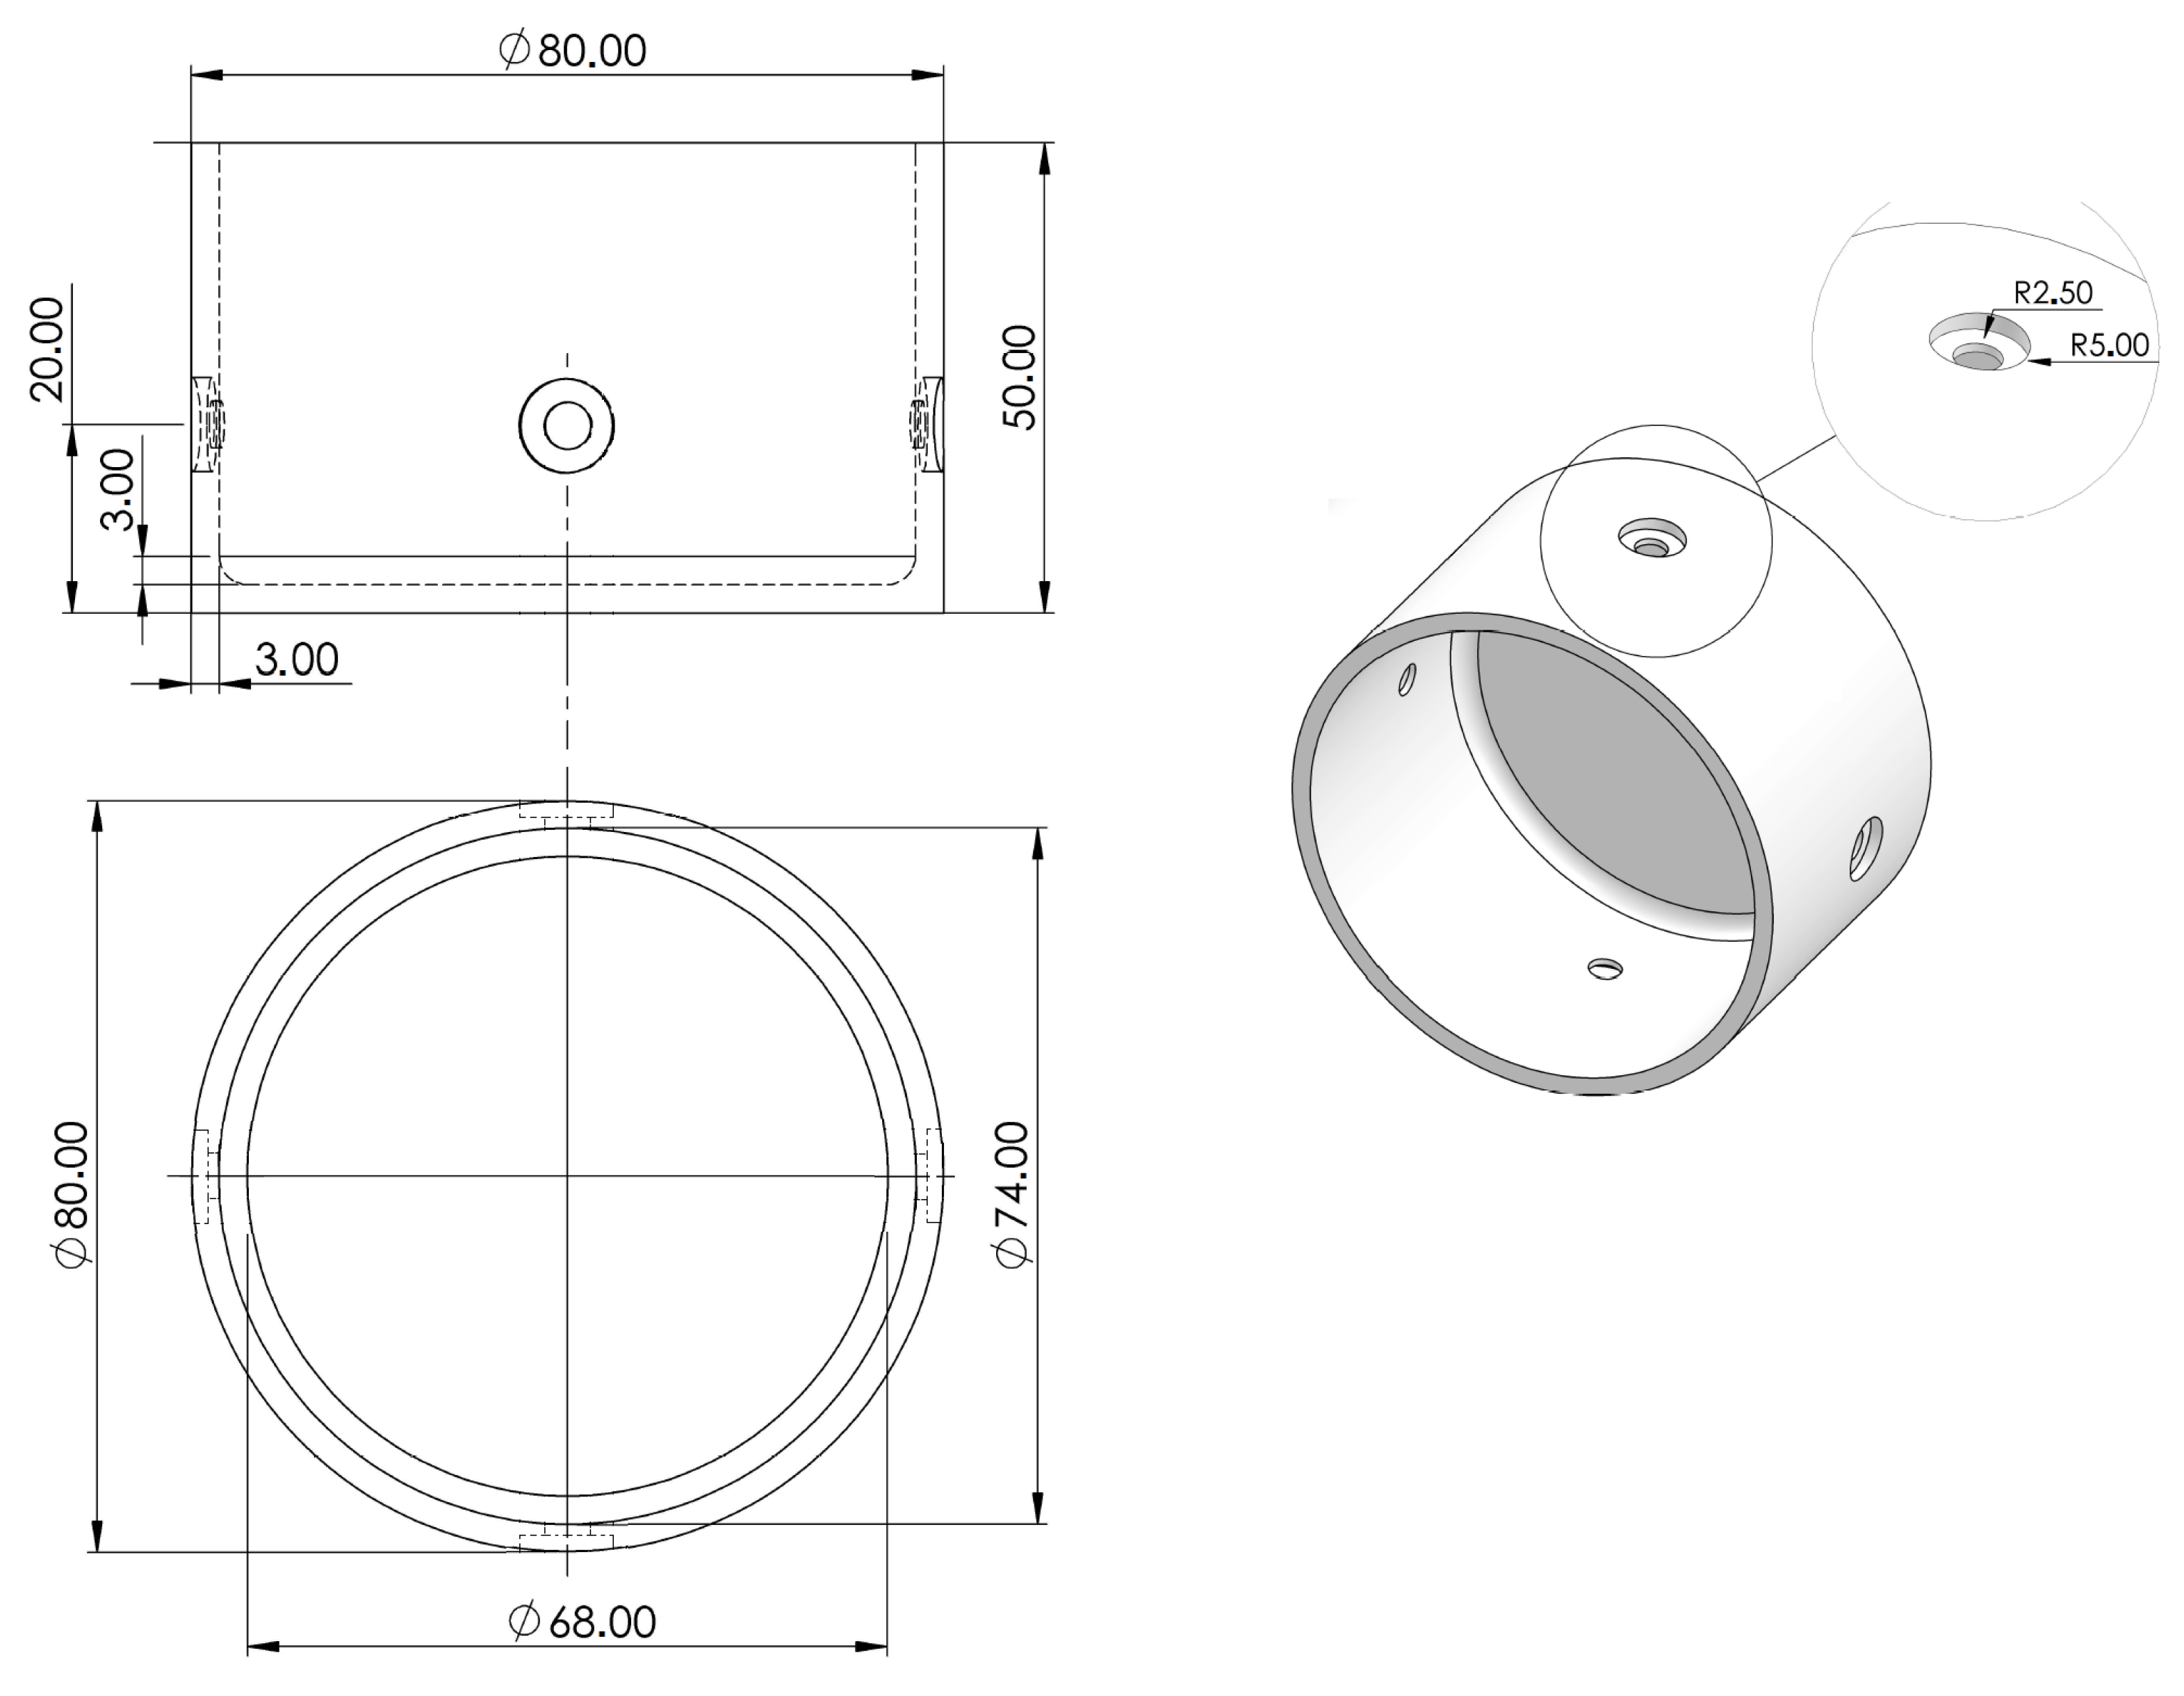
Figure 1. Cylindrical container design specifications.
Applsci 14 08026 g001
Figure 2. Proposed bioimpedance measurement method.
Applsci 14 08026 g002
Figure 3. Equivalent electrical circuit of the proposed bioimpedance measurement method.
Applsci 14 08026 g003
Figure 4. Impedance measurements in distilled water at different frequencies and three temperature levels.
Applsci 14 08026 g004
Figure 5. Impedance measurements in saline solution at different concentrations and frequencies. The 100% NaCl solution corresponds to a concentration of 2 mol · L 1 . (A) Impedance magnitude concerning frequency, and (B) Impedance magnitude concerning molar concentration. (C) Impedance phase concerning frequency, and (D) Impedance phase concerning molar concentration.
Applsci 14 08026 g005
Figure 6. (A) Experimental setup used to evaluate the equipotential lines. (B) Detailed view of the copper electrode.
Applsci 14 08026 g006
Figure 7. Representation of the equipotential lines in 2 mol · L 1 saline solution at a frequency of 10 6 Hz and concentrations of (A) 100% and (B) 12.5%; the black points indicate the measurement electrode locations and the rectangles at the opposite borders are the current injection electrodes.
Applsci 14 08026 g007
Figure 8. Adulterated milk impedance measurements at 16 ° C . Frequency response is shown in (A,B). The effect of water dilution on the complex impedance is emphasised in (C,D).
Applsci 14 08026 g008
Figure 9. Adulterated milk impedance measurements at 28 ° C . Frequency response is shown in (A,B). The effect of water dilution on the complex impedance is emphasised in (C,D).
Applsci 14 08026 g009
Figure 10. Adulterated milk impedance measurements at 37 ° C . Frequency response is shown in (A,B). The effect of water dilution on the complex impedance is emphasised in (C,D).
Applsci 14 08026 g010
Figure 11. Regression surfaces considering the frequencies (A) 10 1 Hz, (B) 10 3 Hz, and (C) 10 6 Hz.
Applsci 14 08026 g011
Figure 12. Measured impedance values to predict impedance values using the proposed mathematical modelling and measured test frequencies: (A) 10 1 , (B) 10 3 , and (C) 10 6 Hz. The straight line represents the ideal relation between the measured impedance and the respective impedance value predicted by the proposed mathematical models.
Applsci 14 08026 g012
Table 1. Impedance magnitude and phase values measured at 16 ° C for the different dilutions with distilled water in milk (% V/V) and unadulterated milk (0%).
Percentage of Water in Milk
0.0%25%50%75%97.9%
f (Hz) | Z | ( Ω ) θ | Z | ( Ω ) θ | Z | ( Ω ) θ | Z | ( Ω ) θ | Z | ( Ω ) θ
10 1 254.5 ± 4.4 18.0 ± 1.0 295.0 ± 6.6 17.0 ± 0.0 379.0 ± 5.7 16.0 ± 0.0 584.4 ± 29.7 14.8 ± 0.8 3211.9 ± 145.8 8.2 ± 0.3
10 2 214.8 ± 12.2 14.8 ± 0.3 261.4 ± 10.8 13.9 ± 0.6 338.9 ± 7.7 12.6 ± 0.2 534.3 ± 21.9 10.5 ± 0.5 2989.7 ± 132.0 4.6 ± 0.5
10 3 183.7 ± 5.4 6.7 ± 1.0 221.2 ± 9.4 8.0 ± 1.5 300.8 ± 7.1 8.8 ± 0.4 479.1 ± 16.1 7.3 ± 0.6 2849.1 ± 97.0 2.0 ± 1.8
10 4 169.4 ± 3.0 6.0 ± 1.3 199.6 ± 6.5 5.7 ± 0.6 269.2 ± 5.0 4.7 ± 0.3 439.0 ± 19.3 4.8 ± 0.3 2759.8 ± 96.1 2.1 ± 0.8
10 5 155.4 ± 1.9 2.4 ± 0.6 181.8 ± 8.3 2.7 ± 0.8 250.7 ± 4.4 1.8 ± 0.3 417.1 ± 18.8 1.5 ± 1.5 2681.0 ± 106.1 6.1 ± 1.6
10 6 146.9 ± 1.9 1.7 ± 0.8 172.0 ± 8.3 0.8 ± 0.8 239.1 ± 2.0 0.3 ± 1.3 398.9 ± 23.9 3.0 ± 1.5 1933.9 ± 262.7 39.0 ± 3.7
2.3 × 10 6 145.5 ± 2.0 6.7 ± 1.1 171.0 ± 10.0 5.7 ± 0.8 235.5 ± 4.5 2.8 ± 1.9 380.0 ± 34.3 4.2 ± 2.3 1077.1 ± 209.6 51.7 ± 1.8
Table 2. Impedance magnitude and phase values measured at 28 ° C for the different dilutions with distilled water in milk (% V/V) and unadulterated milk (0%).
Percentage of Water in Milk
0.0%25%50%75%97.9%
f (Hz) | Z | ( Ω ) θ | Z | ( Ω ) θ | Z | ( Ω ) θ | Z | ( Ω ) θ | Z | ( Ω ) θ
10 1 197.3 ± 2.7 19.3 ± 0.6 230.0 ± 4.8 19.2 ± 0.8 290.5 ± 3.8 17.8 ± 0.3 462.9 ± 17.4 16.0 ± 2.0 2400.2 ± 35.4 8.2 ± 0.8
10 2 170.3 ± 2.3 15.5 ± 1.3 193.2 ± 3.4 15.0 ± 0.0 256.1 ± 9.0 13.8 ± 0.3 417.7 ± 29.2 11.7 ± 1.0 2244.5 ± 37.8 4.3 ± 0.6
10 3 149.0 ± 0.7 6.5 ± 2.2 175.2 ± 1.7 6.7 ± 0.3 231.7 ± 1.3 6.8 ± 1.6 387.8 ± 12.5 4.3 ± 1.5 2162.5 ± 21.7 3.0 ± 1.0
10 4 135.6 ± 1.6 5.7 ± 0.6 162.0 ± 1.6 6.0 ± 0.5 216.5 ± 3.5 4.5 ± 0.9 363.5 ± 7.6 3.4 ± 0.3 2101.6 ± 25.2 2.7 ± 0.6
10 5 121.8 ± 0.0 4.0 ± 0.5 145.3 ± 1.0 3.8 ± 0.3 197.8 ± 0.7 3.2 ± 0.8 341.3 ± 8.3 2.7 ± 0.8 2011.5 ± 17.4 5.7 ± 0.3
10 6 112.3 ± 0.9 1.3 ± 0.3 134.8 ± 1.0 0.8 ± 0.3 184.3 ± 1.6 0.5 ± 0.5 318.1 ± 10.2 1.8 ± 0.8 1541.8 ± 25.2 32.0 ± 1.0
2.3 × 10 6 110.0 ± 0.5 7.5 ± 0.5 132.8 ± 0.1 6.8 ± 0.3 181.1 ± 0.5 5.2 ± 0.3 308.7 ± 5.8 0.3 ± 0.8 970.1 ± 9.2 45.2 ± 0.3
Table 3. Impedance magnitude and phase values measured at 37 ° C for the different dilutions with distilled water in milk (% V/V) and unadulterated milk (0%).
Percentage of Water in Milk
0.0%25%50%75%97.9%
f (Hz) | Z | ( Ω ) θ | Z | ( Ω ) θ | Z | ( Ω ) θ | Z | ( Ω ) θ | Z | ( Ω ) θ
10 1 172.9 ± 1.2 19.8 ± 1.8 202.5 ± 1.6 19.3 ± 0.6 255.8 ± 1.0 18.5 ± 0.5 392.7 ± 3.4 16.5 ± 0.9 2180.4 ± 139.3 8.3 ± 0.6
10 2 145.7 ± 3.4 14.8 ± 1.3 172.8 ± 6.4 14.3 ± 1.5 220.8 ± 6.2 12.5 ± 1.3 350.9 ± 3.9 10.3 ± 0.3 2037.8 ± 135.2 4.7 ± 0.3
10 3 132.5 ± 3.3 6.2 ± 2.0 156.1 ± 5.9 5.0 ± 1.3 208.2 ± 0.9 4.7 ± 1.7 335.2 ± 4.3 4.2 ± 0.3 1964.8 ± 97.8 1.7 ± 1.2
10 4 122.1 ± 1.0 4.2 ± 0.3 146.6 ± 2.3 5.2 ± 0.3 193.0 ± 2.5 4.0 ± 0.5 307.7 ± 11.7 3.3 ± 0.8 1872.3 ± 67.3 2.5 ± 1.3
10 5 108.7 ± 1.2 5.0 ± 0.5 131.5 ± 1.1 4.3 ± 0.8 173.6 ± 2.8 4.0 ± 0.0 291.2 ± 3.1 3.0 ± 0.5 1787.8 ± 57.8 5.5 ± 1.0
10 6 97.6 ± 1.2 1.3 ± 0.3 119.4 ± 0.5 0.5 ± 0.5 158.2 ± 2.5 0.2 ± 0.3 269.8 ± 3.3 1.5 ± 0.0 1427.7 ± 54.2 27.7 ± 4.6
2.3 × 10 6 96.5 ± 0.9 8.7 ± 0.3 117.4 ± 1.5 7.3 ± 0.3 156.8 ± 2.2 5.5 ± 0.0 260.6 ± 1.1 0.3 ± 1.6 967.9 ± 47.4 41.5 ± 2.6
Table 4. Angular coefficient (AC) values and R 2 of the lines considering the impedance magnitude of the frequency at the analysed temperatures.
DilutionTemperature
(%V/V)16  ° C 28  ° C 37  ° C
AC R 2 AC R 2 AC R 2
00.0−0.0250.32−0.0230.39−0.0200.42
25.0−0.0310.33−0.0240.38−0.0220.42
50.0−0.0360.35−0.0290.41−0.0220.58
62.5−0.0430.38−0.0340.43−0.0300.47
67.0−0.0470.40−0.0360.44−0.0320.50
75.0−0.0540.42−0.0420.47−0.0340.36
83.3−0.0790.51−0.0570.58−0.0530.57
87.5−0.1120.60−0.0800.62−0.0700.62
91.7−0.1860.74−0.1210.73−0.1020.68
93.8−0.2500.80−0.1940.83−0.1420.73
95.8−0.4110.88−0.2240.83−0.2170.83
97.9−0.8150.95−0.5400.94−0.4460.92
Table 5. Statistical parameters used to evaluate the effects of temperature and dilution on the bioimpedance of milk for different frequencies.
Frequency R 2 Adjus. R 2 RMSE
10 Hz0.99570.995015.0282
1 kHz0.99690.996511.2313
1 MHz0.99490.994112.2881
Disclaimer/Publisher’s Note: The statements, opinions and data contained in all publications are solely those of the individual author(s) and contributor(s) and not of MDPI and/or the editor(s). MDPI and/or the editor(s) disclaim responsibility for any injury to people or property resulting from any ideas, methods, instructions or products referred to in the content.